WO2021181675A1 - ガス検査管理システム、ガス検査管理方法、及びプログラム - Google Patents
ガス検査管理システム、ガス検査管理方法、及びプログラム Download PDFInfo
- Publication number
- WO2021181675A1 WO2021181675A1 PCT/JP2020/011176 JP2020011176W WO2021181675A1 WO 2021181675 A1 WO2021181675 A1 WO 2021181675A1 JP 2020011176 W JP2020011176 W JP 2020011176W WO 2021181675 A1 WO2021181675 A1 WO 2021181675A1
- Authority
- WO
- WIPO (PCT)
- Prior art keywords
- inspection
- information
- image
- target
- gas
- Prior art date
- Legal status (The legal status is an assumption and is not a legal conclusion. Google has not performed a legal analysis and makes no representation as to the accuracy of the status listed.)
- Ceased
Links
Images






Classifications
-
- G—PHYSICS
- G01—MEASURING; TESTING
- G01M—TESTING STATIC OR DYNAMIC BALANCE OF MACHINES OR STRUCTURES; TESTING OF STRUCTURES OR APPARATUS, NOT OTHERWISE PROVIDED FOR
- G01M3/00—Investigating fluid-tightness of structures
- G01M3/02—Investigating fluid-tightness of structures by using fluid or vacuum
- G01M3/04—Investigating fluid-tightness of structures by using fluid or vacuum by detecting the presence of fluid at the leakage point
- G01M3/16—Investigating fluid-tightness of structures by using fluid or vacuum by detecting the presence of fluid at the leakage point using electric detection means
- G01M3/18—Investigating fluid-tightness of structures by using fluid or vacuum by detecting the presence of fluid at the leakage point using electric detection means for pipes, cables or tubes; for pipe joints or seals; for valves; for welds; for containers, e.g. radiators
-
- G—PHYSICS
- G01—MEASURING; TESTING
- G01M—TESTING STATIC OR DYNAMIC BALANCE OF MACHINES OR STRUCTURES; TESTING OF STRUCTURES OR APPARATUS, NOT OTHERWISE PROVIDED FOR
- G01M3/00—Investigating fluid-tightness of structures
- G01M3/38—Investigating fluid-tightness of structures by using light
-
- G—PHYSICS
- G06—COMPUTING OR CALCULATING; COUNTING
- G06Q—INFORMATION AND COMMUNICATION TECHNOLOGY [ICT] SPECIALLY ADAPTED FOR ADMINISTRATIVE, COMMERCIAL, FINANCIAL, MANAGERIAL OR SUPERVISORY PURPOSES; SYSTEMS OR METHODS SPECIALLY ADAPTED FOR ADMINISTRATIVE, COMMERCIAL, FINANCIAL, MANAGERIAL OR SUPERVISORY PURPOSES, NOT OTHERWISE PROVIDED FOR
- G06Q10/00—Administration; Management
-
- G—PHYSICS
- G06—COMPUTING OR CALCULATING; COUNTING
- G06Q—INFORMATION AND COMMUNICATION TECHNOLOGY [ICT] SPECIALLY ADAPTED FOR ADMINISTRATIVE, COMMERCIAL, FINANCIAL, MANAGERIAL OR SUPERVISORY PURPOSES; SYSTEMS OR METHODS SPECIALLY ADAPTED FOR ADMINISTRATIVE, COMMERCIAL, FINANCIAL, MANAGERIAL OR SUPERVISORY PURPOSES, NOT OTHERWISE PROVIDED FOR
- G06Q50/00—Information and communication technology [ICT] specially adapted for implementation of business processes of specific business sectors, e.g. utilities or tourism
- G06Q50/06—Energy or water supply
Definitions
- This disclosure relates to a gas inspection management system, a gas inspection management method, and a program for managing gas leak inspection results in equipment that uses gas.
- Gas equipment Equipment that uses gas (hereinafter sometimes referred to as "gas equipment"), such as production facilities that produce natural gas and oil, production plants that produce chemical products using gas, and gas transmission equipment, has traditionally been used. , Workers regularly patrol the equipment to inspect for gas leaks, repair any gas leaks found, and perform patrol inspections to check for gas leaks again.
- the gas leak inspection can be performed by using an optical gas leak detection method for detecting a gas leak in the inspection region by taking an infrared moving image using the infrared absorption characteristic of the gas (for example, Patent Document 1, Patent Document 1, 2).
- the gas detection method using infrared moving images has the advantage that the release state such as gas flow and the leak position can be easily detected because the gas can be visualized by the image.
- the state of the leaked gas is recorded as an image, there is an advantage that it can be used as evidence of the occurrence of gas leak and its repair.
- Patent Document 3 the inspection target on the inspection route in the circulation inspection is displayed as an icon and transmitted to the gas leak inspector, and the obtained inspection image is related to the information related to the inspection target.
- a method for collecting gas leak data stored in a database is disclosed.
- gas leak inspection image data is saved in association with inspection information, and these are saved. There is a need for a gas inspection management method that is easy to use for equipment safety management.
- This disclosure has been made in view of the above problems, and by displaying the inspection image of the gas leak inspection and the information on the inspection result of the inspection target in association with each other, the state of the occurrence and repair of the gas leak in the gas facility can be displayed. It is an object of the present invention to provide a gas inspection management system, a gas inspection management method, and a program that can be displayed in an easy-to-understand manner.
- the gas inspection management system accepts an inspection information database that stores inspection results and link information to inspection images for a plurality of inspection targets, and an input of a browsing request and a condition specification from an administrator. Based on the browsing condition input unit and the browsing request, a part or all of a plurality of inspection targets is selected from the inspection information database, and for the selected inspection target, information on the inspection result and link information to the inspection image.
- An inspection information acquisition unit for acquiring the above
- a display image generation unit for generating a display image including information on the inspection result and link information to the inspection image for the selected inspection target, and a display for displaying the display image. It is characterized by having a part.
- the gas inspection management method, and the program by displaying the information on the inspection result to be inspected and the inspection image in association with each other, the occurrence of gas leakage in the gas equipment or the occurrence of gas leakage
- the repair status can be displayed in an easy-to-understand manner.
- the manager of the gas facility can accurately grasp the state of the gas leak in the gas facility.
- FIG. 1 It is a schematic block diagram of the gas inspection management system 1 which concerns on embodiment. It is a figure which shows the structure of the inspection terminal.
- (A) to (c) are diagrams showing an example of inspection condition information, inspection result information, and inspection image link information transmitted from an inspection terminal. It is a figure which shows the structure of a server apparatus.
- (A) to (c) are diagrams showing an example of the inspection condition information DB, the inspection result information DB, and the inspection image link information DB stored in the server device.
- (A) to (c) are diagrams showing an example of an inspection target position information DB, a map information DB, and an inspection route information DB stored in a server device. It is a figure which shows the structure of the monitoring terminal.
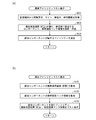
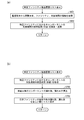
- FIG. 1 It is a figure which shows an example of the state identification information DB stored in a monitoring terminal. It is a sequence diagram which shows an example of the operation of a gas inspection management system 1. It is a figure which shows an example of the information stored in a server device based on the inspection condition information, inspection result information, and inspection image link information transmitted from an inspection terminal. It is a figure which shows an example of the information transmitted from a server device to a monitoring terminal based on the information of the browsing condition transmitted from the monitoring terminal. (A) and (b) show the process performed by the server device (step S6 in FIG. 9) and the process performed by the monitoring terminal (step S7 in FIG. 9) in the process of displaying the latest state of the facility on a map, respectively. It is a flowchart.
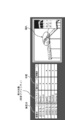
- A is another example of the image displayed on the monitoring terminal by the process of displaying the inspection history of all facilities on a map, and (b) is displayed on the monitoring terminal by the process of displaying the latest state of a specific facility on a map. It is another example of the image to be made.
- C is an example showing an inspection image displayed on the monitoring terminal when the icon of the component indicating "leakage" displayed on the map is specified.
- (A) and (b) are flowcharts showing a process performed by the server device (step S6 in FIG. 9) and a process performed by the monitoring terminal (step S7 in FIG.
- (A) is an example of an image displayed on the monitoring terminal by the process of displaying the abnormal facility as a map.
- (B) is an example of a display mode showing a plurality of inspection images displayed on the monitoring terminal when a plurality of icons corresponding to the plurality of abnormal facilities displayed on the map are instructed.
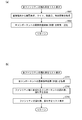
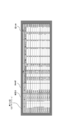
- (A) and (b) are flowcharts showing a process performed by the server device (step S6 in FIG. 9) and a process performed by the monitoring terminal (step S7 in FIG. 9) in the process of displaying the abnormal facilities in a list, respectively. be. This is an example of an image displayed on the monitoring terminal by the process of displaying a list of abnormal facilities.
- (A) and (b) show a process performed by the server device (step S6 in FIG. 9) and a process performed by the monitoring terminal (step S7 in FIG. 9) in the process of displaying the leakage rate of the facility in a list, respectively. It is a flowchart. This is an example of an image displayed on a monitoring terminal by a process of listing all facilities in order of leakage rate.
- (A) and (b) are the processes performed by the server device (step S6 in FIG. 9) and the processes performed by the monitoring terminal (step S7 in FIG. 9) in the process of displaying the inspection history of the specific facility in a list, respectively. It is a flowchart which shows.
- (A) and (b) are the processes performed by the server device (step S6 in FIG. 9) and the processes performed by the monitoring terminal (step S7 in FIG. 9) in the process of displaying the abnormality rate of the equipment in a list, respectively. It is a flowchart which shows. This is an example of an image displayed on a monitoring terminal by a process of displaying a list of equipment abnormality rates in descending order.
- (A) and (b) are the processes performed by the server device (step S6 in FIG. 9) and the processes performed by the monitoring terminal (step S7 in FIG. 9) in the process of displaying the inspection history in the equipment, respectively.
- Embodiment >> ⁇ Structure of gas inspection management system>
- the embodiment of the present disclosure is realized as a gas inspection management system 1 that collects and manages a gas leak inspection result of a gas facility and an inspection image.
- the gas inspection management system 1 according to the embodiment will be described in detail with reference to the drawings.
- FIG. 1 is a schematic configuration diagram of the gas inspection management system 1 according to the embodiment.
- the gas inspection management system 1 is composed of a server device 20 connected to a communication network N, a plurality of inspection terminals 10, an inspection image storage device 30, and a plurality of monitoring terminals 40.
- the communication network N is, for example, the Internet, and the server device 20, the inspection terminal 10, the inspection image storage device 30, and the monitoring terminal 40 are connected so that information can be exchanged with each other.
- the inspection terminal 10 is a dedicated terminal device used by an inspector who is an operator to inspect a gas leak in a gas facility.
- the inspection terminal 10 is realized as a client computer that realizes a function by executing a program by a CPU (Central Processing Unit), and is connected to a communication network N via a wireless base station.
- CPU Central Processing Unit
- one site includes multiple facilities (equipment), and each facility includes multiple equipment (equipment).
- the inspector acquires an infrared moving image consisting of a plurality of image frames for each equipment for a plurality of equipments included in the facility as an inspection image, and the gas to be inspected based on the inspection image.
- the presence or absence of leakage is evaluated and judged, and the obtained inspection image is transmitted to the inspection image storage device 30 via the communication network N and stored.
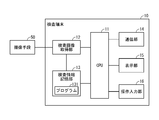
- FIG. 2 is a diagram showing the configuration of the inspection terminal 10.
- the inspection terminal 10 is a client computer including a CPU 11, an inspection image acquisition unit 12, an inspection information storage unit 13, a communication unit 14, a display unit 15, and an operation input unit 16.
- the CPU 11 realizes each function of the inspection terminal 10 by executing the program stored in the inspection information storage unit 13.
- the inspection image acquisition unit 12 is, for example, an interface circuit connected to an imaging means 50 including an infrared camera that detects and captures infrared rays, and acquires an inspection image that captures an inspection target. Images taken by an infrared camera are generally used for detecting hydrocarbon gases.
- the obtained inspection image is stored in the inspection information storage unit 13 as, for example, a video signal of 30 frames per second. After the inspection image is temporarily stored in the inspection information storage unit 13, it is transferred to the inspection image storage device 30 via the communication network N and stored based on the operation input to the operation input unit 16.
- the inspection information storage unit 13 is imaged by the inspection condition information indicating the inspection condition, the inspection result information indicating the inspection result, the inspection image link information, and the imaging means 50 input by the inspector via the operation input unit 16 described later. I remember the inspection image. Further, the inspection information storage unit 13 operates the inspection terminal 10 and detects a gas leak to be inspected from the inspection image, for example, a known optical gas leak detection method described in Patent Documents 1, 2, and the like. In addition to storing the program 131 and the like necessary for executing the above, it also has a function as a temporary storage area for temporarily storing the calculation result of the CPU 21. The CPU 11 realizes the function of the optical gas leak detection method by executing the program 131. Specifically, when the infrared image of the inspection target has a region in which the frequency component due to the hydrocarbon gas is absorbed, the region is mapped by converting the gas amount into color information, for example. It displays gas leaks.
- the inspection information storage unit 13 includes, for example, a volatile memory such as a DRAM and a non-volatile memory such as a hard disk.
- the inspection image corresponding to the inspection condition information is transmitted and stored.
- the communication unit 14 transmits / receives information to / from the server device 20.
- the display unit 15 is a display device such as a liquid crystal panel or an organic EL display, and displays a display screen generated by the CPU 11.
- the operation input unit 16 is an input device for inputting an inspector who is an operator to operate the inspection terminal 10.
- it is realized as an input device such as a touch panel in which a touch sensor is arranged on the front surface of the display unit 14.
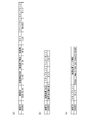
- the inspection condition information, the inspection result information, and the inspection image link information stored in the inspection information storage unit 13 will be described with reference to FIGS. 3A, 3B, and 3C.
- FIG. 3A is an example of inspection condition information.
- the inspection condition information is the inspector, the inspection target, the site, the facility, and the equipment, which are input to the operation input unit 16 when the inspector performs the gas leak inspection of the gas equipment.
- FIG. 3B is an example of inspection result information. As shown in FIG. 3B, the inspection result information is evaluated and judged by the inspector based on the inspection image corresponding to the inspection condition information, and the state of the gas leak to be inspected is input to the operation input unit 16. It consists of information on the inspection results shown and information on the components whose inspection results have been confirmed by the inspector.
- FIG. 3C is an example of inspection image link information.
- the inspection image link information relates to the link destination of the inspection image such as the URL (Uniform Resource Locator) of the inspection image storage device 30 to which the inspection image corresponding to the inspection condition information is transferred and saved. It consists of information and information about the equipment (device) captured in the inspection image.
- URL Uniform Resource Locator
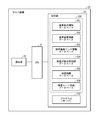
- FIG. 4 is a diagram showing the configuration of the server device 20.
- the server device 20 includes a CPU 21, a communication unit 22, and a storage unit 23, and is realized as a server computer that executes a program by the CPU 21.
- the CPU 11 realizes each function of the server device 20 by executing the program 237 stored in the storage unit 23. Specifically, the CPU 11 acquires the browsing request and the browsing condition from the administrator input from the browsing condition input unit 45 via the communication unit 22. Further, the CPU 11 selects a part or all of a plurality of inspection targets from the inspection information database 230 of the storage unit 23 based on the acquired browsing request and browsing conditions, and provides information on the inspection results of the selected inspection targets and inspections. It functions as an inspection information acquisition unit that acquires link information to images.
- the storage unit 23 has an inspection information database 230.
- the inspection information database 230 stores the inspection condition information database 231, the inspection result information database 232, the inspection image link information database 233, the inspection target position information database 234, the map information database 235, and the inspection route information database 236. Further, the storage unit 23 stores the program 237 necessary for the server device 20 to operate. It also has a function as a temporary storage area for temporarily storing the calculation result of the CPU 21.
- the storage unit 23 includes, for example, a volatile memory such as a DRAM (Dynamic Random Access Memory) and a non-volatile memory such as a hard disk.
- DRAM Dynamic Random Access Memory
- the communication unit 14 transmits / receives information to / from the inspection terminal 10 and the monitoring terminal 40.
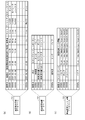
- FIGS. 5A to 5C are diagrams showing an example of the inspection condition information database 231, the inspection result information database 232, and the inspection image link information database 233 stored in the server device 20.
- an area for storing inspection condition information transmitted from the inspection terminal is transmitted to the inspection condition information database 231
- an area for storing inspection condition information transmitted from the inspection terminal is transmitted to the inspection result information database 232.
- the inspection image link information database 233 is provided with an area for storing the inspection result information, and an area for storing the inspection image link transmitted from the inspection terminal.
- 6 (a) to 6 (c) are diagrams showing an example of the inspection target position information database 234, the map information database 235, and the inspection route information database 236 stored in the server device 20.
- the inspection target position information database 234 stores an area for storing site, facility, information about equipment, and position information which is information indicating latitude / longitude, which is information for identifying equipment. Is provided and information is stored.
- the map information database 235 stores a site which is information for identifying the facility, information on the facility, and a map image corresponding to the position (latitude, longitude) where the facility exists.
- the map information database 235 may be provided with an area for storing the map image, and the map image corresponding to the position (latitude, longitude) where the facility exists may be stored.
- the inspection route information database 236 inspects the site which is the information for identifying the facility, the information about the facility, and each equipment to which the facility belongs when performing the patrol inspection of the facility. An area for storing the inspection route information regarding the order is provided, and the information is stored.
- the server device 20 can specify the inspection image link information, the map image, and the inspection route of the facility corresponding to the inspection condition, the inspection result, the facility or the equipment, based on the browsing request from the monitoring terminal 40.
- the inspection image storage device 30 is a storage device that stores inspection images transmitted from the inspection terminal 10, and includes, for example, a volatile memory such as a DRAM and a non-volatile memory such as a hard disk.
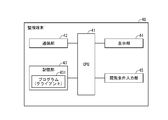
- FIG. 7 is a diagram showing the configuration of the monitoring terminal 40.
- the monitoring terminal 40 includes a CPU 41, a communication unit 42, a storage unit 43, a display unit 44, and a viewing condition input unit 45, and is realized as a client computer that executes a program by the CPU 41.
- the CPU 41 realizes each function of the monitoring terminal 40 by executing the program 431 stored in the storage unit 43. Specifically, the CPU 41 transmits the browsing request from the administrator input from the browsing condition input unit 45 and the browsing condition to the server device 20 or the inspection image storage device 30 via the communication unit 42. Further, the CPU 41 generates a display image including information on the inspection result and link information to the inspection image acquired from the inspection information database 230 or the inspection image storage device 30 of the server device 20 via the communication unit 42. Functions as a generator.
- the storage unit 43 stores the program 431 and the like required for the monitoring terminal 40 to operate, and also has a function as a temporary storage area for temporarily storing the calculation result of the CPU 41.
- the storage unit 43 includes, for example, a volatile memory such as a DRAM and a non-volatile memory such as a hard disk.
- the communication unit 42 transmits / receives information to / from the server device 20 and the inspection image storage device 30.
- the display unit 44 is, for example, a liquid crystal panel or the like, and displays a display screen generated by the CPU 41.
- the viewing condition input unit 45 is an input device for the operator of the monitoring terminal 40 to input for operating the monitoring terminal 40.
- it may be realized as one device having both a display device and an input device, such as an input device such as a keyboard, a mouse, and a trackball, or a touch panel having a touch sensor arranged on the front surface of the display unit 44.
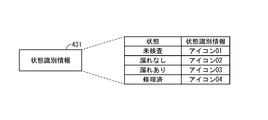
- FIG. 8 is a diagram showing an example of the state identification information database 431 stored in the monitoring terminal.
- the state identification information database 431 as state identification information for identifying the inspection result (state) of the facility or equipment, for example, it is displayed on the display unit 44 corresponding to the inspection result (state).
- An area for storing information indicating the icon images (icons 01 to 04) is provided, and the information is stored.
- An icon is displayed on the display unit 44 corresponding to the inspection result information corresponding to the facility or equipment obtained based on the browsing request from the monitoring terminal 40.
- FIG. 9 is a sequence diagram showing an example of the operation of the gas inspection management system 1.
- the inspector performs a gas leak inspection for each of a plurality of equipments included in the facility based on the inspection route information provided from the server device 20.
- steps S1 to S4 are steps in which the inspector performs a gas leak inspection of the gas equipment and uploads the information to the server.
- the inspection terminal 10 transmits inspection condition information (step S1).
- the inspection terminal 10 inspects the inspector, the site to be inspected, the facility, and the equipment from the inspector to the operation input unit 16.
- the information is transmitted to the server device 20 via the communication network N.
- the information set based on the clock means (not shown) included in the inspection terminal 10 is transmitted to the server device 20.
- the server device 20 stores the transmitted inspection condition information in the inspection condition information database 231.
- the inspection terminal 10 acquires and transmits an inspection image (step S2).
- the inspection terminal 10 sequentially acquires infrared moving images of the equipment to be inspected from the imaging means 50 for each frame, and temporarily stores them in the inspection information storage unit 13.
- the CPU 11 executes a program 131 related to the processing of the optical gas leak detection method
- the region is set to, for example, a gas.
- the amount is converted into color information, the color information is mapped, and the inspection information storage unit 13 stores the amount as an inspection image in place of the original image.
- the communication unit 14 transmits the inspection image in which the color information is mapped to the region where the gas component is detected to the inspection image storage device 30 via the communication network N.
- the inspection image storage device 30 saves the transmitted inspection image, and also transmits information about the link destination of the saved inspection image to the inspection terminal 10.
- the inspector evaluates the state of gas leakage in the inspection target by displaying an inspection image in which the color information is mapped in the region where the gas component is detected on the display unit 15 and observing the inspection image, and inspects the result.
- the result (state) is input to the operation input unit 16.
- the inspection terminal 10 transmits the inspection result information and the inspection image link information (step S3).
- the inspection terminal 10 inspects the information indicating the inspection result (state) of the inspection target and the information related to the component for which the inspection result (state) has been confirmed.
- the person accepts the input of the inspection result information to the operation input unit 16, and when the inspection result information is input, the input information is transmitted via the communication network N.
- the information input in step S1 and stored in the inspection information storage unit 13 is transmitted to the server device 20. Further, regarding the information regarding the link destination of the inspection image, the information acquired from the inspection image storage device 30 is transmitted to the server device 20 based on step 2.
- the server device 20 stores the transmitted inspection result information in the inspection result information database 232, and stores the inspection image link information in the inspection image link information database 233.
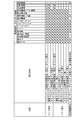
- FIG. 10 is a diagram showing an example of information stored in the server device 20 based on the inspection condition information, the inspection result information, and the inspection image transmission transmitted from the inspection terminal.
- the inspection condition information and the inspection result information are transmitted from the inspection terminal 10 to the server device 20
- the information shown in FIG. 10 is stored in the storage unit 23. Further, the inspection image is transmitted to the inspection image storage device 30 and stored.
- step S4 it is determined whether or not to end the inspection by the operation input from the inspector to the operation input unit 16 (step S4).
- the process returns to step S1, the processing for the next equipment is performed, and when the inspection is completed (in the case of Yes), the processing is terminated.
- the monitoring terminal 40 makes a browsing request to the server device 20 (step S5). Specifically, the monitoring terminal 40 receives a browsing request from the administrator to the browsing condition input unit 45 and input of the browsing condition information, and when the input is made, the information is transmitted to the server device 20 via the communication network N. Send.
- a browsing request as shown in FIG. 11, for example, a browsing request selected from three types of requests for map display, seven types of requests for list display, and one type of request for inspection image reproduction is selected. can do.
- the administrator further inputs the browsing condition information that conditions the selected browsing request, for example, the inspection date, the inspection target, the inspector, the inspection result (state), and the like in the browsing condition input unit 45.
- the server device 20 searches for inspection information based on the browsing request and browsing condition information (step S6), and transmits the obtained information to the monitoring terminal.
- FIG. 11 is a diagram showing an example of information transmitted from the server device 20 to the monitoring terminal 40 based on the viewing request and viewing condition information transmitted from the monitoring terminal.
- the server device 20 provides necessary information based on the browsing request and browsing condition information in the inspection condition information database 231, the inspection result information database 232, the inspection image link information database 233, the inspection target position information database 234, the map information database 235, and the like.
- the inspection route information database 236 is searched, and the obtained information is transmitted to the monitoring terminal 40.
- the specific processing in step S6 in response to the browsing request will be described later.
- the monitoring terminal 40 generates a display image based on the information obtained from the server device 20 and displays it on the display unit 44 (step S7).
- the specific mode of processing in step S7 in response to the browsing request will be described later.
- the monitoring terminal 40 requests an inspection image (step S8). Specifically, the monitoring terminal 40 receives the designation of the inspection image link information displayed on the display unit 44 as a display image from the administrator to the viewing condition input unit 45, and when the designation input is made, the inspection image link. Information is transmitted to the inspection image storage device 30 via the communication network N. The inspection image storage device 30 transmits the inspection image stored at the link destination indicated by the transmitted inspection image link information to the monitoring terminal 40. The specific mode of processing in step S8 in response to the browsing request will be described later.
- the monitoring terminal 40 displays the obtained display image on the display unit 44 (step S9).
- the manager confirms the state of gas leakage in the inspection target by observing the inspection image consisting of the infrared moving image in which the color information mapping is attached to the region where the gas component is detected, which is displayed on the display unit 44. be able to.
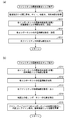
- FIG. 12A is a flowchart showing a process (step S6 in FIG. 9) performed by the server device 20.
- the server device 20 acquires information on the browsing request, the site, the inspection date, and the time from the monitoring terminal 40 (step S611).
- the server device 20 searches and transmits the latest inspection result (state) and inspection image link information of each component (step S612). Specifically, the server device 20 provides information on the latest inspection result (state) based on the inspection date and time for each component belonging to the designated site from the inspection condition information database 231 and the inspection result information database 232. The search is performed, and the inspection image link information is searched from the inspection image link information database 233. Then, the information about the facility and the component belonging to the site, the information about the latest inspection result (state) of the component, and the inspection image link information are transmitted to the monitoring terminal 40.
- the server device 20 searches the position information of each component from the inspection target position information database 234 and transmits the position information to the monitoring terminal 40 (step S613).
- the server device 20 searches the map information database 235 for map link information regarding the link destination of the map image of each component, transmits it to the monitoring terminal 40 (step S614), and ends the process.
- FIG. 12B is a flowchart showing a process (step S7 in FIG. 9) performed by the monitoring terminal 40.
- the monitoring terminal 40 acquires the latest inspection result (state) and inspection image link information of each component from the server device 20 (step S711). In addition, the position information of each component is acquired (step S712). Next, the monitoring terminal 40 acquires the map link information regarding the link destination of the map image of each facility from the server device 20, acquires the map image from the link destination, and displays it on the display unit 44 (step S713).
- the monitoring terminal 40 identifies the position of each component on the map (step S714), displays the state of one component as an icon for each facility, and superimposes the inspection image link information.
- the inspection results (states) are different for the plurality of components included in the facility, the inspection results (states) are selected based on the priority of "leakage” and "no leakage”.
- the icon image is selected from the state identification information database 431 and displayed as the inspection result (state) related to the facility.
- the inspection image link information corresponding to the selected inspection result (state) is superimposed on the icon image.
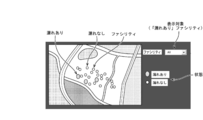
- FIG. 13 is an example of an image displayed on the monitoring terminal. As shown in FIG. 13, for all facilities, an icon image for identifying and displaying the inspection result (state) is displayed at the position of the component detected in the inspection result (state) on the map. In the display example shown in FIG. 13, the position of the component is generally displayed at the position of the facility to which the component belongs.
- the administrator can list the inspection results of the facility or equipment in a map format. Therefore, the manager of the gas facility can accurately grasp the distribution state of the facility where the gas leak occurs, and can effectively utilize it for efficient re-inspection and formulation of a repair plan.
- the inspection target is composed of a plurality of upper inspection targets and a plurality of lower inspection targets included in the upper inspection target.
- a facility is a lower inspection target for a higher inspection target site
- an equipment is a lower inspection target for a higher inspection target facility
- a component is a lower inspection target for a higher inspection target equipment.
- the inspection result of the upper inspection target includes the inspection result for each of the plurality of lower inspection targets, and when the inspection result is the inspection result of "leakage" in at least one lower inspection target included in the upper inspection target, the lower inspection result is inferior.
- a display image may be generated in which the inspection result of "leakage" in the inspection target is displayed as the inspection result in the higher inspection target. That is, the inspection result in the upper inspection target may be determined to be the inspection result of "leakage”.
- the administrator can easily compose a plurality of lower inspection targets based on the criterion that the inspection result is "leaky" in at least one lower inspection target included in the upper inspection target. It is possible to quickly and accurately grasp the state of the inspection result and ensure the safety of the inspection target.
- FIG. 14A is another example of an image displayed on the monitoring terminal by the process of displaying the inspection history of the abnormal facility as a map.
- an icon image is displayed at the position of the component detected in the inspection result (state) on the map as the state identification information for identifying and displaying the inspection result (state). Again, the location of the component is roughly displayed at the location of the facility to which the component belongs.
- the monitoring terminal 40 acquires information on the inspection start time and the inspection end time from the server device 20, and as shown in FIG. 14A, the monitoring terminal 40 is in the vicinity of the abnormal facility whose inspection result (state) indicates “leakage”. , Inspection start time and inspection end time are displayed as a script. Further, the monitoring terminal 40 may acquire information about the inspection route in the site from the server device 20 and display the inspection route together with the icon for displaying the abnormal facility.
- the inspection start and end times of the equipment and the inspection route in the facility may be displayed.
- FIG. 14B is another example of an image displayed on the monitoring terminal by the process of displaying the latest state of a specific facility on a map.
- An icon image that identifies and displays the inspection result (state) for the selected specific facility is displayed at the position of the equipment detected in the inspection result (state) on the map.
- the position of the equipment is displayed so that the positions of a plurality of equipment belonging to the facility can be identified.
- the monitoring terminal 40 acquires information on the inspection start time and the inspection end time from the server device 20, and as shown in FIG. 14B, the inspection result (state) is in the vicinity of the equipment indicating “leakage”. ,
- the inspection start time and the inspection end time may be displayed as a script. Further, the monitoring terminal 40 may acquire information about the inspection route of the equipment from the server device 20 and display the inspection route together with the icon for displaying the equipment.
- the inspection history map which displays information about the inspection route as a map, allows the administrator to list the inspection start time and end time of the facility, and the history of visiting the facility or equipment in a map format. Therefore, the inspection history map can be effectively used for formulating an efficient inspection plan.
- FIG. 14C is an example showing an inspection image displayed on the monitoring terminal when the icon of the abnormal equipment indicating “leakage” displayed on the map or the icon of the abnormal facility to which the abnormal equipment belongs is specified. .. Based on the designation of the inspection image link information displayed together with the icon of the abnormal equipment (or the abnormal facility), the display image obtained from the inspection image link destination is displayed on the display unit 44.
- the administrator can easily confirm the inspection image on which the inspection result (state) indicated by the component icon is based. Therefore, the gas facility manager can efficiently evaluate and confirm the reliability of the inspection result by the inspector.
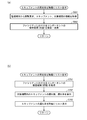
- FIG. 15A is a flowchart showing a process (step S6 in FIG. 9) performed by the server device 20.
- the server device 20 acquires site, date, and time information as a browsing request and browsing conditions from the monitoring terminal 40 (step S621).
- the server device 20 searches and transmits the component and inspection image link information in which the latest inspection result (state) of each component corresponds to "leakage” (step S622). Specifically, the server device 20 searches the inspection condition information database 231 and the inspection result information database 232 for information on the latest inspection result (state) for each component belonging to the designated site, and searches for inspection image link information. Search from the inspection image link information database 233. Then, select the information about the component whose latest inspection result (status) of the component corresponds to "Leaked", and for the selected component, the site, facility, information about the component and inspection image link information are displayed on the monitoring terminal. Send to 40.
- the server device 20 transmits the position information of the selected component to the monitoring terminal 40 (step S623).
- the server device 20 transmits the map link information regarding the link destination of the map image of the selected component to the monitoring terminal 40 (step S624), and ends the process.
- FIG. 15B is a flowchart showing a process (step S7 in FIG. 9) performed by the monitoring terminal 40.
- the monitoring terminal 40 acquires the latest inspection result (state), inspection image link information (step S721), and position information (step S722) of the relevant component from the server device 20.
- the monitoring terminal 40 acquires the map link information regarding the link destination of the map image of each facility from the server device 20, acquires the map image, and displays it on the display unit 44 (step S723).
- the monitoring terminal 40 identifies the position of the relevant component on the map (step S724), and uses an icon image to identify the abnormal facility including the relevant component as status identification information indicating that the inspection result (state) is “leakage”. It is displayed, and at the same time, the inspection image link information corresponding to the selected inspection result (state) is superimposed on the icon image.
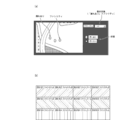
- FIG. 16A is an example of an image displayed on the monitoring terminal. As shown in FIG. 16A, an icon image that identifies and displays the inspection result (state) for all facilities is displayed at the position of the component whose inspection result (state) is detected as “leakage” on the map. Will be done. Even in the display example shown in FIG. 16A, since all the facilities belonging to the site are the display targets, the positions of the relevant components are generally displayed at the positions of the abnormal facilities to which the relevant components belong.
- FIG. 16B is an example showing a display mode of the inspection image displayed on the display unit 44 when a plurality of component icons indicating “leakage” displayed on the map are specified.
- the inspection images for the plurality of components obtained from the inspection image link destination are listed in a matrix on the display unit 44. Then, by designating any one of the plurality of inspection images displayed in the list, the inspection image can be displayed and confirmed for the designated component.
- a still image may be displayed, and if any of the still images is specified, the moving image may be reproduced.
- the inspection date, facility, and presence / absence of gas leak may be displayed in the list display.
- the inspection image of "no leakage" may be displayed.
- the administrator can easily check the outline of the plurality of inspection images on which the inspection result (state) indicated by the icon is based on the plurality of corresponding components.
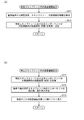
- FIG. 17A is a flowchart showing a process (step S6 in FIG. 9) performed by the server device 20.
- the server device 20 acquires site, date, and time information as a browsing request and browsing condition from the monitoring terminal 40 (step S631).
- the server device 20 searches and transmits the component and inspection image link information whose latest inspection result (state) of each component corresponds to "leakage” or "repaired” (step S632), and is selected. Information about the facility to which the component belongs is transmitted to the monitoring terminal 40 (step S633).
- FIG. 17B is a flowchart showing a process (step S7 in FIG. 9) performed by the monitoring terminal 40.
- the monitoring terminal 40 acquires the latest inspection result (state) (step S731) and inspection image link information (step S732) of the corresponding component from the server device 20.
- the monitoring terminal 40 generates a display image in which the facility including the relevant component, the latest inspection result (state), and the inspection image link information are displayed in a list, and displays the display image on the display unit 44 (step S732).
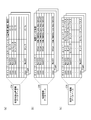
- FIG. 18 is an example of an image displayed on the monitoring terminal by the process of displaying the abnormal facilities in a list.
- the inspection date for the facility including the relevant component, the inspection date, the status corresponding to the inspection result (state) of "leakage” or “repaired", and the inspection corresponding to the inspection result (state).
- a list of symbols associated with the image link information is displayed. Further, based on the designation of the displayed inspection image link information, the inspection image of the component obtained from the inspection image link destination is displayed.
- the administrator can easily display and confirm the inspection image on which the inspection result (state) indicated by the displayed symbol indicates the abnormal facility to which a plurality of corresponding components belong. be able to.
- FIG. 19A is a flowchart showing a process (step S6 in FIG. 9) performed by the server device 20.
- the server device 20 acquires site, inspection date, and time information as browsing requests and browsing conditions from the monitoring terminal 40 (step S641).
- the server device 20 searches for the latest inspection results (status) of all components and transmits them to the monitoring terminal 40 (step S642).
- FIG. 19B is a flowchart showing a process (step S7 in FIG. 9) performed by the monitoring terminal 40.
- the monitoring terminal 40 acquires the latest inspection results (states) of all components from the server device 20 (step S741), calculates the number of component leaks and the leak rate included in each facility (step S742), and then calculates the leak rate.
- a display image in which the number of leaks and the leak rate of the facility are displayed in a list is generated and displayed on the display unit 44 (step S743).
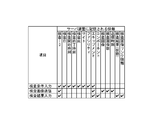
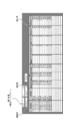
- FIG. 20 is an example of an image displayed on the monitoring terminal by the process of displaying the leakage rate of all facilities in a list. As shown in FIG. 20, all facilities are displayed, and the leak rate in the latest inspection result (state) of the included component is displayed in a list, and the state of gas leak occurrence in each facility is displayed.
- the administrator can easily grasp the latest inspection result (status) of the facility on a macro, and quickly and accurately grasp the facility that needs repair. can.
- FIG. 21A is a flowchart showing a process (step S6 in FIG. 9) performed by the server device 20.
- the server device 20 acquires information on a browsing request, a facility as a browsing condition, and a target period from the monitoring terminal 40 (step S651).
- the server device 20 searches for the latest inspection result (state) in the target period of all components in the designated specific facility and transmits it to the monitoring terminal 40 (step S652).
- FIG. 21B is a flowchart showing a process (step S7 in FIG. 9) performed by the monitoring terminal 40.
- the monitoring terminal 40 acquires the latest inspection result (state) in the target period of all the components in the specific facility from the server device 20 (step S751), and calculates the number of leakages and the leakage rate of the components included in each inspection date. (Step S752), a display image in which the number of leaks and the leak rate for each inspection date of the specific facility are displayed in a list in chronological order is generated and displayed on the display unit 44 (step S753).
- FIG. 22 is an example of an image displayed on the monitoring terminal by the process of displaying the inspection history of the specific facility in a list. As shown in FIG. 22, the leak rate in the latest inspection result (state) of the component included in the target period is displayed in a list with the specified specific facility as the display target, and the gas leak occurs on each inspection date of the facility. Display the status of.
- the administrator can easily grasp the history of the inspection result (state) of the specified specific facility, and the change of the state of the specific facility can be quickly and accurately grasped. Can be grasped.
- FIG. 23A is a flowchart showing a process (step S6 in FIG. 9) performed by the server device 20.
- the server device 20 acquires information on the target period as a browsing request and a browsing condition from the monitoring terminal 40 (step S661).
- the server device 20 searches for the latest inspection result (state) in the target period of all equipment and transmits it to the monitoring terminal 40 (step S662).
- FIG. 23B is a flowchart showing a process (step S7 in FIG. 9) performed by the monitoring terminal 40.
- the monitoring terminal 40 acquires the latest inspection result (state) in the target period of all equipment from the server device 20 (step S761), and calculates the number of leaks and the leak rate within the target period (step S762). , A display image in which the number of leaks and the leak rate (abnormality rate) for each equipment are listed in descending order is generated and displayed on the display unit 44 (step S763).
- FIG. 24 is an example of an image displayed on the monitoring terminal by the process of displaying the abnormality rate of the equipment in a list in descending order. As shown in FIG. 22, all the equipments are displayed, and the leakage rates of the equipments in the target period are listed in descending order, and the state of gas leakage of the equipments in the target period is displayed. The facility to which the equipment belongs may be displayed at the same time.
- the administrator can easily grasp the state of the equipment during the target period, and quickly and accurately grasp the equipment that needs repair and its priority. can do.
- step S7 When the browsing request in step S5 of FIG. 9 is a list display of the abnormality rate in the specific equipment will be described.
- This process may be activated, for example, by the administrator specifying a specific numerical value shown in the frequency column in the list in the display list shown in FIG. 24.
- FIG. 25A is a flowchart showing a process (step S6 in FIG. 9) performed by the server device 20.
- the server device 20 acquires information on a browsing request, a target period as a browsing condition, and equipment from the monitoring terminal 40 (step S671).
- the server device 20 searches for the inspection result (state) in the target period of the designated specific equipment and transmits it to the monitoring terminal 40 (step S672).
- FIG. 25B is a flowchart showing a process (step S7 in FIG. 9) performed by the monitoring terminal 40.
- the monitoring terminal 40 acquires the inspection result (state) in the target period of the specific equipment from the server device 20 (step S771), and the number of leaks and the leakage rate for each inspection date of the specific equipment.
- Step S772 a display image in which the number of leaks and the leak rate (abnormality rate) for each inspection date are listed in descending order is generated and displayed on the display unit 44 (step S773).
- FIG. 26 is an example of an image displayed on the monitoring terminal by a process of displaying a list of abnormal rates of specific equipment in descending order.
- the leakage rate for each inspection date in the target period is displayed in a list in descending order, and the state of gas leakage for each inspection date in the target period is displayed.
- the components for which gas leaks have been confirmed and the facilities to which the components belong may be displayed at the same time for each inspection date.
- the inspection start time and end time for each inspection date may be displayed at the same time.
- the administrator can check the relationship between the inspection result (state) of a specific equipment and the inspection time.
- the administrator can easily grasp the change in the state of the equipment during the target period quickly and accurately.
- the gas inspection management system 1 has an inspection information database 230 that stores inspection results and link information to inspection images for a plurality of inspection targets, and a viewing request and condition designation from the administrator. A part or all of a plurality of inspection targets are selected from the inspection information database 230 based on the inspection information input unit 45 and the inspection information database 230, and information on the inspection results and inspection images are selected for the selected inspection objects.
- An inspection information acquisition unit (CUP21) that acquires link information to, and a display image generation unit (CPU41) that generates a display image including information on inspection results and link information to the inspection image for the selected inspection target.
- a configuration including a display unit 44 for displaying a display image is adopted.
- the inspection history map allows the administrator to list the inspection start time and end time of the facility and the history of visiting the facility in a map format, the inspection history map can be effectively used for formulating an efficient inspection plan. Further, the monitoring terminal 40 may acquire information about the inspection route in the site from the server device 20 and display the inspection route together with the icon for displaying the abnormal facility.
- the display image generated by the monitoring terminal 40 is displayed on the display unit 44 constituting the monitoring terminal 40.
- the display image may be in the form of being displayed on the display screen of the server device 20, for example.
- the display image generation process may be executed by the CPU 21 of the server device 20.
- the administrator can grasp the gas inspection result (state) and the inspection image on the display screen of the server device 20 or the inspection terminal 10, and the inspection result can be used more effectively.
- the storage device 23 is included in the server device 20, but the storage device is not limited to this, and the semiconductor memory, the hard disk drive, and the optical disk are included.
- the drive, the magnetic storage device, and the like may be configured to be connected to the server device 20 from the outside via the Internet.
- the information of the inspection information database 230 stored in the storage unit 23 of the server device 20 may be stored in the inspection image storage device 30.
- the inspector evaluates and judges whether or not there is a gas leak to be inspected based on the inspection image displayed on the display unit 15 of the inspection terminal 10, and provides information on the inspection result (state).
- the configuration of transmitting from the inspection terminal 10 to the server device 20 has been illustrated and described. However, the present disclosure is not limited to this, and the administrator displays an inspection image on the display unit 44 of the monitoring terminal 40 to evaluate and judge the presence or absence of gas leakage to be inspected, and the inspection result (state). The information regarding the above may be transmitted from the monitoring terminal 40 to the server device 20.
- the inspector confirms the information regarding the inspection result (state) transmitted from the inspection terminal 10 to the server device 20 by displaying the inspection image on the display unit 44 of the monitoring terminal 40, and inspects if necessary.
- the information regarding the result (state) may be updated and transmitted from the monitoring terminal 40 to the server device 20. That is, the evaluation by the inspector and the confirmation and correction by the manager may be performed alternately or mutually.
- the classification of the inspection result (state) of the gas equipment is classified into “leakage, no leakage", and the indicator indicating the inspection result (state) of the gas equipment corresponding to the classification.
- the configuration is different in mode.
- the inspection result (state) is classified into “leakage”, “no leakage”, “unknown”, or four or more stages, and the mode of the indicator representing the inspection result (state) is multi-stage. It may be different from. As a result, the inspection result (state) can be grasped more accurately.
- a gas plant is illustrated as a gas facility as an example of an inspection image.
- the present disclosure is not limited to this, and may be applied to the generation of display images in equipment, devices, laboratories, laboratories, factories, and business establishments that utilize gas.
- the present invention is a computer system including a microprocessor and a memory, in which the memory stores the computer program, and the microprocessor may operate according to the computer program.
- the microprocessor may operate according to the computer program.
- it may be a computer system that has a computer program for processing in the gas inspection management system 1 of the present disclosure or a component thereof, and operates according to this program (or instructs each connected part to operate). ..
- the present invention also applies when all or part of the processing in the gas inspection management system 1 or its constituent elements is configured by a computer system composed of a microprocessor, a recording medium such as a ROM or a RAM, a hard disk unit, or the like. included.
- the RAM or the hard disk unit stores a computer program that achieves the same operation as each of the above devices.
- each device achieves its function.
- a system LSI is an ultra-multifunctional LSI manufactured by integrating a plurality of components on a single chip, and specifically, is a computer system including a microprocessor, a ROM, a RAM, and the like. .. These may be individually integrated into one chip, or may be integrated into one chip so as to include a part or all of them.
- a computer program that achieves the same operation as each of the above devices is stored in the RAM.
- the microprocessor operates according to the computer program, the system LSI achieves its function.
- the present invention also includes a case where the processing in the gas inspection management system 1 or its constituent elements is stored as an LSI program, and this LSI is inserted into a computer to execute a predetermined program (gas inspection management method). Is done.
- the integrated circuit method is not limited to LSI, and may be realized by a dedicated circuit or a general-purpose processor.
- An FPGA Field Programmable Gate Array
- a reconfigurable processor that can reconfigure the connection and settings of circuit cells inside the LSI may be used.
- a part or all of the functions of the gas inspection management system 1 or its components according to each embodiment may be realized by executing a program by a processor such as a CPU. It may be a non-temporary computer-readable recording medium on which a program for performing the operation of the gas inspection management system 1 or its components is recorded. By recording a program or signal on a recording medium and transferring it, the program may be executed by another independent computer system, or the program can be distributed via a transmission medium such as the Internet. Needless to say.
- the gas inspection management system 1 or each component thereof according to the above embodiment may have a configuration realized by programmable devices such as a CPU, GPU (Graphics Processing Unit), and a processor, and software.
- programmable devices such as a CPU, GPU (Graphics Processing Unit), and a processor, and software.
- These components can be a single circuit component or an aggregate of a plurality of circuit components. Further, a plurality of components can be combined into one circuit component, or an aggregate of a plurality of circuit components can be formed.
- the division of functional blocks is an example, and even if a plurality of functional blocks are realized as one functional block, one functional block is divided into multiple functional blocks, or some functions are transferred to other functional blocks. good. Further, the functions of a plurality of functional blocks having similar functions may be processed by a single hardware or software in parallel or in a time-divided manner.
- the order in which the above steps are executed is for exemplifying in order to specifically explain the present invention, and may be an order other than the above. Further, a part of the above steps may be executed at the same time (parallel) with other steps.
- the gas inspection management system has an inspection information database that stores inspection results and link information to inspection images for a plurality of inspection targets, and input of a viewing request and condition designation from the administrator. Based on the browsing condition input unit and the browsing request, a part or all of a plurality of inspection targets is selected from the inspection information database, and the selected inspection target is provided with information on the inspection result and the inspection image.
- An inspection information acquisition unit that acquires link information
- a display image generation unit that generates a display image including information on the inspection result and link information to the inspection image for the selected inspection target
- a display image generation unit that displays the display image. It is characterized in that it is provided with a display unit.
- the inspection information database stores the position information of a plurality of inspection targets
- the inspection information acquisition unit has a map image of an area including the inspection target and the above.
- the position information of the selected inspection target is acquired from the inspection information database, and the display image generation unit obtains the position information of the selected inspection target on the map of the area including the inspection target, based on the position information of the selected inspection target, according to the inspection result.
- the configuration may be such that the state identification information of the inspection target having different display modes and the link information to the inspection image are plotted.
- the administrator can list the inspection results of the facility or equipment in a map format by displaying the information on the inspection results of the inspection target on a map. Therefore, the gas facility manager can accurately grasp the distribution status of the facilities where gas leaks occur in the gas facility, and effectively utilize it for efficient re-inspection and formulation of repair plans. Can be done.
- the display image generation unit uses the designated link information.
- the inspection image may be acquired based on the above, and a display image including the acquired inspection image may be generated.
- the administrator can easily confirm the inspection image on which the inspection result (state) indicated by the inspection target icon is based. Therefore, the gas facility manager can efficiently evaluate and confirm the reliability of the inspection result by the inspector.
- condition designation may be information that specifies one or more conditions selected from the inspection target, the inspection date, the person in charge of inspection, and the inspection result. good.
- the administrator can issue a viewing request with arbitrary conditions specified from the inspection target, inspection date, inspection person, and inspection result, and display the inspection result (state) of the inspection target from various viewpoints. It is possible to grasp the state of the gas equipment.
- condition designation is information for specifying the inspection target
- the display image generation unit arranges the inspection results in the designated inspection target in chronological order. It may be configured to generate a display image in a list.
- the administrator can easily grasp the history of the inspection result (state) of the specified specific inspection target, and can quickly and accurately grasp the change in the state of the inspection target.
- condition designation is information for designating the inspection result of "leakage”
- the display image generation unit has the inspection result of "leakage” and the inspection result.
- a display image including a list in which link information to the inspection image corresponding to the inspection result is arranged may be generated.
- the administrator can easily confirm the inspection image on which the inspection result (state) of "leakage" indicated by the icon indicates for a plurality of corresponding components.
- the process of displaying a list of abnormal facilities allows the administrator to easily display and confirm the inspection image on which the inspection result (state) indicated by the symbol displayed in the list is based on the abnormal facility to which a plurality of corresponding components belong. can do.
- condition designation is information for designating the inspection target and the latest inspection result
- the display image generation unit sets the latest inspection result for each inspection target.
- a display image including link information to the inspection image corresponding to the inspection result may be generated.
- the administrator can easily grasp the latest inspection result (state) of the inspection target on a macro scale, and can quickly and accurately grasp the inspection target requiring repair.
- condition designation is information for designating the inspection target and the target period
- display image generation unit is the inspection result of the inspection target within the target period.
- the frequency of occurrence of the inspection result of "leakage” may be calculated, and a display image including information indicating the frequency of occurrence of the inspection result of "leakage” may be generated for each inspection target.
- the administrator can easily grasp the state of the inspection target during the target period, and can quickly and accurately grasp the inspection target requiring repair and its priority.
- the inspection target is composed of a plurality of upper inspection targets and a plurality of lower inspection targets included in the upper inspection target, and the inspection result is a plurality of lower inspection targets.
- the inspection result is the inspection result of "leakage" in at least one lower inspection target including the inspection result for each and included in the upper inspection target
- the inspection result of "leakage" in the lower inspection target is the upper inspection. It may be configured to generate a display image to be displayed as an inspection result in the target.
- the administrator can easily configure multiple sub-inspection targets for inspection of the upper inspection target based on the criteria that the inspection result is "leaky" in at least one sub-inspection target included in the upper inspection target. It is possible to quickly and accurately grasp the state of the result and ensure the safety of the inspection target.
- the gas inspection management method stores the step of accepting the operation input for accepting the viewing request and the input of the condition specification from the administrator, the inspection result for a plurality of inspection targets, and the link information to the inspection image. From the inspection information database to be performed, a step of selecting a part or all of a plurality of inspection targets based on the browsing request and acquiring inspection results and link information to inspection images for the selected inspection target is selected.
- the inspection target may be configured to include a step of generating a display image including information on the inspection result and link information to the inspection image, and a step of displaying the display image.
- the gas inspection management program is a gas inspection management program for causing a computer to execute a gas inspection management process in a monitoring terminal of a gas inspection management system, and the gas inspection management process operates a monitoring terminal.
- the step of accepting the operation input that accepts the browsing request and the input of the condition specification from the administrator A step of selecting a part or all of a plurality of selected inspection targets and acquiring the inspection result of the selected inspection target and link information to the inspection image, and the selected inspection target with respect to the inspection result. It is characterized by including a step of generating a display image including information and link information to the inspection image, and a step of displaying the display image.
- the order in which the above methods are executed is for exemplifying in order to specifically explain the present invention, and may be an order other than the above. Moreover, a part of the above-mentioned method may be executed at the same time (parallel) with another method.
- the gas inspection management system, gas inspection management method, and program according to the embodiment of the present disclosure can be widely applied to a management system that uses a gas leak in a gas facility for inspection.
Landscapes
- Business, Economics & Management (AREA)
- General Physics & Mathematics (AREA)
- Physics & Mathematics (AREA)
- Engineering & Computer Science (AREA)
- Economics (AREA)
- General Business, Economics & Management (AREA)
- Human Resources & Organizations (AREA)
- Marketing (AREA)
- Health & Medical Sciences (AREA)
- Theoretical Computer Science (AREA)
- Strategic Management (AREA)
- Tourism & Hospitality (AREA)
- Entrepreneurship & Innovation (AREA)
- Quality & Reliability (AREA)
- Operations Research (AREA)
- Public Health (AREA)
- Water Supply & Treatment (AREA)
- General Health & Medical Sciences (AREA)
- Primary Health Care (AREA)
- Testing And Monitoring For Control Systems (AREA)
Priority Applications (3)
| Application Number | Priority Date | Filing Date | Title |
|---|---|---|---|
| PCT/JP2020/011176 WO2021181675A1 (ja) | 2020-03-13 | 2020-03-13 | ガス検査管理システム、ガス検査管理方法、及びプログラム |
| US17/905,181 US12146812B2 (en) | 2020-03-13 | 2020-03-13 | Gas inspection management system, gas inspection management method, and instructions for gas inspection management |
| JP2022505702A JPWO2021181675A1 (cg-RX-API-DMAC7.html) | 2020-03-13 | 2020-03-13 |
Applications Claiming Priority (1)
| Application Number | Priority Date | Filing Date | Title |
|---|---|---|---|
| PCT/JP2020/011176 WO2021181675A1 (ja) | 2020-03-13 | 2020-03-13 | ガス検査管理システム、ガス検査管理方法、及びプログラム |
Publications (1)
| Publication Number | Publication Date |
|---|---|
| WO2021181675A1 true WO2021181675A1 (ja) | 2021-09-16 |
Family
ID=77670946
Family Applications (1)
| Application Number | Title | Priority Date | Filing Date |
|---|---|---|---|
| PCT/JP2020/011176 Ceased WO2021181675A1 (ja) | 2020-03-13 | 2020-03-13 | ガス検査管理システム、ガス検査管理方法、及びプログラム |
Country Status (3)
| Country | Link |
|---|---|
| US (1) | US12146812B2 (cg-RX-API-DMAC7.html) |
| JP (1) | JPWO2021181675A1 (cg-RX-API-DMAC7.html) |
| WO (1) | WO2021181675A1 (cg-RX-API-DMAC7.html) |
Cited By (2)
| Publication number | Priority date | Publication date | Assignee | Title |
|---|---|---|---|---|
| WO2024021605A1 (zh) * | 2022-07-29 | 2024-02-01 | 河北先河环保科技股份有限公司 | 一种泄漏检测方法、装置及终端 |
| WO2025249138A1 (ja) * | 2024-05-27 | 2025-12-04 | ソニーグループ株式会社 | 情報処理装置、情報処理方法、およびプログラム |
Citations (10)
| Publication number | Priority date | Publication date | Assignee | Title |
|---|---|---|---|---|
| JP2010003190A (ja) * | 2008-06-23 | 2010-01-07 | Hitachi Ltd | 保守点検システム |
| US20140200936A1 (en) * | 2011-02-16 | 2014-07-17 | Genscape Intangible Holding, Inc. | Method and system for collecting and analyzing operational information from a network of components associated with a liquid energy commodity |
| WO2016056297A1 (ja) * | 2014-10-07 | 2016-04-14 | 株式会社テイエルブイ | 流体漏洩データの管理装置及び管理システム |
| US20170097274A1 (en) * | 2015-10-06 | 2017-04-06 | Bridger Photonics, Inc. | Gas-mapping 3d imager measurement techniques and method of data processing |
| WO2017061351A1 (ja) * | 2015-10-05 | 2017-04-13 | コニカミノルタ株式会社 | ナビゲート装置及びナビゲート方法 |
| JP2017174127A (ja) * | 2016-03-23 | 2017-09-28 | 横河電機株式会社 | 保全情報共有装置、保全情報共有方法、保全情報共有プログラム及び記録媒体 |
| WO2018043417A1 (ja) * | 2016-08-30 | 2018-03-08 | コニカミノルタ株式会社 | 配管評価装置、配管評価方法及び配管評価プログラム |
| WO2020003644A1 (ja) * | 2018-06-26 | 2020-01-02 | コニカミノルタ株式会社 | 漏洩ガス検出装置および漏洩ガス検出方法 |
| WO2020008688A1 (ja) * | 2018-07-05 | 2020-01-09 | コニカミノルタ株式会社 | ガス監視画像記録装置、該方法および該プログラム |
| WO2020021785A1 (ja) * | 2018-07-25 | 2020-01-30 | コニカミノルタ株式会社 | ガス検出装置、ガス検出方法、表示制御方法、およびプログラム |
Family Cites Families (6)
| Publication number | Priority date | Publication date | Assignee | Title |
|---|---|---|---|---|
| US8274402B1 (en) | 2008-01-24 | 2012-09-25 | LDARtools, Inc. | Data collection process for optical leak detection |
| US9420042B2 (en) * | 2012-05-15 | 2016-08-16 | Raymond & Lae Engineering, Inc. | Facilities management system |
| WO2016143754A1 (ja) | 2015-03-09 | 2016-09-15 | コニカミノルタ株式会社 | ガス漏れ位置推定装置、ガス漏れ位置推定システム、ガス漏れ位置推定方法及びガス漏れ位置推定プログラム |
| US10504218B2 (en) * | 2015-04-21 | 2019-12-10 | United Technologies Corporation | Method and system for automated inspection utilizing a multi-modal database |
| US10145788B2 (en) | 2015-10-29 | 2018-12-04 | Konica Minolta, Inc. | Image processing device for gas detection, image processing method for gas detection and image processing program for gas detection |
| US10732620B2 (en) * | 2016-08-01 | 2020-08-04 | General Electric Company | System and method for inspecting machinery |
-
2020
- 2020-03-13 JP JP2022505702A patent/JPWO2021181675A1/ja active Pending
- 2020-03-13 WO PCT/JP2020/011176 patent/WO2021181675A1/ja not_active Ceased
- 2020-03-13 US US17/905,181 patent/US12146812B2/en active Active
Patent Citations (10)
| Publication number | Priority date | Publication date | Assignee | Title |
|---|---|---|---|---|
| JP2010003190A (ja) * | 2008-06-23 | 2010-01-07 | Hitachi Ltd | 保守点検システム |
| US20140200936A1 (en) * | 2011-02-16 | 2014-07-17 | Genscape Intangible Holding, Inc. | Method and system for collecting and analyzing operational information from a network of components associated with a liquid energy commodity |
| WO2016056297A1 (ja) * | 2014-10-07 | 2016-04-14 | 株式会社テイエルブイ | 流体漏洩データの管理装置及び管理システム |
| WO2017061351A1 (ja) * | 2015-10-05 | 2017-04-13 | コニカミノルタ株式会社 | ナビゲート装置及びナビゲート方法 |
| US20170097274A1 (en) * | 2015-10-06 | 2017-04-06 | Bridger Photonics, Inc. | Gas-mapping 3d imager measurement techniques and method of data processing |
| JP2017174127A (ja) * | 2016-03-23 | 2017-09-28 | 横河電機株式会社 | 保全情報共有装置、保全情報共有方法、保全情報共有プログラム及び記録媒体 |
| WO2018043417A1 (ja) * | 2016-08-30 | 2018-03-08 | コニカミノルタ株式会社 | 配管評価装置、配管評価方法及び配管評価プログラム |
| WO2020003644A1 (ja) * | 2018-06-26 | 2020-01-02 | コニカミノルタ株式会社 | 漏洩ガス検出装置および漏洩ガス検出方法 |
| WO2020008688A1 (ja) * | 2018-07-05 | 2020-01-09 | コニカミノルタ株式会社 | ガス監視画像記録装置、該方法および該プログラム |
| WO2020021785A1 (ja) * | 2018-07-25 | 2020-01-30 | コニカミノルタ株式会社 | ガス検出装置、ガス検出方法、表示制御方法、およびプログラム |
Cited By (2)
| Publication number | Priority date | Publication date | Assignee | Title |
|---|---|---|---|---|
| WO2024021605A1 (zh) * | 2022-07-29 | 2024-02-01 | 河北先河环保科技股份有限公司 | 一种泄漏检测方法、装置及终端 |
| WO2025249138A1 (ja) * | 2024-05-27 | 2025-12-04 | ソニーグループ株式会社 | 情報処理装置、情報処理方法、およびプログラム |
Also Published As
| Publication number | Publication date |
|---|---|
| US12146812B2 (en) | 2024-11-19 |
| US20230117395A1 (en) | 2023-04-20 |
| JPWO2021181675A1 (cg-RX-API-DMAC7.html) | 2021-09-16 |
Similar Documents
| Publication | Publication Date | Title |
|---|---|---|
| JP5636106B2 (ja) | 改善された診断性を有する手持ち型フィールドメンテナンスツール | |
| AU2023274062A1 (en) | System for analyzing machine data | |
| CN104508576B (zh) | 工业工厂中的对象检验 | |
| CN110023862A (zh) | 诊断装置、诊断方法及程序 | |
| US11755007B2 (en) | System and method for determining a health condition and an anomaly of an equipment using one or more sensors | |
| US11126170B2 (en) | System and method for remote structural health monitoring | |
| US20130282333A1 (en) | Service port explorer | |
| JP7292076B2 (ja) | 劣化推定装置、学習装置、劣化推定方法、学習方法、劣化推定プログラム、および、学習プログラム | |
| Tsybunov et al. | Interactive (intelligent) integrated system for the road vehicles’ diagnostics | |
| JP6667664B2 (ja) | プラント管理装置、プラント管理方法、およびプログラム | |
| CN118353920B (zh) | 一种设备巡检管理方法、系统、设备及存储介质 | |
| CN114419753A (zh) | 一种智能巡视系统及方法 | |
| US12146812B2 (en) | Gas inspection management system, gas inspection management method, and instructions for gas inspection management | |
| CN114025148A (zh) | 一种监测方法和监测系统 | |
| KR102303903B1 (ko) | 가공배전선로의 진단보고서 자동작성 시스템 및 방법 | |
| CN119728398B (zh) | 基于物联网与人工智能的新能源场站巡检与故障诊断方法 | |
| US7698245B2 (en) | Applying rules to validating data for a machine arrangement | |
| CN115833371A (zh) | 设备巡检方法、装置、计算机设备及其存储介质 | |
| CN119728957A (zh) | 一种智能视频监控的巡检方法及装置 | |
| JP2016200930A (ja) | センサ情報処理装置、センサ情報処理方法およびセンサ情報処理プログラム | |
| CN120872719A (zh) | 监控数据处理方法、装置、电子设备及存储介质 | |
| WO2020129818A1 (ja) | 機械設備診断システム、機械設備診断方法、および機械設備診断プログラム | |
| TW202228035A (zh) | 緊固管理之方法、系統、及其程式 | |
| US20050193270A1 (en) | Mobile remote monitoring and diagnostics and method | |
| SK782023U1 (sk) | Systém na priestorový monitoring a spôsob priestorového monitorovania |
Legal Events
| Date | Code | Title | Description |
|---|---|---|---|
| 121 | Ep: the epo has been informed by wipo that ep was designated in this application |
Ref document number: 20923857 Country of ref document: EP Kind code of ref document: A1 |
|
| ENP | Entry into the national phase |
Ref document number: 2022505702 Country of ref document: JP Kind code of ref document: A |
|
| NENP | Non-entry into the national phase |
Ref country code: DE |
|
| 122 | Ep: pct application non-entry in european phase |
Ref document number: 20923857 Country of ref document: EP Kind code of ref document: A1 |