WO2021100191A1 - Procédé, système et programme d'affichage d'informations de numéro de cellule - Google Patents
Procédé, système et programme d'affichage d'informations de numéro de cellule Download PDFInfo
- Publication number
- WO2021100191A1 WO2021100191A1 PCT/JP2019/045735 JP2019045735W WO2021100191A1 WO 2021100191 A1 WO2021100191 A1 WO 2021100191A1 JP 2019045735 W JP2019045735 W JP 2019045735W WO 2021100191 A1 WO2021100191 A1 WO 2021100191A1
- Authority
- WO
- WIPO (PCT)
- Prior art keywords
- cells
- cell
- displaying
- image
- counting
- Prior art date
Links
- 238000000034 method Methods 0.000 title claims abstract description 89
- 210000004027 cell Anatomy 0.000 claims description 534
- 230000005856 abnormality Effects 0.000 claims description 79
- 230000008859 change Effects 0.000 claims description 58
- 238000003384 imaging method Methods 0.000 claims description 33
- 230000008569 process Effects 0.000 claims description 27
- 238000010801 machine learning Methods 0.000 claims description 12
- 210000004748 cultured cell Anatomy 0.000 claims description 11
- 230000005859 cell recognition Effects 0.000 claims description 3
- 238000004113 cell culture Methods 0.000 description 49
- 210000001612 chondrocyte Anatomy 0.000 description 25
- 230000007704 transition Effects 0.000 description 23
- 238000012544 monitoring process Methods 0.000 description 22
- 239000002609 medium Substances 0.000 description 19
- 238000010586 diagram Methods 0.000 description 16
- 230000002159 abnormal effect Effects 0.000 description 11
- 230000007547 defect Effects 0.000 description 11
- 238000004891 communication Methods 0.000 description 10
- 230000003287 optical effect Effects 0.000 description 9
- CIWBSHSKHKDKBQ-JLAZNSOCSA-N Ascorbic acid Chemical compound OC[C@H](O)[C@H]1OC(=O)C(O)=C1O CIWBSHSKHKDKBQ-JLAZNSOCSA-N 0.000 description 6
- 230000007246 mechanism Effects 0.000 description 5
- 238000012545 processing Methods 0.000 description 5
- 238000013528 artificial neural network Methods 0.000 description 4
- 238000012258 culturing Methods 0.000 description 4
- 238000012790 confirmation Methods 0.000 description 3
- 239000000428 dust Substances 0.000 description 3
- 230000000694 effects Effects 0.000 description 3
- 238000010899 nucleation Methods 0.000 description 3
- 230000003247 decreasing effect Effects 0.000 description 2
- 230000006870 function Effects 0.000 description 2
- 230000006872 improvement Effects 0.000 description 2
- 238000002955 isolation Methods 0.000 description 2
- 230000004044 response Effects 0.000 description 2
- 238000000926 separation method Methods 0.000 description 2
- 238000013517 stratification Methods 0.000 description 2
- 238000012549 training Methods 0.000 description 2
- 210000003771 C cell Anatomy 0.000 description 1
- 230000032683 aging Effects 0.000 description 1
- 230000003698 anagen phase Effects 0.000 description 1
- 238000004364 calculation method Methods 0.000 description 1
- 244000309466 calf Species 0.000 description 1
- 239000007376 cm-medium Substances 0.000 description 1
- 230000000295 complement effect Effects 0.000 description 1
- 238000011109 contamination Methods 0.000 description 1
- 238000001914 filtration Methods 0.000 description 1
- 238000000265 homogenisation Methods 0.000 description 1
- 238000005286 illumination Methods 0.000 description 1
- 238000010191 image analysis Methods 0.000 description 1
- 238000012986 modification Methods 0.000 description 1
- 230000004048 modification Effects 0.000 description 1
- 238000003672 processing method Methods 0.000 description 1
- 230000009467 reduction Effects 0.000 description 1
- 238000012552 review Methods 0.000 description 1
- 239000004065 semiconductor Substances 0.000 description 1
- 230000035945 sensitivity Effects 0.000 description 1
- 210000002966 serum Anatomy 0.000 description 1
- 238000010186 staining Methods 0.000 description 1
- 230000001052 transient effect Effects 0.000 description 1
- 238000012559 user support system Methods 0.000 description 1
- 238000012795 verification Methods 0.000 description 1
Images


Classifications
-
- G01N15/1433—
-
- C—CHEMISTRY; METALLURGY
- C12—BIOCHEMISTRY; BEER; SPIRITS; WINE; VINEGAR; MICROBIOLOGY; ENZYMOLOGY; MUTATION OR GENETIC ENGINEERING
- C12M—APPARATUS FOR ENZYMOLOGY OR MICROBIOLOGY; APPARATUS FOR CULTURING MICROORGANISMS FOR PRODUCING BIOMASS, FOR GROWING CELLS OR FOR OBTAINING FERMENTATION OR METABOLIC PRODUCTS, i.e. BIOREACTORS OR FERMENTERS
- C12M1/00—Apparatus for enzymology or microbiology
- C12M1/34—Measuring or testing with condition measuring or sensing means, e.g. colony counters
-
- G—PHYSICS
- G01—MEASURING; TESTING
- G01N—INVESTIGATING OR ANALYSING MATERIALS BY DETERMINING THEIR CHEMICAL OR PHYSICAL PROPERTIES
- G01N15/00—Investigating characteristics of particles; Investigating permeability, pore-volume, or surface-area of porous materials
- G01N15/10—Investigating individual particles
- G01N15/14—Electro-optical investigation, e.g. flow cytometers
- G01N15/1429—Electro-optical investigation, e.g. flow cytometers using an analyser being characterised by its signal processing
-
- G—PHYSICS
- G01—MEASURING; TESTING
- G01N—INVESTIGATING OR ANALYSING MATERIALS BY DETERMINING THEIR CHEMICAL OR PHYSICAL PROPERTIES
- G01N33/00—Investigating or analysing materials by specific methods not covered by groups G01N1/00 - G01N31/00
- G01N33/48—Biological material, e.g. blood, urine; Haemocytometers
- G01N33/50—Chemical analysis of biological material, e.g. blood, urine; Testing involving biospecific ligand binding methods; Immunological testing
- G01N33/5005—Chemical analysis of biological material, e.g. blood, urine; Testing involving biospecific ligand binding methods; Immunological testing involving human or animal cells
- G01N33/5094—Chemical analysis of biological material, e.g. blood, urine; Testing involving biospecific ligand binding methods; Immunological testing involving human or animal cells for blood cell populations
-
- G—PHYSICS
- G01—MEASURING; TESTING
- G01N—INVESTIGATING OR ANALYSING MATERIALS BY DETERMINING THEIR CHEMICAL OR PHYSICAL PROPERTIES
- G01N35/00—Automatic analysis not limited to methods or materials provided for in any single one of groups G01N1/00 - G01N33/00; Handling materials therefor
- G01N35/00029—Automatic analysis not limited to methods or materials provided for in any single one of groups G01N1/00 - G01N33/00; Handling materials therefor provided with flat sample substrates, e.g. slides
- G01N35/00069—Automatic analysis not limited to methods or materials provided for in any single one of groups G01N1/00 - G01N33/00; Handling materials therefor provided with flat sample substrates, e.g. slides whereby the sample substrate is of the bio-disk type, i.e. having the format of an optical disk
-
- G—PHYSICS
- G06—COMPUTING; CALCULATING OR COUNTING
- G06N—COMPUTING ARRANGEMENTS BASED ON SPECIFIC COMPUTATIONAL MODELS
- G06N20/00—Machine learning
-
- G—PHYSICS
- G06—COMPUTING; CALCULATING OR COUNTING
- G06N—COMPUTING ARRANGEMENTS BASED ON SPECIFIC COMPUTATIONAL MODELS
- G06N3/00—Computing arrangements based on biological models
- G06N3/02—Neural networks
- G06N3/04—Architecture, e.g. interconnection topology
- G06N3/045—Combinations of networks
-
- G—PHYSICS
- G06—COMPUTING; CALCULATING OR COUNTING
- G06T—IMAGE DATA PROCESSING OR GENERATION, IN GENERAL
- G06T7/00—Image analysis
- G06T7/0002—Inspection of images, e.g. flaw detection
- G06T7/0012—Biomedical image inspection
-
- G—PHYSICS
- G06—COMPUTING; CALCULATING OR COUNTING
- G06V—IMAGE OR VIDEO RECOGNITION OR UNDERSTANDING
- G06V10/00—Arrangements for image or video recognition or understanding
- G06V10/70—Arrangements for image or video recognition or understanding using pattern recognition or machine learning
- G06V10/77—Processing image or video features in feature spaces; using data integration or data reduction, e.g. principal component analysis [PCA] or independent component analysis [ICA] or self-organising maps [SOM]; Blind source separation
- G06V10/778—Active pattern-learning, e.g. online learning of image or video features
- G06V10/7784—Active pattern-learning, e.g. online learning of image or video features based on feedback from supervisors
- G06V10/7792—Active pattern-learning, e.g. online learning of image or video features based on feedback from supervisors the supervisor being an automated module, e.g. "intelligent oracle"
-
- G—PHYSICS
- G06—COMPUTING; CALCULATING OR COUNTING
- G06V—IMAGE OR VIDEO RECOGNITION OR UNDERSTANDING
- G06V20/00—Scenes; Scene-specific elements
- G06V20/60—Type of objects
- G06V20/69—Microscopic objects, e.g. biological cells or cellular parts
- G06V20/698—Matching; Classification
-
- G—PHYSICS
- G01—MEASURING; TESTING
- G01N—INVESTIGATING OR ANALYSING MATERIALS BY DETERMINING THEIR CHEMICAL OR PHYSICAL PROPERTIES
- G01N15/00—Investigating characteristics of particles; Investigating permeability, pore-volume, or surface-area of porous materials
- G01N15/10—Investigating individual particles
- G01N2015/1006—Investigating individual particles for cytology
-
- G—PHYSICS
- G01—MEASURING; TESTING
- G01N—INVESTIGATING OR ANALYSING MATERIALS BY DETERMINING THEIR CHEMICAL OR PHYSICAL PROPERTIES
- G01N15/00—Investigating characteristics of particles; Investigating permeability, pore-volume, or surface-area of porous materials
- G01N15/10—Investigating individual particles
- G01N15/14—Electro-optical investigation, e.g. flow cytometers
- G01N2015/1486—Counting the particles
-
- G—PHYSICS
- G06—COMPUTING; CALCULATING OR COUNTING
- G06N—COMPUTING ARRANGEMENTS BASED ON SPECIFIC COMPUTATIONAL MODELS
- G06N3/00—Computing arrangements based on biological models
- G06N3/02—Neural networks
- G06N3/08—Learning methods
-
- G—PHYSICS
- G06—COMPUTING; CALCULATING OR COUNTING
- G06T—IMAGE DATA PROCESSING OR GENERATION, IN GENERAL
- G06T2207/00—Indexing scheme for image analysis or image enhancement
- G06T2207/30—Subject of image; Context of image processing
- G06T2207/30004—Biomedical image processing
- G06T2207/30024—Cell structures in vitro; Tissue sections in vitro
-
- G—PHYSICS
- G06—COMPUTING; CALCULATING OR COUNTING
- G06T—IMAGE DATA PROCESSING OR GENERATION, IN GENERAL
- G06T2207/00—Indexing scheme for image analysis or image enhancement
- G06T2207/30—Subject of image; Context of image processing
- G06T2207/30242—Counting objects in image
Definitions
- the disclosure of this specification relates to a method, a system, and a program for displaying cell number information.
- a cell counting method As a cell counting method, a method of counting cells by a human using a cell counting plate, a method of counting cells flowed in a row using a flow cytometer, and a method of counting cells from an image by analyzing a cell image. How to do it is known. Since the method of counting cells from an image can be performed even during culturing, it is suitable for applications such as counting cells in culturing and monitoring the culture state.
- Patent Document 1 states that "the process of cell counting by performing various image processing methods such as binarization, background homogenization, standardization and filtering to enhance the appearance of cells in the survey data. ”And so on.
- the cell culture worker Since the cell culture worker is generally aware of the desired transition in the number of cells, it is possible to detect that the transition in the number of cells is different from what is expected by monitoring the number of cells in the culture. However, it is not easy to identify the cause of the detected abnormality.
- an object of one aspect of the present invention is to provide a technique for supporting the isolation of the cause of an abnormality in the number of cells counted from an image without confirming the image.
- the method according to one aspect of the present invention is a method for displaying cell number information, which includes a step of acquiring a plurality of cell images in which cells are sequentially imaged and a first counting model for counting cells included in the images.
- a step of displaying a screen that visualizes at least one of the first cell number and the second cell number, and the correspondence between the first cell number and the second cell number based on the number of cells is included. ..
- a method is a method for displaying cell number information, which is a step of acquiring a plurality of cell images in which cells are sequentially imaged, and a first counting model for counting cells included in the images.
- the first counting model has a matching rate higher than the matching rate of the second counting model.
- the system according to one aspect of the present invention is a system including an electric circuit, in which the electric circuit acquires a plurality of cell images in which cells are sequentially imaged from an imaging device and counts the cells contained in the image.
- the number of first cells output by applying each of the plurality of cell images to one counting model is obtained, and here, the first counting model has a higher matching rate than the matching rate of the second counting model.
- the plurality of cell images which have a recall rate lower than the recall rate of the second counting model and which is the same as the image obtained by acquiring the first cell number in the second counting model for counting the cells contained in the image.
- Each is applied to obtain the output second cell number, and the first cell number and the second cell number are based on the first cell number and the second cell number in the second counting model.
- a screen that visualizes at least one of them and the correspondence between the number of the first cells and the number of the second cells is displayed on the display device.
- the system is a system including an electric circuit, in which the electric circuit acquires a plurality of cell images in which cells are sequentially imaged from an imaging device and counts the cells contained in the images.
- the number of first cells output by applying each of the plurality of cell images to the first counting model is obtained, and here, the first counting model has a higher matching rate than the matching rate of the second counting model.
- a computer obtains a cell image in which cells are imaged from an imaging device, inputs the cell image into a first counting model for counting cells included in the image, and then inputs the cell image to the computer.
- the first counting model has a higher matching rate than the second counting model and a lower recall rate than the second counting model, and counts the cells contained in the image.
- the number of first cells output by inputting the cell image into the counting model and inputting the cell image into the first counting model and the output by inputting the cell image into the second counting model.
- a process of displaying a screen that visualizes at least one of the number of the first cell and the number of the second cell and the correspondence between the number of the first cell and the number of the second cell is executed. It is a computer-readable medium that records the program to be made.
- FIG. 1 is a diagram for explaining a cell culture procedure.
- the work performed by the operator in the cell culture in which the cultured cells prepared in advance are grown to the target number will be described with reference to FIG.
- the worker first seeds the cultured cells in the culture vessel, then arranges the culture vessel on the imaging device in the incubator and starts cell culture. After the start of cell culture, the operator monitors the cell culture by confirming the number of cells counted from the cell image acquired by the imaging device and, if necessary, also confirming the cell image.
- the operator may determine whether the seeding density is appropriate from the number of cells immediately after the start of culturing, and adjust the seeding density to be the recommended seeding density recommended by the protocol. Further, in the logarithmic growth phase, the worker may exchange the medium at a frequency according to the cell density as grasped from the number of cells, and if the cell density exceeds a predetermined value, the passage is performed. You may go.
- the cell culture is stopped or restarted.
- the worker determines that the cell culture has proceeded smoothly and the number of cultured cells has reached the target number, the cell culture is completed.
- the number of cells in cell culture and its transition are important information for successful cell culture. It is positioned as.
- the number of cells obtained from the counting model is an abnormal transition different from the original transition of the number of cells. Is more likely to indicate.
- the shape change referred to here includes not only the shape change due to the actual deformation of the cell, but also the apparent shape change of the cell appearing on the image caused by, for example, layering of the cell. For example, in the case of a model with strict certification criteria, if the shape of cells changes even a little, it may be recognized as deviating from the standard shape provided by the counting model, and the cells may not be counted.
- the number of cells may be less than the original number of cells. Both shape changes are the same in that they are not abnormal events in cell culture.
- counting models commonly used in cell culture monitoring generally provide a reliable cell number that is not overestimated by their high accreditation criteria, while at the same time possible abnormalities in the culture process.
- Abnormal events can cause abnormal changes in cell number.
- the abnormal transition that is, whether the deviation from the expected transition is a true abnormality caused by the culture environment or a fake abnormality caused by a defect in the image recognition of the counting model is output from the counting model. It is difficult to separate from only the number of cells.
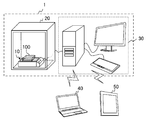
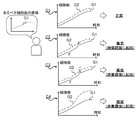
- FIG. 2 is a diagram illustrating the configuration of the cell culture monitoring system.
- FIG. 3 is a diagram illustrating the configuration of the imaging device.
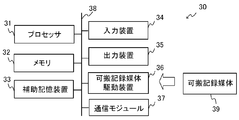
- FIG. 4 is a diagram illustrating the physical configuration of the control device.
- the configuration of the system 1 shown in FIG. 2 will be described with reference to FIGS. 2 to 4.
- System 1 is a cell culture monitoring system for acquiring an image of a cultured cell while culturing the cultured cell in a controlled environment in the incubator 20 and monitoring the cell culture based on the image.
- the system 1 includes an imaging device 10 placed in the incubator 20 and a control device 30.
- the control device 30 counts cells based on the image acquired by the imaging device 10, and uses the obtained number of cells to support the user in monitoring the cell culture. Further, the control device 30 communicates with the image pickup device 10 and the client terminal (client terminal 40, client terminal 50).
- the system 1 may include an incubator 20 and a client terminal.
- a culture container 100 is placed on the image pickup apparatus 10 arranged in the incubator 20.
- the culture vessel 100 is not particularly limited, and is, for example, a Petri dish, a flask, a microplate, or the like.
- the culture container 100 contains cells C, which are cultured cells, together with the medium CM.
- the medium CM is, for example, calf serum
- the cell C is, for example, chondrocytes.
- the imaging device 10 generates an image of the cell C (hereinafter referred to as a cell image) by imaging the cell C housed in the culture container 100.
- the image pickup device 10 transmits the generated image to the control device 30.
- the communication between the image pickup device 10 and the control device 30 may be wired communication or wireless communication.
- the imaging method is, for example, phase difference observation, differential interference contrast observation, oblique illumination observation, and the like, and is not particularly limited as long as individual cells can be imaged.
- the imaging device 10 includes a housing 11 and a stage 12 on which the culture container 100 is placed.
- the image pickup apparatus 10 further includes an image pickup unit 13 and a scanning mechanism 16 for moving the image pickup unit 13 inside the housing 11 below the stage 12.
- the image pickup unit 13 is provided with an image pickup element 14, a light source 15, an optical system (not shown), and the like.
- the image sensor 14 is, for example, a CCD (Charge-Coupled Device) image sensor, a CMOS (Complementary MOS) image sensor, or the like.
- the light source 15 is, for example, a light emitting diode (LED) or the like, and illuminates the culture vessel 100 from below the stage 12.
- the light sources 15 may be placed facing each other with the image sensor 14 in between. Further, the light source 15 may emit white light. In order to reduce damage to cells, it is desirable to use R (red) light having a long wavelength.
- Each of the light sources 15 can be any of R (red), G (green), and B (blue) by switching light having three wavelengths of R (red), G (green), and B (blue), for example.
- Light of that wavelength may be selectively emitted.
- the light emitted from the light source 15 passes through the bottom surface of the culture container 100, and a part of the light reflected on the upper surface of the culture container 100 passes through the cells C in the culture container 100.
- the optical system forms an optical image of the cells C on the image pickup device 14 by using the light transmitted through the cells C in the culture vessel 100.
- the scanning mechanism 16 includes, for example, a drive source such as a motor, and moves the image pickup unit 13 in a direction (XY directions) orthogonal to the optical axis of the optical system.
- the scanning mechanism 16 moves the imaging unit 13 in the XY directions, so that the imaging device 10 can change the range of the imaging target.
- the scanning mechanism 16 may further move the imaging unit 13 in the optical axis direction (Z direction) of the optical system, and the imaging device 10 may adjust the focus position by using the scanning mechanism 16. Further, the image pickup apparatus 10 may adjust the focus position by moving at least one of the lenses included in the optical system in the optical axis direction.
- the control device 30 is a computer that controls the system 1. As shown in FIG. 4, the control device 30 is a portable recording medium driving device that drives a processor 31, a memory 32, an auxiliary storage device 33, an input device 34, an output device 35, and a portable recording medium 39. It includes 36, a communication module 37, and a bus 38.
- the auxiliary storage device 33 and the portable recording medium 39 are examples of non-transient computer-readable recording media on which programs are recorded.
- the processor 31 is, for example, an electric circuit (circuitry) including a CPU (Central Processing Unit), a GPU (Graphics Processing Unit), and the like.
- the processor 31 expands the program stored in the auxiliary storage device 33 or the portable recording medium 39 into the memory 32, and then executes the program to perform programmed processing such as a cell information display method described later.
- the memory 32 is, for example, an arbitrary semiconductor memory such as a RAM (Random Access Memory).
- the memory 32 functions as a work memory for storing the program or data stored in the auxiliary storage device 33 or the portable recording medium 39 when the program is executed.
- the auxiliary storage device 33 is, for example, a non-volatile memory such as a hard disk or a flash memory.
- the auxiliary storage device 33 is mainly used for storing various data and programs.
- the portable recording medium drive device 36 accommodates the portable recording medium 39.
- the portable recording medium driving device 36 can output the data stored in the memory 32 or the auxiliary storage device 33 to the portable recording medium 39, and reads out programs, data, and the like from the portable recording medium 39. Can be done.
- the portable recording medium 39 is any portable recording medium.
- the portable recording medium 39 includes, for example, an SD card, a USB (Universal Serial Bus) flash memory, a CD (Compact Disc), a DVD (Digital Versatile Disc), and the like.
- the input device 34 is a keyboard, a mouse, or the like.
- the output device 35 is a display device, a printer, or the like.
- the communication module 37 is, for example, a wired communication module that communicates with the image pickup apparatus 10 connected via an external port.
- the communication module 37 may be a wireless communication module.
- the bus 38 connects the processor 31, the memory 32, the auxiliary storage device 33, and the like to each other so that data can be exchanged.
- the configuration shown in FIG. 4 is an example of the hardware configuration of the control device 30.
- the control device 30 is not limited to this configuration.
- the control device 30 may be a general-purpose device or a dedicated device.
- the control device 30 may include, for example, a specially designed electric circuit, for example, an ASIC (Application Specific Integrated Circuit) or the like. Further, the control device 30 may be configured by using an FPGA (Field-Programmable Gate Array).
- the control device 30 transmits an imaging instruction to the imaging device 10. Further, the control device 30 receives an image generated by the image pickup device 10 taking an image of the cell C. Further, the control device 30 counts the cells C included in the image and calculates the number of cells based on the image of the cells C acquired from the imaging device 10. More specifically, cell C is counted using two different counting models to calculate two cell numbers (first cell number, second cell number).
- the control device 30 provides the user with a screen for assisting in monitoring the cell culture using the number of those cells. Specifically, the control device 30 may display, for example, a screen for supporting the monitoring of cell culture on the display device which is the output device 35.
- the client terminal 40 is a notebook computer.
- the client terminal 50 is a tablet computer.
- the control device 30 may output screen information to the client terminal in response to a request from the client terminal (client terminal 40, client terminal 50).
- the client terminal may be provided with a display unit, and may be, for example, a desktop computer or a smartphone.
- FIG. 5 is a flowchart showing an example of a cell culture monitoring support method.
- a method of supporting the monitoring of cell culture performed by the system 1 will be described with reference to FIG.
- the process shown in FIG. 5 shows a method for assisting the user in monitoring the cell culture by displaying the cell number information, and is therefore an example of the cell number information display method.
- the cell number information is information including at least the number of cells, and may further include information calculated based on the number of cells.
- the system 1 includes four steps of image acquisition (step S1), first cell number acquisition (step S2), second cell number acquisition (step S3), and screen display (step S4). I'm out.
- the image acquisition step of step S1 is a step in which the control device 30 acquires a cell image obtained by capturing the cell C and generated by the imaging device 10.
- the image pickup device 10 arranged in the incubator 20 with the culture vessel 100 mounted is controlled by the control device 30, so that the control device 30 acquires the cell image without removing the culture vessel 100 from the incubator 20. It is possible to do. That is, in the system 1, a cell image can be obtained while continuing the cell culture.
- the control device 30 acquires a plurality of cell images in which the imaging device 10 sequentially images the cells.
- the control device 30 inputs each of the plurality of cell images acquired in step S1 into the first counting model, and the control device 30 outputs from the first counting model.
- This is the process of obtaining the number of cells. That is, the control device 30 acquires the output number of first cells by applying each of the plurality of cell images to the first counting model. The number of first cells is output for each cell image.
- the control device 30 inputs the cell image acquired in step S1 into the second counting model, and the control device 30 outputs the second cell number from the second counting model. Is the process of acquiring.
- control device 30 acquires the output second cell number by applying each of the same plurality of cell images as the image obtained by acquiring the first cell number to the second counting model.
- the number of second cells is output for each cell image.
- each of the first counting model and the second counting model is a model for counting the cells included in the image, and the first counting model is a model different from the second counting model.
- the first counting model is a counting model that is generally expected to be used in the above-mentioned cell culture monitoring, and is a counting model that certifies cells with a higher standard than the second counting model. In other words, it is a counting model with a high precision rate, which is an index of accuracy indicating how accurately the target object is detected.
- the second counting model is a counting model that gives priority to detecting the target object without exception, and is a counting model that certifies cells with a lower standard than the first counting model. In other words, it is a counting model with a high recall rate, which is an index of completeness indicating how comprehensively the target object is detected.
- the first counting model has a higher matching rate than the second counting model, and has a lower recall rate than the second counting model. Therefore, according to the first cell number acquisition step of step S2, it is possible to obtain a highly reliable cell number that is not overestimated.
- the second counting model has a recall rate higher than that of the first counting model and has a matching rate lower than that of the first counting model. Therefore, according to the second cell number acquisition step of step S3, the cell number can be obtained with stable accuracy during the culture period without excessively reacting to the change in cell shape.
- the reason why the use of a counting model with a high precision rate such as the first counting model is generally expected is that when the cultured cells are transplanted to a patient or transported to a customer, more cells than the desired number of cells are used. This is because it is essential that the condition that it is included is satisfied. That is, counting by the first counting model that does not count erroneous objects by counting reliable cells is desired rather than the second counting model in which the number of cells is likely to be estimated more than the actual number of cells. Is.
- the screen display step of step S4 is a step of displaying a screen for supporting the monitoring of cell culture based on the number of first cells acquired in step S2 and the number of second cells acquired in step S3 by the control device 30. is there. More specifically, the control device 30 has a correspondence relationship between at least one of the first cell number and the second cell number and the first cell number and the second cell number based on the first cell number and the second cell number. A cell number information display screen that visualizes and is generated, and the cell number information display screen is displayed on the display device. More preferably, the control device 30 determines the change in the number of first cells and the number of second cells with respect to time and the number of first cells based on the history of the number of first cells and the history of the number of second cells. A cell number information display screen that visualizes the change in the correspondence relationship of the second cell number with time is generated, and the cell number information display screen is displayed on the display device.
- At least one of the number of first cells and the number of second cells is displayed on the screen, so that the user can monitor the culture based on the number of cells. Furthermore, by displaying the correspondence between the number of first cells and the number of second cells on the screen, if the number of cells or the transition of the number of cells is different from what was expected, whether the cause is in the culture environment or not in image recognition. It is possible to isolate whether it is a defect in the image without checking the image.
- the change is different from the expected transition. It can be judged that there is a high possibility that the number of cells actually occurs, and it is unlikely that the defect in image recognition is caused by the transition.
- the tendency of the transition of the number of cells is different between the first counting model and the second counting model, especially when there is a deviation from the transition assumed in the first counting model, it is caused by a defect in image recognition. It can be judged that there is a high possibility that it is done. Therefore, according to the system 1, the opportunity to check the image in detail for isolating the cause can be reduced, so that the workload of the user can be reduced.
- FIG. 6 is a diagram for explaining an example of the flow of processing until the cell number information display screen is generated.
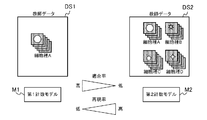
- FIG. 7 is a diagram for explaining the first counting model and the second counting model.
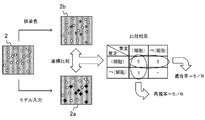
- FIG. 8 is a diagram for explaining a method for verifying the precision and recall of the counting model.
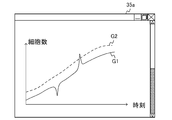
- FIG. 9 is a diagram showing an example of a cell number information display screen.
- FIG. 10 is a diagram for explaining how to isolate the cause of abnormality based on the cell number information display screen.
- a monitoring support method according to the first embodiment performed by the system 1 will be described with reference to a case where cell culture is performed on chondrocytes.
- the user support in the cell culture is realized by displaying the cell number information display screen. Therefore, the method of displaying the cell number information performed by the system 1 is a method of supporting the monitoring of the cell culture. is there.
- the control device 30 inputs the cell image 2 of the chondrocytes generated by the imaging device 10 into the first counting model M1 and the second counting model M2, and inputs the first counting model.
- the number of first cells 3 output from M1 and the number of second cells 4 output from the second counting model M2 are stored in the history unit H.
- the cell image 2 is an image of the cultured cells in the culture vessel 100 arranged in the incubator 20. By performing such a process each time the cell image 2 is input, the history 5 of the first cell number 3 and the history 6 of the second cell number 4 are accumulated in the history unit H.
- the history 5 of the first cell number 3 includes a plurality of first cell numbers 3 corresponding to the plurality of cell images 2.
- the history 6 of the second cell number 4 includes a plurality of second cell numbers 4 corresponding to the plurality of cell images 2.
- the first counting model M1 is a machine learning model using a neural network. For example, an image of the same cell type A as a cell (chondrocyte in this example) included in the cell image is used as the training data DS1. A trained machine learning model trained by.
- the second counting model M2 is a machine learning model using a neural network. For example, an image of the same cell type A as a cell (chondrocyte in this example) included in the cell image and a cell. A trained machine learning model trained by using images of cell types (cell types B, C, D) different from the cells contained in the images (chondrocytes in this example) as teacher data DS2. Is.
- the first counting model M1 that learned only cells of the same type as chondrocytes can recognize chondrocytes with stricter criteria than the second counting model M2 that learned chondrocytes and other cells. Therefore, the first counting model M1 has a higher matching rate with respect to chondrocytes than the matching rate of the second counting model M2.
- the second counting model M2 which has learned cells of various types and shapes, has a lower precision rate for counting chondrocytes than the first counting model M1, but is more in the image than the first counting model M1. The entire cell can be comprehensively recognized. Therefore, the second counting model M2 has a higher recall rate than that of the first counting model M1 for chondrocytes.
- each model can be confirmed by, for example, the method shown in FIG.
- Third, the coordinate information of the cell whose nucleus is stained is acquired from the stained image 2b, and the acquired coordinate information is compared with the coordinate information included in the output image 2a.
- Fourth, the precision and recall of the model are calculated from the comparison results.
- the matching rate was confirmed by the number of chondrocytes recognized by the model (8 in this example) and the stained image 2b among those recognized by the model as chondrocytes. It is calculated by the ratio of the number of things (5 in this example) (5/8 in this example).
- the recall was determined by the number of chondrocytes that were actually confirmed to be chondrocytes by the stained image 2b (6 in this example) and the chondrocytes among those that were actually confirmed to be chondrocytes by the stained image 2b. It is calculated by the ratio of the number of those recognized as (5 in this example) (5/6 in this example).
- the control device 30 When the number of cells is accumulated in the history unit H, the control device 30 reads out the history 5 of the number of first cells and the history 6 of the number of second cells accumulated in the history unit H and inputs them to the screen generation unit D.
- the screen 35a which is the cell number information display screen generated by the screen generation unit D, is displayed on the output device 35.
- the first graph generation process for generating the first graph G1 showing the change of the first cell number with time based on the history 5 of the first cell number, and the second graph generation process of the second cell number A second graph generation process for generating a second graph G2 showing a change in the number of second cells with time based on the history 6 is performed. Therefore, as shown in FIG. 9, the screen 35a displayed on the output device 35 includes the first graph G1 and the second graph G2. That is, when displaying the screen 35a, the control device 30 displays the first graph G1 on the output device 35 and displays the second graph G2 on the output device 35.
- the change in the correspondence between the number of first cells and the number of second cells with respect to time is also visible due to the relationship between the first graph G1 and the second graph G2. Therefore, the user who is aware of the transition of the desired number of cells can confirm whether or not the number of cells is transitioning normally by checking the screen 35a, and the cause of the abnormality is the culture environment. It is also possible to distinguish whether it is present or has a defect in image recognition.
- the first graph G1 and the second graph G2 do not show a significantly different tendency from the transition of the number of cells that should be, and transition in a certain relationship. If so, the user can determine that the cell culture has been performed normally.
- the first graph G1 and the second graph G2 do not change in a certain relationship, or at least the first graph G1 and the second graph G2.
- the user can suspect an abnormality if one shows a tendency that is significantly different from the transition of the number of cells that should be.
- the unnatural change may be judged by the change of the first graph G1 alone, or may be judged by paying attention to the relationship between the first graph G1 and the second graph G2. For example, when the first graph G1 and the second graph G2 are largely separated from each other, or when the numbers of the second cells and the numbers of the first cells are reversed, it may be determined that the change is unnatural.
- the system 1 assists the user in isolating the cause of the abnormality in the number of cells counted from the image without checking the image by performing the cell number information display method according to the present embodiment. Can be done. Therefore, it is possible to significantly reduce the work load of the user. In addition, even if the user does not know the transition of the desired number of cells, if the first graph G1 and the second graph G2 change with different tendencies, the possibility of abnormal occurrence can be easily detected. Can be recognized.
- FIG. 11 is a diagram showing another example of the cell number information display screen.
- the first graph G1 and the second graph G2 are line graphs is shown, but the type of each graph is not limited to the line graph.
- the system 1 displays a change in the number of first cells with time (first graph) and a change in the number of second cells with time (second graph) using a bar graph. You may.
- FIG. 12 is a diagram showing still another example of the cell number information display screen.
- 9 and 11 show an example of displaying both the first graph G1 and the second graph G2, but at least one of them is displayed on the cell number information display screen in order to easily confirm the change in the cell number. It should be displayed.
- the system 1 displays only the first graph G1 as shown in the screen 35c shown in FIG. 12, and the user places the pointer P on the first graph G1 so that the position of the pointer P at the time corresponding to the position of the pointer P can be changed. 2
- the number of cells may be displayed.
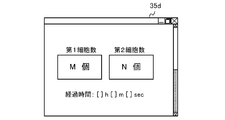
- FIG. 13 is a diagram showing still another example of the cell number information display screen.
- FIGS. 9 and 11 show an example of displaying a graph showing a change in the number of cells with respect to time
- the number of cells itself may be displayed on the cell number information display screen.
- the system 1 may display the numerical values of the number of first cells and the number of second cells side by side, for example, as shown in the screen 35d shown in FIG. In this case as well, the displayed number of first cells and the number of second cells are updated as needed, so that the user can grasp the correspondence between the number of first cells and the number of second cells and the change over time. Therefore, as in the other display examples, it is possible to isolate the cause of the abnormal cell number without checking the image.
- FIG. 14 is a diagram for explaining another example of the flow of processing until the cell number information display screen is generated.
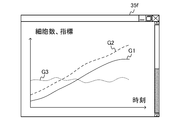
- FIG. 15 is a diagram showing still another example of the cell number information display screen.
- FIG. 16 is a diagram for explaining how to isolate the cause of abnormality based on the cell number information display screen.
- the monitoring support method according to the second embodiment performed by the system 1 will be described with reference to FIGS. 14 to 16 as an example of performing cell culture for chondrocytes.
- the present embodiment is different from the first embodiment in that the index indicating the difference in the cell recognition result between the first counting model and the second counting model is visualized.
- this index may indicate the difference in cell recognition results calculated based on the number of first cells and the number of second cells, and is, for example, the ratio of the number of first cells to the number of second cells. It may be the difference between the number of first cells and the number of second cells, or it may be the square of the difference.
- the control device 30 inputs the cell image 2 of the chondrocyte into the first counting model M1 and the second counting model M2, and the first cell output from the first counting model M1.
- the number 3 and the number 4 of the second cells output from the second counting model M2 are stored in the history unit H. Further, the control device 30 reads out the history 5 of the first cell number 3 and the history of the second cell number 4 accumulated in the history unit H and inputs them to the screen generation unit D1.
- the first graph generation process for generating the first graph G1 showing the change of the first cell number with time based on the history 5 of the first cell number, and the history 5 and the second of the first cell number An index calculation process for calculating an index at each time based on the history 6 of the number of cells and a third graph generation process for generating a third graph G3 showing a change in the index with time are performed. Therefore, the screen 35e displayed on the output device 35 includes the first graph G1 and the second graph G3 as shown in FIG. That is, when displaying the screen 35e, the control device 30 displays the first graph G1 on the output device 35 and displays the third graph G3 on the output device 35.
- the change in the correspondence between the number of first cells and the number of second cells with respect to time is also visible due to the relationship between the first graph G1 and the third graph G3. Therefore, the user who is aware of the transition of the desired number of cells can confirm whether or not the number of cells is transitioning normally by checking the screen 35e, and the cause of the abnormality is the culture environment. It is also possible to distinguish whether it is present or has a defect in image recognition.
- the first graph G1 does not show a significantly different tendency from the transition of the number of cells that should be, and the third graph G3 is, for example, within a certain range. If the trend is constant, such as when the cells are settled, the user can determine that the cell culture is normally performed.
- the third graph G3 does not change with a constant tendency, or the first graph G1 is significantly different from the change in the number of cells that should be. The user can suspect an anomaly if it shows a tendency to.
- case C3a of FIG. 16 when the first graph G1 shows an unnatural change and the third graph G3 does not fluctuate accordingly, the number of cells actually changes unnaturally. It can be judged that it is. That is, it can be determined that there is a high possibility that an abnormality caused by the culture environment has occurred. From the relationship between the first graph G1 and the third graph G3, it can be determined that the number of the second cells has an unnatural change similar to the number of the first cells. Therefore, case C3 shown in FIG. This is because it can be judged to be the same as.
- the system 1 can achieve the same effect as the case where the cell number information display method according to the first embodiment is performed by performing the cell number information display method according to the present embodiment. it can.
- FIG. 17 is a diagram showing still another example of the cell number information display screen.
- an example of displaying the first graph G1 and the third graph G3 is shown, but in the system 1, for example, as shown in the screen 35f shown in FIG. 17, the first graph G1, the second graph G2, and the third graph G3 are displayed.
- Graph G3 may be displayed.
- the system 1 may display at least one of the first graph G1 and the second graph G2 and the third graph G3, and therefore, without displaying the first graph G1, the second graph G2 and the third graph G3. May be displayed.
- the counting of cells may be performed outside the system 1.
- the number of first cells and the number of second cells may be obtained by using an external service for counting cells (cell counting service 200).
- the control device 30a included in the system 1a is the same as the control device 30 except that the number of cells is acquired from the cell count service 200 outside the system 1a.
- an example of displaying the cell number information display screen is shown, but when the user selects a specific position in the cell number information display screen, the time is acquired according to the selected position.
- the cell image may be displayed in a pop-up format, for example.
- the counting model is a machine learning model
- the image is used as training data to be used as the first counting model. Only or both the first counting model and the second counting model may be trained. This improves the suitability of the first counting model, so that the user can determine whether or not the number of cultured cells has reached the target number while maintaining the relationship between the first counting model and the second counting model. The reliability of the number of first cells used can be improved.
- the counting model is a trained machine learning model using a neural network
- the counting model is not limited to the one using a neural network, and other machine learning models. It may be. Further, it does not have to be a machine learning model, and it may be a model for counting cells based on a specific rule. For example, it may be a counting model that counts cells by using template matching, or it may be a counting model that counts cells from a binarized image. It may also be a counting model that counts cells by counting stained nuclei.
- a machine learning model and a rule-based counting model may be used in combination as long as they are used in combination with a precision-dominant counting model and a recall-dominant counting model. Further, a counting model for counting cells from a binarized image may be used as a counting model with a superior recall rate, and a counting model for counting stained nuclei may be used as a counting model with a dominant precision rate.
- colonies may be counted in addition to cells. Since a colony is a collection of cells, it is possible to recognize a colony if the cells can be recognized and the positional relationship between the cells can be recognized. By counting colonies in addition to cells, it is possible to provide users with more information about cell culture.
- the system 1 may detect the abnormality and notify the user of the detected abnormality through the screen display. For example, when the difference between the number of first cells and the number of second cells becomes larger than a certain value or smaller than another certain value, the user may be notified to that effect.
- the system 1 may display, for example, the screen 35a shown in FIG. The user who confirms the screen 35a in response to the notification can isolate the cause of the abnormality by himself / herself based on the information on the screen 35a. Further, the control device 30 may identify the cause of the abnormality and notify the user of the cause of the identified abnormality.
- the above notification may be sent by wireless communication to a smartphone, tablet computer, etc., which is a mobile terminal owned by the user.
- Wireless communication may be performed using, for example, WiFi, LTE, NFC, Bluetooth®, etc., and notifications may be transmitted via any network such as PAN, LAN, WAN, etc.
- PAN personal area network
- LAN wide area network
- Bluetooth® wireless technology
- the notification may be displayed on the screen of a computer or the like installed near the incubator or in the work room. Further, the notification may be displayed on the same screen as the screen 35a on which the graph shown in FIG. 9 is displayed.
- the control device 30 determines the cause of the abnormality based on the information used for the screen display and notifies the user. You may. For example, when the screen 35a shown in FIG. 9 is displayed, the number of the first cells has exceeded the number of the second cells, or the number of the first cells has become smaller than the number of the second cells by a certain amount or more. By detecting the above, the control device 30 may determine that the defect in image recognition is the cause of the abnormality and notify the user to that effect. The cause of the abnormality identified by the determination may be superimposed and displayed on the screen on which the graph is displayed.
- the control device 30 determines that an abnormality has occurred in the culture environment and informs the user. The fact may be notified, and the cause of the abnormality identified by the determination may be superimposed and displayed on the screen 35g on which the graph is displayed, as shown in FIG. Further, in FIG. 9, the control device 30 may superimpose the occurrence of the abnormality and the cause of the abnormality on the graph at the imaging time when it is determined that the abnormality has occurred. Further, the magnitude of the possibility of abnormality may be displayed by using, for example, a ratio.
- the magnitude of the possibility of abnormality can be estimated from, for example, the magnitude of the change in the relationship between the number of first cells and the number of second cells.
- the cause of the abnormality determined by the control device 30 may be, for example, an abnormality in the cell culture environment, an abnormality in image recognition, an abnormality in the culture environment, and an abnormality in image recognition.
- the user may isolate the cause of the abnormality by referring to the determination result (cause of the abnormality) determined by the control device 30 and the screen display.
- the occurrence and cause of an abnormality are superimposed on the graph, the user can save the trouble of estimating the cause of the abnormality by looking at the graph, and it is difficult to determine the cause of the abnormality even by looking at the number of cells due to lack of experience. Whether it is a worker or a worker who cannot be intuitively determined to be abnormal, it is possible to identify the cause of the abnormality by supporting the identification of the cause of the abnormality.
- the environment of the cell culture is monitored in real time, but the quality of the culture is confirmed by looking back on the culture by using a set of a plurality of cell images sequentially imaged during the culture period.
- the user applies the first counting model and the second counting model to a plurality of cell images that are the results of past culture to calculate the number of first cells and the number of second cells, and puts them in the culture environment at a specific imaging time. It is possible to look back on whether an abnormality has occurred or whether an image has been misrecognized.
- the user may determine the cause of the abnormality by displaying a graph or the like, or may use the control device 30 or an external cell counting service to determine the cause of the abnormality.
- the system 1 may omit the screen display process of step S4 of the process shown in FIG. 5, and instead, detect an abnormality in the culture environment based on the relationship between the number of first cells and the number of second cells. , The process of notifying the user of the occurrence of an abnormality may be performed. The notified user may further confirm the cell image to confirm the details of the abnormality.
- the difference between the counting models is explained by using the concept of the precision rate and the recall rate, but the matching rate is used by using the counting model having high specificity instead of the second counting model having a high recall rate. It may be compared with the first counting model having a high value. Specificity is an index of negative accuracy that indicates how accurately a negative determination that an observation object is not an object of interest can be made.
- the highly specific counting model does not have the function of counting cells, but has the role of noise determination, which reliably detects objects that are not target cells (dust, untargeted cells, dead cells, etc.).
- precision rate precision rate
- recall rate specificity
- specificity are used, but they are not limited to these terms as long as they have the same meaning.
- the words used to mean precision are accuracy and positive reactive value (PPV)
- the words used to mean recall are words used to mean sensitivity, true positive rate, and specificity. Has words such as true negative rate.
Abstract
L'invention concerne un procédé d'affichage d'informations de numéro de cellule comprenant les étapes suivantes : (1) acquisition d'une image de cellule ; (2) application de l'image de cellule à un premier modèle de comptage M1 et acquisition du nombre de sortie de premières cellules ; (3) application de l'image de cellule à un second modèle de comptage M2 et acquisition du nombre de sortie de secondes cellules ; et (4) affichage d'un écran sur lequel au moins l'un du nombre de premières cellules et du nombre de secondes cellules, et la correspondance entre le nombre de premières cellules et le nombre de secondes cellules sont visualisées sur la base du nombre de premières cellules et du nombre de secondes cellules. Le premier modèle de comptage M1 est différent du second modèle de comptage M2.
Priority Applications (3)
| Application Number | Priority Date | Filing Date | Title |
|---|---|---|---|
| JP2021558135A JPWO2021100191A1 (fr) | 2019-11-22 | 2019-11-22 | |
| PCT/JP2019/045735 WO2021100191A1 (fr) | 2019-11-22 | 2019-11-22 | Procédé, système et programme d'affichage d'informations de numéro de cellule |
| US17/581,364 US20220146404A1 (en) | 2019-11-22 | 2022-01-21 | Method for displaying cell count information, system, and computer-readable medium |
Applications Claiming Priority (1)
| Application Number | Priority Date | Filing Date | Title |
|---|---|---|---|
| PCT/JP2019/045735 WO2021100191A1 (fr) | 2019-11-22 | 2019-11-22 | Procédé, système et programme d'affichage d'informations de numéro de cellule |
Related Child Applications (1)
| Application Number | Title | Priority Date | Filing Date |
|---|---|---|---|
| US17/581,364 Continuation US20220146404A1 (en) | 2019-11-22 | 2022-01-21 | Method for displaying cell count information, system, and computer-readable medium |
Publications (1)
| Publication Number | Publication Date |
|---|---|
| WO2021100191A1 true WO2021100191A1 (fr) | 2021-05-27 |
Family
ID=75981564
Family Applications (1)
| Application Number | Title | Priority Date | Filing Date |
|---|---|---|---|
| PCT/JP2019/045735 WO2021100191A1 (fr) | 2019-11-22 | 2019-11-22 | Procédé, système et programme d'affichage d'informations de numéro de cellule |
Country Status (3)
| Country | Link |
|---|---|
| US (1) | US20220146404A1 (fr) |
| JP (1) | JPWO2021100191A1 (fr) |
| WO (1) | WO2021100191A1 (fr) |
Cited By (1)
| Publication number | Priority date | Publication date | Assignee | Title |
|---|---|---|---|---|
| WO2024062609A1 (fr) * | 2022-09-22 | 2024-03-28 | 日本電信電話株式会社 | Dispositif de détection d'anomalies, procédé et programme |
Citations (3)
| Publication number | Priority date | Publication date | Assignee | Title |
|---|---|---|---|---|
| JP2006340686A (ja) * | 2005-06-10 | 2006-12-21 | Olympus Corp | 細胞解析方法、細胞解析プログラムおよび細胞解析装置 |
| JP2011243188A (ja) * | 2010-04-23 | 2011-12-01 | Nagoya Univ | 画像処理装置、細胞分類装置、インキュベータ、画像処理方法、細胞分類方法、画像処理プログラムおよび細胞分類プログラム |
| JP2015091220A (ja) * | 2013-11-08 | 2015-05-14 | 東洋製罐グループホールディングス株式会社 | 細胞計数装置、細胞計数システム、細胞計数方法及び細胞計数プログラム |
-
2019
- 2019-11-22 WO PCT/JP2019/045735 patent/WO2021100191A1/fr active Application Filing
- 2019-11-22 JP JP2021558135A patent/JPWO2021100191A1/ja active Pending
-
2022
- 2022-01-21 US US17/581,364 patent/US20220146404A1/en active Pending
Patent Citations (3)
| Publication number | Priority date | Publication date | Assignee | Title |
|---|---|---|---|---|
| JP2006340686A (ja) * | 2005-06-10 | 2006-12-21 | Olympus Corp | 細胞解析方法、細胞解析プログラムおよび細胞解析装置 |
| JP2011243188A (ja) * | 2010-04-23 | 2011-12-01 | Nagoya Univ | 画像処理装置、細胞分類装置、インキュベータ、画像処理方法、細胞分類方法、画像処理プログラムおよび細胞分類プログラム |
| JP2015091220A (ja) * | 2013-11-08 | 2015-05-14 | 東洋製罐グループホールディングス株式会社 | 細胞計数装置、細胞計数システム、細胞計数方法及び細胞計数プログラム |
Cited By (1)
| Publication number | Priority date | Publication date | Assignee | Title |
|---|---|---|---|---|
| WO2024062609A1 (fr) * | 2022-09-22 | 2024-03-28 | 日本電信電話株式会社 | Dispositif de détection d'anomalies, procédé et programme |
Also Published As
| Publication number | Publication date |
|---|---|
| JPWO2021100191A1 (fr) | 2021-05-27 |
| US20220146404A1 (en) | 2022-05-12 |
Similar Documents
| Publication | Publication Date | Title |
|---|---|---|
| JP6845221B2 (ja) | プレート培地上にストリークされた試料からの自動化された微生物コロニーカウントのための方法及びシステム | |
| US9443058B2 (en) | Urine work area manager for a urine work area | |
| JP6801000B2 (ja) | 細胞画像評価装置および細胞画像評価制御プログラム | |
| JP5707399B2 (ja) | 微生物検出方法、微生物検出装置及びプログラム | |
| JP5274731B1 (ja) | 観察システム、プログラム及び観察システムの制御方法 | |
| KR20080003815A (ko) | 피부 상태 해석 방법, 피부 상태 해석 장치, 및 피부 상태해석 프로그램을 기록한 기록 매체 | |
| WO2010146802A1 (fr) | Méthode permettant de déterminer de l'état d'un amas cellulaire, programme de traitement d'image et dispositif de traitement d'image utilisant ladite méthode et méthode de production d'un amas cellulaire | |
| KR20150018523A (ko) | 검사 알고리즘 및 필터에 대한 시각적 피드백 | |
| JP6355082B2 (ja) | 病理診断支援装置及び病理診断支援方法 | |
| JP2013077127A (ja) | 画像分類装置および画像分類方法 | |
| JP2021177765A (ja) | コロニー検出システム | |
| Rhoads et al. | A review of the current state of digital plate reading of cultures in clinical microbiology | |
| US20230021099A1 (en) | Method and assistance system for checking samples for defects | |
| WO2021100191A1 (fr) | Procédé, système et programme d'affichage d'informations de numéro de cellule | |
| JP7006832B2 (ja) | 細胞解析装置 | |
| US20220020148A1 (en) | Plant monitoring server, a plant monitoring system and a plant monitoring terminal device | |
| WO2015045012A1 (fr) | Programme de contrôle de colonies, dispositif de contrôle de colonies et procédé de contrôle de colonies | |
| US20170089883A1 (en) | Cell evaluation device, method, and program | |
| TW202045898A (zh) | 解析裝置、解析方法及程式 | |
| WO2022070491A1 (fr) | Dispositif d'analyse d'image | |
| JP4646847B2 (ja) | 蛋白質結晶化観察方法及び蛋白質結晶化観察装置 | |
| JPWO2021100191A5 (fr) | ||
| WO2023195405A1 (fr) | Dispositif de détection de cellule, dispositif de support de diagnostic de cellule, procédé de détection de cellule et programme de détection de cellule | |
| US20240070537A1 (en) | Microscopy System and Method for Generating a Machine-Learned Model for Processing Microscope Data | |
| US20220164956A1 (en) | Method and system for cell isolation assistance and computer-readable medium |
Legal Events
| Date | Code | Title | Description |
|---|---|---|---|
| 121 | Ep: the epo has been informed by wipo that ep was designated in this application |
Ref document number: 19953135 Country of ref document: EP Kind code of ref document: A1 |
|
| ENP | Entry into the national phase |
Ref document number: 2021558135 Country of ref document: JP Kind code of ref document: A |
|
| NENP | Non-entry into the national phase |
Ref country code: DE |
|
| 122 | Ep: pct application non-entry in european phase |
Ref document number: 19953135 Country of ref document: EP Kind code of ref document: A1 |