WO2021100191A1 - Cell number information display method, system, and program - Google Patents
Cell number information display method, system, and program Download PDFInfo
- Publication number
- WO2021100191A1 WO2021100191A1 PCT/JP2019/045735 JP2019045735W WO2021100191A1 WO 2021100191 A1 WO2021100191 A1 WO 2021100191A1 JP 2019045735 W JP2019045735 W JP 2019045735W WO 2021100191 A1 WO2021100191 A1 WO 2021100191A1
- Authority
- WO
- WIPO (PCT)
- Prior art keywords
- cells
- cell
- displaying
- image
- counting
- Prior art date
Links
- 238000000034 method Methods 0.000 title claims abstract description 89
- 210000004027 cell Anatomy 0.000 claims description 534
- 230000005856 abnormality Effects 0.000 claims description 79
- 230000008859 change Effects 0.000 claims description 58
- 238000003384 imaging method Methods 0.000 claims description 33
- 230000008569 process Effects 0.000 claims description 27
- 238000010801 machine learning Methods 0.000 claims description 12
- 210000004748 cultured cell Anatomy 0.000 claims description 11
- 230000005859 cell recognition Effects 0.000 claims description 3
- 238000004113 cell culture Methods 0.000 description 49
- 210000001612 chondrocyte Anatomy 0.000 description 25
- 230000007704 transition Effects 0.000 description 23
- 238000012544 monitoring process Methods 0.000 description 22
- 239000002609 medium Substances 0.000 description 19
- 238000010586 diagram Methods 0.000 description 16
- 230000002159 abnormal effect Effects 0.000 description 11
- 230000007547 defect Effects 0.000 description 11
- 238000004891 communication Methods 0.000 description 10
- 230000003287 optical effect Effects 0.000 description 9
- CIWBSHSKHKDKBQ-JLAZNSOCSA-N Ascorbic acid Chemical compound OC[C@H](O)[C@H]1OC(=O)C(O)=C1O CIWBSHSKHKDKBQ-JLAZNSOCSA-N 0.000 description 6
- 230000007246 mechanism Effects 0.000 description 5
- 238000012545 processing Methods 0.000 description 5
- 238000013528 artificial neural network Methods 0.000 description 4
- 238000012258 culturing Methods 0.000 description 4
- 238000012790 confirmation Methods 0.000 description 3
- 239000000428 dust Substances 0.000 description 3
- 230000000694 effects Effects 0.000 description 3
- 238000010899 nucleation Methods 0.000 description 3
- 230000003247 decreasing effect Effects 0.000 description 2
- 230000006870 function Effects 0.000 description 2
- 230000006872 improvement Effects 0.000 description 2
- 238000002955 isolation Methods 0.000 description 2
- 230000004044 response Effects 0.000 description 2
- 238000000926 separation method Methods 0.000 description 2
- 238000013517 stratification Methods 0.000 description 2
- 238000012549 training Methods 0.000 description 2
- 210000003771 C cell Anatomy 0.000 description 1
- 230000032683 aging Effects 0.000 description 1
- 230000003698 anagen phase Effects 0.000 description 1
- 238000004364 calculation method Methods 0.000 description 1
- 244000309466 calf Species 0.000 description 1
- 239000007376 cm-medium Substances 0.000 description 1
- 230000000295 complement effect Effects 0.000 description 1
- 238000011109 contamination Methods 0.000 description 1
- 238000001914 filtration Methods 0.000 description 1
- 238000000265 homogenisation Methods 0.000 description 1
- 238000005286 illumination Methods 0.000 description 1
- 238000010191 image analysis Methods 0.000 description 1
- 238000012986 modification Methods 0.000 description 1
- 230000004048 modification Effects 0.000 description 1
- 238000003672 processing method Methods 0.000 description 1
- 230000009467 reduction Effects 0.000 description 1
- 238000012552 review Methods 0.000 description 1
- 239000004065 semiconductor Substances 0.000 description 1
- 230000035945 sensitivity Effects 0.000 description 1
- 210000002966 serum Anatomy 0.000 description 1
- 238000010186 staining Methods 0.000 description 1
- 230000001052 transient effect Effects 0.000 description 1
- 238000012559 user support system Methods 0.000 description 1
- 238000012795 verification Methods 0.000 description 1
Images


Classifications
-
- G01N15/1433—
-
- C—CHEMISTRY; METALLURGY
- C12—BIOCHEMISTRY; BEER; SPIRITS; WINE; VINEGAR; MICROBIOLOGY; ENZYMOLOGY; MUTATION OR GENETIC ENGINEERING
- C12M—APPARATUS FOR ENZYMOLOGY OR MICROBIOLOGY; APPARATUS FOR CULTURING MICROORGANISMS FOR PRODUCING BIOMASS, FOR GROWING CELLS OR FOR OBTAINING FERMENTATION OR METABOLIC PRODUCTS, i.e. BIOREACTORS OR FERMENTERS
- C12M1/00—Apparatus for enzymology or microbiology
- C12M1/34—Measuring or testing with condition measuring or sensing means, e.g. colony counters
-
- G—PHYSICS
- G01—MEASURING; TESTING
- G01N—INVESTIGATING OR ANALYSING MATERIALS BY DETERMINING THEIR CHEMICAL OR PHYSICAL PROPERTIES
- G01N15/00—Investigating characteristics of particles; Investigating permeability, pore-volume, or surface-area of porous materials
- G01N15/10—Investigating individual particles
- G01N15/14—Electro-optical investigation, e.g. flow cytometers
- G01N15/1429—Electro-optical investigation, e.g. flow cytometers using an analyser being characterised by its signal processing
-
- G—PHYSICS
- G01—MEASURING; TESTING
- G01N—INVESTIGATING OR ANALYSING MATERIALS BY DETERMINING THEIR CHEMICAL OR PHYSICAL PROPERTIES
- G01N33/00—Investigating or analysing materials by specific methods not covered by groups G01N1/00 - G01N31/00
- G01N33/48—Biological material, e.g. blood, urine; Haemocytometers
- G01N33/50—Chemical analysis of biological material, e.g. blood, urine; Testing involving biospecific ligand binding methods; Immunological testing
- G01N33/5005—Chemical analysis of biological material, e.g. blood, urine; Testing involving biospecific ligand binding methods; Immunological testing involving human or animal cells
- G01N33/5094—Chemical analysis of biological material, e.g. blood, urine; Testing involving biospecific ligand binding methods; Immunological testing involving human or animal cells for blood cell populations
-
- G—PHYSICS
- G01—MEASURING; TESTING
- G01N—INVESTIGATING OR ANALYSING MATERIALS BY DETERMINING THEIR CHEMICAL OR PHYSICAL PROPERTIES
- G01N35/00—Automatic analysis not limited to methods or materials provided for in any single one of groups G01N1/00 - G01N33/00; Handling materials therefor
- G01N35/00029—Automatic analysis not limited to methods or materials provided for in any single one of groups G01N1/00 - G01N33/00; Handling materials therefor provided with flat sample substrates, e.g. slides
- G01N35/00069—Automatic analysis not limited to methods or materials provided for in any single one of groups G01N1/00 - G01N33/00; Handling materials therefor provided with flat sample substrates, e.g. slides whereby the sample substrate is of the bio-disk type, i.e. having the format of an optical disk
-
- G—PHYSICS
- G06—COMPUTING; CALCULATING OR COUNTING
- G06N—COMPUTING ARRANGEMENTS BASED ON SPECIFIC COMPUTATIONAL MODELS
- G06N20/00—Machine learning
-
- G—PHYSICS
- G06—COMPUTING; CALCULATING OR COUNTING
- G06N—COMPUTING ARRANGEMENTS BASED ON SPECIFIC COMPUTATIONAL MODELS
- G06N3/00—Computing arrangements based on biological models
- G06N3/02—Neural networks
- G06N3/04—Architecture, e.g. interconnection topology
- G06N3/045—Combinations of networks
-
- G—PHYSICS
- G06—COMPUTING; CALCULATING OR COUNTING
- G06T—IMAGE DATA PROCESSING OR GENERATION, IN GENERAL
- G06T7/00—Image analysis
- G06T7/0002—Inspection of images, e.g. flaw detection
- G06T7/0012—Biomedical image inspection
-
- G—PHYSICS
- G06—COMPUTING; CALCULATING OR COUNTING
- G06V—IMAGE OR VIDEO RECOGNITION OR UNDERSTANDING
- G06V10/00—Arrangements for image or video recognition or understanding
- G06V10/70—Arrangements for image or video recognition or understanding using pattern recognition or machine learning
- G06V10/77—Processing image or video features in feature spaces; using data integration or data reduction, e.g. principal component analysis [PCA] or independent component analysis [ICA] or self-organising maps [SOM]; Blind source separation
- G06V10/778—Active pattern-learning, e.g. online learning of image or video features
- G06V10/7784—Active pattern-learning, e.g. online learning of image or video features based on feedback from supervisors
- G06V10/7792—Active pattern-learning, e.g. online learning of image or video features based on feedback from supervisors the supervisor being an automated module, e.g. "intelligent oracle"
-
- G—PHYSICS
- G06—COMPUTING; CALCULATING OR COUNTING
- G06V—IMAGE OR VIDEO RECOGNITION OR UNDERSTANDING
- G06V20/00—Scenes; Scene-specific elements
- G06V20/60—Type of objects
- G06V20/69—Microscopic objects, e.g. biological cells or cellular parts
- G06V20/698—Matching; Classification
-
- G—PHYSICS
- G01—MEASURING; TESTING
- G01N—INVESTIGATING OR ANALYSING MATERIALS BY DETERMINING THEIR CHEMICAL OR PHYSICAL PROPERTIES
- G01N15/00—Investigating characteristics of particles; Investigating permeability, pore-volume, or surface-area of porous materials
- G01N15/10—Investigating individual particles
- G01N2015/1006—Investigating individual particles for cytology
-
- G—PHYSICS
- G01—MEASURING; TESTING
- G01N—INVESTIGATING OR ANALYSING MATERIALS BY DETERMINING THEIR CHEMICAL OR PHYSICAL PROPERTIES
- G01N15/00—Investigating characteristics of particles; Investigating permeability, pore-volume, or surface-area of porous materials
- G01N15/10—Investigating individual particles
- G01N15/14—Electro-optical investigation, e.g. flow cytometers
- G01N2015/1486—Counting the particles
-
- G—PHYSICS
- G06—COMPUTING; CALCULATING OR COUNTING
- G06N—COMPUTING ARRANGEMENTS BASED ON SPECIFIC COMPUTATIONAL MODELS
- G06N3/00—Computing arrangements based on biological models
- G06N3/02—Neural networks
- G06N3/08—Learning methods
-
- G—PHYSICS
- G06—COMPUTING; CALCULATING OR COUNTING
- G06T—IMAGE DATA PROCESSING OR GENERATION, IN GENERAL
- G06T2207/00—Indexing scheme for image analysis or image enhancement
- G06T2207/30—Subject of image; Context of image processing
- G06T2207/30004—Biomedical image processing
- G06T2207/30024—Cell structures in vitro; Tissue sections in vitro
-
- G—PHYSICS
- G06—COMPUTING; CALCULATING OR COUNTING
- G06T—IMAGE DATA PROCESSING OR GENERATION, IN GENERAL
- G06T2207/00—Indexing scheme for image analysis or image enhancement
- G06T2207/30—Subject of image; Context of image processing
- G06T2207/30242—Counting objects in image
Definitions
- the disclosure of this specification relates to a method, a system, and a program for displaying cell number information.
- a cell counting method As a cell counting method, a method of counting cells by a human using a cell counting plate, a method of counting cells flowed in a row using a flow cytometer, and a method of counting cells from an image by analyzing a cell image. How to do it is known. Since the method of counting cells from an image can be performed even during culturing, it is suitable for applications such as counting cells in culturing and monitoring the culture state.
- Patent Document 1 states that "the process of cell counting by performing various image processing methods such as binarization, background homogenization, standardization and filtering to enhance the appearance of cells in the survey data. ”And so on.
- the cell culture worker Since the cell culture worker is generally aware of the desired transition in the number of cells, it is possible to detect that the transition in the number of cells is different from what is expected by monitoring the number of cells in the culture. However, it is not easy to identify the cause of the detected abnormality.
- an object of one aspect of the present invention is to provide a technique for supporting the isolation of the cause of an abnormality in the number of cells counted from an image without confirming the image.
- the method according to one aspect of the present invention is a method for displaying cell number information, which includes a step of acquiring a plurality of cell images in which cells are sequentially imaged and a first counting model for counting cells included in the images.
- a step of displaying a screen that visualizes at least one of the first cell number and the second cell number, and the correspondence between the first cell number and the second cell number based on the number of cells is included. ..
- a method is a method for displaying cell number information, which is a step of acquiring a plurality of cell images in which cells are sequentially imaged, and a first counting model for counting cells included in the images.
- the first counting model has a matching rate higher than the matching rate of the second counting model.
- the system according to one aspect of the present invention is a system including an electric circuit, in which the electric circuit acquires a plurality of cell images in which cells are sequentially imaged from an imaging device and counts the cells contained in the image.
- the number of first cells output by applying each of the plurality of cell images to one counting model is obtained, and here, the first counting model has a higher matching rate than the matching rate of the second counting model.
- the plurality of cell images which have a recall rate lower than the recall rate of the second counting model and which is the same as the image obtained by acquiring the first cell number in the second counting model for counting the cells contained in the image.
- Each is applied to obtain the output second cell number, and the first cell number and the second cell number are based on the first cell number and the second cell number in the second counting model.
- a screen that visualizes at least one of them and the correspondence between the number of the first cells and the number of the second cells is displayed on the display device.
- the system is a system including an electric circuit, in which the electric circuit acquires a plurality of cell images in which cells are sequentially imaged from an imaging device and counts the cells contained in the images.
- the number of first cells output by applying each of the plurality of cell images to the first counting model is obtained, and here, the first counting model has a higher matching rate than the matching rate of the second counting model.
- a computer obtains a cell image in which cells are imaged from an imaging device, inputs the cell image into a first counting model for counting cells included in the image, and then inputs the cell image to the computer.
- the first counting model has a higher matching rate than the second counting model and a lower recall rate than the second counting model, and counts the cells contained in the image.
- the number of first cells output by inputting the cell image into the counting model and inputting the cell image into the first counting model and the output by inputting the cell image into the second counting model.
- a process of displaying a screen that visualizes at least one of the number of the first cell and the number of the second cell and the correspondence between the number of the first cell and the number of the second cell is executed. It is a computer-readable medium that records the program to be made.
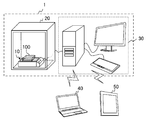
- FIG. 1 is a diagram for explaining a cell culture procedure.
- the work performed by the operator in the cell culture in which the cultured cells prepared in advance are grown to the target number will be described with reference to FIG.
- the worker first seeds the cultured cells in the culture vessel, then arranges the culture vessel on the imaging device in the incubator and starts cell culture. After the start of cell culture, the operator monitors the cell culture by confirming the number of cells counted from the cell image acquired by the imaging device and, if necessary, also confirming the cell image.
- the operator may determine whether the seeding density is appropriate from the number of cells immediately after the start of culturing, and adjust the seeding density to be the recommended seeding density recommended by the protocol. Further, in the logarithmic growth phase, the worker may exchange the medium at a frequency according to the cell density as grasped from the number of cells, and if the cell density exceeds a predetermined value, the passage is performed. You may go.
- the cell culture is stopped or restarted.
- the worker determines that the cell culture has proceeded smoothly and the number of cultured cells has reached the target number, the cell culture is completed.
- the number of cells in cell culture and its transition are important information for successful cell culture. It is positioned as.
- the number of cells obtained from the counting model is an abnormal transition different from the original transition of the number of cells. Is more likely to indicate.
- the shape change referred to here includes not only the shape change due to the actual deformation of the cell, but also the apparent shape change of the cell appearing on the image caused by, for example, layering of the cell. For example, in the case of a model with strict certification criteria, if the shape of cells changes even a little, it may be recognized as deviating from the standard shape provided by the counting model, and the cells may not be counted.
- the number of cells may be less than the original number of cells. Both shape changes are the same in that they are not abnormal events in cell culture.
- counting models commonly used in cell culture monitoring generally provide a reliable cell number that is not overestimated by their high accreditation criteria, while at the same time possible abnormalities in the culture process.
- Abnormal events can cause abnormal changes in cell number.
- the abnormal transition that is, whether the deviation from the expected transition is a true abnormality caused by the culture environment or a fake abnormality caused by a defect in the image recognition of the counting model is output from the counting model. It is difficult to separate from only the number of cells.
- FIG. 2 is a diagram illustrating the configuration of the cell culture monitoring system.
- FIG. 3 is a diagram illustrating the configuration of the imaging device.
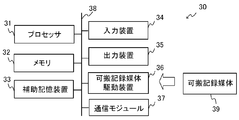
- FIG. 4 is a diagram illustrating the physical configuration of the control device.
- the configuration of the system 1 shown in FIG. 2 will be described with reference to FIGS. 2 to 4.
- System 1 is a cell culture monitoring system for acquiring an image of a cultured cell while culturing the cultured cell in a controlled environment in the incubator 20 and monitoring the cell culture based on the image.
- the system 1 includes an imaging device 10 placed in the incubator 20 and a control device 30.
- the control device 30 counts cells based on the image acquired by the imaging device 10, and uses the obtained number of cells to support the user in monitoring the cell culture. Further, the control device 30 communicates with the image pickup device 10 and the client terminal (client terminal 40, client terminal 50).
- the system 1 may include an incubator 20 and a client terminal.
- a culture container 100 is placed on the image pickup apparatus 10 arranged in the incubator 20.
- the culture vessel 100 is not particularly limited, and is, for example, a Petri dish, a flask, a microplate, or the like.
- the culture container 100 contains cells C, which are cultured cells, together with the medium CM.
- the medium CM is, for example, calf serum
- the cell C is, for example, chondrocytes.
- the imaging device 10 generates an image of the cell C (hereinafter referred to as a cell image) by imaging the cell C housed in the culture container 100.
- the image pickup device 10 transmits the generated image to the control device 30.
- the communication between the image pickup device 10 and the control device 30 may be wired communication or wireless communication.
- the imaging method is, for example, phase difference observation, differential interference contrast observation, oblique illumination observation, and the like, and is not particularly limited as long as individual cells can be imaged.
- the imaging device 10 includes a housing 11 and a stage 12 on which the culture container 100 is placed.
- the image pickup apparatus 10 further includes an image pickup unit 13 and a scanning mechanism 16 for moving the image pickup unit 13 inside the housing 11 below the stage 12.
- the image pickup unit 13 is provided with an image pickup element 14, a light source 15, an optical system (not shown), and the like.
- the image sensor 14 is, for example, a CCD (Charge-Coupled Device) image sensor, a CMOS (Complementary MOS) image sensor, or the like.
- the light source 15 is, for example, a light emitting diode (LED) or the like, and illuminates the culture vessel 100 from below the stage 12.
- the light sources 15 may be placed facing each other with the image sensor 14 in between. Further, the light source 15 may emit white light. In order to reduce damage to cells, it is desirable to use R (red) light having a long wavelength.
- Each of the light sources 15 can be any of R (red), G (green), and B (blue) by switching light having three wavelengths of R (red), G (green), and B (blue), for example.
- Light of that wavelength may be selectively emitted.
- the light emitted from the light source 15 passes through the bottom surface of the culture container 100, and a part of the light reflected on the upper surface of the culture container 100 passes through the cells C in the culture container 100.
- the optical system forms an optical image of the cells C on the image pickup device 14 by using the light transmitted through the cells C in the culture vessel 100.
- the scanning mechanism 16 includes, for example, a drive source such as a motor, and moves the image pickup unit 13 in a direction (XY directions) orthogonal to the optical axis of the optical system.
- the scanning mechanism 16 moves the imaging unit 13 in the XY directions, so that the imaging device 10 can change the range of the imaging target.
- the scanning mechanism 16 may further move the imaging unit 13 in the optical axis direction (Z direction) of the optical system, and the imaging device 10 may adjust the focus position by using the scanning mechanism 16. Further, the image pickup apparatus 10 may adjust the focus position by moving at least one of the lenses included in the optical system in the optical axis direction.
- the control device 30 is a computer that controls the system 1. As shown in FIG. 4, the control device 30 is a portable recording medium driving device that drives a processor 31, a memory 32, an auxiliary storage device 33, an input device 34, an output device 35, and a portable recording medium 39. It includes 36, a communication module 37, and a bus 38.
- the auxiliary storage device 33 and the portable recording medium 39 are examples of non-transient computer-readable recording media on which programs are recorded.
- the processor 31 is, for example, an electric circuit (circuitry) including a CPU (Central Processing Unit), a GPU (Graphics Processing Unit), and the like.
- the processor 31 expands the program stored in the auxiliary storage device 33 or the portable recording medium 39 into the memory 32, and then executes the program to perform programmed processing such as a cell information display method described later.
- the memory 32 is, for example, an arbitrary semiconductor memory such as a RAM (Random Access Memory).
- the memory 32 functions as a work memory for storing the program or data stored in the auxiliary storage device 33 or the portable recording medium 39 when the program is executed.
- the auxiliary storage device 33 is, for example, a non-volatile memory such as a hard disk or a flash memory.
- the auxiliary storage device 33 is mainly used for storing various data and programs.
- the portable recording medium drive device 36 accommodates the portable recording medium 39.
- the portable recording medium driving device 36 can output the data stored in the memory 32 or the auxiliary storage device 33 to the portable recording medium 39, and reads out programs, data, and the like from the portable recording medium 39. Can be done.
- the portable recording medium 39 is any portable recording medium.
- the portable recording medium 39 includes, for example, an SD card, a USB (Universal Serial Bus) flash memory, a CD (Compact Disc), a DVD (Digital Versatile Disc), and the like.
- the input device 34 is a keyboard, a mouse, or the like.
- the output device 35 is a display device, a printer, or the like.
- the communication module 37 is, for example, a wired communication module that communicates with the image pickup apparatus 10 connected via an external port.
- the communication module 37 may be a wireless communication module.
- the bus 38 connects the processor 31, the memory 32, the auxiliary storage device 33, and the like to each other so that data can be exchanged.
- the configuration shown in FIG. 4 is an example of the hardware configuration of the control device 30.
- the control device 30 is not limited to this configuration.
- the control device 30 may be a general-purpose device or a dedicated device.
- the control device 30 may include, for example, a specially designed electric circuit, for example, an ASIC (Application Specific Integrated Circuit) or the like. Further, the control device 30 may be configured by using an FPGA (Field-Programmable Gate Array).
- the control device 30 transmits an imaging instruction to the imaging device 10. Further, the control device 30 receives an image generated by the image pickup device 10 taking an image of the cell C. Further, the control device 30 counts the cells C included in the image and calculates the number of cells based on the image of the cells C acquired from the imaging device 10. More specifically, cell C is counted using two different counting models to calculate two cell numbers (first cell number, second cell number).
- the control device 30 provides the user with a screen for assisting in monitoring the cell culture using the number of those cells. Specifically, the control device 30 may display, for example, a screen for supporting the monitoring of cell culture on the display device which is the output device 35.
- the client terminal 40 is a notebook computer.
- the client terminal 50 is a tablet computer.
- the control device 30 may output screen information to the client terminal in response to a request from the client terminal (client terminal 40, client terminal 50).
- the client terminal may be provided with a display unit, and may be, for example, a desktop computer or a smartphone.
- FIG. 5 is a flowchart showing an example of a cell culture monitoring support method.
- a method of supporting the monitoring of cell culture performed by the system 1 will be described with reference to FIG.
- the process shown in FIG. 5 shows a method for assisting the user in monitoring the cell culture by displaying the cell number information, and is therefore an example of the cell number information display method.
- the cell number information is information including at least the number of cells, and may further include information calculated based on the number of cells.
- the system 1 includes four steps of image acquisition (step S1), first cell number acquisition (step S2), second cell number acquisition (step S3), and screen display (step S4). I'm out.
- the image acquisition step of step S1 is a step in which the control device 30 acquires a cell image obtained by capturing the cell C and generated by the imaging device 10.
- the image pickup device 10 arranged in the incubator 20 with the culture vessel 100 mounted is controlled by the control device 30, so that the control device 30 acquires the cell image without removing the culture vessel 100 from the incubator 20. It is possible to do. That is, in the system 1, a cell image can be obtained while continuing the cell culture.
- the control device 30 acquires a plurality of cell images in which the imaging device 10 sequentially images the cells.
- the control device 30 inputs each of the plurality of cell images acquired in step S1 into the first counting model, and the control device 30 outputs from the first counting model.
- This is the process of obtaining the number of cells. That is, the control device 30 acquires the output number of first cells by applying each of the plurality of cell images to the first counting model. The number of first cells is output for each cell image.
- the control device 30 inputs the cell image acquired in step S1 into the second counting model, and the control device 30 outputs the second cell number from the second counting model. Is the process of acquiring.
- control device 30 acquires the output second cell number by applying each of the same plurality of cell images as the image obtained by acquiring the first cell number to the second counting model.
- the number of second cells is output for each cell image.
- each of the first counting model and the second counting model is a model for counting the cells included in the image, and the first counting model is a model different from the second counting model.
- the first counting model is a counting model that is generally expected to be used in the above-mentioned cell culture monitoring, and is a counting model that certifies cells with a higher standard than the second counting model. In other words, it is a counting model with a high precision rate, which is an index of accuracy indicating how accurately the target object is detected.
- the second counting model is a counting model that gives priority to detecting the target object without exception, and is a counting model that certifies cells with a lower standard than the first counting model. In other words, it is a counting model with a high recall rate, which is an index of completeness indicating how comprehensively the target object is detected.
- the first counting model has a higher matching rate than the second counting model, and has a lower recall rate than the second counting model. Therefore, according to the first cell number acquisition step of step S2, it is possible to obtain a highly reliable cell number that is not overestimated.
- the second counting model has a recall rate higher than that of the first counting model and has a matching rate lower than that of the first counting model. Therefore, according to the second cell number acquisition step of step S3, the cell number can be obtained with stable accuracy during the culture period without excessively reacting to the change in cell shape.
- the reason why the use of a counting model with a high precision rate such as the first counting model is generally expected is that when the cultured cells are transplanted to a patient or transported to a customer, more cells than the desired number of cells are used. This is because it is essential that the condition that it is included is satisfied. That is, counting by the first counting model that does not count erroneous objects by counting reliable cells is desired rather than the second counting model in which the number of cells is likely to be estimated more than the actual number of cells. Is.
- the screen display step of step S4 is a step of displaying a screen for supporting the monitoring of cell culture based on the number of first cells acquired in step S2 and the number of second cells acquired in step S3 by the control device 30. is there. More specifically, the control device 30 has a correspondence relationship between at least one of the first cell number and the second cell number and the first cell number and the second cell number based on the first cell number and the second cell number. A cell number information display screen that visualizes and is generated, and the cell number information display screen is displayed on the display device. More preferably, the control device 30 determines the change in the number of first cells and the number of second cells with respect to time and the number of first cells based on the history of the number of first cells and the history of the number of second cells. A cell number information display screen that visualizes the change in the correspondence relationship of the second cell number with time is generated, and the cell number information display screen is displayed on the display device.
- At least one of the number of first cells and the number of second cells is displayed on the screen, so that the user can monitor the culture based on the number of cells. Furthermore, by displaying the correspondence between the number of first cells and the number of second cells on the screen, if the number of cells or the transition of the number of cells is different from what was expected, whether the cause is in the culture environment or not in image recognition. It is possible to isolate whether it is a defect in the image without checking the image.
- the change is different from the expected transition. It can be judged that there is a high possibility that the number of cells actually occurs, and it is unlikely that the defect in image recognition is caused by the transition.
- the tendency of the transition of the number of cells is different between the first counting model and the second counting model, especially when there is a deviation from the transition assumed in the first counting model, it is caused by a defect in image recognition. It can be judged that there is a high possibility that it is done. Therefore, according to the system 1, the opportunity to check the image in detail for isolating the cause can be reduced, so that the workload of the user can be reduced.
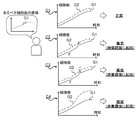
- FIG. 6 is a diagram for explaining an example of the flow of processing until the cell number information display screen is generated.
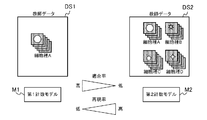
- FIG. 7 is a diagram for explaining the first counting model and the second counting model.
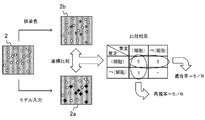
- FIG. 8 is a diagram for explaining a method for verifying the precision and recall of the counting model.
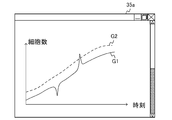
- FIG. 9 is a diagram showing an example of a cell number information display screen.
- FIG. 10 is a diagram for explaining how to isolate the cause of abnormality based on the cell number information display screen.
- a monitoring support method according to the first embodiment performed by the system 1 will be described with reference to a case where cell culture is performed on chondrocytes.
- the user support in the cell culture is realized by displaying the cell number information display screen. Therefore, the method of displaying the cell number information performed by the system 1 is a method of supporting the monitoring of the cell culture. is there.
- the control device 30 inputs the cell image 2 of the chondrocytes generated by the imaging device 10 into the first counting model M1 and the second counting model M2, and inputs the first counting model.
- the number of first cells 3 output from M1 and the number of second cells 4 output from the second counting model M2 are stored in the history unit H.
- the cell image 2 is an image of the cultured cells in the culture vessel 100 arranged in the incubator 20. By performing such a process each time the cell image 2 is input, the history 5 of the first cell number 3 and the history 6 of the second cell number 4 are accumulated in the history unit H.
- the history 5 of the first cell number 3 includes a plurality of first cell numbers 3 corresponding to the plurality of cell images 2.
- the history 6 of the second cell number 4 includes a plurality of second cell numbers 4 corresponding to the plurality of cell images 2.
- the first counting model M1 is a machine learning model using a neural network. For example, an image of the same cell type A as a cell (chondrocyte in this example) included in the cell image is used as the training data DS1. A trained machine learning model trained by.
- the second counting model M2 is a machine learning model using a neural network. For example, an image of the same cell type A as a cell (chondrocyte in this example) included in the cell image and a cell. A trained machine learning model trained by using images of cell types (cell types B, C, D) different from the cells contained in the images (chondrocytes in this example) as teacher data DS2. Is.
- the first counting model M1 that learned only cells of the same type as chondrocytes can recognize chondrocytes with stricter criteria than the second counting model M2 that learned chondrocytes and other cells. Therefore, the first counting model M1 has a higher matching rate with respect to chondrocytes than the matching rate of the second counting model M2.
- the second counting model M2 which has learned cells of various types and shapes, has a lower precision rate for counting chondrocytes than the first counting model M1, but is more in the image than the first counting model M1. The entire cell can be comprehensively recognized. Therefore, the second counting model M2 has a higher recall rate than that of the first counting model M1 for chondrocytes.
- each model can be confirmed by, for example, the method shown in FIG.
- Third, the coordinate information of the cell whose nucleus is stained is acquired from the stained image 2b, and the acquired coordinate information is compared with the coordinate information included in the output image 2a.
- Fourth, the precision and recall of the model are calculated from the comparison results.
- the matching rate was confirmed by the number of chondrocytes recognized by the model (8 in this example) and the stained image 2b among those recognized by the model as chondrocytes. It is calculated by the ratio of the number of things (5 in this example) (5/8 in this example).
- the recall was determined by the number of chondrocytes that were actually confirmed to be chondrocytes by the stained image 2b (6 in this example) and the chondrocytes among those that were actually confirmed to be chondrocytes by the stained image 2b. It is calculated by the ratio of the number of those recognized as (5 in this example) (5/6 in this example).
- the control device 30 When the number of cells is accumulated in the history unit H, the control device 30 reads out the history 5 of the number of first cells and the history 6 of the number of second cells accumulated in the history unit H and inputs them to the screen generation unit D.
- the screen 35a which is the cell number information display screen generated by the screen generation unit D, is displayed on the output device 35.
- the first graph generation process for generating the first graph G1 showing the change of the first cell number with time based on the history 5 of the first cell number, and the second graph generation process of the second cell number A second graph generation process for generating a second graph G2 showing a change in the number of second cells with time based on the history 6 is performed. Therefore, as shown in FIG. 9, the screen 35a displayed on the output device 35 includes the first graph G1 and the second graph G2. That is, when displaying the screen 35a, the control device 30 displays the first graph G1 on the output device 35 and displays the second graph G2 on the output device 35.
- the change in the correspondence between the number of first cells and the number of second cells with respect to time is also visible due to the relationship between the first graph G1 and the second graph G2. Therefore, the user who is aware of the transition of the desired number of cells can confirm whether or not the number of cells is transitioning normally by checking the screen 35a, and the cause of the abnormality is the culture environment. It is also possible to distinguish whether it is present or has a defect in image recognition.
- the first graph G1 and the second graph G2 do not show a significantly different tendency from the transition of the number of cells that should be, and transition in a certain relationship. If so, the user can determine that the cell culture has been performed normally.
- the first graph G1 and the second graph G2 do not change in a certain relationship, or at least the first graph G1 and the second graph G2.
- the user can suspect an abnormality if one shows a tendency that is significantly different from the transition of the number of cells that should be.
- the unnatural change may be judged by the change of the first graph G1 alone, or may be judged by paying attention to the relationship between the first graph G1 and the second graph G2. For example, when the first graph G1 and the second graph G2 are largely separated from each other, or when the numbers of the second cells and the numbers of the first cells are reversed, it may be determined that the change is unnatural.
- the system 1 assists the user in isolating the cause of the abnormality in the number of cells counted from the image without checking the image by performing the cell number information display method according to the present embodiment. Can be done. Therefore, it is possible to significantly reduce the work load of the user. In addition, even if the user does not know the transition of the desired number of cells, if the first graph G1 and the second graph G2 change with different tendencies, the possibility of abnormal occurrence can be easily detected. Can be recognized.
- FIG. 11 is a diagram showing another example of the cell number information display screen.
- the first graph G1 and the second graph G2 are line graphs is shown, but the type of each graph is not limited to the line graph.
- the system 1 displays a change in the number of first cells with time (first graph) and a change in the number of second cells with time (second graph) using a bar graph. You may.
- FIG. 12 is a diagram showing still another example of the cell number information display screen.
- 9 and 11 show an example of displaying both the first graph G1 and the second graph G2, but at least one of them is displayed on the cell number information display screen in order to easily confirm the change in the cell number. It should be displayed.
- the system 1 displays only the first graph G1 as shown in the screen 35c shown in FIG. 12, and the user places the pointer P on the first graph G1 so that the position of the pointer P at the time corresponding to the position of the pointer P can be changed. 2
- the number of cells may be displayed.
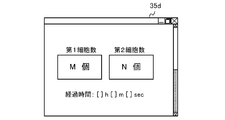
- FIG. 13 is a diagram showing still another example of the cell number information display screen.
- FIGS. 9 and 11 show an example of displaying a graph showing a change in the number of cells with respect to time
- the number of cells itself may be displayed on the cell number information display screen.
- the system 1 may display the numerical values of the number of first cells and the number of second cells side by side, for example, as shown in the screen 35d shown in FIG. In this case as well, the displayed number of first cells and the number of second cells are updated as needed, so that the user can grasp the correspondence between the number of first cells and the number of second cells and the change over time. Therefore, as in the other display examples, it is possible to isolate the cause of the abnormal cell number without checking the image.
- FIG. 14 is a diagram for explaining another example of the flow of processing until the cell number information display screen is generated.
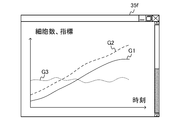
- FIG. 15 is a diagram showing still another example of the cell number information display screen.
- FIG. 16 is a diagram for explaining how to isolate the cause of abnormality based on the cell number information display screen.
- the monitoring support method according to the second embodiment performed by the system 1 will be described with reference to FIGS. 14 to 16 as an example of performing cell culture for chondrocytes.
- the present embodiment is different from the first embodiment in that the index indicating the difference in the cell recognition result between the first counting model and the second counting model is visualized.
- this index may indicate the difference in cell recognition results calculated based on the number of first cells and the number of second cells, and is, for example, the ratio of the number of first cells to the number of second cells. It may be the difference between the number of first cells and the number of second cells, or it may be the square of the difference.
- the control device 30 inputs the cell image 2 of the chondrocyte into the first counting model M1 and the second counting model M2, and the first cell output from the first counting model M1.
- the number 3 and the number 4 of the second cells output from the second counting model M2 are stored in the history unit H. Further, the control device 30 reads out the history 5 of the first cell number 3 and the history of the second cell number 4 accumulated in the history unit H and inputs them to the screen generation unit D1.
- the first graph generation process for generating the first graph G1 showing the change of the first cell number with time based on the history 5 of the first cell number, and the history 5 and the second of the first cell number An index calculation process for calculating an index at each time based on the history 6 of the number of cells and a third graph generation process for generating a third graph G3 showing a change in the index with time are performed. Therefore, the screen 35e displayed on the output device 35 includes the first graph G1 and the second graph G3 as shown in FIG. That is, when displaying the screen 35e, the control device 30 displays the first graph G1 on the output device 35 and displays the third graph G3 on the output device 35.
- the change in the correspondence between the number of first cells and the number of second cells with respect to time is also visible due to the relationship between the first graph G1 and the third graph G3. Therefore, the user who is aware of the transition of the desired number of cells can confirm whether or not the number of cells is transitioning normally by checking the screen 35e, and the cause of the abnormality is the culture environment. It is also possible to distinguish whether it is present or has a defect in image recognition.
- the first graph G1 does not show a significantly different tendency from the transition of the number of cells that should be, and the third graph G3 is, for example, within a certain range. If the trend is constant, such as when the cells are settled, the user can determine that the cell culture is normally performed.
- the third graph G3 does not change with a constant tendency, or the first graph G1 is significantly different from the change in the number of cells that should be. The user can suspect an anomaly if it shows a tendency to.
- case C3a of FIG. 16 when the first graph G1 shows an unnatural change and the third graph G3 does not fluctuate accordingly, the number of cells actually changes unnaturally. It can be judged that it is. That is, it can be determined that there is a high possibility that an abnormality caused by the culture environment has occurred. From the relationship between the first graph G1 and the third graph G3, it can be determined that the number of the second cells has an unnatural change similar to the number of the first cells. Therefore, case C3 shown in FIG. This is because it can be judged to be the same as.
- the system 1 can achieve the same effect as the case where the cell number information display method according to the first embodiment is performed by performing the cell number information display method according to the present embodiment. it can.
- FIG. 17 is a diagram showing still another example of the cell number information display screen.
- an example of displaying the first graph G1 and the third graph G3 is shown, but in the system 1, for example, as shown in the screen 35f shown in FIG. 17, the first graph G1, the second graph G2, and the third graph G3 are displayed.
- Graph G3 may be displayed.
- the system 1 may display at least one of the first graph G1 and the second graph G2 and the third graph G3, and therefore, without displaying the first graph G1, the second graph G2 and the third graph G3. May be displayed.
- the counting of cells may be performed outside the system 1.
- the number of first cells and the number of second cells may be obtained by using an external service for counting cells (cell counting service 200).
- the control device 30a included in the system 1a is the same as the control device 30 except that the number of cells is acquired from the cell count service 200 outside the system 1a.
- an example of displaying the cell number information display screen is shown, but when the user selects a specific position in the cell number information display screen, the time is acquired according to the selected position.
- the cell image may be displayed in a pop-up format, for example.
- the counting model is a machine learning model
- the image is used as training data to be used as the first counting model. Only or both the first counting model and the second counting model may be trained. This improves the suitability of the first counting model, so that the user can determine whether or not the number of cultured cells has reached the target number while maintaining the relationship between the first counting model and the second counting model. The reliability of the number of first cells used can be improved.
- the counting model is a trained machine learning model using a neural network
- the counting model is not limited to the one using a neural network, and other machine learning models. It may be. Further, it does not have to be a machine learning model, and it may be a model for counting cells based on a specific rule. For example, it may be a counting model that counts cells by using template matching, or it may be a counting model that counts cells from a binarized image. It may also be a counting model that counts cells by counting stained nuclei.
- a machine learning model and a rule-based counting model may be used in combination as long as they are used in combination with a precision-dominant counting model and a recall-dominant counting model. Further, a counting model for counting cells from a binarized image may be used as a counting model with a superior recall rate, and a counting model for counting stained nuclei may be used as a counting model with a dominant precision rate.
- colonies may be counted in addition to cells. Since a colony is a collection of cells, it is possible to recognize a colony if the cells can be recognized and the positional relationship between the cells can be recognized. By counting colonies in addition to cells, it is possible to provide users with more information about cell culture.
- the system 1 may detect the abnormality and notify the user of the detected abnormality through the screen display. For example, when the difference between the number of first cells and the number of second cells becomes larger than a certain value or smaller than another certain value, the user may be notified to that effect.
- the system 1 may display, for example, the screen 35a shown in FIG. The user who confirms the screen 35a in response to the notification can isolate the cause of the abnormality by himself / herself based on the information on the screen 35a. Further, the control device 30 may identify the cause of the abnormality and notify the user of the cause of the identified abnormality.
- the above notification may be sent by wireless communication to a smartphone, tablet computer, etc., which is a mobile terminal owned by the user.
- Wireless communication may be performed using, for example, WiFi, LTE, NFC, Bluetooth®, etc., and notifications may be transmitted via any network such as PAN, LAN, WAN, etc.
- PAN personal area network
- LAN wide area network
- Bluetooth® wireless technology
- the notification may be displayed on the screen of a computer or the like installed near the incubator or in the work room. Further, the notification may be displayed on the same screen as the screen 35a on which the graph shown in FIG. 9 is displayed.
- the control device 30 determines the cause of the abnormality based on the information used for the screen display and notifies the user. You may. For example, when the screen 35a shown in FIG. 9 is displayed, the number of the first cells has exceeded the number of the second cells, or the number of the first cells has become smaller than the number of the second cells by a certain amount or more. By detecting the above, the control device 30 may determine that the defect in image recognition is the cause of the abnormality and notify the user to that effect. The cause of the abnormality identified by the determination may be superimposed and displayed on the screen on which the graph is displayed.
- the control device 30 determines that an abnormality has occurred in the culture environment and informs the user. The fact may be notified, and the cause of the abnormality identified by the determination may be superimposed and displayed on the screen 35g on which the graph is displayed, as shown in FIG. Further, in FIG. 9, the control device 30 may superimpose the occurrence of the abnormality and the cause of the abnormality on the graph at the imaging time when it is determined that the abnormality has occurred. Further, the magnitude of the possibility of abnormality may be displayed by using, for example, a ratio.
- the magnitude of the possibility of abnormality can be estimated from, for example, the magnitude of the change in the relationship between the number of first cells and the number of second cells.
- the cause of the abnormality determined by the control device 30 may be, for example, an abnormality in the cell culture environment, an abnormality in image recognition, an abnormality in the culture environment, and an abnormality in image recognition.
- the user may isolate the cause of the abnormality by referring to the determination result (cause of the abnormality) determined by the control device 30 and the screen display.
- the occurrence and cause of an abnormality are superimposed on the graph, the user can save the trouble of estimating the cause of the abnormality by looking at the graph, and it is difficult to determine the cause of the abnormality even by looking at the number of cells due to lack of experience. Whether it is a worker or a worker who cannot be intuitively determined to be abnormal, it is possible to identify the cause of the abnormality by supporting the identification of the cause of the abnormality.
- the environment of the cell culture is monitored in real time, but the quality of the culture is confirmed by looking back on the culture by using a set of a plurality of cell images sequentially imaged during the culture period.
- the user applies the first counting model and the second counting model to a plurality of cell images that are the results of past culture to calculate the number of first cells and the number of second cells, and puts them in the culture environment at a specific imaging time. It is possible to look back on whether an abnormality has occurred or whether an image has been misrecognized.
- the user may determine the cause of the abnormality by displaying a graph or the like, or may use the control device 30 or an external cell counting service to determine the cause of the abnormality.
- the system 1 may omit the screen display process of step S4 of the process shown in FIG. 5, and instead, detect an abnormality in the culture environment based on the relationship between the number of first cells and the number of second cells. , The process of notifying the user of the occurrence of an abnormality may be performed. The notified user may further confirm the cell image to confirm the details of the abnormality.
- the difference between the counting models is explained by using the concept of the precision rate and the recall rate, but the matching rate is used by using the counting model having high specificity instead of the second counting model having a high recall rate. It may be compared with the first counting model having a high value. Specificity is an index of negative accuracy that indicates how accurately a negative determination that an observation object is not an object of interest can be made.
- the highly specific counting model does not have the function of counting cells, but has the role of noise determination, which reliably detects objects that are not target cells (dust, untargeted cells, dead cells, etc.).
- precision rate precision rate
- recall rate specificity
- specificity are used, but they are not limited to these terms as long as they have the same meaning.
- the words used to mean precision are accuracy and positive reactive value (PPV)
- the words used to mean recall are words used to mean sensitivity, true positive rate, and specificity. Has words such as true negative rate.
Abstract
Provided is a cell number information display method including: a step (S1) for acquiring a cell image; a step (S2) for applying the cell image to a first counting model M1 and acquiring the output number of first cells; a step (S3) for applying the cell image to a second counting model M2 and acquiring the output number of second cells; and a step (S4) for displaying a screen on which at least one of the number of first cells and the number of second cells, and the correspondence between the number of first cells and the number of second cells are visualized on the basis of the number of first cells and the number of second cells. The first counting model M1 is different from the second counting model M2.
Description
本明細書の開示は、細胞数情報の表示方法、システム、及び、プログラムに関する。
The disclosure of this specification relates to a method, a system, and a program for displaying cell number information.
細胞の計数方法としては、細胞計数板を用いて細胞を人間が計数する方法、フローサイトメーターを用いて一列に流した細胞を計数する方法、細胞の画像を解析することで画像から細胞を計数する方法などが知られている。画像から細胞を計数する方法は、培養中であっても行うことができるため、培養中の細胞を計数して培養状態を監視するなどの用途に好適である。
As a cell counting method, a method of counting cells by a human using a cell counting plate, a method of counting cells flowed in a row using a flow cytometer, and a method of counting cells from an image by analyzing a cell image. How to do it is known. Since the method of counting cells from an image can be performed even during culturing, it is suitable for applications such as counting cells in culturing and monitoring the culture state.
画像から細胞を計数する方法については、例えば、特許文献1などに記載されている。特許文献1には、「2値化、バックグラウンド均一化、規格化およびフィルタリング等の種々の画像処理方法を実行して、調査データ内の細胞の外観を増強(enhance)し、細胞計数のプロセスを支援する」ことなどが記載されている。
A method of counting cells from an image is described in, for example, Patent Document 1. Patent Document 1 states that "the process of cell counting by performing various image processing methods such as binarization, background homogenization, standardization and filtering to enhance the appearance of cells in the survey data. ”And so on.
細胞培養の作業者は、一般に望ましい細胞数の推移を認識しているため、培養中の細胞数を監視することで細胞数の推移が期待するものと異なることを検出することができる。しかしながら、検出した異常の原因を特定することは容易ではない。
Since the cell culture worker is generally aware of the desired transition in the number of cells, it is possible to detect that the transition in the number of cells is different from what is expected by monitoring the number of cells in the culture. However, it is not easy to identify the cause of the detected abnormality.
特に、期待する推移との乖離が培養環境または細胞の質のバラつきに起因するものか画像認識上の欠陥に起因するものかを切り分けることは、非常に難しい。このため、異常が生じる度に細胞画像を確認して原因の切り分けを行う必要があり、作業者に負担を強いている。
In particular, it is very difficult to distinguish whether the deviation from the expected transition is due to variations in the culture environment or cell quality or due to defects in image recognition. Therefore, it is necessary to check the cell image and isolate the cause every time an abnormality occurs, which imposes a burden on the operator.
以上では、細胞培養を例に説明したが、このような技術的な課題は、画像から細胞を計数する場合であれば、細胞培養以外においても同様に生じ得る。
In the above, cell culture has been described as an example, but such a technical problem can also occur in cases other than cell culture as long as cells are counted from images.
以上のような実情を踏まえ、本発明の一側面に係る目的は、画像を確認することなしに画像から計数した細胞数の異常の原因を切り分けることを支援する技術を提供することである。
Based on the above circumstances, an object of one aspect of the present invention is to provide a technique for supporting the isolation of the cause of an abnormality in the number of cells counted from an image without confirming the image.
本発明の一態様に係る方法は、細胞数情報の表示方法であって、細胞が順次撮像された複数の細胞画像を取得する工程と、画像に含まれる細胞を計数する第1計数モデルに前記複数の細胞画像を適用して出力された第1細胞数を取得する工程と、画像に含まれる細胞を計数する前記第2計数モデルに前記第1細胞数を取得した画像と同じ前記複数の細胞画像の各々を適用して出力された第2細胞数を取得する工程であって、前記第2計数モデルは、前記第1計数モデルと異なるという工程と、前記第1細胞数と前記第2細胞数とに基づいて、前記第1細胞数と前記第2細胞数の少なくとも一方と、前記第1細胞数と前記第2細胞数の対応関係と、を可視化した画面を表示する工程と、を含む。
The method according to one aspect of the present invention is a method for displaying cell number information, which includes a step of acquiring a plurality of cell images in which cells are sequentially imaged and a first counting model for counting cells included in the images. The step of applying a plurality of cell images to acquire the output first cell number, and the same plurality of cells as the image obtained by acquiring the first cell number in the second counting model for counting the cells included in the image. A step of applying each of the images to obtain the output number of second cells, in which the second counting model is different from the first counting model, and the number of first cells and the second cell. A step of displaying a screen that visualizes at least one of the first cell number and the second cell number, and the correspondence between the first cell number and the second cell number based on the number of cells is included. ..
本発明の別の一態様に係る方法は、細胞数情報の表示方法であって、細胞が順次撮像された複数の細胞画像を取得する工程と、画像に含まれる細胞を計数する第1計数モデルに前記複数の細胞画像の各々を適用して出力された第1細胞数を取得する工程であって、前記第1計数モデルは、第2計数モデルの適合率よりも高い適合率を有し、前記第2計数モデルの再現率よりも低い再現率を有する、という工程と、画像に含まれる細胞を計数する前記第2計数モデルに前記第1細胞数を取得した画像と同じ前記複数の細胞画像の各々を適用して出力された第2細胞数を取得する工程と、前記第1細胞数と前記第2細胞数の関係に基づいて培養環境の異常を検出すると、異常発生をユーザに通知する工程と、を含む。
A method according to another aspect of the present invention is a method for displaying cell number information, which is a step of acquiring a plurality of cell images in which cells are sequentially imaged, and a first counting model for counting cells included in the images. In the step of acquiring the output number of first cells by applying each of the plurality of cell images to the above, the first counting model has a matching rate higher than the matching rate of the second counting model. The step of having a recall rate lower than the recall rate of the second counting model, and the plurality of cell images same as the image obtained by acquiring the first cell number in the second counting model for counting the cells contained in the image. When an abnormality in the culture environment is detected based on the step of acquiring the output second cell number by applying each of the above and the relationship between the first cell number and the second cell number, the user is notified of the occurrence of the abnormality. Including the process.
本発明の一態様に係るシステムは、電気回路を含むシステムであって、前記電気回路は、撮像装置から細胞が順次撮像された複数の細胞画像を取得し、画像に含まれる細胞を計数する第1計数モデルに前記複数の細胞画像の各々を適用して出力された第1細胞数を取得し、ここで、前記第1計数モデルは、第2計数モデルの適合率よりも高い適合率を有し、前記第2計数モデルの再現率よりも低い再現率を有し、画像に含まれる細胞を計数する前記第2計数モデルに前記第1細胞数を取得した画像と同じ前記複数の細胞画像の各々を適用して出力された第2細胞数を取得し、前記第1細胞数と前記第2計数モデルに前記第2細胞数とに基づいて、前記第1細胞数と前記第2細胞数の少なくとも一方と、前記第1細胞数と前記第2細胞数の対応関係と、を可視化した画面を表示装置に表示させる。
The system according to one aspect of the present invention is a system including an electric circuit, in which the electric circuit acquires a plurality of cell images in which cells are sequentially imaged from an imaging device and counts the cells contained in the image. The number of first cells output by applying each of the plurality of cell images to one counting model is obtained, and here, the first counting model has a higher matching rate than the matching rate of the second counting model. However, the plurality of cell images which have a recall rate lower than the recall rate of the second counting model and which is the same as the image obtained by acquiring the first cell number in the second counting model for counting the cells contained in the image. Each is applied to obtain the output second cell number, and the first cell number and the second cell number are based on the first cell number and the second cell number in the second counting model. A screen that visualizes at least one of them and the correspondence between the number of the first cells and the number of the second cells is displayed on the display device.
本発明の別の一態様に係るシステムは、電気回路を含むシステムであって、前記電気回路は、撮像装置から細胞が順次撮像された複数の細胞画像を取得し、画像に含まれる細胞を計数する第1計数モデルに前記複数の細胞画像の各々を適用して出力された第1細胞数を取得し、ここで、前記第1計数モデルは、第2計数モデルの適合率よりも高い適合率を有し、前記第2計数モデルの再現率よりも低い再現率を有し、画像に含まれる細胞を計数する前記第2計数モデルに前記第1細胞数を取得した画像と同じ前記複数の細胞画像の各々を適用して出力された第2細胞数を取得し、前記第1細胞数と前記第2細胞数の関係に基づいて培養環境の異常を検出すると、異常発生をユーザに通知する。
The system according to another aspect of the present invention is a system including an electric circuit, in which the electric circuit acquires a plurality of cell images in which cells are sequentially imaged from an imaging device and counts the cells contained in the images. The number of first cells output by applying each of the plurality of cell images to the first counting model is obtained, and here, the first counting model has a higher matching rate than the matching rate of the second counting model. The same plurality of cells as the image obtained by acquiring the first cell number in the second counting model, which has a recall rate lower than that of the second counting model and counts the cells contained in the image. When each of the images is applied to obtain the output number of second cells and an abnormality in the culture environment is detected based on the relationship between the number of first cells and the number of second cells, the user is notified of the occurrence of the abnormality.
本発明の一態様に係るコンピュータ可読媒体は、コンピュータに、撮像装置から細胞が撮像された細胞画像を取得し、画像に含まれる細胞を計数する第1計数モデルに前記細胞画像を入力し、前記第1計数モデルは、第2計数モデルの適合率よりも高い適合率を有し、前記第2計数モデルの再現率よりも低い再現率を有し、画像に含まれる細胞を計数する前記第2計数モデルに前記細胞画像を入力し、前記第1計数モデルに前記細胞画像を入力することによって出力された第1細胞数と前記第2計数モデルに前記細胞画像を入力することによって出力された第2細胞数とに基づいて、前記第1細胞数と前記第2細胞数の少なくとも一方と、前記第1細胞数と前記第2細胞数の対応関係と、を可視化した画面を表示する処理を実行させるプログラムを記録したコンピュータ可読媒体である。
In the computer-readable medium according to one aspect of the present invention, a computer obtains a cell image in which cells are imaged from an imaging device, inputs the cell image into a first counting model for counting cells included in the image, and then inputs the cell image to the computer. The first counting model has a higher matching rate than the second counting model and a lower recall rate than the second counting model, and counts the cells contained in the image. The number of first cells output by inputting the cell image into the counting model and inputting the cell image into the first counting model and the output by inputting the cell image into the second counting model. Based on the number of 2 cells, a process of displaying a screen that visualizes at least one of the number of the first cell and the number of the second cell and the correspondence between the number of the first cell and the number of the second cell is executed. It is a computer-readable medium that records the program to be made.
上記の態様によれば、画像を確認することなしに画像から計数した細胞数の異常の原因を切り分けることを支援することができる。
According to the above aspect, it is possible to support the isolation of the cause of the abnormality in the number of cells counted from the image without confirming the image.
図1は、細胞培養手順を説明するための図である。以下、図1を参照しながら、予め準備した培養細胞を目標数にまで増殖させる細胞培養において、作業者によって行われる作業について説明する。
FIG. 1 is a diagram for explaining a cell culture procedure. Hereinafter, the work performed by the operator in the cell culture in which the cultured cells prepared in advance are grown to the target number will be described with reference to FIG.
作業者は、まず、培養容器に培養細胞を播種し、その後、培養容器をインキュベータ内の撮像装置上に配置して細胞培養を開始する。細胞培養開始後は、作業者は、撮像装置で取得した細胞画像から計数された細胞数を確認し、さらに必要があれば細胞画像も確認することで、細胞培養を監視する。
The worker first seeds the cultured cells in the culture vessel, then arranges the culture vessel on the imaging device in the incubator and starts cell culture. After the start of cell culture, the operator monitors the cell culture by confirming the number of cells counted from the cell image acquired by the imaging device and, if necessary, also confirming the cell image.
例えば、作業者は、培養開始直後であれば、細胞数から播種密度が適当であるかを判断し、播種密度がプロトコルで推奨された推奨播種密度になるように調整してもよい。また、作業者は、対数増殖期には、細胞数から把握される細胞密度に応じた頻度で培地交換を行ってもよく、その細胞密度が所定値を上回っている場合には、継代を行ってもよい。
For example, the operator may determine whether the seeding density is appropriate from the number of cells immediately after the start of culturing, and adjust the seeding density to be the recommended seeding density recommended by the protocol. Further, in the logarithmic growth phase, the worker may exchange the medium at a frequency according to the cell density as grasped from the number of cells, and if the cell density exceeds a predetermined value, the passage is performed. You may go.
作業者は、細胞数と細胞画像から細胞培養を継続できないと判断すると、細胞培養を中止、又は、やり直す。一方、作業者は、細胞培養が順調に進み、培養細胞の細胞数が目標数に達したと判断すると、細胞培養を完了する。
When the worker judges from the number of cells and the cell image that the cell culture cannot be continued, the cell culture is stopped or restarted. On the other hand, when the worker determines that the cell culture has proceeded smoothly and the number of cultured cells has reached the target number, the cell culture is completed.
以上のように、細胞数は、細胞培養における種々の作業を行う契機として利用され得るものであるので、細胞培養中の細胞数とその推移は、細胞培養を成功裏に行うための重要な情報として位置づけられる。
As described above, since the number of cells can be used as an opportunity to perform various operations in cell culture, the number of cells in cell culture and its transition are important information for successful cell culture. It is positioned as.
上述したように、細胞培養を継続しながら細胞数を得るためには、画像から細胞を計数することが望ましいが、画像解析によって得られる細胞数の信頼性には、未だ改善の余地がある。目標数の細胞を得るために行われる細胞培養では、例えば塵や埃などの細胞でないもの、死細胞、計数対象としない種類の細胞、を所望の細胞として計数してしまうことによって細胞数が過大に見積もられてしまうことが敬遠される点を考慮すると、細胞培養の監視には、細胞をより高い基準で認定する計数モデルが好まれることが想定される。
As described above, in order to obtain the number of cells while continuing cell culture, it is desirable to count the cells from the image, but there is still room for improvement in the reliability of the number of cells obtained by image analysis. In cell culture performed to obtain a target number of cells, for example, non-cells such as dust and dirt, dead cells, and cells of a type not to be counted are counted as desired cells, resulting in an excessive number of cells. Considering that it is avoided to be estimated in the above, it is assumed that a counting model that certifies cells to a higher standard is preferred for monitoring cell culture.
しかしながら、そのような計数モデルは、概して、培養過程において生じ得る細胞の形状変化に敏感に反応してしまうため、計数モデルから得られる細胞数は、本来の細胞数の推移とは異なる異常な推移を示す可能性が高くなる。なお、ここでいう形状変化は、細胞が実際に変形することによる形状変化だけではなく、例えば細胞の重層化などによって生じる画像上に表れる細胞の見た目の上での形状変化も含んでいる。例えば認定基準が厳格なモデルの場合、少しでも細胞の形状に変化が生じると、計数モデルが備える基準形状から外れていると認定されてしまい、その細胞を計数しないことがある。具体的には、細胞の重層化などにより偶然に計数モデルが備える基準形状から外れた形状が画像内に生じた場合、本来の細胞数よりも少なく計数してしまうこともある。いずれの形状変化も、細胞培養において異常な事象ではないという点では同じである。
However, since such a counting model generally reacts sensitively to changes in cell shape that may occur during the culture process, the number of cells obtained from the counting model is an abnormal transition different from the original transition of the number of cells. Is more likely to indicate. The shape change referred to here includes not only the shape change due to the actual deformation of the cell, but also the apparent shape change of the cell appearing on the image caused by, for example, layering of the cell. For example, in the case of a model with strict certification criteria, if the shape of cells changes even a little, it may be recognized as deviating from the standard shape provided by the counting model, and the cells may not be counted. Specifically, if a shape that deviates from the standard shape provided in the counting model accidentally occurs in the image due to layering of cells or the like, the number of cells may be less than the original number of cells. Both shape changes are the same in that they are not abnormal events in cell culture.
従って、細胞培養の監視で一般的に使用が見込まれる計数モデルは、概してその高い認定基準によって過大に見積もられていない確実性の高い細胞数を提供する一方で、培養過程において生じ得る異常ではない事象によって細胞数の異常な推移を引き起こしてしまう可能性がある。そして、その異常な推移、つまり、期待する推移との乖離が、培養環境に起因した真の異常か、計数モデルの画像認識上の欠陥に起因する偽物の異常かを、その計数モデルから出力される細胞数のみから切り分けることは難しい。
Therefore, counting models commonly used in cell culture monitoring generally provide a reliable cell number that is not overestimated by their high accreditation criteria, while at the same time possible abnormalities in the culture process. Abnormal events can cause abnormal changes in cell number. Then, the abnormal transition, that is, whether the deviation from the expected transition is a true abnormality caused by the culture environment or a fake abnormality caused by a defect in the image recognition of the counting model is output from the counting model. It is difficult to separate from only the number of cells.
以下では、上述した細胞培養で使用される計数モデルの特徴を踏まえ、真の異常と偽の異常との切り分けを可能にする方法について説明する。なお、この技術は、上記の切り分けのためには画像をユーザが確認することを必要としないが、画像による確認が併用されてもよい。
Below, based on the characteristics of the counting model used in the above-mentioned cell culture, a method that enables the separation between true abnormalities and false abnormalities will be described. It should be noted that this technique does not require the user to confirm the image for the above-mentioned separation, but the confirmation by the image may be used together.
図2は、細胞培養監視システムの構成を例示した図である。図3は、撮像装置の構成を例示した図である。図4は、制御装置の物理構成を例示した図である。以下、図2から図4を参照しながら、図2に示すシステム1の構成について説明する。
FIG. 2 is a diagram illustrating the configuration of the cell culture monitoring system. FIG. 3 is a diagram illustrating the configuration of the imaging device. FIG. 4 is a diagram illustrating the physical configuration of the control device. Hereinafter, the configuration of the system 1 shown in FIG. 2 will be described with reference to FIGS. 2 to 4.
システム1は、インキュベータ20内の管理された環境で培養細胞を培養しながら、培養細胞の画像を取得し、且つ、画像に基づいて細胞培養の監視を行うための細胞培養監視システムである。システム1は、図2に示すように、インキュベータ20内に置かれた撮像装置10と、制御装置30と、を備えている。システム1では、制御装置30は、撮像装置10で取得した画像に基づいて細胞を計数し、得られた細胞数を用いることで、ユーザによる細胞培養の監視を支援する。また、制御装置30は、撮像装置10及びクライアント端末(クライアント端末40、クライアント端末50)と通信する。なお、システム1は、インキュベータ20と、クライアント端末を含んでもよい。
System 1 is a cell culture monitoring system for acquiring an image of a cultured cell while culturing the cultured cell in a controlled environment in the incubator 20 and monitoring the cell culture based on the image. As shown in FIG. 2, the system 1 includes an imaging device 10 placed in the incubator 20 and a control device 30. In the system 1, the control device 30 counts cells based on the image acquired by the imaging device 10, and uses the obtained number of cells to support the user in monitoring the cell culture. Further, the control device 30 communicates with the image pickup device 10 and the client terminal (client terminal 40, client terminal 50). The system 1 may include an incubator 20 and a client terminal.
インキュベータ20内に配置された撮像装置10上には、図2に示すように、培養容器100が置かれる。培養容器100は、特に限定しないが、例えば、ペトリディッシュ、フラスコ、マイクロプレートなどである。培養容器100には、図3に示すように、培地CMとともに培養細胞である細胞Cが収容されている。なお、特に限定しないが、培地CMは、例えば仔ウシの血清などであり、細胞Cは、例えば軟骨細胞などである。
As shown in FIG. 2, a culture container 100 is placed on the image pickup apparatus 10 arranged in the incubator 20. The culture vessel 100 is not particularly limited, and is, for example, a Petri dish, a flask, a microplate, or the like. As shown in FIG. 3, the culture container 100 contains cells C, which are cultured cells, together with the medium CM. Although not particularly limited, the medium CM is, for example, calf serum, and the cell C is, for example, chondrocytes.
撮像装置10は、培養容器100に収容された細胞Cを撮像することで、細胞Cの画像(以降、細胞画像と記す)を生成する。撮像装置10は、生成した画像を制御装置30へ送信する。撮像装置10と制御装置30の間の通信は、有線通信であっても無線通信であってもよい。撮像方法は、例えば、位相差観察、微分干渉観察、偏斜照明観察などであり、個々の細胞を撮像可能ならば特に限定されない。
The imaging device 10 generates an image of the cell C (hereinafter referred to as a cell image) by imaging the cell C housed in the culture container 100. The image pickup device 10 transmits the generated image to the control device 30. The communication between the image pickup device 10 and the control device 30 may be wired communication or wireless communication. The imaging method is, for example, phase difference observation, differential interference contrast observation, oblique illumination observation, and the like, and is not particularly limited as long as individual cells can be imaged.
より詳細には、撮像装置10は、図3に示すように、筐体11と、培養容器100が載置されるステージ12を備えている。撮像装置10は、さらに、ステージ12の下方であって筐体11内部に、撮像ユニット13と、撮像ユニット13を動かす走査機構16を備えている。撮像ユニット13には、撮像素子14と、光源15と、光学系(図示せず)などが設けられている。
More specifically, as shown in FIG. 3, the imaging device 10 includes a housing 11 and a stage 12 on which the culture container 100 is placed. The image pickup apparatus 10 further includes an image pickup unit 13 and a scanning mechanism 16 for moving the image pickup unit 13 inside the housing 11 below the stage 12. The image pickup unit 13 is provided with an image pickup element 14, a light source 15, an optical system (not shown), and the like.
撮像素子14は、例えば、CCD(Charge-Coupled Device)イメージセンサ、CMOS(Complementary MOS)イメージセンサなどである。光源15は、例えば、発光ダイオード(LED)などであり、ステージ12の下方から培養容器100を照明する。光源15は、撮像素子14を挟んで向かい合わせに置かれてもよい。また、光源15は、白色光を出射しても良い。なお、細胞へのダメージを減らすため、波長の長いR(赤)の光を用いることが望ましい。光源15の各々は、例えば、R(赤)、G(緑)、B(青)の3色の波長の光を切り替えることで、R(赤)、G(緑)、B(青)のいずれかの波長の光を選択的に出射してもよい。撮像装置10では、光源15から出射した光は、培養容器100の底面を透過し、培養容器100の上面で反射した光の一部が培養容器100内の細胞Cを透過する。光学系は、培養容器100内の細胞Cを透過した光を用いて撮像素子14上に細胞Cの光学像を形成する。
The image sensor 14 is, for example, a CCD (Charge-Coupled Device) image sensor, a CMOS (Complementary MOS) image sensor, or the like. The light source 15 is, for example, a light emitting diode (LED) or the like, and illuminates the culture vessel 100 from below the stage 12. The light sources 15 may be placed facing each other with the image sensor 14 in between. Further, the light source 15 may emit white light. In order to reduce damage to cells, it is desirable to use R (red) light having a long wavelength. Each of the light sources 15 can be any of R (red), G (green), and B (blue) by switching light having three wavelengths of R (red), G (green), and B (blue), for example. Light of that wavelength may be selectively emitted. In the image pickup apparatus 10, the light emitted from the light source 15 passes through the bottom surface of the culture container 100, and a part of the light reflected on the upper surface of the culture container 100 passes through the cells C in the culture container 100. The optical system forms an optical image of the cells C on the image pickup device 14 by using the light transmitted through the cells C in the culture vessel 100.
走査機構16は、例えば、モータなどの駆動源を含み、光学系の光軸と直交する方向(XY方向)に撮像ユニット13を動かす。走査機構16が撮像ユニット13をXY方向に動かすことで、撮像装置10は、撮像対象の範囲を変更することができる。走査機構16は、さらに、光学系の光軸方向(Z方向)に撮像ユニット13を動かしてもよく、撮像装置10は、走査機構16を用いることでフォーカス位置を調整してもよい。また、撮像装置10は、光学系に含まれるレンズの少なくとも1つを光軸方向に移動することでフォーカス位置を調整してもよい。
The scanning mechanism 16 includes, for example, a drive source such as a motor, and moves the image pickup unit 13 in a direction (XY directions) orthogonal to the optical axis of the optical system. The scanning mechanism 16 moves the imaging unit 13 in the XY directions, so that the imaging device 10 can change the range of the imaging target. The scanning mechanism 16 may further move the imaging unit 13 in the optical axis direction (Z direction) of the optical system, and the imaging device 10 may adjust the focus position by using the scanning mechanism 16. Further, the image pickup apparatus 10 may adjust the focus position by moving at least one of the lenses included in the optical system in the optical axis direction.
制御装置30は、システム1を制御するコンピュータである。制御装置30は、図4に示すように、プロセッサ31と、メモリ32と、補助記憶装置33と、入力装置34と、出力装置35と、可搬記録媒体39を駆動する可搬記録媒体駆動装置36と、通信モジュール37と、バス38を備えている。補助記憶装置33、及び、可搬記録媒体39は、それぞれプログラムを記録した非一過性のコンピュータ読取可能記録媒体の一例である。
The control device 30 is a computer that controls the system 1. As shown in FIG. 4, the control device 30 is a portable recording medium driving device that drives a processor 31, a memory 32, an auxiliary storage device 33, an input device 34, an output device 35, and a portable recording medium 39. It includes 36, a communication module 37, and a bus 38. The auxiliary storage device 33 and the portable recording medium 39 are examples of non-transient computer-readable recording media on which programs are recorded.
プロセッサ31は、例えば、CPU(Central Processing Unit)、GPU(Graphics Processing Unit)などを含む電気回路(circuitry)である。プロセッサ31は、補助記憶装置33又は可搬記録媒体39に格納されているプログラムをメモリ32に展開して、その後、実行することで、後述する細胞情報表示方法などのプログラムされた処理を行う。
The processor 31 is, for example, an electric circuit (circuitry) including a CPU (Central Processing Unit), a GPU (Graphics Processing Unit), and the like. The processor 31 expands the program stored in the auxiliary storage device 33 or the portable recording medium 39 into the memory 32, and then executes the program to perform programmed processing such as a cell information display method described later.
メモリ32は、例えば、RAM(Random Access Memory)などの任意の半導体メモリである。メモリ32は、プログラムの実行の際に、補助記憶装置33又は可搬記録媒体39に格納されているプログラムまたはデータを記憶するワークメモリとして機能する。補助記憶装置33は、例えば、ハードディスク、フラッシュメモリ等の不揮発性のメモリである。補助記憶装置33は、主に各種データ及びプログラムの格納に用いられる。
The memory 32 is, for example, an arbitrary semiconductor memory such as a RAM (Random Access Memory). The memory 32 functions as a work memory for storing the program or data stored in the auxiliary storage device 33 or the portable recording medium 39 when the program is executed. The auxiliary storage device 33 is, for example, a non-volatile memory such as a hard disk or a flash memory. The auxiliary storage device 33 is mainly used for storing various data and programs.
可搬記録媒体駆動装置36は、可搬記録媒体39を収容する。可搬記録媒体駆動装置36は、メモリ32又は補助記憶装置33に記憶されているデータを可搬記録媒体39に出力することができ、また、可搬記録媒体39からプログラム及びデータ等を読み出すことができる。可搬記録媒体39は、持ち運びが可能な任意の記録媒体である。可搬記録媒体39には、例えば、SDカード、USB(Universal Serial Bus)フラッシュメモリ、CD(Compact Disc)、DVD(Digital Versatile Disc)などが含まれる。
The portable recording medium drive device 36 accommodates the portable recording medium 39. The portable recording medium driving device 36 can output the data stored in the memory 32 or the auxiliary storage device 33 to the portable recording medium 39, and reads out programs, data, and the like from the portable recording medium 39. Can be done. The portable recording medium 39 is any portable recording medium. The portable recording medium 39 includes, for example, an SD card, a USB (Universal Serial Bus) flash memory, a CD (Compact Disc), a DVD (Digital Versatile Disc), and the like.
入力装置34は、キーボード、マウスなどである。出力装置35は、表示装置、プリンタなどである。通信モジュール37は、例えば、外部ポートを経由して接続した撮像装置10と通信する有線通信モジュールである。通信モジュール37は、無線通信モジュールであってもよい。バス38は、プロセッサ31、メモリ32、補助記憶装置33等を、相互にデータの授受可能に接続する。
The input device 34 is a keyboard, a mouse, or the like. The output device 35 is a display device, a printer, or the like. The communication module 37 is, for example, a wired communication module that communicates with the image pickup apparatus 10 connected via an external port. The communication module 37 may be a wireless communication module. The bus 38 connects the processor 31, the memory 32, the auxiliary storage device 33, and the like to each other so that data can be exchanged.
なお、図4に示す構成は、制御装置30のハードウェア構成の一例である。制御装置30はこの構成に限定されるものではない。制御装置30は、汎用装置であっても専用装置であってもよい。制御装置30は、例えば、専用設計の電気回路、例えば、ASIC(Application Specific Integrated Circuit)などを備えてもよい。また、制御装置30は、FPGA(Field-Programmable Gate Array)を用いて構成されてもよい。
The configuration shown in FIG. 4 is an example of the hardware configuration of the control device 30. The control device 30 is not limited to this configuration. The control device 30 may be a general-purpose device or a dedicated device. The control device 30 may include, for example, a specially designed electric circuit, for example, an ASIC (Application Specific Integrated Circuit) or the like. Further, the control device 30 may be configured by using an FPGA (Field-Programmable Gate Array).
制御装置30は、撮像装置10へ撮像指示を送信する。また、制御装置30は、撮像装置10が細胞Cを撮像することによって生成した画像を受信する。さらに、制御装置30は、撮像装置10から取得した細胞Cの画像に基づいて、画像に含まれる細胞Cを計数して細胞数を算出する。より詳細には、2つの異なる計数モデルを用いて細胞Cを計数して2つの細胞数(第1細胞数、第2細胞数)を算出する。制御装置30は、それらの細胞数を用いて細胞培養の監視を支援するための画面をユーザに提供する。具体的には、制御装置30は、例えば、出力装置35である表示装置に細胞培養の監視を支援するための画面を表示してもよい。
The control device 30 transmits an imaging instruction to the imaging device 10. Further, the control device 30 receives an image generated by the image pickup device 10 taking an image of the cell C. Further, the control device 30 counts the cells C included in the image and calculates the number of cells based on the image of the cells C acquired from the imaging device 10. More specifically, cell C is counted using two different counting models to calculate two cell numbers (first cell number, second cell number). The control device 30 provides the user with a screen for assisting in monitoring the cell culture using the number of those cells. Specifically, the control device 30 may display, for example, a screen for supporting the monitoring of cell culture on the display device which is the output device 35.
クライアント端末40は、ノート型コンピュータである。クライアント端末50は、タブレット型コンピュータである。制御装置30は、クライアント端末(クライアント端末40、クライアント端末50)からの要求に応じて画面情報をクライアント端末へ出力してもよい。クライアント端末は、表示部を備えていればよく、例えば、デスクトップ型のコンピュータ、スマートフォンなどであってもよい。
The client terminal 40 is a notebook computer. The client terminal 50 is a tablet computer. The control device 30 may output screen information to the client terminal in response to a request from the client terminal (client terminal 40, client terminal 50). The client terminal may be provided with a display unit, and may be, for example, a desktop computer or a smartphone.
図5は、細胞培養の監視支援方法の一例を示したフローチャートである。以下、図5を参照しながら、システム1によって行われる細胞培養の監視を支援する方法について説明する。図5に示す処理は、細胞数情報を表示することによって、ユーザによる細胞培養の監視を支援するための方法を示したものであり、従って、細胞数情報表示方法の一例である。なお、細胞数情報とは、少なくとも細胞数を含む情報であり、さらに、細胞数に基づいて算出される情報を含んでもよい。
FIG. 5 is a flowchart showing an example of a cell culture monitoring support method. Hereinafter, a method of supporting the monitoring of cell culture performed by the system 1 will be described with reference to FIG. The process shown in FIG. 5 shows a method for assisting the user in monitoring the cell culture by displaying the cell number information, and is therefore an example of the cell number information display method. The cell number information is information including at least the number of cells, and may further include information calculated based on the number of cells.
システム1は、図5に示すように、画像取得(ステップS1)、第1細胞数取得(ステップS2)、第2細胞数取得(ステップS3)、画面表示(ステップS4)の4つのステップを含んでいる。
As shown in FIG. 5, the system 1 includes four steps of image acquisition (step S1), first cell number acquisition (step S2), second cell number acquisition (step S3), and screen display (step S4). I'm out.
ステップS1の画像取得工程は、細胞Cが撮像された細胞画像であって撮像装置10によって生成された細胞画像を制御装置30が取得する工程である。システム1では、培養容器100を載せた状態でインキュベータ20に配置された撮像装置10が制御装置30によって制御されることで、制御装置30が培養容器100をインキュベータ20から取り出すことなく細胞画像を取得することが可能である。即ち、システム1では、細胞培養を継続しながら細胞画像を得ることができる。ステップS1では、制御装置30は、撮像装置10が細胞を順次撮像した複数の細胞画像を取得する。
The image acquisition step of step S1 is a step in which the control device 30 acquires a cell image obtained by capturing the cell C and generated by the imaging device 10. In the system 1, the image pickup device 10 arranged in the incubator 20 with the culture vessel 100 mounted is controlled by the control device 30, so that the control device 30 acquires the cell image without removing the culture vessel 100 from the incubator 20. It is possible to do. That is, in the system 1, a cell image can be obtained while continuing the cell culture. In step S1, the control device 30 acquires a plurality of cell images in which the imaging device 10 sequentially images the cells.
ステップS2の第1細胞数取得工程は、制御装置30がステップS1で取得した複数の細胞画像の各々を第1計数モデルに入力して、制御装置30が第1計数モデルから出力された第1細胞数を取得する工程である。即ち、制御装置30は、第1計数モデルに複数の細胞画像の各々を適用することで出力された第1細胞数を取得する。なお、第1細胞数は、細胞画像毎に出力される。一方、ステップS3の第2細胞数取得工程は、制御装置30がステップS1で取得した細胞画像を第2計数モデルに入力して、制御装置30が第2計数モデルから出力された第2細胞数を取得する工程である。即ち、制御装置30は、第2計数モデルに第1細胞数を取得した画像と同じ複数の細胞画像の各々を適用することで出力された第2細胞数を取得する。なお、第2細胞数は、細胞画像毎に出力される。また、第1計数モデルと第2計数モデルのそれぞれは、画像に含まれる細胞を計数するモデルであり、第1計数モデルは、第2計数モデルとは異なるモデルである。
In the first cell number acquisition step of step S2, the control device 30 inputs each of the plurality of cell images acquired in step S1 into the first counting model, and the control device 30 outputs from the first counting model. This is the process of obtaining the number of cells. That is, the control device 30 acquires the output number of first cells by applying each of the plurality of cell images to the first counting model. The number of first cells is output for each cell image. On the other hand, in the second cell number acquisition step of step S3, the control device 30 inputs the cell image acquired in step S1 into the second counting model, and the control device 30 outputs the second cell number from the second counting model. Is the process of acquiring. That is, the control device 30 acquires the output second cell number by applying each of the same plurality of cell images as the image obtained by acquiring the first cell number to the second counting model. The number of second cells is output for each cell image. Further, each of the first counting model and the second counting model is a model for counting the cells included in the image, and the first counting model is a model different from the second counting model.
第1計数モデルは、上述した細胞培養の監視で一般的に使用が見込まれる計数モデルであり、細胞を第2計数モデルよりも高い基準で認定する計数モデルである。つまり、目的の対象物をどの程度正確に検出したかを示す正確性の指標である適合率が高い計数モデルである。一方、第2計数モデルは、目的の対象物をもれなく検出することを優先した計数モデルであり、細胞を第1計数モデルよりも低い基準で認定する計数モデルである。つまり、目的の対象物をどの程度網羅的に検出したかを示す網羅性の指標である再現率が高い計数モデルである。なお、再現率が高い場合は外乱等にも強いことから再現率が高い計数モデルは、ロバスト性を有しているということもできる。なお、適合率と再現率はトレードオフの関係を有し、同一モデルで片方を高めればもう片方は低くなるという制約がある。
The first counting model is a counting model that is generally expected to be used in the above-mentioned cell culture monitoring, and is a counting model that certifies cells with a higher standard than the second counting model. In other words, it is a counting model with a high precision rate, which is an index of accuracy indicating how accurately the target object is detected. On the other hand, the second counting model is a counting model that gives priority to detecting the target object without exception, and is a counting model that certifies cells with a lower standard than the first counting model. In other words, it is a counting model with a high recall rate, which is an index of completeness indicating how comprehensively the target object is detected. It can be said that a counting model with a high recall rate has robustness because it is resistant to disturbances and the like when the recall rate is high. There is a trade-off relationship between the precision rate and the recall rate, and there is a restriction that if one is increased in the same model, the other is decreased.
第1計数モデルは、第2計数モデルの適合率よりも高い適合率を有し、第2計数モデルの再現率よりも低い再現率を有している。従って、ステップS2の第1細胞数取得工程によれば、過大に見積もられていない確実性の高い細胞数を得ることができる。一方、第2計数モデルは、第1計数モデルの再現率よりも高い再現率を有し、第1計数モデルの適合率よりも低い適合率を有している。従って、ステップS3の第2細胞数取得工程によれば、細胞の形状変化に過剰に反応することなく、培養期間中に安定した確度(accuracy)で細胞数を得ることができる。第1計数モデルのように高い適合率を有する計数モデルの使用が一般的に見込まれる理由は、培養した細胞を患者に移植したり顧客に輸送する際には、所望の細胞数以上の細胞が含まれているという条件を満たしていることが必須だからである。つまり、細胞数が実際の細胞数より多く見積もられる可能性の高い第2計数モデルよりも、確実な細胞を計数することで誤った対象を計数しない第1計数モデルによる計数が望まれているためである。
The first counting model has a higher matching rate than the second counting model, and has a lower recall rate than the second counting model. Therefore, according to the first cell number acquisition step of step S2, it is possible to obtain a highly reliable cell number that is not overestimated. On the other hand, the second counting model has a recall rate higher than that of the first counting model and has a matching rate lower than that of the first counting model. Therefore, according to the second cell number acquisition step of step S3, the cell number can be obtained with stable accuracy during the culture period without excessively reacting to the change in cell shape. The reason why the use of a counting model with a high precision rate such as the first counting model is generally expected is that when the cultured cells are transplanted to a patient or transported to a customer, more cells than the desired number of cells are used. This is because it is essential that the condition that it is included is satisfied. That is, counting by the first counting model that does not count erroneous objects by counting reliable cells is desired rather than the second counting model in which the number of cells is likely to be estimated more than the actual number of cells. Is.
ステップS4の画面表示工程は、制御装置30がステップS2で取得した第1細胞数とステップS3で取得した第2細胞数に基づいて、細胞培養の監視を支援するための画面を表示する工程である。より具体的には、制御装置30は、第1細胞数と第2細胞数に基づいて、第1細胞数と第2細胞数の少なくとも一方と、第1細胞数と第2細胞数の対応関係と、を可視化した細胞数情報表示画面を生成し、表示装置に細胞数情報表示画面を表示する。より望ましくは、制御装置30は、第1細胞数の履歴と第2細胞数の履歴とに基づいて、第1細胞数と第2細胞数の少なくとも一方の時間に対する変化と、第1細胞数と第2細胞数の対応関係の時間に対する変化と、を可視化した細胞数情報表示画面を生成し、表示装置に細胞数情報表示画面を表示する。
The screen display step of step S4 is a step of displaying a screen for supporting the monitoring of cell culture based on the number of first cells acquired in step S2 and the number of second cells acquired in step S3 by the control device 30. is there. More specifically, the control device 30 has a correspondence relationship between at least one of the first cell number and the second cell number and the first cell number and the second cell number based on the first cell number and the second cell number. A cell number information display screen that visualizes and is generated, and the cell number information display screen is displayed on the display device. More preferably, the control device 30 determines the change in the number of first cells and the number of second cells with respect to time and the number of first cells based on the history of the number of first cells and the history of the number of second cells. A cell number information display screen that visualizes the change in the correspondence relationship of the second cell number with time is generated, and the cell number information display screen is displayed on the display device.
システム1では、第1細胞数と第2細胞数の少なくとも一方が画面に表示されるため、ユーザは細胞数に基づく培養監視を行うことができる。さらに、第1細胞数と第2細胞数の対応関係が画面に表示されることで、細胞数や細胞数の推移が想定したものと異なる場合に、その原因が培養環境にあるのか画像認識上の欠陥にあるのかを画像を確認することなく切り分けることができる。
In system 1, at least one of the number of first cells and the number of second cells is displayed on the screen, so that the user can monitor the culture based on the number of cells. Furthermore, by displaying the correspondence between the number of first cells and the number of second cells on the screen, if the number of cells or the transition of the number of cells is different from what was expected, whether the cause is in the culture environment or not in image recognition. It is possible to isolate whether it is a defect in the image without checking the image.
より詳細には、適合率優位の第1計数モデルと再現率優位の第2計数モデルの両方で細胞数が期待する推移と同じような傾向で乖離する場合には、期待する推移とは異なる変化が細胞数に実際に生じている可能性が高く、画像認識上の欠陥がその推移に起因している可能性は低いと判断することができる。また、第1計数モデルと第2計数モデルで細胞数の推移の傾向が異なる場合、特に、第1計数モデルにおいて想定する推移との乖離が生じている場合には、画像認識上の欠陥に起因している可能性は高いと判断することができる。従って、システム1によれば、原因の切り分けのために画像を詳細に確認する機会が減らすことができるため、ユーザの作業負担を軽減することができる。
More specifically, if the number of cells deviates in the same tendency as the expected transition in both the first counting model with the dominant precision rate and the second counting model with the dominant recall rate, the change is different from the expected transition. It can be judged that there is a high possibility that the number of cells actually occurs, and it is unlikely that the defect in image recognition is caused by the transition. In addition, when the tendency of the transition of the number of cells is different between the first counting model and the second counting model, especially when there is a deviation from the transition assumed in the first counting model, it is caused by a defect in image recognition. It can be judged that there is a high possibility that it is done. Therefore, according to the system 1, the opportunity to check the image in detail for isolating the cause can be reduced, so that the workload of the user can be reduced.
以下、システム1が行う細胞培養の監視支援方法の具体例を説明する。
[第1の実施形態]
図6は、細胞数情報表示画面を生成するまでの処理の流れの一例を説明するための図である。図7は、第1計数モデルと第2計数モデルについて説明するための図である。図8は、計数モデルの適合率及び再現率の検証方法を説明するための図である。図9は、細胞数情報表示画面の一例を示した図である。図10は、細胞数情報表示画面に基づく異常原因の切り分け方について説明するための図である。以下、図6から図10を参照しながら、軟骨細胞について細胞培養を行う場合を例にして、システム1が行う第1の実施形態に係る監視支援方法について説明する。なお、システム1では、細胞数情報表示画面が表示されることによって細胞培養におけるユーザ支援が実現されるため、システム1が行う細胞数情報を表示する方法は、細胞培養の監視を支援する方法である。 Hereinafter, a specific example of the cell culture monitoring support method performed by thesystem 1 will be described.
[First Embodiment]
FIG. 6 is a diagram for explaining an example of the flow of processing until the cell number information display screen is generated. FIG. 7 is a diagram for explaining the first counting model and the second counting model. FIG. 8 is a diagram for explaining a method for verifying the precision and recall of the counting model. FIG. 9 is a diagram showing an example of a cell number information display screen. FIG. 10 is a diagram for explaining how to isolate the cause of abnormality based on the cell number information display screen. Hereinafter, with reference to FIGS. 6 to 10, a monitoring support method according to the first embodiment performed by thesystem 1 will be described with reference to a case where cell culture is performed on chondrocytes. In the system 1, the user support in the cell culture is realized by displaying the cell number information display screen. Therefore, the method of displaying the cell number information performed by the system 1 is a method of supporting the monitoring of the cell culture. is there.
[第1の実施形態]
図6は、細胞数情報表示画面を生成するまでの処理の流れの一例を説明するための図である。図7は、第1計数モデルと第2計数モデルについて説明するための図である。図8は、計数モデルの適合率及び再現率の検証方法を説明するための図である。図9は、細胞数情報表示画面の一例を示した図である。図10は、細胞数情報表示画面に基づく異常原因の切り分け方について説明するための図である。以下、図6から図10を参照しながら、軟骨細胞について細胞培養を行う場合を例にして、システム1が行う第1の実施形態に係る監視支援方法について説明する。なお、システム1では、細胞数情報表示画面が表示されることによって細胞培養におけるユーザ支援が実現されるため、システム1が行う細胞数情報を表示する方法は、細胞培養の監視を支援する方法である。 Hereinafter, a specific example of the cell culture monitoring support method performed by the
[First Embodiment]
FIG. 6 is a diagram for explaining an example of the flow of processing until the cell number information display screen is generated. FIG. 7 is a diagram for explaining the first counting model and the second counting model. FIG. 8 is a diagram for explaining a method for verifying the precision and recall of the counting model. FIG. 9 is a diagram showing an example of a cell number information display screen. FIG. 10 is a diagram for explaining how to isolate the cause of abnormality based on the cell number information display screen. Hereinafter, with reference to FIGS. 6 to 10, a monitoring support method according to the first embodiment performed by the
図6に示すように、システム1では、制御装置30は、撮像装置10によって生成された軟骨細胞の細胞画像2を、第1計数モデルM1と第2計数モデルM2に入力し、第1計数モデルM1から出力された第1細胞数3と第2計数モデルM2から出力された第2細胞数4を、履歴部Hに格納する。細胞画像2は、インキュベータ20内に配置された培養容器100内の培養細胞の画像である。このような処理を細胞画像2が入力されるたびに行うことで、履歴部Hには、第1細胞数3の履歴5と第2細胞数4の履歴6が蓄積される。第1細胞数3の履歴5には、複数の細胞画像2に対応する複数の第1細胞数3が含まれている。第2細胞数4の履歴6には、複数の細胞画像2に対応する複数の第2細胞数4が含まれている。
As shown in FIG. 6, in the system 1, the control device 30 inputs the cell image 2 of the chondrocytes generated by the imaging device 10 into the first counting model M1 and the second counting model M2, and inputs the first counting model. The number of first cells 3 output from M1 and the number of second cells 4 output from the second counting model M2 are stored in the history unit H. The cell image 2 is an image of the cultured cells in the culture vessel 100 arranged in the incubator 20. By performing such a process each time the cell image 2 is input, the history 5 of the first cell number 3 and the history 6 of the second cell number 4 are accumulated in the history unit H. The history 5 of the first cell number 3 includes a plurality of first cell numbers 3 corresponding to the plurality of cell images 2. The history 6 of the second cell number 4 includes a plurality of second cell numbers 4 corresponding to the plurality of cell images 2.
第1計数モデルM1は、ニューラルネットワークを用いた機械学習モデルであり、例えば、細胞画像に含まれている細胞(この例では軟骨細胞)と同じ細胞種Aの画像を教師データDS1として使用することによって訓練された訓練済みの機械学習モデルである。これに対して、第2計数モデルM2は、ニューラルネットワークを用いた機械学習モデルであり、例えば、細胞画像に含まれている細胞(この例では軟骨細胞)と同じ細胞種Aの画像と、細胞画像に含まれている細胞(この例では軟骨細胞)とは異なる細胞種(細胞種B、C、D)の画像と、を教師データDS2として使用することによって訓練された訓練済みの機械学習モデルである。
The first counting model M1 is a machine learning model using a neural network. For example, an image of the same cell type A as a cell (chondrocyte in this example) included in the cell image is used as the training data DS1. A trained machine learning model trained by. On the other hand, the second counting model M2 is a machine learning model using a neural network. For example, an image of the same cell type A as a cell (chondrocyte in this example) included in the cell image and a cell. A trained machine learning model trained by using images of cell types (cell types B, C, D) different from the cells contained in the images (chondrocytes in this example) as teacher data DS2. Is.
軟骨細胞と同種の細胞のみを学習した第1計数モデルM1は、軟骨細胞とそれ以外の細胞を学習した第2計数モデルM2よりも厳しい基準で軟骨細胞を認識することができる。このため、第1計数モデルM1は、軟骨細胞に対して、第2計数モデルM2の適合率よりも高い適合率を有する。また、色々な種類や形状の細胞を学習した第2計数モデルM2は、第1計数モデルM1と比較して軟骨細胞を計数する適合率は低下するが、第1計数モデルM1よりも画像中の細胞全体を網羅的に認識することができる。このため、第2計数モデルM2は、軟骨細胞に対して、第1計数モデルM1の再現率よりも高い再現率を有する。
The first counting model M1 that learned only cells of the same type as chondrocytes can recognize chondrocytes with stricter criteria than the second counting model M2 that learned chondrocytes and other cells. Therefore, the first counting model M1 has a higher matching rate with respect to chondrocytes than the matching rate of the second counting model M2. In addition, the second counting model M2, which has learned cells of various types and shapes, has a lower precision rate for counting chondrocytes than the first counting model M1, but is more in the image than the first counting model M1. The entire cell can be comprehensively recognized. Therefore, the second counting model M2 has a higher recall rate than that of the first counting model M1 for chondrocytes.
なお、各モデルの適合率と再現率は、例えば、図8に示すような方法によって確認することができる。第1に、細胞画像2を適合率と再現率を確認するモデルに入力し、検出した軟骨細胞の座標情報を含む出力画像2aを取得する。第2に、その軟骨細胞の核を染色した後に改めて軟骨細胞を撮像し、染色画像2bを取得する。第3に、染色画像2bから核が染色された細胞の座標情報を取得し、取得した座標情報と出力画像2aに含まれる座標情報とを比較する。第4に、比較結果からそのモデルの適合率と再現率を算出する。
The precision and recall of each model can be confirmed by, for example, the method shown in FIG. First, the cell image 2 is input to the model for confirming the matching rate and the recall rate, and the output image 2a including the coordinate information of the detected chondrocytes is acquired. Second, after staining the nucleus of the chondrocyte, the chondrocyte is imaged again to acquire the stained image 2b. Third, the coordinate information of the cell whose nucleus is stained is acquired from the stained image 2b, and the acquired coordinate information is compared with the coordinate information included in the output image 2a. Fourth, the precision and recall of the model are calculated from the comparison results.
適合率は、モデルによって軟骨細胞であると認識されたものの数(この例では、8個)と、モデルによって軟骨細胞であると認識されたもののうち染色画像2bにより実際に軟骨細胞であると確認されたものの数(この例では、5個)の比によって、算出される(この例では、5/8)。再現率は、染色画像2bにより実際に軟骨細胞であると確認されたものの数(この例では、6個)と、染色画像2bにより実際に軟骨細胞であると確認されたもののうちモデルによって軟骨細胞であると認識されたものの数(この例では、5個)の比によって、算出される(この例では、5/6)。
The matching rate was confirmed by the number of chondrocytes recognized by the model (8 in this example) and the stained image 2b among those recognized by the model as chondrocytes. It is calculated by the ratio of the number of things (5 in this example) (5/8 in this example). The recall was determined by the number of chondrocytes that were actually confirmed to be chondrocytes by the stained image 2b (6 in this example) and the chondrocytes among those that were actually confirmed to be chondrocytes by the stained image 2b. It is calculated by the ratio of the number of those recognized as (5 in this example) (5/6 in this example).
履歴部Hに細胞数が蓄積されると、制御装置30は、履歴部Hに蓄積された第1細胞数の履歴5と第2細胞数の履歴6を読み出して画面生成部Dに入力し、画面生成部Dが生成した細胞数情報表示画面である画面35aを出力装置35に表示する。
When the number of cells is accumulated in the history unit H, the control device 30 reads out the history 5 of the number of first cells and the history 6 of the number of second cells accumulated in the history unit H and inputs them to the screen generation unit D. The screen 35a, which is the cell number information display screen generated by the screen generation unit D, is displayed on the output device 35.
より詳細には、画面生成部Dでは、第1細胞数の履歴5に基づいて第1細胞数の時間に対する変化を示す第1グラフG1を生成する第1グラフ生成処理と、第2細胞数の履歴6に基づいて第2細胞数の時間に対する変化を示す第2グラフG2を生成する第2グラフ生成処理と、が行われる。このため、出力装置35に表示される画面35aには、図9に示すように、第1グラフG1と第2グラフG2が含まれる。即ち、制御装置30は、画面35aを表示するにあたり、出力装置35に第1グラフG1を表示し、出力装置35に第2グラフG2を表示する。
More specifically, in the screen generation unit D, the first graph generation process for generating the first graph G1 showing the change of the first cell number with time based on the history 5 of the first cell number, and the second graph generation process of the second cell number A second graph generation process for generating a second graph G2 showing a change in the number of second cells with time based on the history 6 is performed. Therefore, as shown in FIG. 9, the screen 35a displayed on the output device 35 includes the first graph G1 and the second graph G2. That is, when displaying the screen 35a, the control device 30 displays the first graph G1 on the output device 35 and displays the second graph G2 on the output device 35.
第1グラフG1と第2グラフG2が表示されることで、第1グラフG1と第2グラフG2の関係によって第1細胞数と第2細胞数の対応関係の時間に対する変化も可視される。このため、あるべき細胞数の推移を認識しているユーザは、画面35aを確認することで、細胞数が正常に推移しているかどうかを確認することに加えて、異常の原因が培養環境にあるのか画像認識上の欠陥にあるのかについても切り分けることができる。
By displaying the first graph G1 and the second graph G2, the change in the correspondence between the number of first cells and the number of second cells with respect to time is also visible due to the relationship between the first graph G1 and the second graph G2. Therefore, the user who is aware of the transition of the desired number of cells can confirm whether or not the number of cells is transitioning normally by checking the screen 35a, and the cause of the abnormality is the culture environment. It is also possible to distinguish whether it is present or has a defect in image recognition.
具体的には、図10のケースC1に示すように、第1グラフG1と第2グラフG2があるべき細胞数の推移とは顕著に異なった傾向を示しておらず、一定の関係で推移している場合には、ユーザは、細胞培養は正常に行われていると判断することができる。
Specifically, as shown in case C1 of FIG. 10, the first graph G1 and the second graph G2 do not show a significantly different tendency from the transition of the number of cells that should be, and transition in a certain relationship. If so, the user can determine that the cell culture has been performed normally.
これに対して、図10のケースC2からケースC4に示すように、第1グラフG1と第2グラフG2が一定の関係で推移していない、又は、第1グラフG1と第2グラフG2の少なくとも一方があるべき細胞数の推移とは顕著に異なっている傾向を示している場合には、ユーザは、異常を疑うことができる。
On the other hand, as shown in Cases C2 to C4 of FIG. 10, the first graph G1 and the second graph G2 do not change in a certain relationship, or at least the first graph G1 and the second graph G2. The user can suspect an abnormality if one shows a tendency that is significantly different from the transition of the number of cells that should be.
より具体的には、図10のケースC2に示すように、第1グラフG1のみが不自然な変化を示している場合には、細胞の形状変化が原因となって、細胞をより厳しい基準で認定する第1計数モデルで細胞数を正しく認識できていない可能を疑うことができる。例えば、細胞の重層化が起きた場合、第2計数モデルでは重層化による形状変化後の細胞も認識できるため第2グラフG2に顕著な変化はない。これに対して、第1計数モデルでは基準形状から外れると直ちに認識不能となるため、本来の細胞数に変化はないにもかかわらず計数された細胞数が変動してしまう。つまり、培養環境の異常ではなく画像認識上の欠陥を可能性が高いと判断することができる。
More specifically, as shown in case C2 of FIG. 10, when only the first graph G1 shows an unnatural change, the cell shape change is caused and the cell is subjected to a stricter standard. It is possible to suspect that the number of cells may not be correctly recognized by the first counting model to be certified. For example, when cell stratification occurs, there is no significant change in the second graph G2 because the second counting model can recognize the cells after the shape change due to the stratification. On the other hand, in the first counting model, when the shape deviates from the reference shape, it becomes unrecognizable immediately, so that the counted number of cells fluctuates even though the original number of cells does not change. That is, it can be determined that there is a high possibility that there is a defect in image recognition rather than an abnormality in the culture environment.
なお、不自然な変化は、第1グラフG1単体の変化で判断してもよく、第1グラフG1と第2グラフG2の関係に着目して判断してもよい。例えば、第1グラフG1と第2グラフG2が大きく離れたり、第2細胞数と第1細胞数の大小が逆転したりした場合に、不自然の変化と判断してもよい。
The unnatural change may be judged by the change of the first graph G1 alone, or may be judged by paying attention to the relationship between the first graph G1 and the second graph G2. For example, when the first graph G1 and the second graph G2 are largely separated from each other, or when the numbers of the second cells and the numbers of the first cells are reversed, it may be determined that the change is unnatural.
また、図10のケースC3に示すように、第1グラフG1と第2グラフG2が共に不自然な変化を示している場合には、実際に細胞数が不自然に変化していると判断することができる。つまり、培養環境又は細胞の質のばらつきに起因した異常が生じている可能性が高いと判断することができる。
Further, as shown in case C3 of FIG. 10, when both the first graph G1 and the second graph G2 show an unnatural change, it is determined that the cell number actually changes unnaturally. be able to. That is, it can be determined that there is a high possibility that an abnormality has occurred due to variations in the culture environment or cell quality.
さらに、図10のケースC4に示すように、細胞培養の途中から第1グラフG1と第2グラフG2の関係に明らかな変化が生じている場合にも、培養環境に起因した異常が生じている可能性が高いと判断することができる。特に、図10のケースC4のように、グラフG2が示す細胞数が途中から大幅に増加している場合には、ゴミなどの混入を疑うことができる。第1グラフG1と第2グラフG2の関係に明らかな変化が生じた時刻にユーザが培地交換やインキュベータの開閉などの手技を行っていた場合には、その手技に起因してコンタミネーションが起きていると判断することが出来、ユーザはその時刻での培養操作を振り返ることができる。加えて、グラフG2が示す細胞数が増加し、かつグラフG1が示す細胞数が減少している場合には、計数対象である軟骨細胞の変化を疑うことができる。具体的には、軟骨細胞の死亡、ガン化、老化に伴う形状変化(すなわち、目的細胞の減少)が生じている可能性が高いと推測できる。
Further, as shown in case C4 of FIG. 10, even when a clear change occurs in the relationship between the first graph G1 and the second graph G2 during the cell culture, an abnormality due to the culture environment occurs. It can be judged that the possibility is high. In particular, when the number of cells shown in the graph G2 increases significantly from the middle as in case C4 of FIG. 10, it is possible to suspect that dust or the like is mixed. If the user performs a procedure such as changing the medium or opening / closing the incubator at the time when a clear change occurs in the relationship between the first graph G1 and the second graph G2, contamination occurs due to the procedure. It can be determined that there is, and the user can look back on the culture operation at that time. In addition, when the number of cells shown in the graph G2 is increasing and the number of cells shown in the graph G1 is decreasing, it is possible to suspect a change in the chondrocytes to be counted. Specifically, it can be inferred that there is a high possibility that shape changes (that is, reduction of target cells) associated with chondrocyte death, canceration, and aging have occurred.
以上のように、システム1は、本実施形態に係る細胞数情報表示方法を行うことで、画像を確認することなしに画像から計数した細胞数の異常の原因をユーザが切り分けることを支援することができる。従って、ユーザの作業負担を大幅に軽減することが可能となる。また、あるべき細胞数の推移を把握していないユーザであっても、第1グラフG1と第2グラフG2が異なる傾向を持って変化している場合には、異常発生の可能性を容易に認識することができる。
As described above, the system 1 assists the user in isolating the cause of the abnormality in the number of cells counted from the image without checking the image by performing the cell number information display method according to the present embodiment. Can be done. Therefore, it is possible to significantly reduce the work load of the user. In addition, even if the user does not know the transition of the desired number of cells, if the first graph G1 and the second graph G2 change with different tendencies, the possibility of abnormal occurrence can be easily detected. Can be recognized.
図11は、細胞数情報表示画面の別の例を示した図である。図9では、第1グラフG1と第2グラフG2が折れ線グラフである例を示したが、各グラフの種類は折れ線グラフに限らない。システム1は、例えば、図11に示す画面35bのように、棒グラフを用いて第1細胞数の時間に対する変化(第1グラフ)と第2細胞数の時間に対する変化(第2グラフ)を表示してもよい。
FIG. 11 is a diagram showing another example of the cell number information display screen. In FIG. 9, an example in which the first graph G1 and the second graph G2 are line graphs is shown, but the type of each graph is not limited to the line graph. For example, as shown in screen 35b shown in FIG. 11, the system 1 displays a change in the number of first cells with time (first graph) and a change in the number of second cells with time (second graph) using a bar graph. You may.
図12は、細胞数情報表示画面の更に別の例を示した図である。図9及び図11では、第1グラフG1と第2グラフG2の両方を表示する例を示したが、細胞数情報表示画面には、細胞数の変化を容易に確認するために、少なくとも一方が表示されればよい。システム1は、例えば、図12に示す画面35cのように、第1グラフG1のみを表示し、ユーザが第1グラフG1上にポインターPを置くことで、ポインターPの位置に対応する時刻における第2細胞数を表示してもよい。この場合も、第2細胞数が表示されることで、第1細胞数と第2細胞数の対応関係が画面35cに可視化されるため、画像を確認することなしに細胞数の異常の原因を切り分けることが可能である。
FIG. 12 is a diagram showing still another example of the cell number information display screen. 9 and 11 show an example of displaying both the first graph G1 and the second graph G2, but at least one of them is displayed on the cell number information display screen in order to easily confirm the change in the cell number. It should be displayed. The system 1 displays only the first graph G1 as shown in the screen 35c shown in FIG. 12, and the user places the pointer P on the first graph G1 so that the position of the pointer P at the time corresponding to the position of the pointer P can be changed. 2 The number of cells may be displayed. In this case as well, by displaying the number of the second cell, the correspondence between the number of the first cell and the number of the second cell is visualized on the screen 35c, so that the cause of the abnormality in the number of cells can be determined without checking the image. It is possible to separate.
図13は、細胞数情報表示画面の更に別の例を示した図である。図9及び図11では、細胞数の時間に対する変化を示すグラフを表示する例を示したが、細胞数情報表示画面には、細胞数そのものが表示されてもよい。システム1は、例えば、図13に示す画面35dのように、第1細胞数と第2細胞数の数値を並べて表示してもよい。この場合も、表示されている第1細胞数と第2細胞数が随時更新されることで、ユーザは第1細胞数と第2細胞数の対応関係とその時間変化を把握することができる。このため、他の表示例と同様に、画像を確認することなしに細胞数の異常の原因を切り分けることが可能である。
FIG. 13 is a diagram showing still another example of the cell number information display screen. Although FIGS. 9 and 11 show an example of displaying a graph showing a change in the number of cells with respect to time, the number of cells itself may be displayed on the cell number information display screen. The system 1 may display the numerical values of the number of first cells and the number of second cells side by side, for example, as shown in the screen 35d shown in FIG. In this case as well, the displayed number of first cells and the number of second cells are updated as needed, so that the user can grasp the correspondence between the number of first cells and the number of second cells and the change over time. Therefore, as in the other display examples, it is possible to isolate the cause of the abnormal cell number without checking the image.
[第2の実施形態]
図14は、細胞数情報表示画面を生成するまでの処理の流れの別の例を説明するための図である。図15は、細胞数情報表示画面の更に別の例を示した図である。図16は、細胞数情報表示画面に基づく異常原因の切り分け方について説明するための図である。以下、図14から図16を参照しながら、軟骨細胞について細胞培養を行う場合を例にして、システム1が行う第2の実施形態に係る監視支援方法について説明する。なお、本実施形態は、第1計数モデルと第2計数モデルの間の細胞認識結果の違いを示す指標を可視化する点が、第1の実施形態とは異なる。なお、この指標は、第1細胞数と第2細胞数に基づいて算出される細胞認識結果の違いを示すものであればよく、例えば、第1細胞数と第2細胞数の比であってもよく、第1細胞数と第2細胞数の差であってもよく、その差の自乗であってもよい。 [Second Embodiment]
FIG. 14 is a diagram for explaining another example of the flow of processing until the cell number information display screen is generated. FIG. 15 is a diagram showing still another example of the cell number information display screen. FIG. 16 is a diagram for explaining how to isolate the cause of abnormality based on the cell number information display screen. Hereinafter, the monitoring support method according to the second embodiment performed by thesystem 1 will be described with reference to FIGS. 14 to 16 as an example of performing cell culture for chondrocytes. The present embodiment is different from the first embodiment in that the index indicating the difference in the cell recognition result between the first counting model and the second counting model is visualized. Note that this index may indicate the difference in cell recognition results calculated based on the number of first cells and the number of second cells, and is, for example, the ratio of the number of first cells to the number of second cells. It may be the difference between the number of first cells and the number of second cells, or it may be the square of the difference.
図14は、細胞数情報表示画面を生成するまでの処理の流れの別の例を説明するための図である。図15は、細胞数情報表示画面の更に別の例を示した図である。図16は、細胞数情報表示画面に基づく異常原因の切り分け方について説明するための図である。以下、図14から図16を参照しながら、軟骨細胞について細胞培養を行う場合を例にして、システム1が行う第2の実施形態に係る監視支援方法について説明する。なお、本実施形態は、第1計数モデルと第2計数モデルの間の細胞認識結果の違いを示す指標を可視化する点が、第1の実施形態とは異なる。なお、この指標は、第1細胞数と第2細胞数に基づいて算出される細胞認識結果の違いを示すものであればよく、例えば、第1細胞数と第2細胞数の比であってもよく、第1細胞数と第2細胞数の差であってもよく、その差の自乗であってもよい。 [Second Embodiment]
FIG. 14 is a diagram for explaining another example of the flow of processing until the cell number information display screen is generated. FIG. 15 is a diagram showing still another example of the cell number information display screen. FIG. 16 is a diagram for explaining how to isolate the cause of abnormality based on the cell number information display screen. Hereinafter, the monitoring support method according to the second embodiment performed by the
図14に示すように、システム1では、制御装置30は、軟骨細胞の細胞画像2を第1計数モデルM1と第2計数モデルM2に入力し、第1計数モデルM1から出力された第1細胞数3と第2計数モデルM2から出力された第2細胞数4を履歴部Hに格納する。さらに、制御装置30は、履歴部Hに蓄積された第1細胞数3の履歴5と第2細胞数4の履歴を読み出して画面生成部D1に入力する。
As shown in FIG. 14, in the system 1, the control device 30 inputs the cell image 2 of the chondrocyte into the first counting model M1 and the second counting model M2, and the first cell output from the first counting model M1. The number 3 and the number 4 of the second cells output from the second counting model M2 are stored in the history unit H. Further, the control device 30 reads out the history 5 of the first cell number 3 and the history of the second cell number 4 accumulated in the history unit H and inputs them to the screen generation unit D1.
画面生成部D1では、第1細胞数の履歴5に基づいて第1細胞数の時間に対する変化を示す第1グラフG1を生成する第1グラフ生成処理と、第1細胞数の履歴5と第2細胞数の履歴6に基づいて各時刻における指標を算出する指標算出処理と、指標の時間に対する変化を示す第3グラフG3を生成する第3グラフ生成処理と、が行われる。このため、出力装置35に表示される画面35eには、図15に示すように、第1グラフG1と第2グラフG3が含まれる。即ち、制御装置30は、画面35eを表示するにあたり、出力装置35に第1グラフG1を表示し、出力装置35に第3グラフG3を表示する。
In the screen generation unit D1, the first graph generation process for generating the first graph G1 showing the change of the first cell number with time based on the history 5 of the first cell number, and the history 5 and the second of the first cell number An index calculation process for calculating an index at each time based on the history 6 of the number of cells and a third graph generation process for generating a third graph G3 showing a change in the index with time are performed. Therefore, the screen 35e displayed on the output device 35 includes the first graph G1 and the second graph G3 as shown in FIG. That is, when displaying the screen 35e, the control device 30 displays the first graph G1 on the output device 35 and displays the third graph G3 on the output device 35.
第1グラフG1と第3グラフG3が表示されることで、第1グラフG1と第3グラフG3の関係によって第1細胞数と第2細胞数の対応関係の時間に対する変化も可視される。このため、あるべき細胞数の推移を認識しているユーザは、画面35eを確認することで、細胞数が正常に推移しているかどうかを確認することに加えて、異常の原因が培養環境にあるのか画像認識上の欠陥にあるのかについても切り分けることができる。
By displaying the first graph G1 and the third graph G3, the change in the correspondence between the number of first cells and the number of second cells with respect to time is also visible due to the relationship between the first graph G1 and the third graph G3. Therefore, the user who is aware of the transition of the desired number of cells can confirm whether or not the number of cells is transitioning normally by checking the screen 35e, and the cause of the abnormality is the culture environment. It is also possible to distinguish whether it is present or has a defect in image recognition.
具体的には、図16のケースC1aに示すように、第1グラフG1があるべき細胞数の推移とは顕著に異なった傾向を示しておらず、第3グラフG3が、例えば一定の範囲に収まっているなど、一定の傾向で推移している場合には、ユーザは、細胞培養は正常に行われていると判断することができる。
Specifically, as shown in case C1a of FIG. 16, the first graph G1 does not show a significantly different tendency from the transition of the number of cells that should be, and the third graph G3 is, for example, within a certain range. If the trend is constant, such as when the cells are settled, the user can determine that the cell culture is normally performed.
これに対して、図16のケースC2aからケースC4aに示すように、第3グラフG3が一定の傾向で推移していない、又は、第1グラフG1があるべき細胞数の推移とは顕著に異なっている傾向を示している場合には、ユーザは、異常を疑うことができる。
On the other hand, as shown in Cases C2a to C4a of FIG. 16, the third graph G3 does not change with a constant tendency, or the first graph G1 is significantly different from the change in the number of cells that should be. The user can suspect an anomaly if it shows a tendency to.
より具体的には、図16のケースC2aに示すように、第1グラフG1が不自然な変化を示し、それに伴って第3グラフG3が変動している場合には、細胞の形状変化が原因となって、細胞をより厳しい基準で認定する第1計数モデルで細胞数を正しく認識できていない可能を疑うことができる。つまり、培養環境の異常ではなく画像認識上の欠陥である可能性が高いと判断することができる。これは、第1グラフG1と第3グラフG3の関係から第2細胞数については不自然な変化は生じていないと判断可能であり、従って、図10に示すケースC2と同様と判断できるからである。
More specifically, as shown in case C2a of FIG. 16, when the first graph G1 shows an unnatural change and the third graph G3 fluctuates accordingly, the cause is a change in cell shape. Therefore, it is possible to suspect that the number of cells may not be correctly recognized by the first counting model that certifies cells according to stricter criteria. That is, it can be determined that there is a high possibility that it is not an abnormality in the culture environment but a defect in image recognition. This is because it can be judged from the relationship between the first graph G1 and the third graph G3 that no unnatural change has occurred in the number of the second cells, and therefore, it can be judged to be the same as the case C2 shown in FIG. is there.
また、図16のケースC3aに示すように、第1グラフG1が不自然な変化を示し、それに伴って第3グラフG3が変動していない場合には、実際に細胞数が不自然に変化していると判断することができる。つまり、培養環境に起因した異常が生じている可能性が高いと判断することができる。これは、第1グラフG1と第3グラフG3の関係から第2細胞数にも第1細胞数と同様の不自然な変化が生じていると判断可能であり、従って、図10に示すケースC3と同様と判断できるからである。
Further, as shown in case C3a of FIG. 16, when the first graph G1 shows an unnatural change and the third graph G3 does not fluctuate accordingly, the number of cells actually changes unnaturally. It can be judged that it is. That is, it can be determined that there is a high possibility that an abnormality caused by the culture environment has occurred. From the relationship between the first graph G1 and the third graph G3, it can be determined that the number of the second cells has an unnatural change similar to the number of the first cells. Therefore, case C3 shown in FIG. This is because it can be judged to be the same as.
さらに、図16のケースC4aに示すように、細胞培養の途中から第3グラフG3の傾向に明らかな変化が生じている場合にも、培養環境に起因した異常が生じている可能性が高いと判断することができる。これは、第1グラフG1と第3グラフG3の関係から第2細胞数のみに不自然な変化が生じていると判断可能であり、従って、図10に示すケースC4と同様と判断できるからである。
Furthermore, as shown in case C4a of FIG. 16, even when a clear change occurs in the tendency of the third graph G3 from the middle of cell culture, there is a high possibility that an abnormality due to the culture environment has occurred. You can judge. This is because it can be judged from the relationship between the first graph G1 and the third graph G3 that an unnatural change occurs only in the number of the second cells, and therefore, it can be judged to be the same as the case C4 shown in FIG. is there.
以上のように、システム1は、本実施形態に係る細胞数情報表示方法を行うことによっても、第1の実施形態に係る細胞数情報表示方法を行った場合と同様の効果を達成することができる。
As described above, the system 1 can achieve the same effect as the case where the cell number information display method according to the first embodiment is performed by performing the cell number information display method according to the present embodiment. it can.
図17は、細胞数情報表示画面の更に別の例を示した図である。図15では、第1グラフG1と第3グラフG3を表示する例を示したが、システム1は、例えば、図17に示す画面35fのように、第1グラフG1と第2グラフG2と第3グラフG3を表示してもよい。システム1は、第1グラフG1と第2グラフG2の少なくとも一方と、第3グラフG3を表示すればよく、従って、第1グラフG1を表示することなしに、第2グラフG2と第3グラフG3を表示してもよい。
FIG. 17 is a diagram showing still another example of the cell number information display screen. In FIG. 15, an example of displaying the first graph G1 and the third graph G3 is shown, but in the system 1, for example, as shown in the screen 35f shown in FIG. 17, the first graph G1, the second graph G2, and the third graph G3 are displayed. Graph G3 may be displayed. The system 1 may display at least one of the first graph G1 and the second graph G2 and the third graph G3, and therefore, without displaying the first graph G1, the second graph G2 and the third graph G3. May be displayed.
上述した実施形態は、発明の理解を容易にするための具体例を示したものであり、本発明の実施形態はこれらに限定されるものではない。上述した実施形態の一部を他の実施形態に適用しても良い。細胞数情報の表示方法、システム、及び、プログラムは、特許請求の範囲の記載を逸脱しない範囲において、さまざまな変形、変更が可能である。
The above-described embodiments show specific examples for facilitating the understanding of the invention, and the embodiments of the present invention are not limited thereto. Some of the above-described embodiments may be applied to other embodiments. The cell number information display method, system, and program can be variously modified and changed without departing from the description of the claims.
上述した実施形態では、システム1内で細胞を計数する例を示したが、細胞の計数は、システム1外で行われてもよい。例えば、図18に示すシステム1aのように、細胞を計数する外部のサービス(セルカウントサービス200)を利用して、第1細胞数と第2細胞数を取得してもよい。システム1aが有する制御装置30aは、システム1a外部のセルカウントサービス200から細胞数を取得する点を除き、制御装置30と同様である。
In the above-described embodiment, an example of counting cells inside the system 1 is shown, but the counting of cells may be performed outside the system 1. For example, as in the system 1a shown in FIG. 18, the number of first cells and the number of second cells may be obtained by using an external service for counting cells (cell counting service 200). The control device 30a included in the system 1a is the same as the control device 30 except that the number of cells is acquired from the cell count service 200 outside the system 1a.
上述した実施形態では、2つの計数モデルを使用する例を示したが、少なくとも2つの計数モデルが使用されればよく、3つ以上の計数モデルを使用して細胞数を取得してもよい。計数モデル間の特徴の違いが事前に把握されている限り、これらの計数モデルから出力された細胞数間の関係から異常の原因を推定することが可能であり、原因の切り分けを画像を確認することなしに行うことが可能である。
In the above-described embodiment, an example of using two counting models has been shown, but at least two counting models may be used, and the number of cells may be obtained using three or more counting models. As long as the difference in characteristics between the counting models is known in advance, it is possible to estimate the cause of the abnormality from the relationship between the number of cells output from these counting models, and check the image to isolate the cause. It can be done without any problems.
また、上述した実施形態では、細胞数情報表示画面を表示する例を示したが、ユーザが細胞数情報表示画面内で特定の位置を選択することで、選択された位置に応じた時刻に取得された細胞画像を、例えば、ポップアップ形式で表示してもよい。これにより、細胞数情報表示画面によって異常の原因を切り分けて真に画像の確認が必要な状況を特定した上で、さらに、簡単な操作で画像を確認することができる。このため、画像確認回数の低減と画像確認作業の簡素化により、ユーザの作業負担をさらに軽減することができる。
Further, in the above-described embodiment, an example of displaying the cell number information display screen is shown, but when the user selects a specific position in the cell number information display screen, the time is acquired according to the selected position. The cell image may be displayed in a pop-up format, for example. As a result, it is possible to isolate the cause of the abnormality on the cell number information display screen, identify the situation in which the image really needs to be confirmed, and then confirm the image with a simple operation. Therefore, the workload of the user can be further reduced by reducing the number of image confirmations and simplifying the image confirmation work.
また、計数モデルが機械学習モデルである場合には、細胞数情報表示画面から表示した画像から画像認識上の欠陥をユーザが確認した後に、その画像を教師データとして利用して、第1計数モデルのみ、又は、第1計数モデルと第2計数モデルの両方を訓練してもよい。これにより、第1計数モデルの適合率が改善されるため、第1計数モデルと第2計数モデルの関係を維持しながら、培養細胞が目標数に達したか否かを判断するためにユーザが使用する第1細胞数の信頼性を改善することができる。
When the counting model is a machine learning model, after the user confirms a defect in image recognition from the image displayed from the cell number information display screen, the image is used as training data to be used as the first counting model. Only or both the first counting model and the second counting model may be trained. This improves the suitability of the first counting model, so that the user can determine whether or not the number of cultured cells has reached the target number while maintaining the relationship between the first counting model and the second counting model. The reliability of the number of first cells used can be improved.
また、上述した実施形態では、計数モデルがニューラルネットワークを用いた訓練済みの機械学習モデルである場合を例にしたが、計数モデルは、ニューラルネットワークを利用するものに限らず、他の機械学習モデルであってもよい。また、機械学習モデルでなくてもよく、特定のルールベースで細胞を計数するモデルであってもよい。例えば、テンプレートマッチングを用いて細胞を計数する計数モデルであってもよく、二値化した画像から細胞を計数する計数モデルであってもよい。また、染色された核を計数することで細胞を計数する計数モデルであってもよい。適合率優位の計数モデルと再現率優位の計数モデルの組み合わせで使用される限り、機械学習モデルとルールベースの計数モデルを組み合わせて使用してもよい。また、二値化した画像から細胞を計数する計数モデルを再現率優位の計数モデルとして利用し、染色された核を計数する計数モデルを適合率優位の計数モデルとして利用してもよい。
Further, in the above-described embodiment, the case where the counting model is a trained machine learning model using a neural network is taken as an example, but the counting model is not limited to the one using a neural network, and other machine learning models. It may be. Further, it does not have to be a machine learning model, and it may be a model for counting cells based on a specific rule. For example, it may be a counting model that counts cells by using template matching, or it may be a counting model that counts cells from a binarized image. It may also be a counting model that counts cells by counting stained nuclei. A machine learning model and a rule-based counting model may be used in combination as long as they are used in combination with a precision-dominant counting model and a recall-dominant counting model. Further, a counting model for counting cells from a binarized image may be used as a counting model with a superior recall rate, and a counting model for counting stained nuclei may be used as a counting model with a dominant precision rate.
また、上述した実施形態では、細胞を計数する例を示したが、細胞に加えて、コロニーを計数してもよい。コロニーは細胞の集合であるので、細胞を認識し、さらに、細胞間の位置関係を認識することができれば、コロニーを認識することも可能である。細胞に加えてコロニーを計数することで、細胞培養についてさらに多くの情報をユーザに提供することが可能となる。
Further, in the above-described embodiment, an example of counting cells is shown, but colonies may be counted in addition to cells. Since a colony is a collection of cells, it is possible to recognize a colony if the cells can be recognized and the positional relationship between the cells can be recognized. By counting colonies in addition to cells, it is possible to provide users with more information about cell culture.
また、上述した実施形態では、ユーザが異常を検出する例を示したが、システム1が異常を検出し、検出した異常をユーザに画面表示を通じて通知してもよい。例えば、第1細胞数と第2細胞数の差がある一定値以上に大きくなった場合、あるいは、別の一定値以下に小さくなった場合に、その旨をユーザに通知しても良い。それと同時に、システム1は、例えば、図9に示す画面35aを表示しても良い。通知に反応して画面35aを確認したユーザは、異常原因を画面35a上の情報に基づいて各自で切り分けることができる。また、制御装置30が、異常の原因を特定し、特定された異常の原因をユーザに通知しても良い。
Further, in the above-described embodiment, the example in which the user detects the abnormality is shown, but the system 1 may detect the abnormality and notify the user of the detected abnormality through the screen display. For example, when the difference between the number of first cells and the number of second cells becomes larger than a certain value or smaller than another certain value, the user may be notified to that effect. At the same time, the system 1 may display, for example, the screen 35a shown in FIG. The user who confirms the screen 35a in response to the notification can isolate the cause of the abnormality by himself / herself based on the information on the screen 35a. Further, the control device 30 may identify the cause of the abnormality and notify the user of the cause of the identified abnormality.
なお、上記の通知は、ユーザが所有する携帯端末であるスマートフォン、タブレット型コンピュータなどにワイヤレス通信で送られても良い。ワイヤレス通信は、例えば、WiFi、LTE、NFC、Bluetooth(登録商標)などを用いて行われてよく、通知は、PAN、LAN、WANなどの任意のネットワークを経由して伝達されても良い。これにより、ユーザはインキュベータ付近又は作業室にいなくても培養細胞に何らかの異常が生じたかどうかを知ることができる。制御装置30自身が異常と判断する場合、経験不足で細胞数を見ても異常と判断することが困難な作業者であっても、直感では異常と判断できない作業者であっても、容易に異常の発生を知ることが出来る。通知は、インキュベータ付近又は作業室内に設置されたコンピュータ等の画面に表示してもよい。また、通知は、図9に示すグラフが表示されている画面35aと同様の画面に表示されても良い。
The above notification may be sent by wireless communication to a smartphone, tablet computer, etc., which is a mobile terminal owned by the user. Wireless communication may be performed using, for example, WiFi, LTE, NFC, Bluetooth®, etc., and notifications may be transmitted via any network such as PAN, LAN, WAN, etc. This allows the user to know if any abnormality has occurred in the cultured cells even if he / she is not near the incubator or in the work room. When the control device 30 itself determines that it is abnormal, it is easy for a worker who is inexperienced and difficult to judge it as abnormal even by looking at the number of cells, or a worker who cannot intuitively judge it as abnormal. You can know the occurrence of an abnormality. The notification may be displayed on the screen of a computer or the like installed near the incubator or in the work room. Further, the notification may be displayed on the same screen as the screen 35a on which the graph shown in FIG. 9 is displayed.
また、上述した実施形態では、画面表示を確認したユーザが異常の原因を切り分ける例を示したが、画面表示に使用した情報に基づいて制御装置30が異常原因について判定して、ユーザに通知してもよい。例えば、図9に示す画面35aが表示される場合であれば、第1細胞数が第2細胞数を上回ったこと、又は、第1細胞数が第2細胞数よりも一定以上小さくなったことを検出することによって、制御装置30は画像認識上の欠陥が異常の原因であると判定して、ユーザにその旨を報知してもよい。判定によって特定された異常の原因は、グラフが表示されている画面に重畳表示してもよい。また、ある程度一定に推移していた第1細胞数と第2細胞数の差が著しく変化し始めたことを検出することによって、制御装置30は培養環境に異常が生じたと判定して、ユーザにその旨を報知しても良く、判定によって特定された異常の原因は、図19に示すように、グラフが表示されている画面35gに重畳表示してもよい。また、図9で、異常が生じたと判定された撮像時刻において、制御装置30が異常の発生及び異常の原因をグラフに重畳して表示しても良い。また、異常である可能性の大きさを例えば割合を使って表示しても良い。異常である可能性の大きさは、例えば第1細胞数と第2細胞数の関係の変化量の大小から推定することが出来る。制御装置30が判定する異常原因は、例えば、細胞の培養環境の異常、画像認識の異常、培養環境の異常と画像認識の異常の組み合わせであってもよい。ユーザは、制御装置30が判定した判定結果(異常原因)と画面表示を参考にして異常原因を切り分けてもよい。グラフに異常の発生及び原因が重畳表示される場合、ユーザはグラフを見ることによって異常原因を推定する手間が省けるほか、経験不足で細胞数を見ても異常の原因を判断することが困難な作業者であっても、直感では異常と判断できない作業者であっても、異常原因の特定が支援されることで異常の原因を特定することが可能となる。
Further, in the above-described embodiment, the user who has confirmed the screen display has shown an example of isolating the cause of the abnormality, but the control device 30 determines the cause of the abnormality based on the information used for the screen display and notifies the user. You may. For example, when the screen 35a shown in FIG. 9 is displayed, the number of the first cells has exceeded the number of the second cells, or the number of the first cells has become smaller than the number of the second cells by a certain amount or more. By detecting the above, the control device 30 may determine that the defect in image recognition is the cause of the abnormality and notify the user to that effect. The cause of the abnormality identified by the determination may be superimposed and displayed on the screen on which the graph is displayed. In addition, by detecting that the difference between the number of first cells and the number of second cells, which has remained constant to some extent, has begun to change significantly, the control device 30 determines that an abnormality has occurred in the culture environment and informs the user. The fact may be notified, and the cause of the abnormality identified by the determination may be superimposed and displayed on the screen 35g on which the graph is displayed, as shown in FIG. Further, in FIG. 9, the control device 30 may superimpose the occurrence of the abnormality and the cause of the abnormality on the graph at the imaging time when it is determined that the abnormality has occurred. Further, the magnitude of the possibility of abnormality may be displayed by using, for example, a ratio. The magnitude of the possibility of abnormality can be estimated from, for example, the magnitude of the change in the relationship between the number of first cells and the number of second cells. The cause of the abnormality determined by the control device 30 may be, for example, an abnormality in the cell culture environment, an abnormality in image recognition, an abnormality in the culture environment, and an abnormality in image recognition. The user may isolate the cause of the abnormality by referring to the determination result (cause of the abnormality) determined by the control device 30 and the screen display. When the occurrence and cause of an abnormality are superimposed on the graph, the user can save the trouble of estimating the cause of the abnormality by looking at the graph, and it is difficult to determine the cause of the abnormality even by looking at the number of cells due to lack of experience. Whether it is a worker or a worker who cannot be intuitively determined to be abnormal, it is possible to identify the cause of the abnormality by supporting the identification of the cause of the abnormality.
上述した実施形態では、細胞培養の環境をリアルタイムで監視することを想定したが、培養期間中に順次撮像した複数の細胞画像のセットを用いることにより、培養を振り返って培養の質を確認することもできる。例えばユーザは、過去の培養結果である複数の細胞画像に対し第1計数モデル及び第2計数モデルを適用して第1細胞数及び第2細胞数を算出し、特定の撮像時点で培養環境に異常が起きたかどうか、あるいは画像の誤認識が起きたかどうかを振り返ることが出来る。培養環境に異常が起きた撮像時刻を知ることが出来れば、その時刻での作業者の手技や培養環境を見直すことが可能であるし、画像の誤認識が起きたかどうかを知ることが出来れば、それぞれの計数モデルの改善につなげることが出来る。なお振り返りの際は、グラフ等を表示してユーザ自身で異常原因の判定を行っても良いし、制御装置30や外部セルカウントサービスを利用して異常原因の判定を行っても良い。
In the above-described embodiment, it is assumed that the environment of the cell culture is monitored in real time, but the quality of the culture is confirmed by looking back on the culture by using a set of a plurality of cell images sequentially imaged during the culture period. You can also. For example, the user applies the first counting model and the second counting model to a plurality of cell images that are the results of past culture to calculate the number of first cells and the number of second cells, and puts them in the culture environment at a specific imaging time. It is possible to look back on whether an abnormality has occurred or whether an image has been misrecognized. If it is possible to know the imaging time when an abnormality occurred in the culture environment, it is possible to review the operator's procedure and culture environment at that time, and if it is possible to know whether or not an image misrecognition has occurred. , Can lead to improvement of each counting model. When looking back, the user may determine the cause of the abnormality by displaying a graph or the like, or may use the control device 30 or an external cell counting service to determine the cause of the abnormality.
上述した実施形態では、細胞数の推移を表示する例を示したが、細胞数の推移の表示は必要に応じて行われてもよい。システム1は、例えば、図5に示す処理のステップS4の画面表示処理を省略してもよく、その代わりに、第1細胞数と第2細胞数の関係に基づいて培養環境の異常を検出すると、異常発生をユーザに通知する処理を行ってもよい。通知を受けたユーザは、さらに細胞画像を確認して異常の詳細を確認してもよい。
In the above-described embodiment, an example of displaying the transition of the cell number is shown, but the transition of the cell number may be displayed as needed. For example, the system 1 may omit the screen display process of step S4 of the process shown in FIG. 5, and instead, detect an abnormality in the culture environment based on the relationship between the number of first cells and the number of second cells. , The process of notifying the user of the occurrence of an abnormality may be performed. The notified user may further confirm the cell image to confirm the details of the abnormality.
また、上述した実施形態では、計数モデル間の違いを適合率と再現率の概念を用いて説明したが、再現率の高い第2計数モデルの代わりに特異度の高い計数モデルを用いて適合率の高い第1計数モデルと比較を行っても良い。特異度とは、観察対象物が目的の対象物でないという陰性判定をどの程度正確に行えたかを示す負の正確性の指標である。つまり特異度の高い計数モデルは、細胞を計数する機能でなく、目的細胞でない対象物(ゴミや目的外の細胞、死細胞など)を確実に検出する、いわばノイズ判定の役割を持っている。
Further, in the above-described embodiment, the difference between the counting models is explained by using the concept of the precision rate and the recall rate, but the matching rate is used by using the counting model having high specificity instead of the second counting model having a high recall rate. It may be compared with the first counting model having a high value. Specificity is an index of negative accuracy that indicates how accurately a negative determination that an observation object is not an object of interest can be made. In other words, the highly specific counting model does not have the function of counting cells, but has the role of noise determination, which reliably detects objects that are not target cells (dust, untargeted cells, dead cells, etc.).
本明細書では、適合率、再現率、特異度という言葉を用いたが、同様の意味を表しているのであればこの単語には限定されない。具体的には、適合率の意味で用いられる言葉には精度や陽性反応的中度(PPV)、再現率の意味で用いられる言葉には感度や真陽性率、特異度の意味で用いられる言葉には真陰性率、などの言葉がある。
In this specification, the terms precision rate, recall rate, and specificity are used, but they are not limited to these terms as long as they have the same meaning. Specifically, the words used to mean precision are accuracy and positive reactive value (PPV), and the words used to mean recall are words used to mean sensitivity, true positive rate, and specificity. Has words such as true negative rate.
1、1a システム
2 細胞画像
2a 出力画像
2b 染色画像
3 第1細胞数
4 第2細胞数
5 第1細胞数の履歴
6 第2細胞数の履歴
10 撮影装置
15 撮像素子
20 インキュベータ
30、30a 制御装置
31 プロセッサ
32 メモリ
35 出力装置
35a~35g 画面
40、50 クライアント端末
100 培養容器
C 細胞
CM 培地
D、D1 画面生成部
DS1、DS2 教師データ
G1 第1グラフ
G2 第2グラフ
G3 第3グラフ
H 履歴部
M1 第1計数モデル
M2 第2計数モデル 1,1a System 2 Cell image 2a Output image 2b Stained image 3 1st cell number 4 2nd cell number 5 1st cell number history 6 2nd cell number history 10 Imaging device 15 Imaging element 20 Incubator 30, 30a Control device 31 Processor 32 Memory 35 Output device 35a to 35g Screen 40, 50 Client terminal 100 Culture vessel C Cell CM Medium D, D1 Screen generator DS1, DS2 Teacher data G1 First graph G2 Second graph G3 Third graph H History unit M1 1st counting model M2 2nd counting model
2 細胞画像
2a 出力画像
2b 染色画像
3 第1細胞数
4 第2細胞数
5 第1細胞数の履歴
6 第2細胞数の履歴
10 撮影装置
15 撮像素子
20 インキュベータ
30、30a 制御装置
31 プロセッサ
32 メモリ
35 出力装置
35a~35g 画面
40、50 クライアント端末
100 培養容器
C 細胞
CM 培地
D、D1 画面生成部
DS1、DS2 教師データ
G1 第1グラフ
G2 第2グラフ
G3 第3グラフ
H 履歴部
M1 第1計数モデル
M2 第2計数モデル 1,
Claims (19)
- 細胞が順次撮像された複数の細胞画像を取得する工程と、
画像に含まれる細胞を計数する第1計数モデルに前記複数の細胞画像の各々を適用して出力された第1細胞数を取得する工程と、
画像に含まれる細胞を計数する第2計数モデルに前記第1細胞数を取得した画像と同じ前記複数の細胞画像の各々を適用して出力された第2細胞数を取得する工程であって、前記第2計数モデルは、前記第1計数モデルと異なる、という工程と、
前記第1細胞数と前記第2細胞数とに基づいて、前記第1細胞数と前記第2細胞数の少なくとも一方と、前記第1細胞数と前記第2細胞数の対応関係と、を可視化した画面を表示する工程と、を含む
ことを特徴とする細胞数情報の表示方法。 The process of acquiring multiple cell images in which cells are sequentially imaged,
A step of applying each of the plurality of cell images to a first counting model for counting cells included in an image to obtain the output number of first cells, and
It is a step of acquiring the output second cell number by applying each of the same plurality of cell images as the image obtained by acquiring the first cell number to the second counting model for counting the cells included in the image. The step that the second counting model is different from the first counting model,
Based on the number of the first cells and the number of the second cells, at least one of the number of the first cells and the number of the second cells, and the correspondence between the number of the first cells and the number of the second cells are visualized. A method of displaying cell number information, which comprises a step of displaying a screen. - 請求項1に記載の細胞数情報の表示方法において、
前記第1計数モデルは、前記第2計数モデルの適合率よりも高い適合率を有し、前記第2計数モデルの再現率よりも低い再現率を有する
ことを特徴とする細胞数情報の表示方法。 In the method for displaying cell number information according to claim 1,
The method for displaying cell number information, wherein the first counting model has a higher matching rate than the second counting model and a lower recall rate than the second counting model. .. - 請求項2に記載の細胞数情報の表示方法において、
前記画面を表示する工程は、前記複数の細胞画像に対応する複数の第1細胞数を含む第1細胞数の履歴と前記複数の細胞画像に対応する複数の第2細胞数を含む第2細胞数の履歴とに基づいて、前記画面を表示する工程を含み、
前記画面は、前記第1細胞数と前記第2細胞数の少なくとも一方の時間に対する変化と、前記対応関係の時間に対する変化と、を可視化した画面である
ことを特徴とする細胞数情報の表示方法。 In the method for displaying cell number information according to claim 2,
The step of displaying the screen is a history of the number of first cells including a plurality of first cell numbers corresponding to the plurality of cell images and a second cell including a plurality of second cell numbers corresponding to the plurality of cell images. Including the step of displaying the screen based on the history of numbers,
The screen is a screen for visualizing a change in the number of the first cells and the number of the second cells with respect to at least one time and a change with respect to the time of the correspondence relationship, which is a method for displaying cell number information. .. - 請求項3に記載の細胞数情報の表示方法において、
前記画面を表示する工程は、
前記第1細胞数の時間に対する変化を示す第1グラフを表示する工程と、
前記第2細胞数の時間に対する変化を示す第2グラフを表示する工程と、を含み、
前記第1グラフと前記第2グラフの関係によって前記対応関係の時間に対する変化が可視される
ことを特徴とする細胞数情報の表示方法。 In the method for displaying cell number information according to claim 3,
The process of displaying the screen is
The step of displaying the first graph showing the change in the number of first cells with time, and
Including a step of displaying a second graph showing a change in the number of second cells with respect to time.
A method for displaying cell number information, wherein a change in the correspondence relationship with time is visible by the relationship between the first graph and the second graph. - 請求項3に記載の細胞数情報の表示方法において、
前記画面を表示する工程は、
前記第1細胞数の時間に対する変化を示す第1グラフと前記第2細胞数の時間に対する変化を示す第2グラフの少なくとも一方を表示する工程と、
前記第1細胞数と前記第2細胞数に基づいて算出される指標の時間に対する変化を示す第3グラフを表示する工程であって、前記指標は、前記第1計数モデルと前記第2計数モデルの間の細胞認識能力の違いを示す、という工程と、を含み、
前記第3グラフによって前記対応関係の時間に対する変化が可視化される
ことを特徴とする細胞数情報の表示方法。 In the method for displaying cell number information according to claim 3,
The process of displaying the screen is
A step of displaying at least one of a first graph showing a change in the number of first cells with time and a second graph showing a change in the number of second cells with respect to time.
A step of displaying a third graph showing a change with time of an index calculated based on the number of first cells and the number of second cells, wherein the index is the first counting model and the second counting model. Including the process of showing the difference in cell recognition ability between
A method for displaying cell number information, characterized in that the change in the correspondence relationship with time is visualized by the third graph. - 請求項5に記載の細胞数情報の表示方法において、
前記第1グラフと前記第2グラフの少なくとも一方を表示する工程は、前記第1グラフを表示する工程を含む
ことを特徴とする細胞数情報の表示方法。 In the method for displaying cell number information according to claim 5,
A method for displaying cell number information, wherein the step of displaying at least one of the first graph and the second graph includes a step of displaying the first graph. - 請求項1乃至請求項6のいずれか1項に記載の細胞数情報の表示方法において、
前記第1計数モデルと前記第2計数モデルは、それぞれ機械学習モデルである
ことを特徴とする細胞数情報の表示方法。 The method for displaying cell number information according to any one of claims 1 to 6.
A method for displaying cell number information, wherein the first counting model and the second counting model are machine learning models, respectively. - 請求項7に記載の細胞数情報の表示方法において、
前記細胞は、第1細胞であり、
前記第1計数モデルは、前記第1細胞と同じ細胞種の画像を教師データとして使用して訓練した訓練済みの機械学習モデルであり、
前記第2計数モデルは、前記第1細胞と同じ細胞種の画像と前記第1細胞とは異なる細胞種の画像を教師データとして使用して訓練した訓練済みの機械学習モデルである
ことを特徴とする細胞数情報の表示方法。 In the method for displaying cell number information according to claim 7,
The cell is the first cell and
The first counting model is a trained machine learning model trained using an image of the same cell type as the first cell as teacher data.
The second counting model is a trained machine learning model trained using an image of the same cell type as the first cell and an image of a cell type different from the first cell as teacher data. How to display the number of cells to be displayed. - 請求項2乃至請求項6のいずれか1項に記載の細胞数情報の表示方法において、
前記細胞画像は、インキュベータ内に配置された培養容器内の培養細胞の画像である
ことを特徴とする細胞数情報の表示方法。 The method for displaying cell number information according to any one of claims 2 to 6.
A method for displaying cell number information, wherein the cell image is an image of cultured cells in a culture vessel arranged in an incubator. - 請求項3乃至請求項6のいずれか1項に記載の細胞数情報の表示方法において、
前記画面を表示する工程は、前記対応関係の時間に対する変化に基づいて判定された、前記細胞の培養環境の異常、前記第1計数モデルと前記第2計数モデルの少なくとも一方の画像認識の異常、又は、前記培養環境の異常と前記画像認識の異常の組み合わせである、異常原因を前記画面に表示する工程を含む
ことを特徴とする細胞数情報の表示方法。 The method for displaying cell number information according to any one of claims 3 to 6.
The step of displaying the screen is an abnormality in the culture environment of the cells, an abnormality in image recognition of at least one of the first counting model and the second counting model, which is determined based on the change of the correspondence relationship with time. Alternatively, a method for displaying cell number information, which comprises a step of displaying the cause of the abnormality on the screen, which is a combination of the abnormality of the culture environment and the abnormality of the image recognition. - 請求項2乃至請求項6のいずれか1項に記載の細胞数情報の表示方法において、さらに、
前記画面の選択された位置に応じた時刻に取得された細胞画像を表示する工程と、を含む
ことを特徴とする細胞数情報の表示方法。 In the method for displaying cell number information according to any one of claims 2 to 6, further
A method for displaying cell number information, which comprises a step of displaying a cell image acquired at a time corresponding to a selected position on the screen, and a step of displaying the cell number information. - 細胞が順次撮像された複数の細胞画像を取得する工程と、
画像に含まれる細胞を計数する第1計数モデルに前記複数の細胞画像の各々を適用して出力された第1細胞数を取得する工程であって、前記第1計数モデルは、第2計数モデルの適合率よりも高い適合率を有し、前記第2計数モデルの再現率よりも低い再現率を有する、という工程と、
画像に含まれる細胞を計数する前記第2計数モデルに前記第1細胞数を取得した画像と同じ前記複数の細胞画像の各々を適用して出力された第2細胞数を取得する工程と、
前記第1細胞数と前記第2細胞数の関係に基づいて培養環境の異常を検出すると、異常発生をユーザに通知する工程と、を含む
ことを特徴とする細胞数情報の表示方法。 The process of acquiring multiple cell images in which cells are sequentially imaged,
It is a step of applying each of the plurality of cell images to the first counting model for counting the cells included in the image and acquiring the output first number of cells, and the first counting model is the second counting model. The process of having a higher precision rate than the precision rate of the second counting model and a lower recall rate than the recall rate of the second counting model.
A step of applying each of the plurality of cell images, which is the same as the image obtained by acquiring the first cell number, to the second counting model for counting the cells included in the image, and acquiring the output second cell number.
A method for displaying cell number information, which comprises a step of notifying a user of the occurrence of an abnormality when an abnormality in a culture environment is detected based on the relationship between the number of first cells and the number of second cells. - 請求項12に記載の方法において、さらに、
異常が検出された撮像時刻に撮像された細胞画像を表示装置に表示する工程を含む
ことを特徴とする細胞数情報の表示方法。 In the method of claim 12, further
A method for displaying cell number information, which comprises a step of displaying a cell image captured at an imaging time when an abnormality is detected on a display device. - 電気回路を含むシステムであって、
前記電気回路は、
撮像装置から細胞が順次撮像された複数の細胞画像を取得し、
画像に含まれる細胞を計数する第1計数モデルに前記複数の細胞画像の各々を適用して出力された第1細胞数を取得し、ここで、前記第1計数モデルは、第2計数モデルの適合率よりも高い適合率を有し、前記第2計数モデルの再現率よりも低い再現率を有し、
画像に含まれる細胞を計数する前記第2計数モデルに前記第1細胞数を取得した画像と同じ前記複数の細胞画像の各々を適用して出力された第2細胞数を取得し、
前記第1細胞数と前記第2計数モデルに前記第2細胞数とに基づいて、前記第1細胞数と前記第2細胞数の少なくとも一方と、前記第1細胞数と前記第2細胞数の対応関係と、を可視化した画面を表示装置に表示させる
ことを特徴とするシステム。 A system that includes an electric circuit
The electric circuit
Acquire a plurality of cell images in which cells are sequentially imaged from an imaging device,
Each of the plurality of cell images is applied to the first counting model for counting the cells included in the image to obtain the output first number of cells, and the first counting model is the second counting model. It has a higher precision rate than the precision rate, and has a lower recall rate than the recall rate of the second counting model.
By applying each of the plurality of cell images that are the same as the image obtained by acquiring the first cell number to the second counting model that counts the cells included in the image, the output second cell number is acquired.
Based on the number of the first cells and the number of the second cells in the second counting model, at least one of the number of the first cells and the number of the second cells, and the number of the first cells and the number of the second cells. A system characterized by displaying a screen that visualizes the correspondence relationship on a display device. - 請求項14に記載のシステムにおいて、
前記電気回路は、前記複数の細胞画像に対応する複数の第1細胞数を含む第1細胞数の履歴と前記複数の細胞画像に対応する複数の第2細胞数を含む第2細胞数の履歴とに基づいて、前記画面を前記表示装置に表示させ、
前記画面は、前記第1細胞数と前記第2細胞数の少なくとも一方の時間に対する変化と、前記対応関係の時間に対する変化と、を可視化した画面である
ことを特徴とするシステム。 In the system of claim 14,
The electric circuit has a history of the number of first cells including a plurality of first cell numbers corresponding to the plurality of cell images and a history of the number of second cells including a plurality of second cell numbers corresponding to the plurality of cell images. Based on the above, the screen is displayed on the display device, and the screen is displayed on the display device.
The screen is a system that visualizes a change in the number of the first cells and the number of the second cells with respect to at least one time and a change with respect to the time of the correspondence relationship. - 請求項15に記載のシステムにおいて、
前記画面は、
前記第1細胞数の時間に対する変化を示す第1グラフと、
前記第2細胞数の時間に対する変化を示す第2グラフと、を含み、
前記第1グラフと前記第2グラフの関係によって前記対応関係の時間に対する変化が可視される
ことを特徴とするシステム。 In the system of claim 15,
The screen is
The first graph showing the change in the number of first cells with time, and
Includes a second graph showing changes in the number of second cells over time.
A system characterized in that a change in the correspondence relationship with time is visible by the relationship between the first graph and the second graph. - 電気回路を含むシステムであって、
前記電気回路は、
撮像装置から細胞が順次撮像された複数の細胞画像を取得し、
画像に含まれる細胞を計数する第1計数モデルに前記複数の細胞画像の各々を適用して出力された第1細胞数を取得し、ここで、前記第1計数モデルは、第2計数モデルの適合率よりも高い適合率を有し、前記第2計数モデルの再現率よりも低い再現率を有し、
画像に含まれる細胞を計数する前記第2計数モデルに前記第1細胞数を取得した画像と同じ前記複数の細胞画像の各々を適用して出力された第2細胞数を取得し、
前記第1細胞数と前記第2細胞数の関係に基づいて培養環境の異常を検出すると、異常発生をユーザに通知する
ことを特徴とするシステム。 A system that includes an electric circuit
The electric circuit
Acquire a plurality of cell images in which cells are sequentially imaged from an imaging device,
Each of the plurality of cell images is applied to the first counting model for counting the cells included in the image to obtain the output first number of cells, and the first counting model is the second counting model. It has a higher precision than the precision and a lower recall than the second counting model.
The output number of second cells is obtained by applying each of the plurality of cell images that are the same as the image obtained by acquiring the number of first cells to the second counting model that counts the cells included in the image.
A system characterized in that when an abnormality in the culture environment is detected based on the relationship between the number of first cells and the number of second cells, the user is notified of the occurrence of the abnormality. - 請求項17に記載のシステムにおいて、
前記電気回路は、異常が検出された撮像時刻に撮像された細胞画像を表示装置に表示させる
ことを特徴とするシステム。 In the system of claim 17,
The electric circuit is a system characterized in that a display device displays a cell image captured at an imaging time when an abnormality is detected. - コンピュータに、
撮像装置から細胞が順次撮像された複数の細胞画像を取得し、
画像に含まれる細胞を計数する第1計数モデルに前記複数の細胞画像の各々を適用して出力された第1細胞数を取得し、前記第1計数モデルは、第2計数モデルの適合率よりも高い適合率を有し、前記第2計数モデルの再現率よりも低い再現率を有し、
画像に含まれる細胞を計数する前記第2計数モデルに前記第1細胞数を取得した画像と同じ前記複数の細胞画像の各々を適用して出力された第2細胞数を取得し、
前記第1計数モデルに前記細胞画像を入力することによって出力された第1細胞数と前記第2計数モデルに前記細胞画像を入力することによって出力された第2細胞数とに基づいて、前記第1細胞数と前記第2細胞数の少なくとも一方と、前記第1細胞数と前記第2細胞数の対応関係と、を可視化した画面を表示する
処理を実行させることを特徴とするプログラムを記録したコンピュータ可読媒体。
On the computer
Acquire a plurality of cell images in which cells are sequentially imaged from an imaging device,
The number of first cells output by applying each of the plurality of cell images to the first counting model for counting the cells included in the image is obtained, and the first counting model is based on the precision rate of the second counting model. Also has a high precision rate, and has a recall rate lower than the recall rate of the second counting model.
By applying each of the plurality of cell images that are the same as the image obtained by acquiring the first cell number to the second counting model that counts the cells included in the image, the output second cell number is acquired.
Based on the number of first cells output by inputting the cell image into the first counting model and the number of second cells output by inputting the cell image into the second counting model, the first A program is recorded, which comprises executing a process of displaying a screen that visualizes at least one of the number of 1 cell and the number of the second cell, and the correspondence between the number of the first cell and the number of the second cell. Computer-readable medium.
Priority Applications (3)
| Application Number | Priority Date | Filing Date | Title |
|---|---|---|---|
| PCT/JP2019/045735 WO2021100191A1 (en) | 2019-11-22 | 2019-11-22 | Cell number information display method, system, and program |
| JP2021558135A JPWO2021100191A1 (en) | 2019-11-22 | 2019-11-22 | |
| US17/581,364 US20220146404A1 (en) | 2019-11-22 | 2022-01-21 | Method for displaying cell count information, system, and computer-readable medium |
Applications Claiming Priority (1)
| Application Number | Priority Date | Filing Date | Title |
|---|---|---|---|
| PCT/JP2019/045735 WO2021100191A1 (en) | 2019-11-22 | 2019-11-22 | Cell number information display method, system, and program |
Related Child Applications (1)
| Application Number | Title | Priority Date | Filing Date |
|---|---|---|---|
| US17/581,364 Continuation US20220146404A1 (en) | 2019-11-22 | 2022-01-21 | Method for displaying cell count information, system, and computer-readable medium |
Publications (1)
| Publication Number | Publication Date |
|---|---|
| WO2021100191A1 true WO2021100191A1 (en) | 2021-05-27 |
Family
ID=75981564
Family Applications (1)
| Application Number | Title | Priority Date | Filing Date |
|---|---|---|---|
| PCT/JP2019/045735 WO2021100191A1 (en) | 2019-11-22 | 2019-11-22 | Cell number information display method, system, and program |
Country Status (3)
| Country | Link |
|---|---|
| US (1) | US20220146404A1 (en) |
| JP (1) | JPWO2021100191A1 (en) |
| WO (1) | WO2021100191A1 (en) |
Cited By (1)
| Publication number | Priority date | Publication date | Assignee | Title |
|---|---|---|---|---|
| WO2024062609A1 (en) * | 2022-09-22 | 2024-03-28 | 日本電信電話株式会社 | Abnormality detection device, method, and program |
Citations (3)
| Publication number | Priority date | Publication date | Assignee | Title |
|---|---|---|---|---|
| JP2006340686A (en) * | 2005-06-10 | 2006-12-21 | Olympus Corp | Cell analysis method, cell analysis program and cell analysis apparatus |
| JP2011243188A (en) * | 2010-04-23 | 2011-12-01 | Nagoya Univ | Image processing apparatus, cell classifying apparatus, incubator, image processing method, cell classifying method, image processing program, and cell classifying program |
| JP2015091220A (en) * | 2013-11-08 | 2015-05-14 | 東洋製罐グループホールディングス株式会社 | Cell counter, cell counting system, cell counting method, and cell counting program |
-
2019
- 2019-11-22 WO PCT/JP2019/045735 patent/WO2021100191A1/en active Application Filing
- 2019-11-22 JP JP2021558135A patent/JPWO2021100191A1/ja active Pending
-
2022
- 2022-01-21 US US17/581,364 patent/US20220146404A1/en active Pending
Patent Citations (3)
| Publication number | Priority date | Publication date | Assignee | Title |
|---|---|---|---|---|
| JP2006340686A (en) * | 2005-06-10 | 2006-12-21 | Olympus Corp | Cell analysis method, cell analysis program and cell analysis apparatus |
| JP2011243188A (en) * | 2010-04-23 | 2011-12-01 | Nagoya Univ | Image processing apparatus, cell classifying apparatus, incubator, image processing method, cell classifying method, image processing program, and cell classifying program |
| JP2015091220A (en) * | 2013-11-08 | 2015-05-14 | 東洋製罐グループホールディングス株式会社 | Cell counter, cell counting system, cell counting method, and cell counting program |
Cited By (1)
| Publication number | Priority date | Publication date | Assignee | Title |
|---|---|---|---|---|
| WO2024062609A1 (en) * | 2022-09-22 | 2024-03-28 | 日本電信電話株式会社 | Abnormality detection device, method, and program |
Also Published As
| Publication number | Publication date |
|---|---|
| JPWO2021100191A1 (en) | 2021-05-27 |
| US20220146404A1 (en) | 2022-05-12 |
Similar Documents
| Publication | Publication Date | Title |
|---|---|---|
| JP6845221B2 (en) | Methods and systems for automated microbial colony counting from samples streaked on plate medium | |
| EP2280358B1 (en) | A urine work area manager and a urine work area | |
| JP6777726B2 (en) | Colony contrast collection | |
| JP6801000B2 (en) | Cell image evaluation device and cell image evaluation control program | |
| JP5707399B2 (en) | Microorganism detection method, microorganism detection apparatus, and program | |
| JP5274731B1 (en) | Observation system, program, and control method for observation system | |
| KR20080003815A (en) | Skin state analyzing method, skin state analyzing device, and recording medium on which skin state analyzing program is recorded | |
| WO2010146802A1 (en) | State determination method for cell cluster, image processing program and imaging processing device using said method, and method for producing cell cluster | |
| KR20150018523A (en) | Visual feedback for inspection algorithms and filters | |
| JP6355082B2 (en) | Pathological diagnosis support apparatus and pathological diagnosis support method | |
| JP2013077127A (en) | Image classification device and image classification method | |
| JP2021177765A (en) | Colony detection system | |
| Rhoads et al. | A review of the current state of digital plate reading of cultures in clinical microbiology | |
| WO2021100191A1 (en) | Cell number information display method, system, and program | |
| JP7006832B2 (en) | Cell analyzer | |
| US20220101568A1 (en) | Image generation system, image generation method, and non-transitory computer-readable storage medium | |
| US20220020148A1 (en) | Plant monitoring server, a plant monitoring system and a plant monitoring terminal device | |
| WO2015045012A1 (en) | Colony inspection program, colony inspection device, and colony inspection method | |
| US20230021099A1 (en) | Method and assistance system for checking samples for defects | |
| TW202045898A (en) | Analysis apparatus, analysis method, and non-transitory computer readable storage medium | |
| WO2022070491A1 (en) | Image analyzing device | |
| JP4646847B2 (en) | Protein crystallization observation method and protein crystallization observation apparatus | |
| JPWO2021100191A5 (en) | ||
| US20240070537A1 (en) | Microscopy System and Method for Generating a Machine-Learned Model for Processing Microscope Data | |
| US20220164956A1 (en) | Method and system for cell isolation assistance and computer-readable medium |
Legal Events
| Date | Code | Title | Description |
|---|---|---|---|
| 121 | Ep: the epo has been informed by wipo that ep was designated in this application |
Ref document number: 19953135 Country of ref document: EP Kind code of ref document: A1 |
|
| ENP | Entry into the national phase |
Ref document number: 2021558135 Country of ref document: JP Kind code of ref document: A |
|
| NENP | Non-entry into the national phase |
Ref country code: DE |
|
| 122 | Ep: pct application non-entry in european phase |
Ref document number: 19953135 Country of ref document: EP Kind code of ref document: A1 |