WO2021085033A1 - 多能性幹細胞の選別方法、分化誘導結果の予測方法及び細胞製品の製造方法 - Google Patents
多能性幹細胞の選別方法、分化誘導結果の予測方法及び細胞製品の製造方法 Download PDFInfo
- Publication number
- WO2021085033A1 WO2021085033A1 PCT/JP2020/037590 JP2020037590W WO2021085033A1 WO 2021085033 A1 WO2021085033 A1 WO 2021085033A1 JP 2020037590 W JP2020037590 W JP 2020037590W WO 2021085033 A1 WO2021085033 A1 WO 2021085033A1
- Authority
- WO
- WIPO (PCT)
- Prior art keywords
- phase difference
- pluripotent stem
- stem cells
- density
- cells
- Prior art date
Links
- 210000001778 pluripotent stem cell Anatomy 0.000 title claims abstract description 85
- 210000004027 cell Anatomy 0.000 title claims description 123
- 238000000034 method Methods 0.000 title claims description 87
- 230000004069 differentiation Effects 0.000 title claims description 77
- 238000004519 manufacturing process Methods 0.000 title claims description 33
- 230000006698 induction Effects 0.000 title claims description 14
- 238000003384 imaging method Methods 0.000 claims abstract description 32
- 238000011419 induction treatment Methods 0.000 claims description 31
- 210000004413 cardiac myocyte Anatomy 0.000 claims description 28
- 230000001939 inductive effect Effects 0.000 claims description 24
- 238000011282 treatment Methods 0.000 claims description 17
- 230000008569 process Effects 0.000 claims description 16
- 238000012258 culturing Methods 0.000 claims description 6
- 238000010187 selection method Methods 0.000 claims 1
- 239000002609 medium Substances 0.000 description 19
- 238000003756 stirring Methods 0.000 description 19
- 230000003287 optical effect Effects 0.000 description 14
- 238000005516 engineering process Methods 0.000 description 10
- 238000005259 measurement Methods 0.000 description 7
- 239000013307 optical fiber Substances 0.000 description 7
- 102100026893 Troponin T, cardiac muscle Human genes 0.000 description 6
- 101710165323 Troponin T, cardiac muscle Proteins 0.000 description 6
- 238000009826 distribution Methods 0.000 description 6
- 230000002107 myocardial effect Effects 0.000 description 5
- 238000012545 processing Methods 0.000 description 5
- 108091003079 Bovine Serum Albumin Proteins 0.000 description 4
- 102100024785 Fibroblast growth factor 2 Human genes 0.000 description 4
- 108090000379 Fibroblast growth factor 2 Proteins 0.000 description 4
- 239000012091 fetal bovine serum Substances 0.000 description 4
- 238000001093 holography Methods 0.000 description 4
- 230000003068 static effect Effects 0.000 description 4
- 108010059616 Activins Proteins 0.000 description 3
- 239000006144 Dulbecco’s modified Eagle's medium Substances 0.000 description 3
- WSFSSNUMVMOOMR-UHFFFAOYSA-N Formaldehyde Chemical compound O=C WSFSSNUMVMOOMR-UHFFFAOYSA-N 0.000 description 3
- 102100026818 Inhibin beta E chain Human genes 0.000 description 3
- KLGQSVMIPOVQAX-UHFFFAOYSA-N XAV939 Chemical compound N=1C=2CCSCC=2C(O)=NC=1C1=CC=C(C(F)(F)F)C=C1 KLGQSVMIPOVQAX-UHFFFAOYSA-N 0.000 description 3
- 239000000488 activin Substances 0.000 description 3
- 238000010586 diagram Methods 0.000 description 3
- 239000003814 drug Substances 0.000 description 3
- 230000000694 effects Effects 0.000 description 3
- 238000011156 evaluation Methods 0.000 description 3
- 230000014509 gene expression Effects 0.000 description 3
- 239000008103 glucose Substances 0.000 description 3
- 230000001965 increasing effect Effects 0.000 description 3
- 230000003834 intracellular effect Effects 0.000 description 3
- 239000000463 material Substances 0.000 description 3
- 238000012216 screening Methods 0.000 description 3
- 238000001228 spectrum Methods 0.000 description 3
- 239000000758 substrate Substances 0.000 description 3
- 102100024505 Bone morphogenetic protein 4 Human genes 0.000 description 2
- CEAZRRDELHUEMR-URQXQFDESA-N Gentamicin Chemical compound O1[C@H](C(C)NC)CC[C@@H](N)[C@H]1O[C@H]1[C@H](O)[C@@H](O[C@@H]2[C@@H]([C@@H](NC)[C@@](C)(O)CO2)O)[C@H](N)C[C@@H]1N CEAZRRDELHUEMR-URQXQFDESA-N 0.000 description 2
- 229930182566 Gentamicin Natural products 0.000 description 2
- 101000762379 Homo sapiens Bone morphogenetic protein 4 Proteins 0.000 description 2
- 239000013543 active substance Substances 0.000 description 2
- 238000000149 argon plasma sintering Methods 0.000 description 2
- 238000004422 calculation algorithm Methods 0.000 description 2
- 238000004113 cell culture Methods 0.000 description 2
- 210000003855 cell nucleus Anatomy 0.000 description 2
- 230000008859 change Effects 0.000 description 2
- 238000009795 derivation Methods 0.000 description 2
- 210000003890 endocrine cell Anatomy 0.000 description 2
- 229960002518 gentamicin Drugs 0.000 description 2
- 239000001963 growth medium Substances 0.000 description 2
- 230000013632 homeostatic process Effects 0.000 description 2
- 230000006872 improvement Effects 0.000 description 2
- 210000004263 induced pluripotent stem cell Anatomy 0.000 description 2
- 239000003112 inhibitor Substances 0.000 description 2
- 230000000977 initiatory effect Effects 0.000 description 2
- 230000001172 regenerating effect Effects 0.000 description 2
- 230000008672 reprogramming Effects 0.000 description 2
- 238000005316 response function Methods 0.000 description 2
- 239000000126 substance Substances 0.000 description 2
- 238000012546 transfer Methods 0.000 description 2
- 210000001239 CD8-positive, alpha-beta cytotoxic T lymphocyte Anatomy 0.000 description 1
- 241000283707 Capra Species 0.000 description 1
- 230000007067 DNA methylation Effects 0.000 description 1
- KCXVZYZYPLLWCC-UHFFFAOYSA-N EDTA Chemical compound OC(=O)CN(CC(O)=O)CCN(CC(O)=O)CC(O)=O KCXVZYZYPLLWCC-UHFFFAOYSA-N 0.000 description 1
- 108090000790 Enzymes Proteins 0.000 description 1
- 102000004190 Enzymes Human genes 0.000 description 1
- 241001529936 Murinae Species 0.000 description 1
- 206010035226 Plasma cell myeloma Diseases 0.000 description 1
- 102000004987 Troponin T Human genes 0.000 description 1
- 108090001108 Troponin T Proteins 0.000 description 1
- 102000004142 Trypsin Human genes 0.000 description 1
- 108090000631 Trypsin Proteins 0.000 description 1
- 210000001789 adipocyte Anatomy 0.000 description 1
- 238000004458 analytical method Methods 0.000 description 1
- 210000003719 b-lymphocyte Anatomy 0.000 description 1
- 238000010009 beating Methods 0.000 description 1
- 210000000013 bile duct Anatomy 0.000 description 1
- 210000001772 blood platelet Anatomy 0.000 description 1
- 210000002449 bone cell Anatomy 0.000 description 1
- 238000004364 calculation method Methods 0.000 description 1
- 210000003321 cartilage cell Anatomy 0.000 description 1
- 230000004956 cell adhesive effect Effects 0.000 description 1
- 230000024245 cell differentiation Effects 0.000 description 1
- 239000006285 cell suspension Substances 0.000 description 1
- 239000003795 chemical substances by application Substances 0.000 description 1
- 238000010367 cloning Methods 0.000 description 1
- 230000001427 coherent effect Effects 0.000 description 1
- 230000000295 complement effect Effects 0.000 description 1
- 239000013078 crystal Substances 0.000 description 1
- 210000002249 digestive system Anatomy 0.000 description 1
- 229940079593 drug Drugs 0.000 description 1
- 238000007876 drug discovery Methods 0.000 description 1
- 210000003027 ear inner Anatomy 0.000 description 1
- 230000005684 electric field Effects 0.000 description 1
- 210000001671 embryonic stem cell Anatomy 0.000 description 1
- 210000005168 endometrial cell Anatomy 0.000 description 1
- 210000001339 epidermal cell Anatomy 0.000 description 1
- 210000003743 erythrocyte Anatomy 0.000 description 1
- 238000000605 extraction Methods 0.000 description 1
- 238000001914 filtration Methods 0.000 description 1
- 210000003714 granulocyte Anatomy 0.000 description 1
- 210000003780 hair follicle Anatomy 0.000 description 1
- 210000002443 helper t lymphocyte Anatomy 0.000 description 1
- 210000003958 hematopoietic stem cell Anatomy 0.000 description 1
- 210000003494 hepatocyte Anatomy 0.000 description 1
- 230000000968 intestinal effect Effects 0.000 description 1
- 238000005304 joining Methods 0.000 description 1
- 239000007788 liquid Substances 0.000 description 1
- 210000004072 lung Anatomy 0.000 description 1
- 210000002540 macrophage Anatomy 0.000 description 1
- 108010082117 matrigel Proteins 0.000 description 1
- 210000003716 mesoderm Anatomy 0.000 description 1
- 229910044991 metal oxide Inorganic materials 0.000 description 1
- 150000004706 metal oxides Chemical class 0.000 description 1
- 239000000203 mixture Substances 0.000 description 1
- 201000000050 myeloid neoplasm Diseases 0.000 description 1
- 210000000653 nervous system Anatomy 0.000 description 1
- 238000012634 optical imaging Methods 0.000 description 1
- 210000000963 osteoblast Anatomy 0.000 description 1
- 230000009996 pancreatic endocrine effect Effects 0.000 description 1
- 210000003819 peripheral blood mononuclear cell Anatomy 0.000 description 1
- 229920000642 polymer Polymers 0.000 description 1
- 230000002265 prevention Effects 0.000 description 1
- 230000002062 proliferating effect Effects 0.000 description 1
- 108090000623 proteins and genes Proteins 0.000 description 1
- 230000010349 pulsation Effects 0.000 description 1
- 239000001397 quillaja saponaria molina bark Substances 0.000 description 1
- 210000001525 retina Anatomy 0.000 description 1
- 229930182490 saponin Natural products 0.000 description 1
- 150000007949 saponins Chemical class 0.000 description 1
- 238000004062 sedimentation Methods 0.000 description 1
- 239000004065 semiconductor Substances 0.000 description 1
- 210000000697 sensory organ Anatomy 0.000 description 1
- 210000002363 skeletal muscle cell Anatomy 0.000 description 1
- 210000003491 skin Anatomy 0.000 description 1
- 210000000329 smooth muscle myocyte Anatomy 0.000 description 1
- 230000003595 spectral effect Effects 0.000 description 1
- 230000007480 spreading Effects 0.000 description 1
- 238000003892 spreading Methods 0.000 description 1
- 210000000130 stem cell Anatomy 0.000 description 1
- 238000004381 surface treatment Methods 0.000 description 1
- 210000002435 tendon Anatomy 0.000 description 1
- 210000001685 thyroid gland Anatomy 0.000 description 1
- 238000004613 tight binding model Methods 0.000 description 1
- 210000001519 tissue Anatomy 0.000 description 1
- 230000007704 transition Effects 0.000 description 1
- 238000009966 trimming Methods 0.000 description 1
- 239000012588 trypsin Substances 0.000 description 1
- 210000003556 vascular endothelial cell Anatomy 0.000 description 1
- 210000005166 vasculature Anatomy 0.000 description 1
- 238000005406 washing Methods 0.000 description 1
Images


Classifications
-
- G—PHYSICS
- G01—MEASURING; TESTING
- G01N—INVESTIGATING OR ANALYSING MATERIALS BY DETERMINING THEIR CHEMICAL OR PHYSICAL PROPERTIES
- G01N15/00—Investigating characteristics of particles; Investigating permeability, pore-volume, or surface-area of porous materials
- G01N15/10—Investigating individual particles
- G01N15/14—Electro-optical investigation, e.g. flow cytometers
- G01N15/1434—Electro-optical investigation, e.g. flow cytometers using an analyser being characterised by its optical arrangement
-
- C—CHEMISTRY; METALLURGY
- C12—BIOCHEMISTRY; BEER; SPIRITS; WINE; VINEGAR; MICROBIOLOGY; ENZYMOLOGY; MUTATION OR GENETIC ENGINEERING
- C12N—MICROORGANISMS OR ENZYMES; COMPOSITIONS THEREOF; PROPAGATING, PRESERVING, OR MAINTAINING MICROORGANISMS; MUTATION OR GENETIC ENGINEERING; CULTURE MEDIA
- C12N5/00—Undifferentiated human, animal or plant cells, e.g. cell lines; Tissues; Cultivation or maintenance thereof; Culture media therefor
- C12N5/06—Animal cells or tissues; Human cells or tissues
- C12N5/0602—Vertebrate cells
- C12N5/0603—Embryonic cells ; Embryoid bodies
- C12N5/0606—Pluripotent embryonic cells, e.g. embryonic stem cells [ES]
-
- C—CHEMISTRY; METALLURGY
- C12—BIOCHEMISTRY; BEER; SPIRITS; WINE; VINEGAR; MICROBIOLOGY; ENZYMOLOGY; MUTATION OR GENETIC ENGINEERING
- C12N—MICROORGANISMS OR ENZYMES; COMPOSITIONS THEREOF; PROPAGATING, PRESERVING, OR MAINTAINING MICROORGANISMS; MUTATION OR GENETIC ENGINEERING; CULTURE MEDIA
- C12N5/00—Undifferentiated human, animal or plant cells, e.g. cell lines; Tissues; Cultivation or maintenance thereof; Culture media therefor
- C12N5/06—Animal cells or tissues; Human cells or tissues
- C12N5/0602—Vertebrate cells
- C12N5/0696—Artificially induced pluripotent stem cells, e.g. iPS
-
- G—PHYSICS
- G01—MEASURING; TESTING
- G01N—INVESTIGATING OR ANALYSING MATERIALS BY DETERMINING THEIR CHEMICAL OR PHYSICAL PROPERTIES
- G01N15/00—Investigating characteristics of particles; Investigating permeability, pore-volume, or surface-area of porous materials
- G01N15/10—Investigating individual particles
- G01N15/14—Electro-optical investigation, e.g. flow cytometers
- G01N15/1429—Electro-optical investigation, e.g. flow cytometers using an analyser being characterised by its signal processing
-
- G01N15/1433—
-
- G—PHYSICS
- G01—MEASURING; TESTING
- G01N—INVESTIGATING OR ANALYSING MATERIALS BY DETERMINING THEIR CHEMICAL OR PHYSICAL PROPERTIES
- G01N15/00—Investigating characteristics of particles; Investigating permeability, pore-volume, or surface-area of porous materials
- G01N15/10—Investigating individual particles
- G01N15/14—Electro-optical investigation, e.g. flow cytometers
- G01N15/1456—Electro-optical investigation, e.g. flow cytometers without spatial resolution of the texture or inner structure of the particle, e.g. processing of pulse signals
- G01N15/1459—Electro-optical investigation, e.g. flow cytometers without spatial resolution of the texture or inner structure of the particle, e.g. processing of pulse signals the analysis being performed on a sample stream
-
- G—PHYSICS
- G06—COMPUTING; CALCULATING OR COUNTING
- G06V—IMAGE OR VIDEO RECOGNITION OR UNDERSTANDING
- G06V20/00—Scenes; Scene-specific elements
- G06V20/60—Type of objects
- G06V20/69—Microscopic objects, e.g. biological cells or cellular parts
- G06V20/695—Preprocessing, e.g. image segmentation
-
- C—CHEMISTRY; METALLURGY
- C12—BIOCHEMISTRY; BEER; SPIRITS; WINE; VINEGAR; MICROBIOLOGY; ENZYMOLOGY; MUTATION OR GENETIC ENGINEERING
- C12N—MICROORGANISMS OR ENZYMES; COMPOSITIONS THEREOF; PROPAGATING, PRESERVING, OR MAINTAINING MICROORGANISMS; MUTATION OR GENETIC ENGINEERING; CULTURE MEDIA
- C12N2501/00—Active agents used in cell culture processes, e.g. differentation
- C12N2501/10—Growth factors
- C12N2501/115—Basic fibroblast growth factor (bFGF, FGF-2)
-
- C—CHEMISTRY; METALLURGY
- C12—BIOCHEMISTRY; BEER; SPIRITS; WINE; VINEGAR; MICROBIOLOGY; ENZYMOLOGY; MUTATION OR GENETIC ENGINEERING
- C12N—MICROORGANISMS OR ENZYMES; COMPOSITIONS THEREOF; PROPAGATING, PRESERVING, OR MAINTAINING MICROORGANISMS; MUTATION OR GENETIC ENGINEERING; CULTURE MEDIA
- C12N2501/00—Active agents used in cell culture processes, e.g. differentation
- C12N2501/10—Growth factors
- C12N2501/155—Bone morphogenic proteins [BMP]; Osteogenins; Osteogenic factor; Bone inducing factor
-
- C—CHEMISTRY; METALLURGY
- C12—BIOCHEMISTRY; BEER; SPIRITS; WINE; VINEGAR; MICROBIOLOGY; ENZYMOLOGY; MUTATION OR GENETIC ENGINEERING
- C12N—MICROORGANISMS OR ENZYMES; COMPOSITIONS THEREOF; PROPAGATING, PRESERVING, OR MAINTAINING MICROORGANISMS; MUTATION OR GENETIC ENGINEERING; CULTURE MEDIA
- C12N2506/00—Differentiation of animal cells from one lineage to another; Differentiation of pluripotent cells
- C12N2506/02—Differentiation of animal cells from one lineage to another; Differentiation of pluripotent cells from embryonic cells
-
- C—CHEMISTRY; METALLURGY
- C12—BIOCHEMISTRY; BEER; SPIRITS; WINE; VINEGAR; MICROBIOLOGY; ENZYMOLOGY; MUTATION OR GENETIC ENGINEERING
- C12N—MICROORGANISMS OR ENZYMES; COMPOSITIONS THEREOF; PROPAGATING, PRESERVING, OR MAINTAINING MICROORGANISMS; MUTATION OR GENETIC ENGINEERING; CULTURE MEDIA
- C12N2506/00—Differentiation of animal cells from one lineage to another; Differentiation of pluripotent cells
- C12N2506/45—Differentiation of animal cells from one lineage to another; Differentiation of pluripotent cells from artificially induced pluripotent stem cells
-
- G01N15/149—
-
- G—PHYSICS
- G01—MEASURING; TESTING
- G01N—INVESTIGATING OR ANALYSING MATERIALS BY DETERMINING THEIR CHEMICAL OR PHYSICAL PROPERTIES
- G01N15/00—Investigating characteristics of particles; Investigating permeability, pore-volume, or surface-area of porous materials
- G01N15/10—Investigating individual particles
- G01N2015/1006—Investigating individual particles for cytology
-
- G—PHYSICS
- G01—MEASURING; TESTING
- G01N—INVESTIGATING OR ANALYSING MATERIALS BY DETERMINING THEIR CHEMICAL OR PHYSICAL PROPERTIES
- G01N15/00—Investigating characteristics of particles; Investigating permeability, pore-volume, or surface-area of porous materials
- G01N15/10—Investigating individual particles
- G01N15/14—Electro-optical investigation, e.g. flow cytometers
- G01N15/1434—Electro-optical investigation, e.g. flow cytometers using an analyser being characterised by its optical arrangement
- G01N2015/1452—Adjustment of focus; Alignment
-
- G—PHYSICS
- G01—MEASURING; TESTING
- G01N—INVESTIGATING OR ANALYSING MATERIALS BY DETERMINING THEIR CHEMICAL OR PHYSICAL PROPERTIES
- G01N15/00—Investigating characteristics of particles; Investigating permeability, pore-volume, or surface-area of porous materials
- G01N15/10—Investigating individual particles
- G01N15/14—Electro-optical investigation, e.g. flow cytometers
- G01N15/1434—Electro-optical investigation, e.g. flow cytometers using an analyser being characterised by its optical arrangement
- G01N2015/1454—Electro-optical investigation, e.g. flow cytometers using an analyser being characterised by its optical arrangement using phase shift or interference, e.g. for improving contrast
-
- G—PHYSICS
- G03—PHOTOGRAPHY; CINEMATOGRAPHY; ANALOGOUS TECHNIQUES USING WAVES OTHER THAN OPTICAL WAVES; ELECTROGRAPHY; HOLOGRAPHY
- G03H—HOLOGRAPHIC PROCESSES OR APPARATUS
- G03H1/00—Holographic processes or apparatus using light, infrared or ultraviolet waves for obtaining holograms or for obtaining an image from them; Details peculiar thereto
- G03H1/04—Processes or apparatus for producing holograms
- G03H1/08—Synthesising holograms, i.e. holograms synthesized from objects or objects from holograms
- G03H1/0866—Digital holographic imaging, i.e. synthesizing holobjects from holograms
- G03H2001/0875—Solving phase ambiguity, e.g. phase unwrapping
Definitions
- the disclosed technology relates to a method for selecting pluripotent stem cells, a method for predicting differentiation induction results, and a method for producing cells.
- the following techniques are known as techniques for determining the degree of differentiation, which indicates the degree of differentiation of pluripotent stem cells.
- cells are observed using a phase contrast microscope to obtain an optical path length N inside the cell nucleus region and an optical path length C outside the cell nucleus region, and the optical path length N and the optical path length are obtained. It is described that the degree of cell differentiation is determined based on the ratio C / N of C.
- Japanese Patent Application Laid-Open No. 2018-000008 describes a step of calculating the phase distribution of iPS cells from an image signal of a biological specimen imaged by a microscope that converts a phase distribution into an image intensity distribution, and a specific phase amount from the phase distribution. Using the step of extracting the region having the above phase amount and the region having the phase amount equal to or more than the specific phase amount, evaluation information as an index for evaluating the state of the iPS cell is created and the evaluation information is presented. The process to be performed and the evaluation support method including the process are described.
- the cell analysis method comprises carrying out a cell state determination step of determining whether the cell to be analyzed is in an undifferentiated state or an undifferentiated deviation state.
- pluripotent stem cells such as ES cells (embryonic stem cells) and iPS cells have the ability to differentiate into various types of cells, they can be applied to drug discovery and regenerative medicine.
- a cell product used in regenerative medicine is obtained by culturing iPS cells, proliferating them, and performing a differentiation-inducing treatment for differentiating them into target cells.
- pluripotent stem cells such as iPS cells, and the medium used for cell culture and the like.
- Drugs used for differentiation induction treatment are expensive. Therefore, if it is possible to select pluripotent stem cells that are expected to have high yields or predict the results of differentiation induction at a relatively early stage in the manufacturing process of cell products, pluripotent stem cells that cannot be expected to have high yields will be treated. For example, since measures such as suspending the treatment or changing the manufacturing conditions can be taken, it is possible to increase the productivity of the cell product and suppress the manufacturing cost.
- the disclosed technology was made in view of the above points, and is a method for selecting pluripotent stem cells, a method for predicting differentiation induction results, and a method for producing cell products, which can contribute to the improvement of cell product productivity.
- the purpose is to provide.
- a phase difference image of the aggregate is generated from a hologram obtained by imaging the aggregate of the pluripotent stem cell, and the phase difference of each of a plurality of pixels constituting the phase difference image. It includes deriving the phase difference amount density obtained by dividing the total phase difference amount, which is the integrated value of the amounts, by the volume of the aggregate, and selecting pluripotent stem cells based on the phase difference amount density.
- the selection of pluripotent stem cells means selecting clones containing aggregates having a retardation density within a predetermined range, and selecting production batches containing aggregates having a retardation density within a predetermined range. Select a plate containing aggregates with a retardation density within a predetermined range, select aggregates with a retardation density within a predetermined range, or select aggregates with a retardation density within a predetermined range. It may be to select pluripotent stem cells contained in.
- pluripotent stem cells selected as described above may be targeted for differentiation induction treatment for differentiating into specific cells.
- the ratio of the number of specific cells obtained by the differentiation-inducing treatment to the retardation density obtained for the aggregates before the differentiation-inducing treatment and the number of pluripotent stem cells at the time before the differentiation-inducing treatment may be set for the phase difference amount density based on the relationship with the obtained rate indicating.
- the method for predicting the differentiation induction result according to the disclosed technique is to generate a phase difference image of the aggregate from a hologram obtained by imaging the aggregate of pluripotent stem cells, and to generate a phase difference image of each of a plurality of pixels constituting the phase difference image.
- the total phase difference amount which is the integrated value of, is divided by the volume of the aggregate to derive the phase difference amount density, and based on the phase difference amount density, differentiation for differentiating pluripotent stem cells into specific cells.
- the predicted value may be a rate indicating the ratio of the number of specific cells obtained by the differentiation-inducing treatment to the number of pluripotent stem cells at the time point before the differentiation-inducing treatment.
- the predicted value may be derived using a function showing the relationship between the phase difference amount density and the gain rate.
- the method for producing a cell product according to the disclosed technique includes a culture step of culturing pluripotent stem cells, a sorting step of selecting pluripotent stem cells cultured in the culture step, and a pluripotent stem cell selected in the sorting step.
- it includes a differentiation-inducing step of performing a differentiation-inducing process for differentiating into a specific cell.
- a phase difference image of the aggregate is generated from a hologram obtained by imaging the aggregate of pluripotent stem cells, and the phase difference amount is a value obtained by integrating the phase difference amounts of each of a plurality of pixels constituting the phase difference image. It includes deriving the holographic density obtained by dividing the sum by the volume of the aggregate and selecting pluripotent stem cells based on the holographic density.
- the specific cell may be a cardiomyocyte.
- each method according to the disclosed technique it is preferable to derive the retardation density based on the retardation image generated from the hologram imaged for the agglomerates before the differentiation induction treatment.
- a method for selecting pluripotent stem cells, a method for predicting differentiation induction results, and a method for producing cell products, which can contribute to the improvement of cell product productivity, are provided.
- FIG. 1 is a process flow chart showing an example of a method for manufacturing a cell product according to an embodiment of the disclosed technology.
- the method for producing a cell product according to the present embodiment is to obtain specific cells that deviate from the undifferentiated state such as cardiomyocytes by inducing differentiation of pluripotent stem cells such as iPS cells.
- the method for producing a cell product according to the present embodiment includes an expansion culture step S1, a three-dimensional culture step S2, a selection step S3, and a differentiation induction step S4.
- expansion culture is performed to proliferate pluripotent stem cells.
- Expansion culture is performed, for example, by two-dimensional culture in which a plurality of pluripotent stem cells are cultured in a state of being adhered onto a substrate.
- the base material for example, a commercially available multi-well plate for cell culture can be used.
- medium exchange and subculture are performed a plurality of times until a desired number of pluripotent stem cells are obtained. It is also possible to carry out expansion culture by three-dimensional culture in which pluripotent stem cells are cultured in a state of being suspended in a medium.
- pluripotent stem cells are cultured so as to form spherical aggregates (hereinafter referred to as spheres).
- the pluripotent stem cells adhered to the substrate are detached from the substrate using an enzyme agent such as trypsin.
- the exfoliated pluripotent stem cells are, for example, stirred and cultured in a container containing a medium.
- Pluripotent stem cells proliferate in a container to form spherical spheres.
- a plate with a non-cell-adhesive surface treatment may be used, or a material for preventing sphere settling may be added to the medium.
- the sedimentation prevention material include heteropolysaccharide polymers such as Gellan Gum.
- pluripotent stem cells are sorted. That is, in this step, pluripotent stem cells to be targeted for the differentiation induction treatment performed in the differentiation induction step S4 are specified. Details of the method for selecting pluripotent stem cells will be described later.
- the differentiation induction treatment for differentiating the pluripotent stem cells targeted for the differentiation induction treatment in the selection step S3 into specific cells is performed.
- the differentiation induction treatment is performed at a timing when a predetermined period (for example, 2 days) has elapsed since the start of the 3D culture step S2.
- a predetermined period for example, 2 days
- a physiologically active substance that induces differentiation into mesoderm is administered into the medium.
- the physiologically active substance include bFGF, Activin, BMP4 and the like.
- a Wnt signal inhibitor that induces differentiation into cardiomyocytes is administered into the medium.
- Specific examples of the Wnt signal inhibitor include XAV939 and the like.
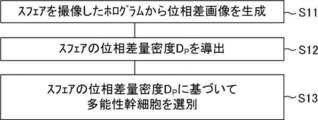
- FIG. 2 is a flow chart showing a flow of processing performed in the sorting step S3.
- step S11 a phase difference image of the sphere is generated from the hologram obtained by imaging the sphere formed in the three-dimensional culture step S2. Holography is performed, for example, on the sphere two days after the start of the three-dimensional culture step S2. Details of hologram photography and phase difference images will be described later.
- step S12 based on the phase difference image generated in step S11, to derive the amount of phase difference density D P of the sphere.
- Retardation amount density D P is calculated by dividing the amount of phase difference total sum P A is a value obtained by integrating the phase difference of each of the plurality of pixels constituting a phase difference image in a volume of spheres. It will be described later in detail retardation amount sum P A and the phase difference amount density D P.
- step S13 it performs a selection of pluripotent stem cells based on the phase difference amount density D P derived at step S12. Specifically, the phase difference amount density D P, who is within a predetermined range, pluripotent stem cells contained in the spheres is subjected to differentiation induction treatment. On the other hand, the phase difference amount density D P is not within the predetermined range, pluripotent stem cells contained in the spheres is excluded from the differentiation induction treatment.
- FIG. 3 is a diagram showing an example of the configuration of the imaging system 1 used for sorting pluripotent stem cells in the sorting step S3.
- the imaging system 1 includes a hologram optical system 10 for acquiring a hologram of a sphere using a known digital holography technique.
- Digital holography technology uses an image sensor to capture an image generated by the interference between the object light transmitted or reflected from the object and the reference light that is coherent to the object light, and the image obtained by the imaging is based on light propagation. It is a technology that restores the wave front of light waves from an object by performing numerical calculations. According to the digital holography technique, the phase distribution of an object can be quantified, and three-dimensional information of the object can be acquired without mechanically moving the focal position.
- the hologram optical system 10 includes a laser light source 11, beam splitters 12, 18, collimating lenses 13, 21, 22, 24, an objective lens 15, an imaging lens 17, and a CMOS (Complementary Metal Oxide Semiconductor) camera 19. There is.
- the sphere as the sample 14 set on the sample stage is arranged between the collimating lens 13 and the objective lens 15.
- the laser light source 11 for example, a HeNe laser having a wavelength of 632.8 nm can be used.
- the laser light emitted from the laser light source 11 is split into two laser lights by the beam splitter 12.
- One of the two laser beams is an object light and the other is a reference light.
- the object light is incident on the optical fiber 23 by the collimating lens 22, and is guided to the front of the collimating lens 13 by the optical fiber 23.
- the object light is collimated by the collimated lens 13 and then irradiated to the sphere, which is the sample 14 set on the sample stage.
- the diameter of the laser beam applied to the sphere is, for example, 2.2 mm.
- the image of the object light transmitted through the sphere is magnified by the objective lens 15.
- the object light transmitted through the objective lens 15 is converted into parallel light again by the imaging lens 17, and then imaged on the imaging surface of the CMOS camera 19 via the beam splitter 18.
- the reference light is incident on the optical fiber 20 by the collimating lens 24, and is guided to the front side of the collimating lens 21 by the optical fiber 20.
- the reference light emitted from the optical fiber 20 is converted into parallel light by the collimating lens 21 and incident on the imaging surface of the CMOS camera 19 via the beam splitter 18.
- the diameter of the laser beam emitted from the collimating lens 21 is, for example, 22 mm.
- the hologram generated by the interference between the object light and the reference light is recorded by the CMOS camera 19.
- CMOS camera 19 for example, a monochrome image sensor having a resolution of 2448 ⁇ 2048 and a sensor size of 3.45 ⁇ m ⁇ 3.45 ⁇ m can be used.
- the beam splitter 18 is tilted so that the optical axes of the object light and the reference light incident on the imaging surface of the CMOS camera 19 are different from each other, and the reference light is tilted by about 3 ° with respect to the object light. You may take a picture.
- the imaging system 1 it is possible to acquire a phase difference image of the sphere without destroying the sphere and without damaging the cells constituting the sphere.
- the configuration of the imaging system 1 described above is merely an example, and is not limited to the configuration described above.
- any imaging system capable of acquiring holograms using digital hologram technology can be used.
- FIG. 4A the hologram of the sphere illustrated in FIG. 4A acquired by the imaging system 1 is trimmed to a size of, for example, 2048 ⁇ 2048, and then two-dimensional Fourier transform is performed.
- FIG. 4B is an example of a Fourier transform image of the sphere obtained by this processing.
- FIG. 4B shows images based on direct light, object light, and conjugated light.
- the position of the object light is specified by specifying the amount of deviation of the object light with respect to the direct light in the Fourier transform image. Extract the amplitude component.
- the angular spectral method is applied to restore an image showing the phase of the sphere at an arbitrary spatial position.
- the wavefront u captured by the imaging surface of the CMOS camera 19 (x, y; 0) ; determining the angular spectrum U (0 f x, f y ) of the Fourier transform image.
- the wave surface at an arbitrary position z in the axial direction (z direction) is reproduced.
- the transfer function H (f x, f y; z) is the frequency response function (Fourier transform of the impulse response function (Green function)).
- wavefront U (f x, f y; z) at position z of the imaging system 1 in the optical axis direction (z direction) by performing an inverse Fourier transform on,
- the solution u (x, y; z) at position z is derived.
- FIG. 4C is an example of a phase difference image of the sphere obtained by each of the above processes before unwrapping.
- phase of the sphere before unwrapping shown in FIG. 4C is convoluted to a value of 0 to 2 ⁇ . Therefore, for example, by applying a phase connection (unwrapping) method such as Unweighted Least Squares (unweighted least squares method) or Flynn's Algorithm (Flynn's algorithm), and joining the parts of 2 ⁇ or more, as shown in FIG. 4D.
- a phase connection (unwrapping) method such as Unweighted Least Squares (unweighted least squares method) or Flynn's Algorithm (Flynn's algorithm)
- a final phase difference image of the sphere as illustrated can be obtained.
- Many unwrapping methods have been proposed, and an appropriate method that does not cause phase inconsistency may be appropriately selected.
- FIG. 5 is a diagram showing the concept of a phase difference image I P.
- phase difference image I retardation amount P in P is represented by the following equation (4).
- phase in the present specification is the phase of the electric field amplitude when light is regarded as an electromagnetic wave, and is used in a more general sense.
- the phase difference amount P k of each pixel k of the phase difference image I P can be represented by the following formula (5).
- n k is the index of refraction of the spheres at the site corresponding to each pixel k of the phase difference image I P
- d k is the thickness of the spheres at the site corresponding to each pixel k of the phase difference image I P
- ⁇ is the wavelength of the object light in the hologram optical system 10.
- the phase difference image of the sphere is an image showing the optical path length distribution of the object light transmitted through the sphere. Since the optical path length in the sphere corresponds to the product of the refractive index of the sphere and the thickness of the sphere, the phase difference image of the sphere shows the refractive index and thickness of the sphere as shown in Eq. (5). Contains information on the (shape).
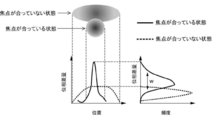
- focusing on the sphere means obtaining a phase difference image sliced near the center of the spherical sphere.
- the graph on the left of FIG. 6 is a graph showing an example of the relationship between the position in the plane direction and the amount of phase difference in the phase difference image of the sphere, and the solid line corresponds to the state where the sphere is in focus, and the dotted line corresponds to the sphere. Corresponds to the out-of-focus condition.
- the sphere is in focus, a steep peak appears at a specific position in the phase difference image.
- the peak is lower and gentler than when it is in focus.
- the graph on the right of FIG. 6 is an example of a histogram of the amount of phase difference in the phase difference image of the sphere, and the solid line corresponds to the state where the sphere is in focus and the dotted line corresponds to the state where the sphere is not in focus. To do. When the sphere is in focus, the curve width w (variation in the amount of phase difference) is relatively large, and when the sphere is out of focus, the width w of the curve (variation in the amount of phase difference) is. It becomes relatively small.
- the phase difference images of the spheres are acquired for each focal position (slice position) different from each other, and for each of the acquired phase difference images, the curve width w (variation of the phase difference amount) in the histogram of the amount of phase difference is obtained.
- Focusing can be realized by extracting a histogram image having the maximum width w out of the obtained width w as a histogram image focused on the sphere.
- FIG. 7 is a graph showing an example of the relationship between the focal position (slice position) and the variation in the amount of phase difference in the phase difference image of the sphere.
- FIG. 7 illustrates phase-difference images of spheres corresponding to focal positions of ⁇ 400 ⁇ m, ⁇ 200 ⁇ m, 0 ⁇ m, +200 ⁇ m, and +400 ⁇ m, along with graphs.
- the focal position where the variation in the amount of phase difference is maximum is set to 0 ⁇ m.
- the phase difference image corresponding to the focal position 0 ⁇ m at which the variation in the amount of phase difference is maximum is extracted as the focused phase difference image.
- the contour of the sphere is the clearest in the phase difference image corresponding to the focal position 0 ⁇ m where the variation in the amount of phase difference is maximum.
- Retardation amount sum P A described above is represented by the following equation (6).
- s is the area of each pixel k of the retardation image
- v k is the volume of the sphere at the portion corresponding to each pixel k of the retardation image.
- the phase difference amount sum P A the amount of phase difference P k for each pixel of the phase contrast image of the spheres corresponds to that obtained by integrating all the pixels k.
- the pixel value of the phase difference image corresponds to the phase difference amount P k.
- Retardation amount density D P is represented by the following equation (7).
- V is the volume of the sphere.
- the phase difference amount density D P corresponding to the phase difference amount sum P A in divided by the volume V of the spheres. Due to its homeostasis, living cells are considered to maintain a constant value of internal refractive index, which is different from the refractive index of the medium. On the other hand, it is considered that dead cells lose homeostasis and the internal refractive index becomes substantially the same as the refractive index of the medium. Accordingly, the phase difference amount density D P, it is possible to use as an index indicating the state of the cell.
- the 2 [pi / lambda it is possible to treat as a constant, upon derivation of the phase difference amount density D P, it may be omitted multiplication 2 [pi / lambda.
- D P (2 ⁇ / ⁇ ) ⁇ N ave
- the retardation density is a standardization of the difference in refractive index of the volume-averaged sphere by the length of the wavelength.
- the volume V of the sphere can be obtained by calculating the equivalent diameter of the sphere from the cross-sectional image of the phase image of the sphere. It is also possible to make it an ellipsoidal sphere more accurately.
- the volume average refractive index difference N ave can be treated as the phase difference amount density D P equivalent indicators.
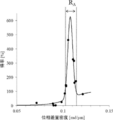
- Figure 8 is a graph showing the amount of phase difference density D P of iPS cell spheres, an example of the relationship between the yield ratio Y of myocardial cells obtained by the differentiation induction treatment for that iPS cells.
- the amount of phase difference density D P derived from the phase difference image generated from the acquired hologram for spheres of time before the differentiation induction treatment is carried out (after 2 days from the start of the three-dimensional culture process S2 in the present embodiment) It was done.
- the profit rate Y is expressed by the following equation (8).
- N i in equation (8) the number of pluripotent stem cells in production lots at the time prior to the differentiation induction treatment (first day started three-dimensional culture process S2 in the present embodiment)
- N c is It is the number of cardiomyocytes in the production lot obtained at the time point after the differentiation induction treatment (12 days after the start of the differentiation induction step S4 in the present embodiment). That is, yield ratio Y is the ratio of the number N c of the produced cardiomyocytes to the number N i to put pluripotent stem cells. Since the cells in the period from the measurement time of the N i to the measurement point of the N c are grown, yield ratio Y is sometimes exceeds 100%. Further, the number N c of cardiomyocytes can be obtained by measuring the number of cTnT-positive cells.
- pluripotent stem cells retardation amount density D P is included in the spheres is within the predetermined range R A is obtained ratio Y of cardiomyocytes obtained by subsequent differentiation induction treatment is significantly higher .. That is, FIG. 8, the pluripotent stem cells high yield ratio Y is obtained, show that it is possible screened by phase difference amount density D P of the sphere.
- Sorting method according to the embodiment of the disclosed technique, as exemplified in Figure 8, the amount of phase difference density D P obtained for spheres prior to the differentiation induction treatment, pluripotent stem cells contained in the sphere based on the relationship between yield ratio Y of myocardial cells obtained by the differentiation induction treatment for, the phase difference amount density D P, comprising determining the predetermined range R a for selection.
- the phase difference amount density D P when intending to obtain rate of cardiomyocytes to 100% or more, the phase difference amount density D P is 0.102 [rad / ⁇ m] or 0.114 [rad / ⁇ m] or less of Pluripotent stem cells contained in a range of spheres are targeted for differentiation induction treatment.
- the phase difference amount density D P since it varies with the wavelength of the object light ⁇ in the hologram optical system 10, it is preferable that the wavelength ⁇ is constant.
- the desired yield It is possible to identify pluripotent stem cells with a promising rate. Therefore, for pluripotent stem cells for which the desired yield cannot be expected, measures such as interrupting the treatment or changing the production conditions can be taken, so that the productivity of the cell product can be increased and the production cost can be suppressed. It will be possible.
- phase difference amount density D P it is preferred to derive the phase difference amount density D P based on the phase difference image generated from the image hologram for the previous spheres performing differentiation induction treatment.
- pluripotent stem cells can be selected before the differentiation-inducing treatment, so that the effect of increasing the productivity of cell products can be promoted.
- the measurement of the phase difference amount density D P is carried out within five days stirring culture after 2 hours later, more preferably be carried out within 3 days after 12 hours, to be performed within 2 days after 1 day Most preferred.
- phase difference amount density D P In the case of performing static culture instead of stirring culture in order to form spheres, to perform the measurement of the phase difference amount density D P within 5 days after 2 hours from the standing culture initiation for forming spheres Is preferable, and it is more preferable to carry out within 3 days after 12 hours, and most preferably within 2 days after 1 day. Even after differentiation induction treatment, if time to change due to differentiation of the phase difference amount density D P appears, the relationship between the amount of phase difference density D P and Tokuritsu Y is maintained, the it may derive the phase difference amount density D P based on the phase difference image generated from the image hologram for spheres of the period.
- Selection of pluripotent stem cells can be performed on a sphere basis or on a production lot basis.
- the production lot unit obtains the amount of phase difference density D P for some or all of the plurality of spheres in the production lots, the lot in the average value of the phase difference amount density D P If is within a predetermined range, all pluripotent stem cells contained in the production lot may be subject to the differentiation induction treatment.
- the relationship between the amount of phase difference density D P and Tokuritsu Y can be mathematically expressed using known function fitting techniques. For example, by using a linear combination model of the Gaussian function and sigmoid function, the phase difference amount density D P and a function representing the relationship between Tokuritsu Y below (9) shown in FIG. 8 expression can be derived is there.
- (9) shows that predictable from the phase difference amount density D P of spheres obtained in the intermediate stage in the manufacturing process of cell products, the yield ratio Y of myocardial cells obtained by the differentiation induction treatment.
- Prediction method of inducing differentiation results according to an exemplary embodiment of the disclosed technique is to use the relationship between the yield ratio Y of the phase difference amount density D P and cardiomyocytes, the phase difference of the spheres charge density D P Based on the above, it includes deriving a predicted value regarding the number of cardiomyocytes obtained by performing differentiation induction treatment on a plurality of pluripotent stem cells contained in the sphere.
- the amount of phase difference density D P of spheres by substituting the function representing the relationship between the the the phase difference amount density D P and Tokuritsu Y exemplified by equation (9), in the sphere
- the function representing the relationship between the amount of phase difference density D P and Tokuritsu Y is specified, based on the phase difference amount density D P of the sphere, the differentiation induction treatment performed on the spheres It is possible to derive a predicted value of the cardiomyocyte yield Y obtained in this case, that is, to predict the differentiation induction result.
- a function representing the relationship between the amount of phase difference density D P and Tokuritsu Y as the predicted value for the number of cardiomyocytes, it is also possible to derive the predicted value other than yield ratio.
- the differentiation-inducing result can be predicted at the stage before the differentiation-inducing treatment, so that the effect of increasing the productivity of the cell product can be promoted.
- the measurement of the phase difference amount density D P is carried out within five days stirring culture after 2 hours later, more preferably be carried out within 3 days after 12 hours, to be performed within 2 days after 1 day Most preferred.
- phase difference amount density D P In the case of performing static culture instead of stirring culture in order to form spheres, to perform the measurement of the phase difference amount density D P within 5 days after 2 hours from the standing culture initiation for forming spheres Is preferable, and it is more preferable to carry out within 3 days after 12 hours, and most preferably within 2 days after 1 day. Even after differentiation induction treatment, if time to change due to differentiation of the phase difference amount density D P appears, the relationship between the amount of phase difference density D P and Tokuritsu Y is maintained, the it may derive the phase difference amount density D P based on the phase difference image generated from the image hologram for spheres of the period.
- Examples of cells other than myocardial cells include endometrial cells, such as digestive system cells (hepatic cells, bile duct cells, pancreatic endocrine cells, aden cells, duct cells, resorbing cells, cup cells, panate cells, intestinal endocrine cells). Etc.), cells of tissues such as lung and thyroid, and examples of mesenchymal cells include hematopoietic stem cells, erythrocytes, platelets, macrophages, granulocytes, helper T cells, and killer T cells.
- endometrial cells such as digestive system cells (hepatic cells, bile duct cells, pancreatic endocrine cells, aden cells, duct cells, resorbing cells, cup cells, panate cells, intestinal endocrine cells).
- Etc. examples of tissues such as lung and thyroid
- mesenchymal cells include hematopoietic stem cells, erythrocytes, platelets, macrophages, granulocytes, help
- vasculature cells vascular endothelial cells, etc.
- osteoblasts bone cells, cartilage cells, tendon cells, fat cells, skeletal muscle cells, smooth muscle cells, etc.
- nervous system cells sensory organ cells (crystal body, retina, inner ear, etc.), skin epidermal cells, hair follicles and the like.
- IPS cell clones A to O were prepared from peripheral blood mononuclear cells containing different donor sources according to the method described in Japanese Patent No. 5894217.
- mTeSR1 Stem Cell Technologies
- Matrigel Matrigel
- the cells were collected and subcultured by treating with 0.5 mM EDTA solution (Invitrogen) for 7 minutes, and when the confluency reached about 80% in the T225 flask, the cells were separated by TrypLE Select (Thermo Fisher).
- Single cells were exfoliated and collected, and 3.0 in mTeSR1 containing 1 ⁇ M H1152 (Fujifilm Wako Pure Chemical Industries, Ltd.), 25 ⁇ g / ml Gentamicin (Thermo Fisher), and 100 ng / ml bFGF (Fujifilm Wako Pure Chemical Industries, Ltd.).
- the cells were adjusted to x10 6 cells / ml.
- 15 ml of the cell suspension was added to a 30 ml single-use bioreactor (Able), and the cells were stirred and cultured at a rotation speed of 40 rpm. After 2 to 4 hours from the start of the stirring culture, the mixture was scalpel-up in the same medium so that the final liquid volume was 30 ml, and the stirring culture was continued as it was.
- the final concentration was 1 ⁇ M H1152, 25 ⁇ g / ml Gentamicin, 100 ng / ml bFGF, 24 ng / ml Activin, 5% fetal bovine serum (GE Healthcare), ⁇ 0.5 mTeSR1, and ⁇ 0.5 DMEM Low-glucose ( The medium was replaced with a medium consisting of Thermo Fisher), and stirring culture was continued.
- the configuration of the imaging system 1 used is as follows.
- the laser light source 11 a HeNe laser having a wavelength of 632.8 nm and an output of 5 mW was used.
- the diameter of the laser beam emitted to the sphere was set to 2.2 mm.
- As the imaging lens 17, a lens having f 200 mm and an aperture diameter of 36 mm was used, and an image was formed on the imaging surface of a CMOS camera at an image magnification of 10 times.
- the CMOS camera 19 used a monochrome image sensor having a resolution of 2448 ⁇ 2048 and a sensor size of 3.45 ⁇ m ⁇ 3.45 ⁇ m.
- the beam splitter 18 is tilted so that the optical axes of the object light and the reference light incident on the imaging surface of the CMOS camera 19 are different from each other, and the reference light is tilted by about 3 ° with respect to the object light. I took a picture.
- phase difference amount density D P was derived phase difference amount density D P using the phase difference images (6) and (7).
- a part of the culture medium was sampled to measure the number of cells, and a medium consisting of final concentrations of 25 ⁇ g / ml Gentamaicin, 100 ng / ml bFGF, 24 ng / ml Activin, 40 ng / ml BMP4, 10% fetal bovine serum, and DMEM low-glucose.
- the content was adjusted to 1.0 ⁇ 10 6 cells / ml, and differentiation culture was started.
- the stirring culture was continued during the differentiation culture. From 3 to 7 days after the start of stirring culture, the medium was changed daily with the same medium, and stirring culture was continued.
- the ratio of the total number of cardiomyocytes to the number of cells at the start of stirring culture was derived as a rate Y.
- the phase difference amount density D P and Tokuritsu Y was obtained for each clone to plot on a graph, creating a graph showing the relationship between the amount of phase difference density D P and Tokuritsu Y shown in FIG. 8 did.
- FIG. 9 shows the relationship between the predicted value (vertical axis) and the measured value (horizontal axis) of the cardiomyocyte yield calculated by using equation (9) for each of the 15 clones.
- the predicted value and the measured value of the profit rate shown by each plot of FIG. 9 are the average values within the lot.
- the dotted line in FIG. 9 is an ideal line when the predicted value and the measured value match, and the solid line in FIG. 9 is an approximate straight line derived based on each plot.
- the coefficient of determination R 2 in this approximate straight line is 0.9426, and the correlation coefficient R is 0.9709. That is, it can be said that the accuracy of the predicted value of the profit rate derived by using the function represented by the equation (9) is extremely high.
Abstract
多能性幹細胞の凝集体を撮像したホログラムから凝集体の位相差画像を生成し、位相差画像を構成する複数の画素の各々の位相差量を積算した値である位相差量総和を凝集体の体積で除算した位相差量密度を導出し、位相差量密度に基づいて、多能性幹細胞の選別を行う。
Description
開示の技術は、多能性幹細胞の選別方法、分化誘導結果の予測方法及び細胞の製造方法に関する。
多能性幹細胞の分化の度合いを示す分化度を判定する技術として、以下の技術が知られている。例えば、特開2015-146747号公報には、位相差顕微鏡を用いて細胞を観察して細胞核領域の内側の光路長N及び細胞核領域の外側の光路長Cを取得し、光路長Nと光路長Cの比C/Nに基づいて、細胞の分化度を判定することが記載されている。
また、iPS細胞(induced pluripotent stem cells)の良否判断を行う技術として以下の技術が知られている。例えば、特開2018-000048号公報には、位相分布を像強度分布に変換する顕微鏡によって撮像された生体標本の画像信号からiPS細胞の位相分布を算出する工程と、位相分布から特定の位相量以上の位相量を有する領域を抽出する工程と、特定の位相量以上の位相量を有する領域を用いて、iPS細胞の状態を評価するための指標となる評価情報を作成し、評価情報を提示する工程と、を含む評価支援方法が記載されている。
また、培養中の多能性幹細胞が未分化状態を維持しているのか未分化逸脱状態であるのかを判定する技術が知られている。例えば、国際公開第2018/158901には、ホログラフィック顕微鏡によるホログラムから求まる解析対象の細胞についての位相像において細胞が存在する細胞領域を抽出する細胞領域抽出ステップと、位相像において細胞領域以外の領域中の複数の位置における位相値に基づいてバックグラウンド値を算出するバックグラウンド値取得ステップと、細胞領域における細胞の輪郭線とその輪郭線から内側に所定距離離れた仮想的な線との間の測定対象範囲内の複数の位置における位相値に基づいて細胞内の位相値を求める細胞内位相値取得ステップと、細胞内位相値取得ステップにおいて得られた位相値とバックグラウンド値との差に基づいて、解析対象の細胞が未分化状態であるか又は未分化逸脱状態であるかを判定する細胞状態判定ステップと、を実施することを特徴とする細胞解析方法が記載されている。
ES細胞(embryonic stem cells)及びiPS細胞等の多能性幹細胞は、様々な種類の細胞に分化する能力を有することから、創薬及び再生医療などに適用することが可能である。例えば、再生医療に用いられる細胞製品は、iPS細胞を培養して増殖させ、目的とする細胞に分化させるための分化誘導処理を行うことで取得される。
iPS細胞を樹立する過程では初期化遺伝子を導入された細胞群を単一細胞に分離し、各々を個別に培養してクローン化する工程が通常存在する。これらのクローンは初期化に伴う遺伝子発現プロファイルの変化、DNAメチル化パターンの変化、の程度がそれぞれ異なるため、その後同一のプロトコルで心筋細胞等の特定の細胞へ分化誘導しても得率や生産効率が大きく異なる場合がある。現状では、これらクローン間に存在する差を均一化することは困難であり、生産に最適なクローンを選択して培養するのが通例である。また、同一クローンを使用して生産したとしても培養者の手技やプロトコルのロバストなどの影響により、各製造毎・バッチ毎に得率や生産性が異なる場合も多く、その要因を解析して対策することは容易ではない。
iPS細胞等の多能性幹細胞に分化誘導処理を行って心筋細胞等の特定の細胞を得る細胞製品の製造期間は、数週間~1か月程度を要し、また、細胞培養に用いる培地や分化誘導処理に用いる薬剤は高価である。従って、細胞製品の製造プロセスにおける比較的早い段階で、高い得率が見込まれる多能性幹細胞の選別または分化誘導結果の予測が可能となれば、高い得率を見込めない多能性幹細胞については、例えば処理を中断するまたは製造条件を変更する等の措置がとれるので、細胞製品の生産性を高めるとともに、製造コストを抑制することが可能となる。
開示の技術は、上記した点に鑑みてなされたものであり、細胞製品の生産性の向上に寄与することができる多能性幹細胞の選別方法、分化誘導結果の予測方法及び細胞製品の製造方法を提供することを目的とする。
開示の技術に係る多能性幹細胞の選別方法は、多能性幹細胞の凝集体を撮像したホログラムから凝集体の位相差画像を生成し、位相差画像を構成する複数の画素の各々の位相差量を積算した値である位相差量総和を凝集体の体積で除算した位相差量密度を導出し、位相差量密度に基づいて、多能性幹細胞の選別を行うことを含む。
多能性幹細胞の選別とは、位相差量密度が所定範囲内にある凝集体を含むクローンを選別すること、位相差量密度が所定範囲内にある凝集体を含む製造バッチを選別すること、位相差量密度が所定範囲内にある凝集体を含むプレートを選別すること、位相差量密度が所定範囲内にある凝集体を選別すること、もしくは位相差量密度が所定範囲内にある凝集体に含まれる多能性幹細胞を選別することであってもよい。
また、上記のように選別した多能性幹細胞を、特定の細胞に分化させるための分化誘導処理の対象としてもよい。
分化誘導処理を行う前の凝集体について取得された位相差量密度と、分化誘導処理を行う前の時点の多能性幹細胞の数に対する、分化誘導処理により得られた特定の細胞の数の割合を示す得率と、の関係性に基づいて、位相差量密度について上記の所定範囲を定めてもよい。
開示の技術に係る分化誘導結果の予測方法は、多能性幹細胞の凝集体を撮像したホログラムから凝集体の位相差画像を生成し、位相差画像を構成する複数の画素の各々の位相差量を積算した値である位相差量総和を凝集体の体積で除算した位相差量密度を導出し、位相差量密度に基づいて、多能性幹細胞に対して特定の細胞に分化させるための分化誘導処理を行うことにより得られる特定の細胞の数に関する予測値を導出することを含む。
例えば、予測値は、分化誘導処理を行う前の時点における多能性幹細胞の数に対する、分化誘導処理によって得られる特定の細胞の数の割合を示す得率であってもよい。
位相差量密度と得率との関係性を示す関数を用いて予測値を導出してもよい。
開示の技術に係る細胞製品の製造方法は、多能性幹細胞を培養する培養工程と、培養工程において培養された多能性幹細胞を選別する選別工程と、選別工程において選別された多能性幹細胞に対して、特定の細胞に分化させるための分化誘導処理を行う分化誘導工程と、を含む。選別工程は、多能性幹細胞の凝集体を撮像したホログラムから凝集体の位相差画像を生成し、位相差画像を構成する複数の画素の各々の位相差量を積算した値である位相差量総和を凝集体の体積で除算した位相差量密度を導出し、位相差量密度に基づいて、多能性幹細胞の選別を行うことを含む。
開示の技術に係る各方法において、特定の細胞が、心筋細胞であってもよい。
開示の技術に係る各方法においては、分化誘導処理を行う前の凝集体について撮像されたホログラムから生成された位相差画像に基づいて位相差量密度を導出することが好ましい。
開示の技術によれば、細胞製品の生産性の向上に寄与することができる多能性幹細胞の選別方法、分化誘導結果の予測方法及び細胞製品の製造方法が提供される。
以下、開示の技術の実施形態について図面を参照しつつ説明する。尚、各図面において、実質的に同一又は等価な構成要素又は部分には同一の参照符号を付している。
図1は、開示の技術の実施形態に係る細胞製品の製造方法の一例を示す工程フロー図である。本実施形態に係る細胞製品の製造方法は、iPS細胞等の多能性幹細胞の分化誘導により心筋細胞等の未分化状態を逸脱した特定の細胞を得るものである。本実施形態に係る細胞製品の製造方法は、拡大培養工程S1、三次元培養工程S2、選別工程S3及び分化誘導工程S4を含んでいる。
拡大培養工程S1において、多能性幹細胞を増殖させる拡大培養が行われる。拡大培養は、例えば、複数の多能性幹細胞を基材上に接着させた状態で培養する二次元培養により行われる。基材として、例えば、市販の細胞培養用マルチウェルプレートを用いることが可能である。拡大培養工程S1においては、所望の数の多能性幹細胞が得られるまで、複数回に亘り培地交換及び継代処理が行われる。なお、多能性幹細胞を培地中に浮遊させた状態で培養を行う三次元培養によって拡大培養を行うことも可能である。
三次元培養工程S2において、多能性幹細胞は、球形状の凝集体(以下、スフェアという)を形成するように培養される。二次元培養から三次元培養に移行する際、基材上に接着した多能性幹細胞は、トリプシン等の酵素剤を用いて基材から剥離される。剥離された多能性幹細胞は、例えば、培地を収容した容器内で攪拌培養される。多能性幹細胞は、容器内で増殖しながら球形状のスフェアを形成する。なお、本工程においては、多能性幹細胞を培地中で静止させた状態で培養する静置培養を適用することも可能である。静置培養をする場合、細胞非接着性の表面処理を施したプレートを使用してもよいし、スフェアの沈降を防止する材料を培地中に添加してもよい。沈降防止材料としては、ヘテロ多糖類ポリマー、例えばGellan Gumが挙げられる。
選別工程S3において、多能性幹細胞の選別が行われる。すなわち、本工程において分化誘導工程S4において行われる分化誘導処理の対象とされる多能性幹細胞が特定される。多能性幹細胞の選別方法の詳細については後述する。
分化誘導工程S4において、選別工程S3において分化誘導処理の対象とされた多能性幹細胞について、特定の細胞に分化させるための分化誘導処理が行われる。分化誘導処理は、三次元培養工程S2を開始してから所定期間(例えば2日間)が経過したタイミングで行われる。例えば、多能性幹細胞から心筋細胞を得る場合、中胚葉への分化を誘導する生理活性物質が培地中に投与される。生理活性物質として、具体的には、bFGF,Activin,BMP4などが挙げられる。その後、心筋細胞への分化を誘導するWntシグナル阻害剤が培地中に投与される。Wntシグナル阻害剤としては、具体的には、XAV939などが挙げられる。
図2は、選別工程S3において実施される処理の流れを示すフロー図である。ステップS11において、三次元培養工程S2において形成されたスフェアを撮像したホログラムからスフェアの位相差画像を生成する。ホログラム撮影は、例えば、三次元培養工程S2を開始してから2日後のスフェアについて実施される。ホログラム撮影及び位相差画像の詳細については後述する。
ステップS12において、ステップS11において生成された位相差画像に基づいて、スフェアの位相差量密度DPを導出する。位相差量密度DPは、位相差画像を構成する複数の画素の各々の位相差量を積算した値である位相差量総和PAをスフェアの体積で除算することにより求められる。位相差量総和PA及び位相差量密度DPの詳細については後述する。
ステップS13において、ステップS12において導出された位相差量密度DPに基づいて多能性幹細胞の選別を行う。具体的には、位相差量密度DPが、所定範囲内にある場合、当該スフェアに含まれる多能性幹細胞は、分化誘導処理の対象とされる。一方、位相差量密度DPが、上記所定範囲内にない場合、当該スフェアに含まれる多能性幹細胞は、分化誘導処理の対象から除外される。
図3は、選別工程S3における多能性幹細胞の選別に用いられる撮像システム1の構成の一例を示す図である。撮像システム1は、公知のデジタルホログラフィ技術を用いてスフェアのホログラムを取得するためのホログラム光学系10を含んで構成されている。
デジタルホログラフィ技術は、物体を透過または反射した物体光と、物体光に対してコヒーレントである参照光との干渉によって生じる像をイメージセンサで撮像し、撮像によって得られた画像について、光伝搬に基づく数値計算を実施することで、物体からの光波の波面を復元する技術である。デジタルホログラフィ技術によれば、物体の位相分布を定量化し、また、焦点位置を機械的に移動させることなく、物体の三次元情報を取得することができる。
ホログラム光学系10は、レーザ光源11、ビームスプリッタ12、18、コリメートレンズ13、21、22、24、対物レンズ15、結像レンズ17及びCMOS(Complementary Metal Oxide Semiconductor)カメラ19を含んで構成されている。サンプルステージにセットされる試料14としてのスフェアは、コリメートレンズ13と対物レンズ15との間に配置される。
レーザ光源11には、例えば波長632.8nmのHeNeレーザを用いることが可能である。レーザ光源11から出射されたレーザ光は、ビームスプリッタ12により、2つのレーザ光に分割される。2つのレーザ光の一方は物体光とされ、他方は参照光とされる。物体光は、コリメートレンズ22によって光ファイバ23に入射し、光ファイバ23によりコリメートレンズ13の手前まで導かれる。物体光は、コリメートレンズ13によって平行光とされた後、サンプルステージにセットされた試料14であるスフェアに照射される。光ファイバ23は、例えばNA=0.11のものを使用することができる。コリメートレンズ13は、例えば、f=10mm(NA=0.4)のものを使用することができる。スフェアに照射されるレーザ光の径は例えば2.2mmである。スフェアを透過した物体光による像は、対物レンズ15によって拡大される。対物レンズ15を透過した物体光は、結像レンズ17によって再び平行光とされた後、ビームスプリッタ18を介してCMOSカメラ19の撮像面に結像される。対物レンズ15は、例えばNA=0.45、f=20mmのものを使用することができる。結像レンズ17は、例えばf=200mm、開口径36mmのものを使用することができ、像倍率10倍でCMOSカメラの撮像面に結像される。一方、参照光は、コリメートレンズ24によって光ファイバ20に入射し、光ファイバ20によってコリメートレンズ21の手前まで導かれる。光ファイバ20から出射した参照光は、コリメートレンズ21によって平行光とされ、ビームスプリッタ18を介してCMOSカメラ19の撮像面に入射する。コリメートレンズ21は、例えばf=100mm(NA=0.25)のものを使用することができる。コリメートレンズ21から出射されるレーザ光の径は例えば22mmである。物体光と参照光との干渉によって生じるホログラムが、CMOSカメラ19によって記録される。CMOSカメラ19は、例えば、解像度2448×2048、センサーサイズ3.45μm×3.45μmのモノクロのイメージセンサを使用することができる。CMOSカメラ19の撮像面に入射する物体光と参照光の光軸方向が互いに異なったオフアキシャル光学系になるように、ビームスプリッタ18を傾けて、参照光を物体光に対し、約3°傾けて撮影を行ってもよい。
本実施形態に係る撮像システム1によれば、スフェアを破壊することなく、またスフェアを構成する細胞にダメージを与えることなくスフェアの位相差画像を取得することができる。なお、上記した撮像システム1の構成は、一例に過ぎず、上記の構成に限定されるものではない。本実施形態に係る選別方法の実施には、デジタルホログラム技術を用いてホログラムを取得することができる、あらゆる撮像システムを利用することが可能である。
以下に、撮像システム1を用いて取得したスフェアのホログラムから、スフェアの位相差画像を取得する方法の一例について説明する。
はじめに、撮像システム1によって取得された図4Aに例示するスフェアのホログラムを、例えば、2048×2048のサイズとなるようにトリミングを行った後、二次元フーリエ変換する。図4Bは、この処理によって得られるスフェアのフーリエ変換画像の一例である。図4Bには、直接光、物体光、共役光に基づく像が示されている。
次に、フーリエ変換画像における直接光に対する物体光のずれ量を特定することで物体光の位置を特定し、例えば、半径250pixelの円形開口のマスクを用いた周波数フィルタリング処理により、物体光のみの複素振幅成分を抜き出す。
次に、例えば、角スペクトル法を適用して任意の空間位置のスフェアの位相を示す画像を復元する。具体的には、CMOSカメラ19の撮像面で捉えた波面u(x,y;0)のフーリエ変換画像の角スペクトルU(fx,fy;0)を求める。次に、下記の(1)式に示すように、角スペクトルU(fx,fy;0)に伝達関数H(fx,fy;z)を乗算することで、撮像システム1の光軸方向(z方向)の任意の位置zにおける波面を再生する。ここで、伝達関数H(fx,fy;z)は、周波数応答関数(インパルス応答関数(グリーン関数)のフーリエ変換)である。

次に、下記の(2)式に示すように、撮像システム1の光軸方向(z方向)の位置zにおける波面U(fx,fy;z)について逆フーリエ変換を実施することで、位置zにおける解u(x,y;z)を導出する。

次に、下記の(3)式に示すように、u(x,y;z)についての位相φを導出することで位相差画像を生成する。図4Cは、上記の各処理によって得られるスフェアのアンラッピング前の位相差画像の一例である。

図4Cに示すアンラッピング前のスフェアの位相は、0~2πの値に畳みこまれている。そこで、例えば、Unweighted Least Squares(重みなし最小2乗法)またはFlynn's Algorithm(フリンのアルゴリズム)などの位相接続(アンラッピング)手法を適用して2π以上の部分も接合していくことで、図4Dに例示するようなスフェアの最終的な位相差画像を得ることができる。なお、アンラッピングの手法は数多く提案されており、位相不整合を生じない適切なものを適宜選択すればよい。
上記の各処理を実施することにより、撮像システム1の光軸方向(z方向)の互いに異なる位置zの各々における位相差画像を生成することができる。
以下において、位相差画像について説明する。図5は、位相差画像IPの概念を示す図である。図5の下段は、位相差画像IPの各画素kにおける位相差量を三次元表示したものである。図5の上段は、位相差画像IPの各画素kにおける位相差量を平面上にグレースケールで示したものである。
ここで、位相差画像IPの同一焦点面内に存在するバックグラウンド(スフェアの存在しない領域)の位相をPBとし、スフェアの存在する領域の位相をPSとしたとき、位相差画像IPにおける位相差量Pは、下記の(4)式によって表わされる。また、本明細書中における「位相」という用語は、光を電磁波とみなした場合の電場振幅の位相であり、より一般的な意味で使用される。

また、位相差画像IPの各画素kにおける位相差量Pkは、下記(5)式によって表わすことができる。但し、nkは位相差画像IPの各画素kに対応する部位におけるスフェアの屈折率であり、dkは位相差画像IPの各画素kに対応する部位におけるスフェアの厚さであり、λはホログラム光学系10における物体光の波長である。

スフェアの位相差画像は、スフェアを透過した物体光の光路長分布を示した画像である。スフェア内における光路長は、スフェアの屈折率とスフェアの厚さの積に相当することから、スフェアの位相差画像は、(5)式にも示されているように、スフェアの屈折率及び厚さ(形状)の情報を含んでいる。
スフェアに対して焦点が合っていない位相差画像からは、回折による広がりの影響によりスフェアの実態に合致した正確な情報が得られない。従って、CMOSカメラ19によって取得したホログラムから位相差画像を取得する際に、スフェアに焦点を合わせることが好ましい。ここで、「スフェアに焦点を合わせる」とは、球形状のスフェアの中央付近でスライスした位相差画像を得ることを意味する。スフェアに焦点が合った位相差画像を用いてスフェアの状態を判定することで、より正確な判定結果を得ることができる。
図6の左のグラフは、スフェアの位相差画像における平面方向の位置と位相差量との関係の一例を示すグラフであり、実線がスフェアに焦点が合っている状態に対応し、点線がスフェアに焦点が合っていない状態に対応する。スフェアに焦点が合っている場合、位相差画像における特定の位置に急峻なピークが現れる。一方、スフェアに焦点が合っていない場合、焦点が合っている場合と比較してピークが低く且つなだらかになる。
図6の右のグラフは、スフェアの位相差画像における位相差量のヒストグラムの一例であり、実線がスフェアに焦点が合っている状態に対応し、点線がスフェアに焦点が合っていない状態に対応する。スフェアに焦点が合っている場合、カーブの幅w(位相差量のばらつき)は、相対的に大きくなり、スフェアに焦点が合っていない場合、カーブの幅w(位相差量のばらつき)は、相対的に小さくなる。
従って、互いに異なる焦点位置(スライス位置)毎にスフェアの位相差画像を取得し、取得した位相差画像の各々について、位相差量のヒストグラムにおけるカーブの幅w(位相差量のばらつき)を求め、求めた幅wのうち、最大の幅wを有する位相差画像を、スフェアに焦点が合った位相差画像として抽出することで焦点合わせを実現できる。
図7は、スフェアの位相差画像における焦点位置(スライス位置)と位相差量のばらつきとの関係の一例を示したグラフである。図7には、焦点位置が、-400μm、-200μm、0μm、+200μm、及び+400μmに対応するスフェアの位相差画像が、グラフとともに例示されている。なお、図7では、位相差量のばらつきが最大となる焦点位置を0μmとしている。上記のオートフォーカス処理によれば、位相差量のばらつきが最大となる焦点位置0μmに対応する位相差画像が、焦点が合った位相差画像として抽出される。位相差量のばらつきが最大となる焦点位置0μmに対応する位相差画像において、スフェアの輪郭が最も鮮明となる。
上記した位相差量総和PAは、下記の(6)式によって表わされる。但し、sは位相差画像の各画素kの面積であり、vkは位相差画像の各画素kに対応する部位におけるスフェアの体積である。(6)式に示されるように、位相差量総和PAは、スフェアの位相差画像の画素毎の位相差量Pkを、全ての画素kについて積算したものに相当する。位相差画像の画素値は、位相差量Pkに対応している。

位相差量密度DPは、下記の(7)式によって表わされる。但し、Vはスフェアの体積である。(7)式に示されるように、位相差量密度DPは、位相差量総和PAを当該スフェアの体積Vで除算したものに相当する。生細胞は、その恒常性から内部の屈折率は、媒質の屈折率とは異なる一定の値を維持するものと考えられる。一方、死細胞は、恒常性を喪失し、内部の屈折率が媒質の屈折率と略同じになるものと考えられる。従って、位相差量密度DPを、細胞の状態を示す指標として用いることが可能である。なお、2π/λは、定数として扱うことができるので、位相差量密度DPの導出に際し、2π/λの乗算を省略してもよい。ここで、スフェアの体積平均屈折率差NaveをNave=Σnk・(vk/V)とすると、(7)式は、DP=(2π/λ)×Naveとなることから、位相差量密度は体積平均したスフェアの屈折率差を波長の長さで規格化したものである。スフェアの体積Vはスフェアの位相像の断面画像から球相当径を算出して求めることが可能である。より正確に楕円球とすることも可能である。なお、開示の技術においては、体積平均屈折率差Naveを、位相差量密度DPと等価な指標として扱うことが可能である。

図8は、iPS細胞のスフェアの位相差量密度DPと、当該iPS細胞に対する分化誘導処理により得られた心筋細胞の得率Yとの関係の一例を示すグラフである。位相差量密度DPは、分化誘導処理が行われる前の時点(本実施形態では三次元培養工程S2を開始してから2日後)のスフェアについて取得したホログラムから生成された位相差画像から導出したものである。図8に示す各プロットは、細胞製品の製造工程における複数のクローンの各々に対応し、各プロットが示す位相差量密度DPは、製造ロット内における複数のスフェアについて取得した位相差量密度DPの平均値である。
得率Yは、下記の(8)式によって表される。(8)式においてNiは、分化誘導処理を行う前の時点(本実施形態では三次元培養工程S2を開始した初日)における製造ロット内の多能性幹細胞の数であり、Ncは、分化誘導処理を行った後の時点(本実施形態では分化誘導工程S4を開始してから12日後)に得られた製造ロット内の心筋細胞の数である。すなわち、得率Yは、投入された多能性幹細胞に数Niに対する生産された心筋細胞の数Ncの割合である。なお、Niの計測時点からNcの計測時点までの間にも細胞は増殖するため、得率Yは100%を超える場合もある。また、心筋細胞の数Ncは、cTnT陽性細胞数を計測することにより取得することが可能である。

図8に示すように、位相差量密度DPが所定範囲RA内にあるスフェアに含まれる多能性幹細胞は、その後の分化誘導処理によって得られる心筋細胞の得率Yが顕著に高くなる。すなわち、図8は、高い得率Yが得られる多能性幹細胞を、スフェアの位相差量密度DPによって選別できることを示している。
図2に示される開示の技術の実施形態に係る多能性幹細胞の選別方法は、図8に示すように、心筋細胞の得率Yが、スフェアの位相差量密度DPに反映されるという知見に基づくものであり、位相差量密度DPに基づいて、多能性幹細胞の選別を行うことを含む(図2、ステップS13参照)。具体的には、位相差量密度DPが所定範囲RA内にあるスフェアに含まれる多能性幹細胞を、分化誘導処理の対象とし、位相差量密度DPが所定範囲RA内にないスフェアに含まれる多能性幹細胞を、分化誘導処理の対象から除外することを含む。
開示の技術の実施形態に係る選別方法は、図8に例示されるような、分化誘導処理を行う前のスフェアについて取得された位相差量密度DPと、当該スフェアに含まれる多能性幹細胞に対する分化誘導処理によって得られた心筋細胞の得率Yとの関係性に基づいて、位相差量密度DPについて、選別のための所定範囲RAを定めることを含む。
例えば、図8に示す例において、心筋細胞の得率を100%以上にしようとする場合、位相差量密度DPが0.102[rad/μm]以上0.114[rad/μm]以下の範囲にあるスフェアに含まれる多能性幹細胞が分化誘導処理の対象とされる。なお、位相差量密度DPは、ホログラム光学系10における物体光の波長λによって変化することから、波長λは常に一定であることが好ましい。
開示の技術の実施形態に係る選別方法によれば、スフェアの位相差量密度DPに基づいて多能性幹細胞の選別を行うので、細胞製品の製造プロセスにおける比較的早い段階で、所望の得率が見込める多能性幹細胞を特定することができる。従って、所望の得率を見込めない多能性幹細胞については、例えば処理を中断するまたは製造条件を変更する等の措置がとれるので、細胞製品の生産性を高めるとともに、製造コストを抑制することが可能となる。
開示の技術の実施形態に係る選別方法においては、分化誘導処理を行う前のスフェアについて撮像されたホログラムから生成された位相差画像に基づいて位相差量密度DPを導出することが好ましい。これにより、分化誘導処理を行う前の段階で、多能性幹細胞の選別を行うことができるので、細胞製品の生産性を高める効果を促進させることができる。位相差量密度DPの測定は攪拌培養開始2時間以降5日以内に実施することが好ましく、12時間以降3日以内に実施することがさらに好ましく、1日以降2日以内に実施することが最も好ましい。 なお、スフェアを形成させるために攪拌培養の代わりに静置培養を行う場合は、スフィアを形成するための静置培養開始から2時間以降5日以内に位相差量密度DPの測定を行うことが好ましく、12時間以降3日以内に実施することがさらに好ましく、1日以降2日以内に実施することが最も好ましい。分化誘導処理後であっても、位相差量密度DPに分化に伴う変化が現れるまでの期間であれば、位相差量密度DPと得率Yとの関係性は維持されるので、当該期間内のスフェアについて撮像されたホログラムから生成された位相差画像に基づいて位相差量密度DPを導出してもよい。
多能性幹細胞の選別は、スフェア単位または製造ロット単位で行うことが可能である。多能性幹細胞の選別を製造ロット単位で行う場合、例えば、製造ロット内における複数のスフェアの一部または全部について位相差量密度DPを取得し、位相差量密度DPのロット内平均値が所定範囲内にある場合、当該製造ロットに含まれる全ての多能性幹細胞を分化誘導処理の対象としてもよい。
ここで、位相差量密度DPと得率Yとの間の関係性については、公知の関数フィッティング手法を用いて数式化することができる。例えば、ガウス関数とシグモイド関数の線形結合モデルを用いて、図8に示す位相差量密度DPと得率Yとの関係性を示す関数として下記の(9)式を導出することが可能である。

(9)式は、細胞製品の製造工程における途中段階で得られるスフェアの位相差量密度DPから、分化誘導処理によって得られる心筋細胞の得率Yを予測できることを示している。開示の技術の実施形態に係る分化誘導結果の予測方法は、位相差量密度DPと心筋細胞の得率Yとの間の関係性を利用するものであり、スフェアの位相差量密度DPに基づいて、当該スフェアに含まれる複数の多能性幹細胞に対して分化誘導処理を行うことにより得られる心筋細胞の数に関する予測値を導出することを含む。具体的には、スフェアの位相差量密度DPを、(9)式によって例示される、位相差量密度DPと得率Yとの関係性を示す関数に代入することにより、当該スフェアに含まれる多能性幹細胞に対して分化誘導処理を行うことによって得られる心筋細胞の得率Yの予測値を導出することを含む。
このように、位相差量密度DPと得率Yとの関係性を示す関数が特定されることで、スフェアの位相差量密度DPに基づいて、当該スフェアに対して分化誘導処理を行った場合に得られる心筋細胞の得率Yの予測値を導出すること、すなわち、分化誘導結果を予測することが可能である。位相差量密度DPと得率Yとの関係性を示す関数を用いることにより、心筋細胞の数に関する予測値として、得率以外の予測値を導出することも可能である。例えば、(8)式におけるNi(多能性幹細胞の投入数)が計測されている場合には、位相差量密度DPと心筋細胞の得率Yとの関係性を示す関数を用いて、生産される心筋細胞の数Nc(=Ni×E)の予測値を導出することも可能である。
以上のように、開示の技術の実施形態に係る分化誘導結果の予測方法によれば、スフェアの位相差量密度DPに基づいて、当該スフェアに含まれる多能性幹細胞に対して分化誘導処理を行うことによって得られる心筋細胞の数に関する予測値が導出される。これにより、例えば、導出された予測値が、要求水準に満たない多能性幹細胞については、例えば処理を中断するまたは製造条件を変更する等の措置がとれるので、細胞製品の生産性を高めることともに、製造コストを抑制することが可能となる。
開示の技術の実施形態に係る分化誘導結果の予測方法においては、分化誘導処理を行う前のスフェアについて撮像されたホログラムから生成された位相差画像に基づいて位相差量密度DPを導出することが好ましい。これにより、分化誘導処理を行う前の段階で、分化誘導結果を予測することができるので、細胞製品の生産性を高める効果を促進させることができる。位相差量密度DPの測定は攪拌培養開始2時間以降5日以内に実施することが好ましく、12時間以降3日以内に実施することがさらに好ましく、1日以降2日以内に実施することが最も好ましい。 なお、スフェアを形成させるために攪拌培養の代わりに静置培養を行う場合は、スフェアを形成するための静置培養開始から2時間以降5日以内に位相差量密度DPの測定を行うことが好ましく、12時間以降3日以内に実施することがさらに好ましく、1日以降2日以内に実施することが最も好ましい。分化誘導処理後であっても、位相差量密度DPに分化に伴う変化が現れるまでの期間であれば、位相差量密度DPと得率Yとの関係性は維持されるので、当該期間内のスフェアについて撮像されたホログラムから生成された位相差画像に基づいて位相差量密度DPを導出してもよい。
なお、以上の説明においては、多能性幹細胞を心筋細胞に分化させる場合を例示したが、この態様に限定されない。図8に例示される位相差量密度DPと得率Yとの間の関係性は、多能性幹細胞を心筋細胞以外の他の細胞に分化させる場合においても成立するものと考えられる。従って、多能性幹細胞を心筋細胞以外の他の細胞に分化させる場合においても、開示の技術を適用することが可能であると考えられる。心筋細胞以外の細胞としては、内胚葉系細胞として、例えば、消化器系細胞(肝細胞、胆管細胞、膵内分泌細胞、腺房細胞、導管細胞、吸収細胞、杯細胞、パネート細胞、腸内分泌細胞等)、肺、甲状腺等の組織の細胞等が挙げられ、中胚葉系細胞として、例えば、血球・リンパ球系細胞(造血幹細胞、赤血球、血小板、マクロファージ、顆粒球、ヘルパーT細胞、キラーT細胞、Bリンパ球等)、脈管系細胞(血管内皮細胞等)、骨芽細胞、骨細胞,軟骨細胞,腱細胞,脂肪細胞、骨格筋細胞、平滑筋細胞等が挙げられ、外胚葉系細胞として、例えば、神経系細胞、感覚器細胞(水晶体、網膜、内耳など)、皮膚表皮細胞、毛包等が挙げられる。
[実施例]
以下において、図8に示す位相差量密度DPと得率Yとの間の関係性を示すグラフの導出に関する実施例について開示する。なお、開示の技術は、下記の実施例に限定されるものではない。
以下において、図8に示す位相差量密度DPと得率Yとの間の関係性を示すグラフの導出に関する実施例について開示する。なお、開示の技術は、下記の実施例に限定されるものではない。
異なるドナー由来を含む末梢血単核球細胞から特許5984217号に記載の方法に準じてiPS細胞クローンA~Oを作成した。iPS細胞の培養にはmTeSR1(Stem Cell Technologies社)、およびMatrigel(Corning社)を使用し、iPS細胞の拡大培養を行った。0.5mM EDTA溶液(Invitrogen社)によって7分間処理することで細胞を回収し継代を行い、T225フラスコにコンフルエンシーが80%程度になった時点で、TrypLE Select(Thermo Fisher社)にて細胞を単細胞剥離して回収し、終濃度1μM H1152(富士フイルム和光純薬社)、25μg/ml Gentamicin(Thermo Fisher社)、および100ng/ml bFGF(富士フイルム和光純薬社)を添加したmTeSR1中に3.0×10⁶cells/mlとなるように細胞を調整した。同細胞懸濁液を30mlシングルユースバイオリアクター(エイブル社)中に15ml添加し、回転速度40rpmで攪拌培養した。攪拌培養開始から2~4時間後、同一の培地にて最終液量30mlとなるようにメスアップし、そのまま攪拌培養を継続した。
攪拌培養開始1日後、終濃度1μM H1152、25μg/ml Gentamicin、 100ng/ml bFGF、 24ng/ml Activin、5% ウシ胎児血清(GEヘルスケア社)、×0.5 mTeSR1、および×0.5 DMEM Low-glucose(Thermo Fisher社)からなる培地に置換し、攪拌培養を継続した。
攪拌培養開始2日後、15クローンの各々について、培養液を一部サンプリングして、撮影システム1を用いてスフェアのホログラムを取得し、取得したスフェアのホログラムについて位相差画像を生成した。
使用した撮像システム1の構成は、以下の通りである。レーザ光源11には、波長632.8nmの出力5mWのHeNeレーザを使用した。光ファイバ23は、NA=0.11のものを使用した。コリメートレンズ13は、f=10mm(NA=0.4)のものを使用した。スフェアに照射されるレーザ光の径を2.2mmとした。対物レンズ15は、NA=0.45、f=20mmのものを使用した。結像レンズ17は、f=200mm、開口径36mmのものを使用し、像倍率10倍でCMOSカメラの撮像面に結像した。コリメートレンズ21は、f=100mm(NA=0.25)のものを使用した。CMOSカメラ19は、解像度2448×2048、センサーサイズ3.45μm×3.45μmのモノクロのイメージセンサを使用した。CMOSカメラ19の撮像面に入射する物体光と参照光の光軸方向が互いに異なったオフアキシャル光学系になるように、ビームスプリッタ18を傾けて、参照光を物体光に対し、約3°傾けて撮影を行った。
撮影システム1によって取得した画像を2048×2048のサイズにトリミングを行った後、二次元フーリエ変換を行い、半径250pixelの円形開口のマスクを用いた周波数フィルタリング処理により、物体光のみの複素振幅成分の抜き出しを行った。位相差画像の復元には、角スペクトル伝搬法を使用した。位相アンラッピングには、Unweighted Least Squaresを使用した。
続いて、15クローンの各々について、位相差画像について(6)式及び(7)式を用いて位相差量密度DPを導出した。培養液を一部サンプリングして細胞数を計測し、終濃度25μg/ml Gentamaicin、100ng/ml bFGF、24ng/ml Activin、40ng/ml BMP4、10% ウシ胎児血清、およびDMEM low-glucoseからなる培地中に1.0×10⁶cells/mlとなるように調整し、分化培養を開始した。なお、分化培養中も攪拌培養を継続した。攪拌培養開始3日~7日は同培地にて毎日培地交換し、攪拌培養を継続した。
攪拌培養開始8日後、培養液を一部サンプリングして細胞数を計測し、終濃度25μg/ml Gentamaicin、16.25μg/ml XAV939(Sigma Aldrich社)、10% ウシ胎児血清、およびDMEM low-glucoseからなる培地中に1.0×10⁶cells/mlとなるように調整し、攪拌培養を継続した。攪拌培養9日~13日はXAV939を除いた同培地にて2日毎に培地交換し、攪拌培養を継続した。
攪拌培養開始14日後、クローンA、B、D、E、F、G、I、J、K、L、M、N、O由来の細胞塊は一部が自律拍動していることが確認された。一方でクローンC、H由来の細胞塊は拍動が観察されなかった。培養液の一部をサンプリングして細胞数を計測した。最終的に得られた細胞数を表1に示す。

攪拌培養開始後14日の細胞塊をTrypLE Selectで単一細胞まで分離し、Live/Dead Fixable Green Dead Cell Stain Kitを用いて死細胞を染色した。D-PBS(Thermo Fisher社)にて洗浄後、終濃度4% ホルムアルデヒド(Sigma Aldrich社)で処理して細胞を固定した。得られた固定細胞0.5×10⁶cellsに対して、終濃度0.1% Saponin、2% ウシ胎児血清を含むD-PBS中に、anti-cardiac Troponin T(cTnT)抗体(Abcam社ab8295)を1/250に希釈して添加し、室温で1時間処置した。同時にIsotypeコントロールとしてIgG1 isotype Cotrol Murine Myeloma(Sigma Aldrich社 M5284)を1/25に希釈して添加したサンプルを並列させた。続いてAlexa647標識Goat anti-mouse IgG1抗体(Thermo Fisher社 A21240)を1/500に希釈して添加し、室温で30分処置した。得られた標識細胞をフローサイトメーターを用いて解析した。前方光散乱、側方光散乱、および生細胞をゲーティングしたのち、Isotypeサンプルとの比較からcTnT陽性細胞率を算出した。各クローンのcTnT陽性率、および全細胞数とcTnT陽性率とから算出したcTnT陽性細胞数(総心筋細胞数)を表2に示す。

15クローンの各々について、攪拌培養の開始時点における細胞数に対する、総心筋細胞数の割合を得率Yとして導出した。続いて、クローン毎に取得した位相差量密度DP及び得率Yをグラフ上にプロットすることで、図8に示す位相差量密度DPと得率Yとの関係性を示すグラフを作成した。
さらに、位相差量密度DPと得率Yとの間の関係性について、公知の関数フィッティング手法であるガウス関数とシグモイド関数の線形結合モデルを用いて数式化した。図8に示す位相差量密度DPと得率Yとの関係性を示す関数として上記の(9)式を導出することができた。
15クローンの各々について、(9)式を用いて算出された心筋細胞の得率の予測値(縦軸)と、実測値(横軸)との関係を図9に示した。図9の各プロットが示す得率の予測値及び実測値は、ロット内平均値である。図9における点線は、予測値と実測値が一致する場合の理想線であり、図9における実線は各プロットに基づいて導出した近似直線である。図9に示すグラフの横軸をα、縦軸をβとすると、近似直線はβ=0.9357α+8.867と表される。この近似直線における決定係数R2は、0.9426であり、相関係数Rは、0.9709である。すなわち、(9)式によって示される関数を用いて導出される得率の予測値の精度は、極めて高いといえる。
なお、2019年10月28日に出願された日本国特許出願2019-195670の開示は、その全体が参照により本明細書に取り込まれる。また、本明細書に記載された全ての文献、特許出願および技術規格は、個々の文献、特許出願、および技術規格が参照により取り込まれることが具体的かつ個々に記された場合と同程度に、本明細書中に参照により取り込まれる。
Claims (9)
- 多能性幹細胞の凝集体を撮像したホログラムから前記凝集体の位相差画像を生成し、
前記位相差画像を構成する複数の画素の各々の位相差量を積算した値である位相差量総和を前記凝集体の体積で除算した位相差量密度を導出し、
前記位相差量密度に基づいて、前記多能性幹細胞の選別を行う
多能性幹細胞の選別方法。 - 前記位相差量密度が所定範囲内にある凝集体に含まれる多能性幹細胞を、特定の細胞に分化させるための分化誘導処理の対象とする
請求項1に記載の選別方法。 - 前記分化誘導処理を行う前の前記凝集体について取得された前記位相差量密度と、前記分化誘導処理を行う前の時点の多能性幹細胞の数に対する、前記分化誘導処理により得られた前記特定の細胞の数の割合を示す得率と、の関係性に基づいて、前記位相差量密度について前記所定範囲を定める
請求項2に記載の選別方法。 - 多能性幹細胞の凝集体を撮像したホログラムから前記凝集体の位相差画像を生成し、
前記位相差画像を構成する複数の画素の各々の位相差量を積算した値である位相差量総和を前記凝集体の体積で除算した位相差量密度を導出し、
前記位相差量密度に基づいて、前記多能性幹細胞に対して特定の細胞に分化させるための分化誘導処理を行うことにより得られる前記特定の細胞の数に関する予測値を導出する
分化誘導結果の予測方法。 - 前記予測値は、前記分化誘導処理を行う前の時点における多能性幹細胞の数に対する、前記分化誘導処理によって得られる前記特定の細胞の数の割合を示す得率である
請求項4に記載の予測方法。 - 前記位相差量密度と前記得率との関係性を示す関数を用いて前記予測値を導出する
請求項5に記載の予測方法。 - 多能性幹細胞を培養する培養工程と、
前記培養工程において培養された前記多能性幹細胞を選別する選別工程と、
前記選別工程において選別された多能性幹細胞に対して、特定の細胞に分化させるための分化誘導処理を行う分化誘導工程と、
を含む細胞製品の製造方法であって、
前記選別工程は、
前記多能性幹細胞の凝集体を撮像したホログラムから前記凝集体の位相差画像を生成し、
前記位相差画像を構成する複数の画素の各々の位相差量を積算した値である位相差量総和を前記凝集体の体積で除算した位相差量密度を導出し、
前記位相差量密度に基づいて、前記多能性幹細胞の選別を行う
ことを含む製造方法。 - 前記特定の細胞が、心筋細胞である請求項2から請求項7のいずれか1項に記載の方法。
- 前記分化誘導処理を行う前の前記凝集体について撮像されたホログラムから生成された前記位相差画像に基づいて前記位相差量密度を導出する
請求項2から請求項8のいずれか1項に記載の方法。
Priority Applications (3)
| Application Number | Priority Date | Filing Date | Title |
|---|---|---|---|
| JP2021554228A JPWO2021085033A1 (ja) | 2019-10-28 | 2020-10-02 | |
| EP20883205.5A EP4043864A4 (en) | 2019-10-28 | 2020-10-02 | METHOD FOR SORTING PLURIPOTENT STEM CELLS, METHOD FOR PREDICTING RESULTS OF INDUCTION OF DIFFERENTIATION, AND METHOD FOR MANUFACTURING CELLULAR PRODUCT |
| US17/729,267 US20220253016A1 (en) | 2019-10-28 | 2022-04-26 | Sorting method for pluripotent stem cell, prediction method for differentiation induction result, and production method for cell product |
Applications Claiming Priority (2)
| Application Number | Priority Date | Filing Date | Title |
|---|---|---|---|
| JP2019195670 | 2019-10-28 | ||
| JP2019-195670 | 2019-10-28 |
Related Child Applications (1)
| Application Number | Title | Priority Date | Filing Date |
|---|---|---|---|
| US17/729,267 Continuation US20220253016A1 (en) | 2019-10-28 | 2022-04-26 | Sorting method for pluripotent stem cell, prediction method for differentiation induction result, and production method for cell product |
Publications (1)
| Publication Number | Publication Date |
|---|---|
| WO2021085033A1 true WO2021085033A1 (ja) | 2021-05-06 |
Family
ID=75716239
Family Applications (1)
| Application Number | Title | Priority Date | Filing Date |
|---|---|---|---|
| PCT/JP2020/037590 WO2021085033A1 (ja) | 2019-10-28 | 2020-10-02 | 多能性幹細胞の選別方法、分化誘導結果の予測方法及び細胞製品の製造方法 |
Country Status (4)
| Country | Link |
|---|---|
| US (1) | US20220253016A1 (ja) |
| EP (1) | EP4043864A4 (ja) |
| JP (1) | JPWO2021085033A1 (ja) |
| WO (1) | WO2021085033A1 (ja) |
Cited By (1)
| Publication number | Priority date | Publication date | Assignee | Title |
|---|---|---|---|---|
| WO2022270179A1 (ja) * | 2021-06-24 | 2022-12-29 | 富士フイルム株式会社 | 情報処理装置、情報処理方法、及びプログラム |
Citations (6)
| Publication number | Priority date | Publication date | Assignee | Title |
|---|---|---|---|---|
| JP2015146747A (ja) | 2014-02-05 | 2015-08-20 | 浜松ホトニクス株式会社 | 細胞判定方法 |
| JP5984217B2 (ja) | 2010-06-15 | 2016-09-06 | セルラー ダイナミクス インターナショナル, インコーポレイテッド | 少量の末梢血からの人工多能性幹細胞の作製 |
| JP2018000048A (ja) | 2016-06-29 | 2018-01-11 | オリンパス株式会社 | 多能性幹細胞の無染色評価支援方法、プログラム、演算装置 |
| WO2018158901A1 (ja) | 2017-03-02 | 2018-09-07 | 株式会社島津製作所 | 細胞解析方法及び細胞解析装置 |
| WO2019176427A1 (ja) * | 2018-03-12 | 2019-09-19 | 富士フイルム株式会社 | 判定方法 |
| JP2019195670A (ja) | 2013-03-15 | 2019-11-14 | ウインドギャップ メディカル インコーポレイテッド | 携帯型薬剤混合及び送達システム並びに方法 |
Family Cites Families (1)
| Publication number | Priority date | Publication date | Assignee | Title |
|---|---|---|---|---|
| SG11201912436PA (en) * | 2017-06-19 | 2020-01-30 | Foundation For Biomedical Res And Innovation At Kobe | Method for predicting differentiation ability of pluripotent stem cell, and reagent for same |
-
2020
- 2020-10-02 JP JP2021554228A patent/JPWO2021085033A1/ja not_active Abandoned
- 2020-10-02 EP EP20883205.5A patent/EP4043864A4/en not_active Withdrawn
- 2020-10-02 WO PCT/JP2020/037590 patent/WO2021085033A1/ja unknown
-
2022
- 2022-04-26 US US17/729,267 patent/US20220253016A1/en not_active Abandoned
Patent Citations (6)
| Publication number | Priority date | Publication date | Assignee | Title |
|---|---|---|---|---|
| JP5984217B2 (ja) | 2010-06-15 | 2016-09-06 | セルラー ダイナミクス インターナショナル, インコーポレイテッド | 少量の末梢血からの人工多能性幹細胞の作製 |
| JP2019195670A (ja) | 2013-03-15 | 2019-11-14 | ウインドギャップ メディカル インコーポレイテッド | 携帯型薬剤混合及び送達システム並びに方法 |
| JP2015146747A (ja) | 2014-02-05 | 2015-08-20 | 浜松ホトニクス株式会社 | 細胞判定方法 |
| JP2018000048A (ja) | 2016-06-29 | 2018-01-11 | オリンパス株式会社 | 多能性幹細胞の無染色評価支援方法、プログラム、演算装置 |
| WO2018158901A1 (ja) | 2017-03-02 | 2018-09-07 | 株式会社島津製作所 | 細胞解析方法及び細胞解析装置 |
| WO2019176427A1 (ja) * | 2018-03-12 | 2019-09-19 | 富士フイルム株式会社 | 判定方法 |
Non-Patent Citations (1)
| Title |
|---|
| See also references of EP4043864A4 |
Cited By (1)
| Publication number | Priority date | Publication date | Assignee | Title |
|---|---|---|---|---|
| WO2022270179A1 (ja) * | 2021-06-24 | 2022-12-29 | 富士フイルム株式会社 | 情報処理装置、情報処理方法、及びプログラム |
Also Published As
| Publication number | Publication date |
|---|---|
| JPWO2021085033A1 (ja) | 2021-05-06 |
| EP4043864A1 (en) | 2022-08-17 |
| US20220253016A1 (en) | 2022-08-11 |
| EP4043864A4 (en) | 2022-11-30 |
Similar Documents
| Publication | Publication Date | Title |
|---|---|---|
| JP6348635B2 (ja) | 生細胞干渉法を介した急速超並列単細胞薬物反応測定法 | |
| Pavillon et al. | Early cell death detection with digital holographic microscopy | |
| Cogger et al. | Three-dimensional structured illumination microscopy of liver sinusoidal endothelial cell fenestrations | |
| JP6995975B2 (ja) | 判定方法 | |
| Agero et al. | Defocusing microscopy | |
| Mathieu et al. | Time-lapse lens-free imaging of cell migration in diverse physical microenvironments | |
| KR101855366B1 (ko) | 간세포 내 지질을 3d 비표지 영상화 및 정량화하는 방법 및 장치 | |
| Zangle et al. | Quantification of biomass and cell motion in human pluripotent stem cell colonies | |
| WO2021085033A1 (ja) | 多能性幹細胞の選別方法、分化誘導結果の予測方法及び細胞製品の製造方法 | |
| WO2021085034A1 (ja) | 多能性幹細胞の選別方法、分化誘導結果の予測方法及び細胞製品の製造方法 | |
| Groux et al. | Dynamic full-field optical coherence tomography allows live imaging of retinal pigment epithelium stress model | |
| Wang et al. | Morphological measurement of living cells in methanol with digital holographic microscopy | |
| Kwee et al. | Quantifying proliferative and surface marker heterogeneity in colony‐founding connective tissue progenitors and their progeny using time‐lapse microscopy | |
| Seo et al. | Cellular imaging using phase holographic microscopy: for the study of pathophysiology of red blood cells and human umbilical vein endothelial cells | |
| JP7046211B2 (ja) | 判定方法 | |
| Lee et al. | Long-term three-dimensional high-resolution imaging of live unlabeled small intestinal organoids using low-coherence holotomography | |
| WO2023233827A1 (ja) | 位相画像取得方法及び定量データ取得方法 | |
| Zicha et al. | Testing anti-cancer drugs with holographic incoherent-light-source quantitative phase imaging | |
| Baczewska et al. | Quantitative phase imaging supported by Raman micro-spectroscopy for identifying and quantifying changes in myeloid cells treated with proteasome inhibitor | |
| Wang et al. | 3D live imaging and phenotyping of the subcellular cytotoxicity in cancer immunotherapy using event-triggered Bessel oblique plane microscopy | |
| Singla et al. | Quantitative Detection of Morphological Alterations in Red Blood Cell During Storage Using PS-FF-OCT System | |
| Shaked et al. | Quantitative phase microscopy of biological cell dynamics by wide-field digital interferometry | |
| Gilerovich et al. | Detection of glomeruli in the human cerebellum using an immunocytochemical reaction for synaptophysin and confocal laser microscopy | |
| BLINCKO | Characterisation of Embryonic Dermal Precursor Cells | |
| Chvalova et al. | Comparison of holotomographic microscopy and coherence‐controlled holographic microscopy |
Legal Events
| Date | Code | Title | Description |
|---|---|---|---|
| 121 | Ep: the epo has been informed by wipo that ep was designated in this application |
Ref document number: 20883205 Country of ref document: EP Kind code of ref document: A1 |
|
| ENP | Entry into the national phase |
Ref document number: 2021554228 Country of ref document: JP Kind code of ref document: A |
|
| NENP | Non-entry into the national phase |
Ref country code: DE |
|
| ENP | Entry into the national phase |
Ref document number: 2020883205 Country of ref document: EP Effective date: 20220426 |