WO2021075039A1 - 時系列データ処理方法 - Google Patents
時系列データ処理方法 Download PDFInfo
- Publication number
- WO2021075039A1 WO2021075039A1 PCT/JP2019/041013 JP2019041013W WO2021075039A1 WO 2021075039 A1 WO2021075039 A1 WO 2021075039A1 JP 2019041013 W JP2019041013 W JP 2019041013W WO 2021075039 A1 WO2021075039 A1 WO 2021075039A1
- Authority
- WO
- WIPO (PCT)
- Prior art keywords
- series data
- time
- value
- period
- data processing
- Prior art date
- Legal status (The legal status is an assumption and is not a legal conclusion. Google has not performed a legal analysis and makes no representation as to the accuracy of the status listed.)
- Ceased
Links
Images










Classifications
-
- G—PHYSICS
- G01—MEASURING; TESTING
- G01M—TESTING STATIC OR DYNAMIC BALANCE OF MACHINES OR STRUCTURES; TESTING OF STRUCTURES OR APPARATUS, NOT OTHERWISE PROVIDED FOR
- G01M99/00—Subject matter not provided for in other groups of this subclass
- G01M99/005—Testing of complete machines, e.g. washing-machines or mobile phones
-
- G—PHYSICS
- G05—CONTROLLING; REGULATING
- G05B—CONTROL OR REGULATING SYSTEMS IN GENERAL; FUNCTIONAL ELEMENTS OF SUCH SYSTEMS; MONITORING OR TESTING ARRANGEMENTS FOR SUCH SYSTEMS OR ELEMENTS
- G05B23/00—Testing or monitoring of control systems or parts thereof
- G05B23/02—Electric testing or monitoring
- G05B23/0205—Electric testing or monitoring by means of a monitoring system capable of detecting and responding to faults
- G05B23/0218—Electric testing or monitoring by means of a monitoring system capable of detecting and responding to faults characterised by the fault detection method dealing with either existing or incipient faults
- G05B23/0221—Preprocessing measurements, e.g. data collection rate adjustment; Standardization of measurements; Time series or signal analysis, e.g. frequency analysis or wavelets; Trustworthiness of measurements; Indexes therefor; Measurements using easily measured parameters to estimate parameters difficult to measure; Virtual sensor creation; De-noising; Sensor fusion; Unconventional preprocessing inherently present in specific fault detection methods like PCA-based methods
-
- G—PHYSICS
- G06—COMPUTING OR CALCULATING; COUNTING
- G06F—ELECTRIC DIGITAL DATA PROCESSING
- G06F11/00—Error detection; Error correction; Monitoring
- G06F11/07—Responding to the occurrence of a fault, e.g. fault tolerance
Definitions
- the present invention relates to a time series data processing method, a time series data processing device, and a program.
- time-series data which is the measured value from various sensors, is analyzed, and the occurrence of an abnormal state is detected and output.
- time-series data such as CPU usage is collected from a network configured by connecting a plurality of nodes such as routers and server devices as a monitoring target, and calculated from the time-series data.
- the threshold value for comparing the degree of abnormality calculated from the time series data is set in advance, or a new threshold value is calculated from the total result of the presence / absence of past abnormality and the presence / absence of detection. May be set.
- the number of false positives and the number of misses are calculated from the aggregated result, and the larger the number of false positives, the larger the increase in the threshold value, and the larger the number of missed detections, the smaller the decrease in the threshold value. Is calculated.
- false detections and oversights of abnormal conditions do not always occur frequently from time-series data. Therefore, there is a problem that it is difficult to set an appropriate threshold value.
- a threshold value for detecting the occurrence of an abnormal state from the abnormality degree calculated from the time series data to be monitored a combination of two threshold values such as "abnormality degree" and "duration" can be considered.
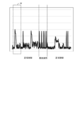
- time-series data such as an abnormality graph D2 calculated based on a predetermined analysis parameter A from a time-series data set D1 of a plurality of measured values as shown in FIG.
- the normal period in which the monitoring target is actually in the normal state and the abnormal period in which the monitoring target is in the abnormal state are set for the abnormality degree graph D2.
- the abnormality period of the abnormality degree graph D2 as shown in FIG.
- the threshold value should be set as low as possible, but false detection also occurs.
- the threshold value is set to the upper limit of the abnormal value so that false detection does not occur, the abnormal state may not be detected.
- an object of the present invention is time-series data that can solve the above-mentioned problem that it is difficult to set an appropriate threshold value when an abnormal state is detected based on time-series data.
- the purpose is to provide a processing method.
- the time series data processing method which is one embodiment of the present invention, is Of the time-series data including a plurality of parameters based on the data measured from the measurement target, the combination of a plurality of parameters is selected from the normal period time-series data which is the time-series data of the period in which the measurement target is determined to be in the normal state. Of these, the combination that maximizes the value of the other parameter with respect to the value of the predetermined parameter is extracted as the maximum value during the normal period. It takes the configuration.
- the time series data processing device which is one embodiment of the present invention, is Of the time-series data including a plurality of parameters based on the data measured from the measurement target, the combination of a plurality of parameters is selected from the normal period time-series data which is the time-series data of the period in which the measurement target is determined to be in the normal state.
- An extraction means that extracts the combination that maximizes the values of other parameters with respect to the value of a predetermined parameter as the maximum value during the normal period. With, It takes the configuration.
- the program which is one form of the present invention is For information processing equipment Of the time-series data including a plurality of parameters based on the data measured from the measurement target, the combination of a plurality of parameters is selected from the normal period time-series data which is the time-series data of the period in which the measurement target is determined to be in the normal state.
- An extraction means that extracts the combination that maximizes the values of other parameters with respect to the value of a predetermined parameter as the maximum value during the normal period. To realize, It takes the configuration.
- the present invention is configured as described above, and an appropriate threshold value can be set when an abnormal state is detected based on time series data.
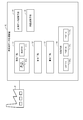
- FIG. 4 is a diagram for explaining the configuration of the time series data processing device
- FIGS. 5 to 15 are diagrams for explaining the processing operation of the time series data processing device.
- the time-series data processing device 10 in the present invention is connected to a measurement target P such as a plant. Then, the time-series data processing device 10 acquires and analyzes the measured values of at least one or more data items of the measurement target P, and monitors the state of the measurement target P based on the analysis result.
- the measurement target P is a plant such as a manufacturing factory or a processing facility
- the measurement values of each data item include a plurality of types such as temperature, pressure, flow rate, power consumption value, raw material supply amount, and remaining amount in the plant. Consists of the values of the data items of.
- the state of the measurement target P to be monitored is an abnormal state of the measurement target P in the present embodiment, and is in an abnormal state from the degree of abnormality calculated from the measured values of each data item based on a predetermined analysis parameter. It detects that there is something and outputs notification information notifying that it is in such an abnormal state.
- the administrator or the terminal device used by the administrator may be output notification information notifying that the measurement target P is in the normal state.
- the time-series data processing device 10 in the present invention extracts a threshold value candidate for detecting an abnormal state from the degree of abnormality, and selects and sets a threshold value from the candidates. ..
- the measurement target P in the present invention is not limited to a plant, and may be any equipment such as an information processing system.
- the CPU Central Processing Unit
- memory usage rate e.g., RAM
- disk access frequency e.g., ROM
- input / output of each information processing device such as a terminal or server constituting the information processing system.
- the number of packets, the input / output packet rate, the power consumption value, and the like may be measured as measured values of each data item, and the measured values may be analyzed to monitor the state of the information processing system.
- the time-series data processing device 10 is composed of one or a plurality of information processing devices including an arithmetic unit and a storage device. Then, as shown in FIG. 4, the time-series data processing device 10 includes an acquisition means 11, an extraction means 12, a calculation means 13, and a monitoring means 14. The functions of the acquisition means 11, the extraction means 12, the calculation means 13, and the monitoring means 14 can be realized by the arithmetic unit executing a program for realizing each function stored in the storage device. .. Further, the time-series data processing device 10 includes measurement data storage means 15 and threshold storage means 16. The measurement data storage means 15 and the threshold value storage means 16 are composed of a storage device. Hereinafter, each configuration will be described in detail.
- the acquisition means 11 acquires the measured values of each data item measured by various sensors installed in the measurement target P as time-series data at predetermined time intervals and stores them in the measurement data storage means 15. At this time, since there are a plurality of types of data items to be measured, the acquisition means 11 acquires a time-series data set which is a set of time-series data of a plurality of data items as shown by reference numeral D1 in FIG.
- the time-series data set is constantly acquired and stored by the acquisition means 11, and the acquired time-series data set is a threshold value used for detecting an abnormal state of the measurement target P, as will be described later. Is used when setting and when monitoring the state of the measurement target P, respectively.
- the acquisition means 11 includes an abnormality degree calculation means 11a and a generation means 11b.
- the abnormality degree calculation means 11a calculates the degree of abnormality indicating the degree to which the state of the measurement target P is an abnormal state from the time series data set acquired from the measurement target P.
- the generation means 11b generates an abnormality degree graph which is time-series data of the value of the abnormality degree, and stores it in the measurement data storage means 15.
- the degree of abnormality is a value obtained by analyzing the measured value of each data item at each time in the above-mentioned time series data set based on the analysis parameters, and the higher the value, the higher the value. The longer the duration of, the higher the degree of determination of an abnormal state.
- the degree of anomaly is obtained by inputting one data item value and outputting the predicted value of the other data item for a prediction model relating to the values of two predetermined types of data items, and using the predicted value and the actual measured value. It is calculated according to the magnitude of the difference and the number of correlation failures. In this case, for example, the greater the degree of correlation failure, the higher the degree of the measurement target P being in the abnormal state, and the higher the value of the degree of abnormality is calculated.
- the method of calculating the degree of abnormality by the degree of abnormality calculation means 11a is not limited to the above-mentioned method, and any method may be used.
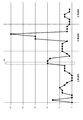
- FIG. 5 shows an example of the abnormality degree graph generated by the generation means 11b.
- the vertical axis of the abnormality graph is the degree of abnormality
- the horizontal axis is the time.
- the abnormality degree graph is time-series data in which the abnormality degree value changes with the passage of time, and is a "abnormality degree value" (other parameters) and a “duration” (duration period) in which the abnormality degree value continues. It is configured to include a plurality of parameters (variables) such as a predetermined parameter).
- the abnormality graph generated by the generation means 11b may include the state of the measurement target P. Specifically, the generation means 11b generates an abnormality graph including which period is the normal period and which period is the abnormal period among the measurement target periods. At this time, the generation means 11b indicates, for example, the state of the measurement target P determined at the past time that has already passed, that is, the normal period that is the normal state and the abnormal period that is the abnormal state in the abnormality degree graph. By setting in association with the time, an abnormality degree graph including the state of the measurement target P is generated.
- an example of an abnormality degree graph including a state is shown in FIG. In the example of this figure, the state is set to change with the passage of time in the order of normal period, abnormal period, and normal period, but different abnormal periods may be set in that case. , As will be described later, different abnormal periods will be distinguished from each other.
- the extraction means 12 is a limit at which the measurement target P is determined to be in the normal state by using the abnormality degree graph of the normal period in which the measurement target P set as described above is determined to be in the normal state.
- the threshold candidate is a value that is determined to be in an abnormal state when both the "abnormality” and the “duration” exceed the values.
- the threshold value that is a combination of the "abnormality value” and the “duration” is referred to as a "minimum covering value" (hereinafter, also referred to as a "normal period maximum value”).
- a method for extracting the minimum coating value will be described with reference to FIGS. 6 to 9.
- the extraction means 12 targets all the normal periods in the abnormality degree graph for the extraction processing of the minimum coverage value.
- the extraction process of the minimum coating value is performed only for the normal period on the left side, but in reality, all the normal periods are targeted.
- the extraction means 12 sets the “maximum value of the duration”. For example, as the "maximum value of the duration", a period such as the shortest abnormal period, the maximum normal period, and one day is set.
- the extraction means 12 sets a window W having a duration smaller than the above-mentioned "maximum value of the duration” on the abnormality degree graph, and obtains the maximum value of the abnormality degree value in the window W.
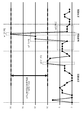
- the extraction means 12 first sets the window W whose duration is the minimum value “1”, and displays the window W in the abnormality degree graph as shown by the arrow in FIG. Slide up to find the maximum anomaly.
- the maximum value of the degree of abnormality becomes "10" as shown in FIG. Therefore, [1,10] is first extracted as the minimum coating value, which is a combination of “duration, degree of abnormality”.
- the extraction means 12 sets a window W in which the duration is increased by “+1” to be “2”, and the window W is slid on the abnormality degree graph to obtain the degree of abnormality. Find the maximum value of. That is, the extraction means 12 obtains the maximum value of the degree of abnormality in which the period of "2" continues. Then, in the case of the duration "2", the maximum value of the degree of abnormality becomes "10" as shown in FIG. Therefore, [2,10] is extracted as the minimum coating value which is a combination of “duration, degree of abnormality”.
- the extraction means 12 sets a window W in which the duration is further increased by “+1” to be “3”, and the window W is slid on the abnormality degree graph. Find the maximum value of the degree of anomaly. That is, the extraction means 12 obtains the maximum value of the degree of abnormality in which the period of "3" continues. Then, in the case of the duration "3", the maximum value of the degree of abnormality becomes "9” as shown in FIG. Therefore, [3, 9] is extracted as the minimum coating value, which is a combination of “duration, degree of abnormality”.
- the extraction means 12 repeats the extraction of the minimum coating value in the window W in which the duration is increased by "+1" as described above, and the duration becomes the "maximum value of the duration" set as described above. Do up to.
- the minimum coverage value in the normal period is [1,10], [3,9], [4,3], [7,1], [9,0].
- Candidates for a plurality of threshold values such as are extracted.
- the extraction means 12 reaches a limit at which the measurement target P can be determined to be in the abnormal state by using the abnormality degree graph of the abnormal period in which the measurement target P set as described above is determined to be in the abnormal state.
- the threshold value that is a combination of the "abnormality degree value” and the “duration” is referred to as the “maximum covering value” (hereinafter, also referred to as the "abnormal period maximum value”).
- the maximum covering value hereinafter, also referred to as the "abnormal period maximum value”.
- the extraction means 12 targets each abnormality period in the abnormality degree graph for extraction processing. That is, the extraction means 12 extracts the maximum coverage value for each abnormal period.
- the maximum covering value is extracted only for one abnormal period, but when there are a plurality of abnormal periods, the maximum covering is distinguished for each abnormal period. Extract the value.
- the extraction means 12 sets the window W of the duration of the "maximum value of the duration” set as described above on the abnormality degree graph, and obtains the maximum value of the abnormality degree value in the window W.
- the extraction means 12 first sets a window W having a duration of “10”, which is an abnormal period, and slides the window W on the abnormality degree graph to maximize the degree of abnormality. Find the value.
- the maximum value of the degree of abnormality becomes "2" as shown in FIG. Therefore, [10, 2] is first extracted as the maximum coverage value which is a combination of “duration, degree of abnormality”.
- the extraction means 12 reduces the duration by "-1" to set the window W, slides the window W on the abnormality degree graph, and repeats to obtain the maximum value of the abnormality degree.
- FIG. 11A is an example in which a window W having a duration of “3” is set and the window W is slid on the abnormality degree graph to obtain the maximum value of the abnormality degree. Then, in the case of the duration "3", the maximum value of the degree of abnormality becomes "15" as shown in FIG. 11A. Therefore, [3,15] is extracted as the maximum coverage value which is a combination of “duration, degree of abnormality”. Similarly, [1,25] is extracted as the maximum coverage value.
- the extraction means 12 extracts the maximum covering value in the same manner as described above for the abnormal period. For example, although not shown, when there is another abnormal period “abnormal period 2” on the anomaly degree graph, as shown in FIG. 12, the maximum coverage value [1,40] in such “abnormal period 2”. Will be extracted.
- the calculation means 13 determines which of the threshold candidates, which is the minimum coverage value extracted for the normal period as described above, is set as the threshold. At this time, the calculation means 13 calculates a margin value indicating the degree of margin for each maximum coating value extracted for each abnormal period for each minimum coating value, and determines a threshold value based on the margin value.
- a margin value indicating the degree of margin for each maximum coating value extracted for each abnormal period for each minimum coating value
- the calculation means 13 selects one of all the minimum coating values. Then, for each abnormal period, a margin value for each of all the maximum covering values is calculated for the selected minimum covering value.
- the margin value is the one of the "duration” and the "abnormality" that has no margin by comparing the "duration” and the "abnormality", which are the parameters constituting the minimum coating value and the maximum coating value. Is selected, and the ratio is calculated as a margin value.
- the margin is set from the value of the parameter that constitutes the minimum coating value itself, or the margin of the value of the parameter that constitutes the minimum coating value with respect to the maximum coating value, according to a preset standard.
- the degree is calculated, and it is determined that the larger the value of the margin degree, the less the margin.
- this minimum coating value [1,10] (w0) and the abnormality period 1 are considered.
- the margin values for each of the maximum covering values [1,25] (w1), [3,15] (w2), and [10,2] (w3) are calculated (see FIG. 11B).
- the "duration" of the minimum covering value [1,10] is "1"
- the margin value is defined as infinite, and the margin value is "0". ". Therefore, it is determined that there is no margin in the "abnormality” with respect to the "duration”, and the ratio of the "abnormality” is calculated as a margin value.
- the minimum covering value [1,10] (w0) and the maximum covering values [1,25] (w1), [3,15] (w2), [10,2] (w3) of the abnormal period 1 are obtained.
- the calculation means 12 sets the lowest value, that is, the value having the most margin among the calculated margin values, as the margin value for the abnormal period targeted by the selected minimum covering value.
- the margin value of the minimum coating value [1,10] (w0) with respect to the abnormal period 1 is “0.4” (see FIG. 11B).
- the calculation means 13 determines the maximum value among the margin values calculated for each abnormal period as the margin value of the minimum coating value for the selected minimum coating value. That is, for the minimum covering value [1,10], the maximum value "0" of the margin value "0.4” calculated for the abnormal period 1 and the margin value "0.25" calculated for the abnormal period 2 .4 ”is the margin value.
- the calculation means 13 selects the next minimum coating value, and calculates a margin value for each of all the maximum coating values for the selected minimum coating value for each abnormal period as described above.
- the minimum covering value [3,9] and the maximum covering values [1,25] and [3,15] of the abnormal period 1 are taken into consideration.
- [10, 2] Calculate the margin value with each.
- the calculation means 12 sets the lowest value, that is, the value having the most margin among the calculated margin values, as the margin value for the abnormal period targeted by the selected minimum covering value.
- the margin value for the abnormal period 1 of the minimum covering value [3, 9] is "1".
- the calculation means 13 further determines, among all the minimum coating values, the one having the minimum margin value as the threshold value.
- the margin value "0.4" is the minimum value
- the minimum coating value [1,10] is used as the threshold value.
- the processing by the acquisition means 11, the extraction means 12, and the calculation means 13 described above is performed on another abnormality graph generated from the time series data set acquired from the measurement target P based on the analysis parameters different from the above. It may be done against. Then, a candidate for the minimum coverage value may be extracted from another abnormality graph generated based on different analysis parameters in the same manner as described above, and the threshold value may be determined from the candidates. In addition to this, the calculation means 13 determines the smallest value among the threshold values determined for each abnormality degree graph generated based on each analysis parameter as the final threshold value, and generates the abnormality degree graph. The analysis parameter of may be determined as the optimum parameter.
- the monitoring means 14 analyzes and monitors whether or not an abnormal state has occurred in the measurement target P from the time series data set measured from the measurement target P using the threshold value determined as described above.
- the monitoring means 14 includes an analysis means 14a, a determination means 14b, and an output means 14c.
- the analysis means 14a calculates the degree of abnormality from the time-series data set measured from the measurement target P, and both the value of the degree of abnormality and the period during which the value of the degree of abnormality continues set a threshold value. Check if it exceeds.
- the determination means 14b determines that the measurement target P is in an abnormal state when the calculated values of the degree of abnormality and the duration exceed the threshold value.
- the output means 14c When the output means 14c determines that the measurement target P is in an abnormal state, the output means 14c outputs to that effect. For example, the output means 14c transmits notification information indicating that an abnormality has occurred to the registered e-mail address of the observer, or a monitoring terminal operated by the observer connected to the time-series data processing device 10. Output to display the notification information on the display screen of.
- the time-series data processing device 10 acquires the measured values of each data item measured by various sensors installed in the measurement target P as a time-series data set at predetermined time intervals, and stores them in the measurement data storage means 15. (Step S1). Then, the time-series data processing device 10 calculates the degree of abnormality at each time from the acquired time-series data set, and generates an abnormality degree graph which is time-series data (step S2). At this time, the time-series data processing device 10 generates an abnormality degree graph in which the normal period and the abnormal period are set (step S3).
- the time-series data processing device 10 extracts the minimum coverage value as a threshold candidate from the normal period of the abnormality degree graph (step S4).
- the time-series data processing device 10 slides the window W of each duration on the abnormality degree graph to specify the maximum value of the abnormality degree in each continuation period. Extract the minimum coverage value consisting of the parameters of [duration, degree of anomaly].
- the time-series data processing device 10 extracts only the combination of the "duration and the degree of abnormality" having the same degree of abnormality as the minimum coverage value having the smallest "duration". As a result, for example, as shown in FIG. 12, a plurality of minimum coating values are extracted.
- the time series data processing device 10 extracts the maximum coverage value from the abnormal period of the abnormality degree graph (step S5).
- the time-series data processing device 10 slides the window W of each duration on the abnormality degree graph to specify the maximum value of the abnormality degree in each continuation period. Extract the maximum coverage value consisting of the parameters of [duration, degree of abnormality].
- a plurality of maximum covering values are extracted.
- the time-series data processing device 10 extracts the maximum coverage value for each abnormal state in the abnormality degree graph.
- the time-series data processing device 10 determines which of the threshold candidates, which are all the minimum covering values extracted from the normal period, is set as the threshold. Therefore, the time-series data processing device 10 calculates a margin value indicating the degree of margin for each maximum coating value extracted for each abnormal period for each minimum coating value (step S6). Then, the time-series data processing device 10 sets the lowest value, that is, the value having the most margin among the calculated margin values, as the margin value for the abnormal period targeted by the selected minimum covering value. In this way, the time-series data processing device 10 calculates the margin value for each abnormal period of each minimum covering value as shown in FIGS. 11B and 13. Further, as shown in the rightmost column of FIG. 13, the time series data processing device 10 calculates the maximum value among the margin values for all the abnormal periods as the final margin value for each minimum coating value.
- the time-series data processing device 10 determines the minimum covering value, which is the minimum value, as the threshold value among the final margin values calculated for all the minimum covering values (step S7).
- the time-series data processing device 10 newly acquires the time-series data set measured from the measurement target P (step S11), and calculates the degree of abnormality at each time (step S12).
- the time-series data processing device 10 examines whether or not both the calculated abnormality degree and the duration thereof exceed the threshold value determined as described above (step S13). Then, when the calculated values of the degree of abnormality and the duration exceed the threshold value (Yes in step S13), the time-series data processing device 10 determines that the measurement target P is in an abnormal state (step S14). Further, the time-series data processing device 10 outputs that an abnormal state has occurred (step S15).
- the threshold candidates of the parameters that can be determined to be the abnormal state are extracted from the normal period in which the measurement target P is in the normal state. doing. Therefore, even when an abnormal state rarely occurs in the measurement target P, a candidate for an appropriate threshold value can be extracted from the data in the normal period, and an appropriate threshold value can be determined from the candidates. ..
- the maximum value of the parameter that can be determined to be in the abnormal state is extracted from the abnormal period in which the measurement target P is in the abnormal state in the abnormality degree graph, and the threshold value is determined from the threshold candidates by using such a value. doing. By considering the value of the abnormal state in this way, a more appropriate threshold value can be determined.
- FIG. 16 is a diagram for explaining the processing operation of the time series data processing apparatus according to the second embodiment.
- the time-series data processing apparatus in this embodiment has the same configuration as that shown in FIG. 4 described in the above-described first embodiment.
- the method of determining the threshold value from the minimum coating value extracted as a candidate for the threshold value is different between the present embodiment and the first embodiment.
- the calculation means 13 of the present embodiment as shown in FIG. 16, first, all the maximum covering values are arranged on the graph, and they are connected by a straight line. Then, the distance T from each minimum covering value with respect to the straight line connecting the maximum covering values is calculated, and the minimum covering value having the largest such distance T is determined as a threshold value.
- the method of determining the threshold value from the above-mentioned minimum coating value is an example, and in the present invention, one threshold value may be determined from a plurality of minimum coating values by any method. Further, in the above, the threshold value is determined by calculating the margin value of the minimum coating value using the maximum coating value, but the maximum coating value is not always used. That is, in the present invention, one threshold value may be determined by an arbitrary method from the minimum coating value by extracting only the minimum coating value without extracting the maximum coating value. As an example, the calculation means 13 may set priorities for a plurality of parameters constituting the minimum covering value, and determine the minimum covering value at which the parameter having the highest priority is the maximum value as a threshold value. Good.
- the calculation means 13 assigns a weight corresponding to the priority set for each parameter to the value of the parameter, and determines the minimum covering value at which the value is the maximum as the threshold value. May be good. If only one minimum coating value can be extracted, that one may be used as a threshold value.
- FIG. 17 is a diagram for explaining the processing operation of the time series data processing apparatus according to the third embodiment.
- the time-series data processing apparatus in this embodiment has the same configuration as that shown in FIG. 4 described in the above-described first embodiment.
- the parameters to be focused on when detecting the abnormal state from the abnormality degree graph which is the time series data are different from those in the first and second embodiments.
- FIG. 17 based on the combination of "abnormality" (predetermined parameter) and "number of increases in abnormality per unit time” (other parameters) in the abnormality graph. , It is decided to detect an abnormal state.
- the extraction means 12 sets the combination of the “abnormality” and the “number of increases in the abnormality per unit time” as the minimum covering value (maximum value in the normal period) in the normal period of the abnormality graph. Extract as. For example, as shown in FIG. 17, a window W per unit time is set on the abnormality degree graph and slid, and the value of the “abnormality degree” in the window W and the “number of rises” up to the value of the abnormality degree. And are extracted as the minimum coating value. At this time, the combination of the maximum values of the "number of rises" is extracted as the minimum coating value for each "abnormality degree". Similarly, in the abnormal period of the abnormality degree graph, the combination of the “abnormality degree” and the “number of increases in the abnormality degree per unit time” is extracted as the maximum covering value (abnormality period maximum value).
- the minimum coating value as a threshold value may be determined by calculating the margin degree (margin of the degree of abnormality, the margin of the number of increases) for each maximum coating value of each minimum coating value, and it is determined by any method. May be good. Thereby, it is possible to set the threshold value by the combination of the threshold value of the "abnormality degree" and the threshold value of the "number of times the abnormality degree increases per unit time".
- the parameter to be focused on when detecting the abnormal state from the abnormality degree graph which is time series data may be any parameter.
- the combination of parameters extracted as the minimum coating value and the maximum coating value may be any parameter.
- the cumulative value of the degree of abnormality per unit time in the degree of abnormality graph and the number of times the cumulative value exceeds the set threshold value may be used.
- the rate of change of the degree of abnormality per unit time and the number of times the rate of change exceeds the set threshold value may be used.
- the abnormality degree graph is used as the time series data, but the time series data is not necessarily limited to the abnormality degree graph, and may be time series data including any parameter.
- the measured value itself of a predetermined data item measured from the measurement target P is treated as time-series data, and the minimum covering value is extracted from the time-series data in the same manner as described above to set the threshold value for abnormality determination. You may.
- FIGS. 18 to 20 are block diagrams showing the configuration of the time-series data processing device according to the fourth embodiment
- FIG. 20 is a flowchart showing the operation of the time-series data processing device.
- the outline of the configuration of the time-series data processing apparatus and the time-series data processing method described in each of the above-described embodiments is shown.
- the time-series data processing device 100 is composed of a general information processing device, and is equipped with the following hardware configuration as an example.
- -CPU Central Processing Unit
- -ROM Read Only Memory
- RAM Random Access Memory
- 103 storage device
- -Program group 104 loaded into RAM 303
- a storage device 105 that stores the program group 304.
- a drive device 106 that reads and writes the storage medium 110 external to the information processing device.
- -Communication interface 107 that connects to the communication network 111 outside the information processing device -I / O interface 108 for inputting / outputting data -Bus 109 connecting each component
- the time-series data processing device 100 can construct and equip the extraction means 121 shown in FIG. 19 by the CPU 101 acquiring the program group 104 and executing the program group 104.
- the program group 104 is stored in, for example, a storage device 105 or a ROM 102 in advance, and the CPU 101 loads the program group 104 into the RAM 103 and executes the program group 104 as needed. Further, the program group 104 may be supplied to the CPU 101 via the communication network 111, or may be stored in the storage medium 110 in advance, and the drive device 106 may read the program and supply the program to the CPU 101.
- the extraction means 121 described above may be constructed by an electronic circuit.
- FIG. 18 shows an example of the hardware configuration of the information processing device which is the time series data processing device 100, and the hardware configuration of the information processing device is not limited to the above case.
- the information processing device may be composed of a part of the above-described configuration, such as not having the drive device 106.
- the time-series data processing device 100 executes the time-series data processing method shown in the flowchart of FIG. 20 by the function of the extraction means 121 constructed by the program as described above.
- the time series data processing device 100 is Of the time series data including multiple parameters based on the data measured from the measurement target, among the combination of multiple parameters from the normal period time series data which is the time series data of the period when the measurement target is determined to be in the normal state.
- the combination in which the values of the other parameters are maximized with respect to the values of the predetermined parameters is extracted as the maximum value in the normal period (step S1). Is executed.
- the present invention is configured as described above, and among the time series data including a plurality of parameters, the value at which a certain parameter is maximized is extracted as a threshold candidate from the data when the measurement target is in the normal state. doing. Therefore, threshold candidates can be extracted without using the data in the abnormal state of the measurement target, and an appropriate threshold can be determined.
- the combination of a plurality of parameters is selected from the normal period time-series data which is the time-series data of the period in which the measurement target is determined to be in the normal state.
- the combination that maximizes the value of the other parameter with respect to the value of the predetermined parameter is extracted as the maximum value during the normal period. Time series data processing method.
- Appendix 2 The time-series data processing method described in Appendix 1 From the normal period time series data, a combination of a plurality of parameters having the maximum value of the other parameter for each value of the predetermined parameter is extracted as the maximum value of the normal period. Time series data processing method.
- Appendix 3 The time-series data processing method described in Appendix 2, Among the maximum values of the normal period in which the values of the other parameters are the same, a combination of a plurality of parameters including a value in which the predetermined parameter is the minimum is excluded from the maximum value of the normal period. Time series data processing method.
- Appendix 6 The time-series data processing method described in Appendix 5. From the abnormal period time series data, a combination of a plurality of parameters having the maximum value of the other parameter for each value of the predetermined parameter is extracted as the abnormal period maximum value. Time series data processing method.
- Appendix 7 The time-series data processing method according to Appendix 5 or 6. From the abnormal period time series data for each abnormal state of the measurement target, the maximum value of the abnormal period for each abnormal state of the measurement target is extracted. Time series data processing method.
- Appendix 8 The time-series data processing method according to any one of Appendix 5 to 7. For any of the parameters in each of the maximum values of the normal period, a margin value which is a value based on the ratio of the maximum value of the abnormal period to any parameter is calculated. One of the maximum values during the normal period is set as the threshold value based on the margin value. Time series data processing method.
- Appendix 9 The time-series data processing method according to any one of Appendix 1 to 8.
- the other parameter is an abnormality degree which is a value indicating the degree to which the measurement target is in an abnormal state calculated from the measured data, and the predetermined parameter is a period during which the value of the abnormality degree continues.
- Time series data processing method is
- the combination of a plurality of parameters is selected from the normal period time-series data which is the time-series data of the period in which the measurement target is determined to be in the normal state.
- An extraction means that extracts the combination that maximizes the values of other parameters with respect to the value of a predetermined parameter as the maximum value during the normal period. Time series data processing device equipped with.
- Appendix 11 The time-series data processing apparatus according to Appendix 10.
- a calculation means is provided for setting any one of the maximum values during the normal period as a threshold value for determining that the measurement target is in an abnormal state in time series data including a plurality of parameters. Time series data processing device.
- the time-series data processing apparatus (Appendix 12) The time-series data processing apparatus according to Appendix 11, The extraction means refers to the other of the combination of a plurality of parameters with respect to the predetermined parameter from the abnormal period time series data which is the time series data of the period during which the measurement target is determined to be in the abnormal state among the time series data. Extract the combination with the maximum parameter as the maximum value during the abnormal period, The calculation means sets any one of the normal period maximum values as the threshold value based on the normal period maximum value and the abnormal period maximum value. Time series data processing device.
- the time-series data processing apparatus according to Appendix 12, The calculation means calculates a margin value which is a value based on the ratio of the abnormal period maximum value to any parameter for any parameter in each of the normal period maximum values, and based on the margin value. One of the maximum values during the normal period is set as the threshold value. Time series data processing device.
- the combination of a plurality of parameters is selected from the normal period time-series data which is the time-series data of the period in which the measurement target is determined to be in the normal state.
- An extraction means that extracts the combination that maximizes the other parameters for a predetermined parameter as the maximum value during the normal period.
- Appendix 15 The program described in Appendix 14, In addition to the information processing device, A calculation means, in which any one of the maximum values during the normal period is used as a threshold value for determining that the measurement target is in an abnormal state in time-series data including a plurality of parameters. A program to realize.
- the combination of a plurality of parameters is selected from the normal period time-series data which is the time-series data of the period in which the measurement target is determined to be in the normal state.
- An extraction means that extracts the combination that maximizes the values of other parameters with respect to the value of a predetermined parameter as the maximum value during the normal period. Time series data processing system equipped with.
- Appendix 17 The time-series data processing system according to Appendix 16.
- a calculation means is provided for setting any one of the maximum values during the normal period as a threshold value for determining that the measurement target is in an abnormal state in time series data including a plurality of parameters. Time series data processing system.
- the time-series data processing system described in Appendix 17 The time-series data processing system described in Appendix 17,
- the extraction means refers to the other of the combination of a plurality of parameters with respect to the predetermined parameter from the abnormal period time series data which is the time series data of the period during which the measurement target is determined to be in the abnormal state among the time series data. Extract the combination with the maximum parameter as the maximum value during the abnormal period,
- the calculation means sets any one of the normal period maximum values as the threshold value based on the normal period maximum value and the abnormal period maximum value. Time series data processing system.
- the time-series data processing system described in Appendix 18, calculates a margin value which is a value based on the ratio of the abnormal period maximum value to any parameter for any parameter in each of the normal period maximum values, and based on the margin value. One of the maximum values during the normal period is set as the threshold value. Time series data processing system.
- Non-temporary computer-readable media include various types of tangible storage media.
- Examples of non-temporary computer-readable media include magnetic recording media (eg, flexible disks, magnetic tapes, hard disk drives), magneto-optical recording media (eg, magneto-optical disks), CD-ROMs (Read Only Memory), CD-Rs, Includes CD-R / W, semiconductor memory (for example, mask ROM, PROM (Programmable ROM), EPROM (Erasable PROM), flash ROM, RAM (RandomAccessMemory)).
- the program may also be supplied to the computer by various types of temporary computer readable media. Examples of temporary computer-readable media include electrical, optical, and electromagnetic waves.
- the temporary computer-readable medium can supply the program to the computer via a wired communication path such as an electric wire and an optical fiber, or a wireless communication path.
- the present invention is not limited to the above-described embodiment.
- Various changes that can be understood by those skilled in the art can be made to the structure and details of the present invention within the scope of the present invention.
- at least one or more of the functions of the acquisition means, the extraction means, the calculation means, the measurement data storage means, and the threshold storage means described above are executed by an information processing device installed and connected to any place on the network. That is, it may be executed by so-called cloud computing.
- Time-series data processing device 11 Acquisition means 11a Abnormality calculation means 11b Generation means 12 Extraction means 13 Calculation means 14 Monitoring means 14a Analysis means 14b Judgment means 14c Output means 15 Measurement data storage means 16 Threshold storage means 100 Time-series data processing device 101 CPU 102 ROM 103 RAM 104 Program group 105 Storage device 106 Drive device 107 Communication interface 108 Input / output interface 109 Bus 110 Storage medium 111 Communication network 121 Extraction means
Landscapes
- Engineering & Computer Science (AREA)
- Physics & Mathematics (AREA)
- General Physics & Mathematics (AREA)
- Theoretical Computer Science (AREA)
- Automation & Control Theory (AREA)
- Quality & Reliability (AREA)
- General Engineering & Computer Science (AREA)
- Testing And Monitoring For Control Systems (AREA)
- Debugging And Monitoring (AREA)
Priority Applications (3)
| Application Number | Priority Date | Filing Date | Title |
|---|---|---|---|
| JP2021552071A JP7315017B2 (ja) | 2019-10-18 | 2019-10-18 | 時系列データ処理方法 |
| US17/764,639 US11885720B2 (en) | 2019-10-18 | 2019-10-18 | Time series data processing method |
| PCT/JP2019/041013 WO2021075039A1 (ja) | 2019-10-18 | 2019-10-18 | 時系列データ処理方法 |
Applications Claiming Priority (1)
| Application Number | Priority Date | Filing Date | Title |
|---|---|---|---|
| PCT/JP2019/041013 WO2021075039A1 (ja) | 2019-10-18 | 2019-10-18 | 時系列データ処理方法 |
Publications (1)
| Publication Number | Publication Date |
|---|---|
| WO2021075039A1 true WO2021075039A1 (ja) | 2021-04-22 |
Family
ID=75537359
Family Applications (1)
| Application Number | Title | Priority Date | Filing Date |
|---|---|---|---|
| PCT/JP2019/041013 Ceased WO2021075039A1 (ja) | 2019-10-18 | 2019-10-18 | 時系列データ処理方法 |
Country Status (3)
| Country | Link |
|---|---|
| US (1) | US11885720B2 (https=) |
| JP (1) | JP7315017B2 (https=) |
| WO (1) | WO2021075039A1 (https=) |
Families Citing this family (2)
| Publication number | Priority date | Publication date | Assignee | Title |
|---|---|---|---|---|
| JP7287481B2 (ja) * | 2019-10-16 | 2023-06-06 | 日本電信電話株式会社 | 閾値取得装置、その方法、およびプログラム |
| US20230280736A1 (en) * | 2022-03-02 | 2023-09-07 | Applied Materials, Inc. | Comprehensive analysis module for determining processing equipment performance |
Citations (3)
| Publication number | Priority date | Publication date | Assignee | Title |
|---|---|---|---|---|
| JP2008059270A (ja) * | 2006-08-31 | 2008-03-13 | Toshiba Corp | プロセス異常診断装置及びプロセス監視システム |
| WO2011036809A1 (ja) * | 2009-09-28 | 2011-03-31 | 株式会社 東芝 | 異常判定システムおよびその方法 |
| JP2014228887A (ja) * | 2013-05-17 | 2014-12-08 | 株式会社東芝 | 稼働データ分析装置およびその方法、ならびにプログラム |
Family Cites Families (1)
| Publication number | Priority date | Publication date | Assignee | Title |
|---|---|---|---|---|
| JP6564799B2 (ja) | 2017-03-03 | 2019-08-21 | 日本電信電話株式会社 | 閾値決定装置、閾値決定方法及びプログラム |
-
2019
- 2019-10-18 WO PCT/JP2019/041013 patent/WO2021075039A1/ja not_active Ceased
- 2019-10-18 US US17/764,639 patent/US11885720B2/en active Active
- 2019-10-18 JP JP2021552071A patent/JP7315017B2/ja active Active
Patent Citations (3)
| Publication number | Priority date | Publication date | Assignee | Title |
|---|---|---|---|---|
| JP2008059270A (ja) * | 2006-08-31 | 2008-03-13 | Toshiba Corp | プロセス異常診断装置及びプロセス監視システム |
| WO2011036809A1 (ja) * | 2009-09-28 | 2011-03-31 | 株式会社 東芝 | 異常判定システムおよびその方法 |
| JP2014228887A (ja) * | 2013-05-17 | 2014-12-08 | 株式会社東芝 | 稼働データ分析装置およびその方法、ならびにプログラム |
Also Published As
| Publication number | Publication date |
|---|---|
| JPWO2021075039A1 (https=) | 2021-04-22 |
| US11885720B2 (en) | 2024-01-30 |
| US20220334030A1 (en) | 2022-10-20 |
| JP7315017B2 (ja) | 2023-07-26 |
Similar Documents
| Publication | Publication Date | Title |
|---|---|---|
| JP6777069B2 (ja) | 情報処理装置、情報処理方法、及び、プログラム | |
| CN118211837B (zh) | 一种智能电表的性能评估方法及装置 | |
| US11152126B2 (en) | Abnormality diagnosis system and abnormality diagnosis method | |
| KR20190006032A (ko) | 이상 데이터의 중요도 판정 장치 및 이상 데이터의 중요도 판정 방법 | |
| JP6708203B2 (ja) | 情報処理装置、情報処理方法、及び、プログラム | |
| JP7239022B2 (ja) | 時系列データ処理方法 | |
| US20140325276A1 (en) | Apparatus, method and storage medium for fault cause extraction utilizing performance values | |
| JP6370132B2 (ja) | 通信異常検出装置、通信異常検出方法及びプログラム | |
| WO2018216197A1 (ja) | 異常重要度算出システム、異常重要度算出装置、及び異常重要度算出プログラム | |
| KR102006436B1 (ko) | 거짓 경보 결정 방법 | |
| EP3187950B1 (en) | A method for managing alarms in a control system | |
| US11099219B2 (en) | Estimating the remaining useful life of a power transformer based on real-time sensor data and periodic dissolved gas analyses | |
| CN116034326A (zh) | 用于异常检测的监测设备和方法 | |
| WO2020245980A1 (ja) | 時系列データ処理方法 | |
| WO2021075039A1 (ja) | 時系列データ処理方法 | |
| JP7273251B2 (ja) | 分布図を通じた機器の予知保全方法 | |
| JP7111173B2 (ja) | 情報処理装置 | |
| US11467214B2 (en) | Anomaly detection system and method for electric drives | |
| JP7264231B2 (ja) | 監視方法、監視装置、プログラム | |
| WO2020166011A1 (ja) | 時系列データ処理方法 | |
| EP4617683A1 (en) | Motor diagnostics systems and methods | |
| KR102897401B1 (ko) | 태양광 설비용 아크 예측 및 제어 시스템 및 방법 | |
| KR20240031891A (ko) | 입력 전류에 대한 rms 측정 값을 이용하여 유도전동기의 고장을 진단하는 방법 및 시스템 | |
| KR20240171641A (ko) | 펌프 이상 자동 감지를 통한 예지 보전 방법 | |
| Folmer et al. | Model-based approach to generate training sequences for discrete event anomaly detection in manufacturing |
Legal Events
| Date | Code | Title | Description |
|---|---|---|---|
| 121 | Ep: the epo has been informed by wipo that ep was designated in this application |
Ref document number: 19949268 Country of ref document: EP Kind code of ref document: A1 |
|
| ENP | Entry into the national phase |
Ref document number: 2021552071 Country of ref document: JP Kind code of ref document: A |
|
| NENP | Non-entry into the national phase |
Ref country code: DE |
|
| 122 | Ep: pct application non-entry in european phase |
Ref document number: 19949268 Country of ref document: EP Kind code of ref document: A1 |