WO2021075039A1 - Time-series data processing method - Google Patents
Time-series data processing method Download PDFInfo
- Publication number
- WO2021075039A1 WO2021075039A1 PCT/JP2019/041013 JP2019041013W WO2021075039A1 WO 2021075039 A1 WO2021075039 A1 WO 2021075039A1 JP 2019041013 W JP2019041013 W JP 2019041013W WO 2021075039 A1 WO2021075039 A1 WO 2021075039A1
- Authority
- WO
- WIPO (PCT)
- Prior art keywords
- series data
- time
- value
- period
- data processing
- Prior art date
Links
Images


Classifications
-
- G—PHYSICS
- G01—MEASURING; TESTING
- G01M—TESTING STATIC OR DYNAMIC BALANCE OF MACHINES OR STRUCTURES; TESTING OF STRUCTURES OR APPARATUS, NOT OTHERWISE PROVIDED FOR
- G01M99/00—Subject matter not provided for in other groups of this subclass
- G01M99/005—Testing of complete machines, e.g. washing-machines or mobile phones
-
- G—PHYSICS
- G05—CONTROLLING; REGULATING
- G05B—CONTROL OR REGULATING SYSTEMS IN GENERAL; FUNCTIONAL ELEMENTS OF SUCH SYSTEMS; MONITORING OR TESTING ARRANGEMENTS FOR SUCH SYSTEMS OR ELEMENTS
- G05B23/00—Testing or monitoring of control systems or parts thereof
- G05B23/02—Electric testing or monitoring
- G05B23/0205—Electric testing or monitoring by means of a monitoring system capable of detecting and responding to faults
- G05B23/0218—Electric testing or monitoring by means of a monitoring system capable of detecting and responding to faults characterised by the fault detection method dealing with either existing or incipient faults
- G05B23/0221—Preprocessing measurements, e.g. data collection rate adjustment; Standardization of measurements; Time series or signal analysis, e.g. frequency analysis or wavelets; Trustworthiness of measurements; Indexes therefor; Measurements using easily measured parameters to estimate parameters difficult to measure; Virtual sensor creation; De-noising; Sensor fusion; Unconventional preprocessing inherently present in specific fault detection methods like PCA-based methods
-
- G—PHYSICS
- G06—COMPUTING; CALCULATING OR COUNTING
- G06F—ELECTRIC DIGITAL DATA PROCESSING
- G06F11/00—Error detection; Error correction; Monitoring
- G06F11/07—Responding to the occurrence of a fault, e.g. fault tolerance
Definitions
- the present invention relates to a time series data processing method, a time series data processing device, and a program.
- time-series data which is the measured value from various sensors, is analyzed, and the occurrence of an abnormal state is detected and output.
- time-series data such as CPU usage is collected from a network configured by connecting a plurality of nodes such as routers and server devices as a monitoring target, and calculated from the time-series data.
- the threshold value for comparing the degree of abnormality calculated from the time series data is set in advance, or a new threshold value is calculated from the total result of the presence / absence of past abnormality and the presence / absence of detection. May be set.
- the number of false positives and the number of misses are calculated from the aggregated result, and the larger the number of false positives, the larger the increase in the threshold value, and the larger the number of missed detections, the smaller the decrease in the threshold value. Is calculated.
- false detections and oversights of abnormal conditions do not always occur frequently from time-series data. Therefore, there is a problem that it is difficult to set an appropriate threshold value.
- a threshold value for detecting the occurrence of an abnormal state from the abnormality degree calculated from the time series data to be monitored a combination of two threshold values such as "abnormality degree" and "duration" can be considered.
- time-series data such as an abnormality graph D2 calculated based on a predetermined analysis parameter A from a time-series data set D1 of a plurality of measured values as shown in FIG.
- the normal period in which the monitoring target is actually in the normal state and the abnormal period in which the monitoring target is in the abnormal state are set for the abnormality degree graph D2.
- the abnormality period of the abnormality degree graph D2 as shown in FIG.
- the threshold value should be set as low as possible, but false detection also occurs.
- the threshold value is set to the upper limit of the abnormal value so that false detection does not occur, the abnormal state may not be detected.
- an object of the present invention is time-series data that can solve the above-mentioned problem that it is difficult to set an appropriate threshold value when an abnormal state is detected based on time-series data.
- the purpose is to provide a processing method.
- the time series data processing method which is one embodiment of the present invention, is Of the time-series data including a plurality of parameters based on the data measured from the measurement target, the combination of a plurality of parameters is selected from the normal period time-series data which is the time-series data of the period in which the measurement target is determined to be in the normal state. Of these, the combination that maximizes the value of the other parameter with respect to the value of the predetermined parameter is extracted as the maximum value during the normal period. It takes the configuration.
- the time series data processing device which is one embodiment of the present invention, is Of the time-series data including a plurality of parameters based on the data measured from the measurement target, the combination of a plurality of parameters is selected from the normal period time-series data which is the time-series data of the period in which the measurement target is determined to be in the normal state.
- An extraction means that extracts the combination that maximizes the values of other parameters with respect to the value of a predetermined parameter as the maximum value during the normal period. With, It takes the configuration.
- the program which is one form of the present invention is For information processing equipment Of the time-series data including a plurality of parameters based on the data measured from the measurement target, the combination of a plurality of parameters is selected from the normal period time-series data which is the time-series data of the period in which the measurement target is determined to be in the normal state.
- An extraction means that extracts the combination that maximizes the values of other parameters with respect to the value of a predetermined parameter as the maximum value during the normal period. To realize, It takes the configuration.
- the present invention is configured as described above, and an appropriate threshold value can be set when an abnormal state is detected based on time series data.
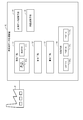
- FIG. 4 is a diagram for explaining the configuration of the time series data processing device
- FIGS. 5 to 15 are diagrams for explaining the processing operation of the time series data processing device.
- the time-series data processing device 10 in the present invention is connected to a measurement target P such as a plant. Then, the time-series data processing device 10 acquires and analyzes the measured values of at least one or more data items of the measurement target P, and monitors the state of the measurement target P based on the analysis result.
- the measurement target P is a plant such as a manufacturing factory or a processing facility
- the measurement values of each data item include a plurality of types such as temperature, pressure, flow rate, power consumption value, raw material supply amount, and remaining amount in the plant. Consists of the values of the data items of.
- the state of the measurement target P to be monitored is an abnormal state of the measurement target P in the present embodiment, and is in an abnormal state from the degree of abnormality calculated from the measured values of each data item based on a predetermined analysis parameter. It detects that there is something and outputs notification information notifying that it is in such an abnormal state.
- the administrator or the terminal device used by the administrator may be output notification information notifying that the measurement target P is in the normal state.
- the time-series data processing device 10 in the present invention extracts a threshold value candidate for detecting an abnormal state from the degree of abnormality, and selects and sets a threshold value from the candidates. ..
- the measurement target P in the present invention is not limited to a plant, and may be any equipment such as an information processing system.
- the CPU Central Processing Unit
- memory usage rate e.g., RAM
- disk access frequency e.g., ROM
- input / output of each information processing device such as a terminal or server constituting the information processing system.
- the number of packets, the input / output packet rate, the power consumption value, and the like may be measured as measured values of each data item, and the measured values may be analyzed to monitor the state of the information processing system.
- the time-series data processing device 10 is composed of one or a plurality of information processing devices including an arithmetic unit and a storage device. Then, as shown in FIG. 4, the time-series data processing device 10 includes an acquisition means 11, an extraction means 12, a calculation means 13, and a monitoring means 14. The functions of the acquisition means 11, the extraction means 12, the calculation means 13, and the monitoring means 14 can be realized by the arithmetic unit executing a program for realizing each function stored in the storage device. .. Further, the time-series data processing device 10 includes measurement data storage means 15 and threshold storage means 16. The measurement data storage means 15 and the threshold value storage means 16 are composed of a storage device. Hereinafter, each configuration will be described in detail.
- the acquisition means 11 acquires the measured values of each data item measured by various sensors installed in the measurement target P as time-series data at predetermined time intervals and stores them in the measurement data storage means 15. At this time, since there are a plurality of types of data items to be measured, the acquisition means 11 acquires a time-series data set which is a set of time-series data of a plurality of data items as shown by reference numeral D1 in FIG.
- the time-series data set is constantly acquired and stored by the acquisition means 11, and the acquired time-series data set is a threshold value used for detecting an abnormal state of the measurement target P, as will be described later. Is used when setting and when monitoring the state of the measurement target P, respectively.
- the acquisition means 11 includes an abnormality degree calculation means 11a and a generation means 11b.
- the abnormality degree calculation means 11a calculates the degree of abnormality indicating the degree to which the state of the measurement target P is an abnormal state from the time series data set acquired from the measurement target P.
- the generation means 11b generates an abnormality degree graph which is time-series data of the value of the abnormality degree, and stores it in the measurement data storage means 15.
- the degree of abnormality is a value obtained by analyzing the measured value of each data item at each time in the above-mentioned time series data set based on the analysis parameters, and the higher the value, the higher the value. The longer the duration of, the higher the degree of determination of an abnormal state.
- the degree of anomaly is obtained by inputting one data item value and outputting the predicted value of the other data item for a prediction model relating to the values of two predetermined types of data items, and using the predicted value and the actual measured value. It is calculated according to the magnitude of the difference and the number of correlation failures. In this case, for example, the greater the degree of correlation failure, the higher the degree of the measurement target P being in the abnormal state, and the higher the value of the degree of abnormality is calculated.
- the method of calculating the degree of abnormality by the degree of abnormality calculation means 11a is not limited to the above-mentioned method, and any method may be used.
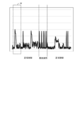
- FIG. 5 shows an example of the abnormality degree graph generated by the generation means 11b.
- the vertical axis of the abnormality graph is the degree of abnormality
- the horizontal axis is the time.
- the abnormality degree graph is time-series data in which the abnormality degree value changes with the passage of time, and is a "abnormality degree value" (other parameters) and a “duration” (duration period) in which the abnormality degree value continues. It is configured to include a plurality of parameters (variables) such as a predetermined parameter).
- the abnormality graph generated by the generation means 11b may include the state of the measurement target P. Specifically, the generation means 11b generates an abnormality graph including which period is the normal period and which period is the abnormal period among the measurement target periods. At this time, the generation means 11b indicates, for example, the state of the measurement target P determined at the past time that has already passed, that is, the normal period that is the normal state and the abnormal period that is the abnormal state in the abnormality degree graph. By setting in association with the time, an abnormality degree graph including the state of the measurement target P is generated.
- an example of an abnormality degree graph including a state is shown in FIG. In the example of this figure, the state is set to change with the passage of time in the order of normal period, abnormal period, and normal period, but different abnormal periods may be set in that case. , As will be described later, different abnormal periods will be distinguished from each other.
- the extraction means 12 is a limit at which the measurement target P is determined to be in the normal state by using the abnormality degree graph of the normal period in which the measurement target P set as described above is determined to be in the normal state.
- the threshold candidate is a value that is determined to be in an abnormal state when both the "abnormality” and the “duration” exceed the values.
- the threshold value that is a combination of the "abnormality value” and the “duration” is referred to as a "minimum covering value" (hereinafter, also referred to as a "normal period maximum value”).
- a method for extracting the minimum coating value will be described with reference to FIGS. 6 to 9.
- the extraction means 12 targets all the normal periods in the abnormality degree graph for the extraction processing of the minimum coverage value.
- the extraction process of the minimum coating value is performed only for the normal period on the left side, but in reality, all the normal periods are targeted.
- the extraction means 12 sets the “maximum value of the duration”. For example, as the "maximum value of the duration", a period such as the shortest abnormal period, the maximum normal period, and one day is set.
- the extraction means 12 sets a window W having a duration smaller than the above-mentioned "maximum value of the duration” on the abnormality degree graph, and obtains the maximum value of the abnormality degree value in the window W.
- the extraction means 12 first sets the window W whose duration is the minimum value “1”, and displays the window W in the abnormality degree graph as shown by the arrow in FIG. Slide up to find the maximum anomaly.
- the maximum value of the degree of abnormality becomes "10" as shown in FIG. Therefore, [1,10] is first extracted as the minimum coating value, which is a combination of “duration, degree of abnormality”.
- the extraction means 12 sets a window W in which the duration is increased by “+1” to be “2”, and the window W is slid on the abnormality degree graph to obtain the degree of abnormality. Find the maximum value of. That is, the extraction means 12 obtains the maximum value of the degree of abnormality in which the period of "2" continues. Then, in the case of the duration "2", the maximum value of the degree of abnormality becomes "10" as shown in FIG. Therefore, [2,10] is extracted as the minimum coating value which is a combination of “duration, degree of abnormality”.
- the extraction means 12 sets a window W in which the duration is further increased by “+1” to be “3”, and the window W is slid on the abnormality degree graph. Find the maximum value of the degree of anomaly. That is, the extraction means 12 obtains the maximum value of the degree of abnormality in which the period of "3" continues. Then, in the case of the duration "3", the maximum value of the degree of abnormality becomes "9” as shown in FIG. Therefore, [3, 9] is extracted as the minimum coating value, which is a combination of “duration, degree of abnormality”.
- the extraction means 12 repeats the extraction of the minimum coating value in the window W in which the duration is increased by "+1" as described above, and the duration becomes the "maximum value of the duration" set as described above. Do up to.
- the minimum coverage value in the normal period is [1,10], [3,9], [4,3], [7,1], [9,0].
- Candidates for a plurality of threshold values such as are extracted.
- the extraction means 12 reaches a limit at which the measurement target P can be determined to be in the abnormal state by using the abnormality degree graph of the abnormal period in which the measurement target P set as described above is determined to be in the abnormal state.
- the threshold value that is a combination of the "abnormality degree value” and the “duration” is referred to as the “maximum covering value” (hereinafter, also referred to as the "abnormal period maximum value”).
- the maximum covering value hereinafter, also referred to as the "abnormal period maximum value”.
- the extraction means 12 targets each abnormality period in the abnormality degree graph for extraction processing. That is, the extraction means 12 extracts the maximum coverage value for each abnormal period.
- the maximum covering value is extracted only for one abnormal period, but when there are a plurality of abnormal periods, the maximum covering is distinguished for each abnormal period. Extract the value.
- the extraction means 12 sets the window W of the duration of the "maximum value of the duration” set as described above on the abnormality degree graph, and obtains the maximum value of the abnormality degree value in the window W.
- the extraction means 12 first sets a window W having a duration of “10”, which is an abnormal period, and slides the window W on the abnormality degree graph to maximize the degree of abnormality. Find the value.
- the maximum value of the degree of abnormality becomes "2" as shown in FIG. Therefore, [10, 2] is first extracted as the maximum coverage value which is a combination of “duration, degree of abnormality”.
- the extraction means 12 reduces the duration by "-1" to set the window W, slides the window W on the abnormality degree graph, and repeats to obtain the maximum value of the abnormality degree.
- FIG. 11A is an example in which a window W having a duration of “3” is set and the window W is slid on the abnormality degree graph to obtain the maximum value of the abnormality degree. Then, in the case of the duration "3", the maximum value of the degree of abnormality becomes "15" as shown in FIG. 11A. Therefore, [3,15] is extracted as the maximum coverage value which is a combination of “duration, degree of abnormality”. Similarly, [1,25] is extracted as the maximum coverage value.
- the extraction means 12 extracts the maximum covering value in the same manner as described above for the abnormal period. For example, although not shown, when there is another abnormal period “abnormal period 2” on the anomaly degree graph, as shown in FIG. 12, the maximum coverage value [1,40] in such “abnormal period 2”. Will be extracted.
- the calculation means 13 determines which of the threshold candidates, which is the minimum coverage value extracted for the normal period as described above, is set as the threshold. At this time, the calculation means 13 calculates a margin value indicating the degree of margin for each maximum coating value extracted for each abnormal period for each minimum coating value, and determines a threshold value based on the margin value.
- a margin value indicating the degree of margin for each maximum coating value extracted for each abnormal period for each minimum coating value
- the calculation means 13 selects one of all the minimum coating values. Then, for each abnormal period, a margin value for each of all the maximum covering values is calculated for the selected minimum covering value.
- the margin value is the one of the "duration” and the "abnormality" that has no margin by comparing the "duration” and the "abnormality", which are the parameters constituting the minimum coating value and the maximum coating value. Is selected, and the ratio is calculated as a margin value.
- the margin is set from the value of the parameter that constitutes the minimum coating value itself, or the margin of the value of the parameter that constitutes the minimum coating value with respect to the maximum coating value, according to a preset standard.
- the degree is calculated, and it is determined that the larger the value of the margin degree, the less the margin.
- this minimum coating value [1,10] (w0) and the abnormality period 1 are considered.
- the margin values for each of the maximum covering values [1,25] (w1), [3,15] (w2), and [10,2] (w3) are calculated (see FIG. 11B).
- the "duration" of the minimum covering value [1,10] is "1"
- the margin value is defined as infinite, and the margin value is "0". ". Therefore, it is determined that there is no margin in the "abnormality” with respect to the "duration”, and the ratio of the "abnormality” is calculated as a margin value.
- the minimum covering value [1,10] (w0) and the maximum covering values [1,25] (w1), [3,15] (w2), [10,2] (w3) of the abnormal period 1 are obtained.
- the calculation means 12 sets the lowest value, that is, the value having the most margin among the calculated margin values, as the margin value for the abnormal period targeted by the selected minimum covering value.
- the margin value of the minimum coating value [1,10] (w0) with respect to the abnormal period 1 is “0.4” (see FIG. 11B).
- the calculation means 13 determines the maximum value among the margin values calculated for each abnormal period as the margin value of the minimum coating value for the selected minimum coating value. That is, for the minimum covering value [1,10], the maximum value "0" of the margin value "0.4” calculated for the abnormal period 1 and the margin value "0.25" calculated for the abnormal period 2 .4 ”is the margin value.
- the calculation means 13 selects the next minimum coating value, and calculates a margin value for each of all the maximum coating values for the selected minimum coating value for each abnormal period as described above.
- the minimum covering value [3,9] and the maximum covering values [1,25] and [3,15] of the abnormal period 1 are taken into consideration.
- [10, 2] Calculate the margin value with each.
- the calculation means 12 sets the lowest value, that is, the value having the most margin among the calculated margin values, as the margin value for the abnormal period targeted by the selected minimum covering value.
- the margin value for the abnormal period 1 of the minimum covering value [3, 9] is "1".
- the calculation means 13 further determines, among all the minimum coating values, the one having the minimum margin value as the threshold value.
- the margin value "0.4" is the minimum value
- the minimum coating value [1,10] is used as the threshold value.
- the processing by the acquisition means 11, the extraction means 12, and the calculation means 13 described above is performed on another abnormality graph generated from the time series data set acquired from the measurement target P based on the analysis parameters different from the above. It may be done against. Then, a candidate for the minimum coverage value may be extracted from another abnormality graph generated based on different analysis parameters in the same manner as described above, and the threshold value may be determined from the candidates. In addition to this, the calculation means 13 determines the smallest value among the threshold values determined for each abnormality degree graph generated based on each analysis parameter as the final threshold value, and generates the abnormality degree graph. The analysis parameter of may be determined as the optimum parameter.
- the monitoring means 14 analyzes and monitors whether or not an abnormal state has occurred in the measurement target P from the time series data set measured from the measurement target P using the threshold value determined as described above.
- the monitoring means 14 includes an analysis means 14a, a determination means 14b, and an output means 14c.
- the analysis means 14a calculates the degree of abnormality from the time-series data set measured from the measurement target P, and both the value of the degree of abnormality and the period during which the value of the degree of abnormality continues set a threshold value. Check if it exceeds.
- the determination means 14b determines that the measurement target P is in an abnormal state when the calculated values of the degree of abnormality and the duration exceed the threshold value.
- the output means 14c When the output means 14c determines that the measurement target P is in an abnormal state, the output means 14c outputs to that effect. For example, the output means 14c transmits notification information indicating that an abnormality has occurred to the registered e-mail address of the observer, or a monitoring terminal operated by the observer connected to the time-series data processing device 10. Output to display the notification information on the display screen of.
- the time-series data processing device 10 acquires the measured values of each data item measured by various sensors installed in the measurement target P as a time-series data set at predetermined time intervals, and stores them in the measurement data storage means 15. (Step S1). Then, the time-series data processing device 10 calculates the degree of abnormality at each time from the acquired time-series data set, and generates an abnormality degree graph which is time-series data (step S2). At this time, the time-series data processing device 10 generates an abnormality degree graph in which the normal period and the abnormal period are set (step S3).
- the time-series data processing device 10 extracts the minimum coverage value as a threshold candidate from the normal period of the abnormality degree graph (step S4).
- the time-series data processing device 10 slides the window W of each duration on the abnormality degree graph to specify the maximum value of the abnormality degree in each continuation period. Extract the minimum coverage value consisting of the parameters of [duration, degree of anomaly].
- the time-series data processing device 10 extracts only the combination of the "duration and the degree of abnormality" having the same degree of abnormality as the minimum coverage value having the smallest "duration". As a result, for example, as shown in FIG. 12, a plurality of minimum coating values are extracted.
- the time series data processing device 10 extracts the maximum coverage value from the abnormal period of the abnormality degree graph (step S5).
- the time-series data processing device 10 slides the window W of each duration on the abnormality degree graph to specify the maximum value of the abnormality degree in each continuation period. Extract the maximum coverage value consisting of the parameters of [duration, degree of abnormality].
- a plurality of maximum covering values are extracted.
- the time-series data processing device 10 extracts the maximum coverage value for each abnormal state in the abnormality degree graph.
- the time-series data processing device 10 determines which of the threshold candidates, which are all the minimum covering values extracted from the normal period, is set as the threshold. Therefore, the time-series data processing device 10 calculates a margin value indicating the degree of margin for each maximum coating value extracted for each abnormal period for each minimum coating value (step S6). Then, the time-series data processing device 10 sets the lowest value, that is, the value having the most margin among the calculated margin values, as the margin value for the abnormal period targeted by the selected minimum covering value. In this way, the time-series data processing device 10 calculates the margin value for each abnormal period of each minimum covering value as shown in FIGS. 11B and 13. Further, as shown in the rightmost column of FIG. 13, the time series data processing device 10 calculates the maximum value among the margin values for all the abnormal periods as the final margin value for each minimum coating value.
- the time-series data processing device 10 determines the minimum covering value, which is the minimum value, as the threshold value among the final margin values calculated for all the minimum covering values (step S7).
- the time-series data processing device 10 newly acquires the time-series data set measured from the measurement target P (step S11), and calculates the degree of abnormality at each time (step S12).
- the time-series data processing device 10 examines whether or not both the calculated abnormality degree and the duration thereof exceed the threshold value determined as described above (step S13). Then, when the calculated values of the degree of abnormality and the duration exceed the threshold value (Yes in step S13), the time-series data processing device 10 determines that the measurement target P is in an abnormal state (step S14). Further, the time-series data processing device 10 outputs that an abnormal state has occurred (step S15).
- the threshold candidates of the parameters that can be determined to be the abnormal state are extracted from the normal period in which the measurement target P is in the normal state. doing. Therefore, even when an abnormal state rarely occurs in the measurement target P, a candidate for an appropriate threshold value can be extracted from the data in the normal period, and an appropriate threshold value can be determined from the candidates. ..
- the maximum value of the parameter that can be determined to be in the abnormal state is extracted from the abnormal period in which the measurement target P is in the abnormal state in the abnormality degree graph, and the threshold value is determined from the threshold candidates by using such a value. doing. By considering the value of the abnormal state in this way, a more appropriate threshold value can be determined.
- FIG. 16 is a diagram for explaining the processing operation of the time series data processing apparatus according to the second embodiment.
- the time-series data processing apparatus in this embodiment has the same configuration as that shown in FIG. 4 described in the above-described first embodiment.
- the method of determining the threshold value from the minimum coating value extracted as a candidate for the threshold value is different between the present embodiment and the first embodiment.
- the calculation means 13 of the present embodiment as shown in FIG. 16, first, all the maximum covering values are arranged on the graph, and they are connected by a straight line. Then, the distance T from each minimum covering value with respect to the straight line connecting the maximum covering values is calculated, and the minimum covering value having the largest such distance T is determined as a threshold value.
- the method of determining the threshold value from the above-mentioned minimum coating value is an example, and in the present invention, one threshold value may be determined from a plurality of minimum coating values by any method. Further, in the above, the threshold value is determined by calculating the margin value of the minimum coating value using the maximum coating value, but the maximum coating value is not always used. That is, in the present invention, one threshold value may be determined by an arbitrary method from the minimum coating value by extracting only the minimum coating value without extracting the maximum coating value. As an example, the calculation means 13 may set priorities for a plurality of parameters constituting the minimum covering value, and determine the minimum covering value at which the parameter having the highest priority is the maximum value as a threshold value. Good.
- the calculation means 13 assigns a weight corresponding to the priority set for each parameter to the value of the parameter, and determines the minimum covering value at which the value is the maximum as the threshold value. May be good. If only one minimum coating value can be extracted, that one may be used as a threshold value.
- FIG. 17 is a diagram for explaining the processing operation of the time series data processing apparatus according to the third embodiment.
- the time-series data processing apparatus in this embodiment has the same configuration as that shown in FIG. 4 described in the above-described first embodiment.
- the parameters to be focused on when detecting the abnormal state from the abnormality degree graph which is the time series data are different from those in the first and second embodiments.
- FIG. 17 based on the combination of "abnormality" (predetermined parameter) and "number of increases in abnormality per unit time” (other parameters) in the abnormality graph. , It is decided to detect an abnormal state.
- the extraction means 12 sets the combination of the “abnormality” and the “number of increases in the abnormality per unit time” as the minimum covering value (maximum value in the normal period) in the normal period of the abnormality graph. Extract as. For example, as shown in FIG. 17, a window W per unit time is set on the abnormality degree graph and slid, and the value of the “abnormality degree” in the window W and the “number of rises” up to the value of the abnormality degree. And are extracted as the minimum coating value. At this time, the combination of the maximum values of the "number of rises" is extracted as the minimum coating value for each "abnormality degree". Similarly, in the abnormal period of the abnormality degree graph, the combination of the “abnormality degree” and the “number of increases in the abnormality degree per unit time” is extracted as the maximum covering value (abnormality period maximum value).
- the minimum coating value as a threshold value may be determined by calculating the margin degree (margin of the degree of abnormality, the margin of the number of increases) for each maximum coating value of each minimum coating value, and it is determined by any method. May be good. Thereby, it is possible to set the threshold value by the combination of the threshold value of the "abnormality degree" and the threshold value of the "number of times the abnormality degree increases per unit time".
- the parameter to be focused on when detecting the abnormal state from the abnormality degree graph which is time series data may be any parameter.
- the combination of parameters extracted as the minimum coating value and the maximum coating value may be any parameter.
- the cumulative value of the degree of abnormality per unit time in the degree of abnormality graph and the number of times the cumulative value exceeds the set threshold value may be used.
- the rate of change of the degree of abnormality per unit time and the number of times the rate of change exceeds the set threshold value may be used.
- the abnormality degree graph is used as the time series data, but the time series data is not necessarily limited to the abnormality degree graph, and may be time series data including any parameter.
- the measured value itself of a predetermined data item measured from the measurement target P is treated as time-series data, and the minimum covering value is extracted from the time-series data in the same manner as described above to set the threshold value for abnormality determination. You may.
- FIGS. 18 to 20 are block diagrams showing the configuration of the time-series data processing device according to the fourth embodiment
- FIG. 20 is a flowchart showing the operation of the time-series data processing device.
- the outline of the configuration of the time-series data processing apparatus and the time-series data processing method described in each of the above-described embodiments is shown.
- the time-series data processing device 100 is composed of a general information processing device, and is equipped with the following hardware configuration as an example.
- -CPU Central Processing Unit
- -ROM Read Only Memory
- RAM Random Access Memory
- 103 storage device
- -Program group 104 loaded into RAM 303
- a storage device 105 that stores the program group 304.
- a drive device 106 that reads and writes the storage medium 110 external to the information processing device.
- -Communication interface 107 that connects to the communication network 111 outside the information processing device -I / O interface 108 for inputting / outputting data -Bus 109 connecting each component
- the time-series data processing device 100 can construct and equip the extraction means 121 shown in FIG. 19 by the CPU 101 acquiring the program group 104 and executing the program group 104.
- the program group 104 is stored in, for example, a storage device 105 or a ROM 102 in advance, and the CPU 101 loads the program group 104 into the RAM 103 and executes the program group 104 as needed. Further, the program group 104 may be supplied to the CPU 101 via the communication network 111, or may be stored in the storage medium 110 in advance, and the drive device 106 may read the program and supply the program to the CPU 101.
- the extraction means 121 described above may be constructed by an electronic circuit.
- FIG. 18 shows an example of the hardware configuration of the information processing device which is the time series data processing device 100, and the hardware configuration of the information processing device is not limited to the above case.
- the information processing device may be composed of a part of the above-described configuration, such as not having the drive device 106.
- the time-series data processing device 100 executes the time-series data processing method shown in the flowchart of FIG. 20 by the function of the extraction means 121 constructed by the program as described above.
- the time series data processing device 100 is Of the time series data including multiple parameters based on the data measured from the measurement target, among the combination of multiple parameters from the normal period time series data which is the time series data of the period when the measurement target is determined to be in the normal state.
- the combination in which the values of the other parameters are maximized with respect to the values of the predetermined parameters is extracted as the maximum value in the normal period (step S1). Is executed.
- the present invention is configured as described above, and among the time series data including a plurality of parameters, the value at which a certain parameter is maximized is extracted as a threshold candidate from the data when the measurement target is in the normal state. doing. Therefore, threshold candidates can be extracted without using the data in the abnormal state of the measurement target, and an appropriate threshold can be determined.
- the combination of a plurality of parameters is selected from the normal period time-series data which is the time-series data of the period in which the measurement target is determined to be in the normal state.
- the combination that maximizes the value of the other parameter with respect to the value of the predetermined parameter is extracted as the maximum value during the normal period. Time series data processing method.
- Appendix 2 The time-series data processing method described in Appendix 1 From the normal period time series data, a combination of a plurality of parameters having the maximum value of the other parameter for each value of the predetermined parameter is extracted as the maximum value of the normal period. Time series data processing method.
- Appendix 3 The time-series data processing method described in Appendix 2, Among the maximum values of the normal period in which the values of the other parameters are the same, a combination of a plurality of parameters including a value in which the predetermined parameter is the minimum is excluded from the maximum value of the normal period. Time series data processing method.
- Appendix 6 The time-series data processing method described in Appendix 5. From the abnormal period time series data, a combination of a plurality of parameters having the maximum value of the other parameter for each value of the predetermined parameter is extracted as the abnormal period maximum value. Time series data processing method.
- Appendix 7 The time-series data processing method according to Appendix 5 or 6. From the abnormal period time series data for each abnormal state of the measurement target, the maximum value of the abnormal period for each abnormal state of the measurement target is extracted. Time series data processing method.
- Appendix 8 The time-series data processing method according to any one of Appendix 5 to 7. For any of the parameters in each of the maximum values of the normal period, a margin value which is a value based on the ratio of the maximum value of the abnormal period to any parameter is calculated. One of the maximum values during the normal period is set as the threshold value based on the margin value. Time series data processing method.
- Appendix 9 The time-series data processing method according to any one of Appendix 1 to 8.
- the other parameter is an abnormality degree which is a value indicating the degree to which the measurement target is in an abnormal state calculated from the measured data, and the predetermined parameter is a period during which the value of the abnormality degree continues.
- Time series data processing method is
- the combination of a plurality of parameters is selected from the normal period time-series data which is the time-series data of the period in which the measurement target is determined to be in the normal state.
- An extraction means that extracts the combination that maximizes the values of other parameters with respect to the value of a predetermined parameter as the maximum value during the normal period. Time series data processing device equipped with.
- Appendix 11 The time-series data processing apparatus according to Appendix 10.
- a calculation means is provided for setting any one of the maximum values during the normal period as a threshold value for determining that the measurement target is in an abnormal state in time series data including a plurality of parameters. Time series data processing device.
- the time-series data processing apparatus (Appendix 12) The time-series data processing apparatus according to Appendix 11, The extraction means refers to the other of the combination of a plurality of parameters with respect to the predetermined parameter from the abnormal period time series data which is the time series data of the period during which the measurement target is determined to be in the abnormal state among the time series data. Extract the combination with the maximum parameter as the maximum value during the abnormal period, The calculation means sets any one of the normal period maximum values as the threshold value based on the normal period maximum value and the abnormal period maximum value. Time series data processing device.
- the time-series data processing apparatus according to Appendix 12, The calculation means calculates a margin value which is a value based on the ratio of the abnormal period maximum value to any parameter for any parameter in each of the normal period maximum values, and based on the margin value. One of the maximum values during the normal period is set as the threshold value. Time series data processing device.
- the combination of a plurality of parameters is selected from the normal period time-series data which is the time-series data of the period in which the measurement target is determined to be in the normal state.
- An extraction means that extracts the combination that maximizes the other parameters for a predetermined parameter as the maximum value during the normal period.
- Appendix 15 The program described in Appendix 14, In addition to the information processing device, A calculation means, in which any one of the maximum values during the normal period is used as a threshold value for determining that the measurement target is in an abnormal state in time-series data including a plurality of parameters. A program to realize.
- the combination of a plurality of parameters is selected from the normal period time-series data which is the time-series data of the period in which the measurement target is determined to be in the normal state.
- An extraction means that extracts the combination that maximizes the values of other parameters with respect to the value of a predetermined parameter as the maximum value during the normal period. Time series data processing system equipped with.
- Appendix 17 The time-series data processing system according to Appendix 16.
- a calculation means is provided for setting any one of the maximum values during the normal period as a threshold value for determining that the measurement target is in an abnormal state in time series data including a plurality of parameters. Time series data processing system.
- the time-series data processing system described in Appendix 17 The time-series data processing system described in Appendix 17,
- the extraction means refers to the other of the combination of a plurality of parameters with respect to the predetermined parameter from the abnormal period time series data which is the time series data of the period during which the measurement target is determined to be in the abnormal state among the time series data. Extract the combination with the maximum parameter as the maximum value during the abnormal period,
- the calculation means sets any one of the normal period maximum values as the threshold value based on the normal period maximum value and the abnormal period maximum value. Time series data processing system.
- the time-series data processing system described in Appendix 18, calculates a margin value which is a value based on the ratio of the abnormal period maximum value to any parameter for any parameter in each of the normal period maximum values, and based on the margin value. One of the maximum values during the normal period is set as the threshold value. Time series data processing system.
- Non-temporary computer-readable media include various types of tangible storage media.
- Examples of non-temporary computer-readable media include magnetic recording media (eg, flexible disks, magnetic tapes, hard disk drives), magneto-optical recording media (eg, magneto-optical disks), CD-ROMs (Read Only Memory), CD-Rs, Includes CD-R / W, semiconductor memory (for example, mask ROM, PROM (Programmable ROM), EPROM (Erasable PROM), flash ROM, RAM (RandomAccessMemory)).
- the program may also be supplied to the computer by various types of temporary computer readable media. Examples of temporary computer-readable media include electrical, optical, and electromagnetic waves.
- the temporary computer-readable medium can supply the program to the computer via a wired communication path such as an electric wire and an optical fiber, or a wireless communication path.
- the present invention is not limited to the above-described embodiment.
- Various changes that can be understood by those skilled in the art can be made to the structure and details of the present invention within the scope of the present invention.
- at least one or more of the functions of the acquisition means, the extraction means, the calculation means, the measurement data storage means, and the threshold storage means described above are executed by an information processing device installed and connected to any place on the network. That is, it may be executed by so-called cloud computing.
- Time-series data processing device 11 Acquisition means 11a Abnormality calculation means 11b Generation means 12 Extraction means 13 Calculation means 14 Monitoring means 14a Analysis means 14b Judgment means 14c Output means 15 Measurement data storage means 16 Threshold storage means 100 Time-series data processing device 101 CPU 102 ROM 103 RAM 104 Program group 105 Storage device 106 Drive device 107 Communication interface 108 Input / output interface 109 Bus 110 Storage medium 111 Communication network 121 Extraction means
Abstract
This time-series data processing device 100 comprises an extraction means 121 for extracting, as a normal period maximum value, a combination, among a plurality of parameter combinations, of a prescribed parameter and another parameter a value of which is maximized with respect to a value of the prescribed parameter, such extraction being from normal period time-series data which is time-series data for a period in which a measurement subject is determined to be in a normal state, among time-series data that includes a plurality of parameters based on data measured from the measurement subject.
Description
本発明は、時系列データ処理方法、時系列データ処理装置、プログラムに関する。
The present invention relates to a time series data processing method, a time series data processing device, and a program.
エネルギー(電気、ガス、上水など)や石油化学製品(原油、ガソリン、プラスチックなど)、食品、医薬品などを製造する産業プラントや、化学製品を生産する工場施設や装置などの化学プラントがある。これらプラントや、情報処理システムといった設備・大型機械では、各種センサからの計測値である時系列データを分析し、異常状態が発生したことを検出して出力することが行われている。例えば、特許文献1では、ルータやサーバ装置等の複数のノードが接続されることによって構成されているネットワークを監視対象として、CPU使用率などの時系列データを採取し、時系列データから算出した異常度を閾値と比較することで、異常状態が発生したことを検出している。
There are industrial plants that manufacture energy (electricity, gas, clean water, etc.), petrochemical products (crude oil, gasoline, plastics, etc.), foods, pharmaceuticals, etc., and chemical plants such as factory facilities and equipment that produce chemical products. In equipment and large machines such as these plants and information processing systems, time-series data, which is the measured value from various sensors, is analyzed, and the occurrence of an abnormal state is detected and output. For example, in Patent Document 1, time-series data such as CPU usage is collected from a network configured by connecting a plurality of nodes such as routers and server devices as a monitoring target, and calculated from the time-series data. By comparing the degree of abnormality with the threshold value, it is detected that an abnormal state has occurred.
そして、上述した特許文献1では、時系列データから算出した異常度を比較する閾値は、予め設定される場合や、過去の異常の有無や検知の有無の集計結果から新たな閾値を算出して設定される場合がある。一例として、特許文献1では、集計結果から誤検知の回数及び見逃しの回数を計算し、誤検知の回数が多いほど閾値の増加量を大きく、見逃しの回数が多いほど閾値の減少量を小さくするよう算出している。ところが、時系列データから異常状態の誤検知や見逃しの発生は必ずしも多く発生することとは限らない。このため、適切な閾値の設定が難しい、という問題がある。
Then, in the above-mentioned Patent Document 1, the threshold value for comparing the degree of abnormality calculated from the time series data is set in advance, or a new threshold value is calculated from the total result of the presence / absence of past abnormality and the presence / absence of detection. May be set. As an example, in Patent Document 1, the number of false positives and the number of misses are calculated from the aggregated result, and the larger the number of false positives, the larger the increase in the threshold value, and the larger the number of missed detections, the smaller the decrease in the threshold value. Is calculated. However, false detections and oversights of abnormal conditions do not always occur frequently from time-series data. Therefore, there is a problem that it is difficult to set an appropriate threshold value.
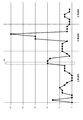
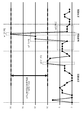
また、監視対象の時系列データから算出した異常度から異常状態の発生を検出するための閾値としては、「異常度」と「継続時間」といった2つの閾値の組み合わせも考えられる。例えば、図1に示すような複数の計測値の時系列データセットD1から所定の分析パラメータAに基づいて算出した異常度グラフD2といった時系列データについて考える。この場合、まず、異常度グラフD2に対して監視対象が実際に正常状態であった正常期間と異常状態であった異常期間とを設定する。すると、異常度グラフD2の異常期間から、図2に示すように、(閾値A1)「一瞬でも異常度が30を超えた場合」、(閾値A2)「短い期間、異常度が25を超えた場合」、(閾値A3)「長い期間、異常度が10を超えた場合」、といった複数通りの閾値の候補が考えられる。また、複数の計測値の時系列データセットD1から、図3に示すように、上記とは異なる分析パラメータBに基づいて算出した異常度グラフD3を用いることもあり、この場合は符号B1,B2に示すような上記とは異なる閾値の候補が考えられる。
Further, as a threshold value for detecting the occurrence of an abnormal state from the abnormality degree calculated from the time series data to be monitored, a combination of two threshold values such as "abnormality degree" and "duration" can be considered. For example, consider time-series data such as an abnormality graph D2 calculated based on a predetermined analysis parameter A from a time-series data set D1 of a plurality of measured values as shown in FIG. In this case, first, the normal period in which the monitoring target is actually in the normal state and the abnormal period in which the monitoring target is in the abnormal state are set for the abnormality degree graph D2. Then, from the abnormality period of the abnormality degree graph D2, as shown in FIG. 2, (threshold value A1) "when the abnormality degree exceeds 30 even for a moment", (threshold value A2) "for a short period, the abnormality degree exceeds 25". There are a plurality of possible threshold candidates such as "case" and (threshold value A3) "when the degree of abnormality exceeds 10 for a long period of time". Further, as shown in FIG. 3, an abnormality graph D3 calculated based on an analysis parameter B different from the above may be used from the time series data set D1 of a plurality of measured values. In this case, the reference numerals B1 and B2 may be used. Candidates with thresholds different from the above can be considered as shown in.
しかしながら、異常状態を確実に検知しようとすると、閾値を最低限まで低い値に設定すればよいが、誤検知も起こる。一方、誤検知が起こらないように閾値を異常値の上限ギリギリに設定すると、異常状態を検知できない可能性がある。このように、検知率と誤検知率のバランスの取れた適切な閾値を設定することは困難である。このため、上述したように複数の閾値の候補を抽出したとしても、このうちどの閾値が適切であるかを判断することは難しく、そもそも適切ではない候補も含まれうる。その結果、適切な閾値を設定することが困難である。
However, in order to reliably detect an abnormal state, the threshold value should be set as low as possible, but false detection also occurs. On the other hand, if the threshold value is set to the upper limit of the abnormal value so that false detection does not occur, the abnormal state may not be detected. As described above, it is difficult to set an appropriate threshold value in which the detection rate and the false detection rate are well-balanced. Therefore, even if a plurality of threshold candidates are extracted as described above, it is difficult to determine which threshold is appropriate, and candidates that are not appropriate in the first place may be included. As a result, it is difficult to set an appropriate threshold.
さらに、通常は異常事例が発生する頻度が少ないことから、上述したように異常度グラフの異常期間から閾値を求めることも困難である。
Furthermore, since the frequency of abnormal cases usually occurs less frequently, it is difficult to obtain the threshold value from the abnormal period of the abnormality degree graph as described above.
このため、本発明の目的は、上述した課題である、時系列データに基づいて異常状態を検出する場合における適切な閾値を設定することが困難である、ことを解決することができる時系列データ処理方法を提供することにある。
Therefore, an object of the present invention is time-series data that can solve the above-mentioned problem that it is difficult to set an appropriate threshold value when an abnormal state is detected based on time-series data. The purpose is to provide a processing method.
本発明の一形態である時系列データ処理方法は、
計測対象から計測されたデータに基づく複数のパラメータを含む時系列データのうち、前記計測対象が正常状態と判定された期間の時系列データである正常期間時系列データから、複数のパラメータの組み合わせのうち所定のパラメータの値に対する他のパラメータの値が最大となる組み合わせを正常期間最大値として抽出する、
という構成をとる。 The time series data processing method, which is one embodiment of the present invention, is
Of the time-series data including a plurality of parameters based on the data measured from the measurement target, the combination of a plurality of parameters is selected from the normal period time-series data which is the time-series data of the period in which the measurement target is determined to be in the normal state. Of these, the combination that maximizes the value of the other parameter with respect to the value of the predetermined parameter is extracted as the maximum value during the normal period.
It takes the configuration.
また、本発明の一形態である時系列データ処理装置は、
計測対象から計測されたデータに基づく複数のパラメータを含む時系列データのうち、前記計測対象が正常状態と判定された期間の時系列データである正常期間時系列データから、複数のパラメータの組み合わせのうち所定のパラメータの値に対する他のパラメータの値が最大となる組み合わせを正常期間最大値として抽出する抽出手段、
を備えた、
という構成をとる。 Further, the time series data processing device, which is one embodiment of the present invention, is
Of the time-series data including a plurality of parameters based on the data measured from the measurement target, the combination of a plurality of parameters is selected from the normal period time-series data which is the time-series data of the period in which the measurement target is determined to be in the normal state. An extraction means that extracts the combination that maximizes the values of other parameters with respect to the value of a predetermined parameter as the maximum value during the normal period.
With,
It takes the configuration.
また、本発明の一形態であるプログラムは、
情報処理装置に、
計測対象から計測されたデータに基づく複数のパラメータを含む時系列データのうち、前記計測対象が正常状態と判定された期間の時系列データである正常期間時系列データから、複数のパラメータの組み合わせのうち所定のパラメータの値に対する他のパラメータの値が最大となる組み合わせを正常期間最大値として抽出する抽出手段、
を実現させる、
という構成をとる。 Further, the program which is one form of the present invention is
For information processing equipment
Of the time-series data including a plurality of parameters based on the data measured from the measurement target, the combination of a plurality of parameters is selected from the normal period time-series data which is the time-series data of the period in which the measurement target is determined to be in the normal state. An extraction means that extracts the combination that maximizes the values of other parameters with respect to the value of a predetermined parameter as the maximum value during the normal period.
To realize,
It takes the configuration.
本発明は、以上のように構成されることにより、時系列データに基づいて異常状態を検出する場合における適切な閾値を設定することができる。
The present invention is configured as described above, and an appropriate threshold value can be set when an abnormal state is detected based on time series data.
<実施形態1>
本発明の第1の実施形態を、図4乃至図15を参照して説明する。図4は、時系列データ処理装置の構成を説明するための図であり、図5乃至図15は、時系列データ処理装置の処理動作を説明するための図である。 <Embodiment 1>
The first embodiment of the present invention will be described with reference to FIGS. 4 to 15. FIG. 4 is a diagram for explaining the configuration of the time series data processing device, and FIGS. 5 to 15 are diagrams for explaining the processing operation of the time series data processing device.
本発明の第1の実施形態を、図4乃至図15を参照して説明する。図4は、時系列データ処理装置の構成を説明するための図であり、図5乃至図15は、時系列データ処理装置の処理動作を説明するための図である。 <
The first embodiment of the present invention will be described with reference to FIGS. 4 to 15. FIG. 4 is a diagram for explaining the configuration of the time series data processing device, and FIGS. 5 to 15 are diagrams for explaining the processing operation of the time series data processing device.
[構成]
本発明における時系列データ処理装置10は、プラントなどの計測対象Pに接続されている。そして、時系列データ処理装置10は、計測対象Pの少なくとも一以上のデータ項目の計測値を取得して分析し、分析結果に基づいて計測対象Pの状態を監視する。例えば、計測対象Pは、製造工場や処理施設などのプラントであり、各データ項目の計測値は、プラント内の温度、圧力、流量、消費電力値、原料の供給量、残量など、複数種類のデータ項目の値からなる。そして、監視する計測対象Pの状態は、本実施形態では、計測対象Pの異常状態であることとし、各データ項目の計測値から所定の分析パラメータに基づいて算出した異常度から、異常状態であることを検出して、かかる異常状態であることを通知する通知情報を出力する。なお、計測対象Pが正常状態であると判定された場合は、管理者又は管理者が使用する端末装置に対して正常状態であることを通知する通知情報を出力してもよい。また、本発明における時系列データ処理装置10は、後述するように、異常度から異常状態であることを検出する際の閾値の候補を抽出し、該候補から閾値を選択し設定することとしている。 [Constitution]
The time-seriesdata processing device 10 in the present invention is connected to a measurement target P such as a plant. Then, the time-series data processing device 10 acquires and analyzes the measured values of at least one or more data items of the measurement target P, and monitors the state of the measurement target P based on the analysis result. For example, the measurement target P is a plant such as a manufacturing factory or a processing facility, and the measurement values of each data item include a plurality of types such as temperature, pressure, flow rate, power consumption value, raw material supply amount, and remaining amount in the plant. Consists of the values of the data items of. Then, the state of the measurement target P to be monitored is an abnormal state of the measurement target P in the present embodiment, and is in an abnormal state from the degree of abnormality calculated from the measured values of each data item based on a predetermined analysis parameter. It detects that there is something and outputs notification information notifying that it is in such an abnormal state. When it is determined that the measurement target P is in the normal state, the administrator or the terminal device used by the administrator may be output notification information notifying that the measurement target P is in the normal state. Further, as will be described later, the time-series data processing device 10 in the present invention extracts a threshold value candidate for detecting an abnormal state from the degree of abnormality, and selects and sets a threshold value from the candidates. ..
本発明における時系列データ処理装置10は、プラントなどの計測対象Pに接続されている。そして、時系列データ処理装置10は、計測対象Pの少なくとも一以上のデータ項目の計測値を取得して分析し、分析結果に基づいて計測対象Pの状態を監視する。例えば、計測対象Pは、製造工場や処理施設などのプラントであり、各データ項目の計測値は、プラント内の温度、圧力、流量、消費電力値、原料の供給量、残量など、複数種類のデータ項目の値からなる。そして、監視する計測対象Pの状態は、本実施形態では、計測対象Pの異常状態であることとし、各データ項目の計測値から所定の分析パラメータに基づいて算出した異常度から、異常状態であることを検出して、かかる異常状態であることを通知する通知情報を出力する。なお、計測対象Pが正常状態であると判定された場合は、管理者又は管理者が使用する端末装置に対して正常状態であることを通知する通知情報を出力してもよい。また、本発明における時系列データ処理装置10は、後述するように、異常度から異常状態であることを検出する際の閾値の候補を抽出し、該候補から閾値を選択し設定することとしている。 [Constitution]
The time-series
なお、本発明における計測対象Pは、プラントであることに限定されず、情報処理システムなどの設備といったいかなるものであってもよい。例えば、計測対象Pが情報処理システムである場合には、情報処理システムを構成する端末やサーバ等の各情報処理装置のCPU(Central Processing Unit)使用率、メモリ使用率、ディスクアクセス頻度、入出力パケット数、入出力パケットレート、消費電力値などを、各データ項目の計測値として計測し、かかる計測値を分析して情報処理システムの状態を監視してもよい。
Note that the measurement target P in the present invention is not limited to a plant, and may be any equipment such as an information processing system. For example, when the measurement target P is an information processing system, the CPU (Central Processing Unit) usage rate, memory usage rate, disk access frequency, input / output of each information processing device such as a terminal or server constituting the information processing system. The number of packets, the input / output packet rate, the power consumption value, and the like may be measured as measured values of each data item, and the measured values may be analyzed to monitor the state of the information processing system.
上記時系列データ処理装置10は、演算装置と記憶装置とを備えた1台又は複数台の情報処理装置にて構成される。そして、時系列データ処理装置10は、図4に示すように、取得手段11、抽出手段12、算出手段13、監視手段14、を備える。取得手段11、抽出手段12、算出手段13、監視手段14の各手段の機能は、演算装置が記憶装置に格納された各機能を実現するためのプログラムを実行することにより、実現することができる。また、時系列データ処理装置10は、計測データ記憶手段15、閾値記憶手段16、を備える。計測データ記憶手段15及び閾値記憶手段16は、記憶装置により構成される。以下、各構成について詳述する。
The time-series data processing device 10 is composed of one or a plurality of information processing devices including an arithmetic unit and a storage device. Then, as shown in FIG. 4, the time-series data processing device 10 includes an acquisition means 11, an extraction means 12, a calculation means 13, and a monitoring means 14. The functions of the acquisition means 11, the extraction means 12, the calculation means 13, and the monitoring means 14 can be realized by the arithmetic unit executing a program for realizing each function stored in the storage device. .. Further, the time-series data processing device 10 includes measurement data storage means 15 and threshold storage means 16. The measurement data storage means 15 and the threshold value storage means 16 are composed of a storage device. Hereinafter, each configuration will be described in detail.
取得手段11は、計測対象Pに設置された各種センサにて計測された各データ項目の計測値を所定の時間間隔で時系列データとして取得して、計測データ記憶手段15に記憶する。このとき、計測するデータ項目は複数種類あるため、取得手段11は、図1の符号D1に示すような複数のデータ項目の時系列データの集合である時系列データセットを取得する。なお、取得手段11による時系列データセットの取得及び記憶は常時行われており、取得された時系列データセットは、後述するように、計測対象Pの異常状態を検出するために使用される閾値を設定するとき、及び、計測対象Pの状態を監視するとき、にそれぞれ使用される。
The acquisition means 11 acquires the measured values of each data item measured by various sensors installed in the measurement target P as time-series data at predetermined time intervals and stores them in the measurement data storage means 15. At this time, since there are a plurality of types of data items to be measured, the acquisition means 11 acquires a time-series data set which is a set of time-series data of a plurality of data items as shown by reference numeral D1 in FIG. The time-series data set is constantly acquired and stored by the acquisition means 11, and the acquired time-series data set is a threshold value used for detecting an abnormal state of the measurement target P, as will be described later. Is used when setting and when monitoring the state of the measurement target P, respectively.
また、取得手段11は異常度算出手段11aと生成手段11bとを備えている。異常度算出手段11aは、計測対象Pから取得された時系列データセットから、当該計測対象Pの状態が異常状態である度合いを表す異常度を算出する。生成手段11bは当該異常度の値の時系列データである異常度グラフを生成して、計測データ記憶手段15に記憶する。ここで、異常度とは、上述した時系列データセットにおける各時刻の各データ項目の計測値を、分析パラメータに基づいて分析して得られる値であり、その値が高いほど、及び、その値が継続する時間が長いほど、異常状態であると判断される度合いが高くなる値である。例えば、異常度は、所定の2種類のデータ項目の値に関する予測モデルに対して、一方のデータ項目値を入力し他方のデータ項目の予測値を出力し、かかる予測値と実際の計測値との差分を調べ、差分の大きさや相関破壊の数などに応じて算出される。この場合、例えば、相関破壊の度合いが大きいほど、計測対象Pが異常状態である度合いが高いとして、異常度の値を高く算出する。但し、異常度算出手段11aによる異常度の算出方法は、上述した方法に限定されず、いかなる方法であってもよい。
Further, the acquisition means 11 includes an abnormality degree calculation means 11a and a generation means 11b. The abnormality degree calculation means 11a calculates the degree of abnormality indicating the degree to which the state of the measurement target P is an abnormal state from the time series data set acquired from the measurement target P. The generation means 11b generates an abnormality degree graph which is time-series data of the value of the abnormality degree, and stores it in the measurement data storage means 15. Here, the degree of abnormality is a value obtained by analyzing the measured value of each data item at each time in the above-mentioned time series data set based on the analysis parameters, and the higher the value, the higher the value. The longer the duration of, the higher the degree of determination of an abnormal state. For example, the degree of anomaly is obtained by inputting one data item value and outputting the predicted value of the other data item for a prediction model relating to the values of two predetermined types of data items, and using the predicted value and the actual measured value. It is calculated according to the magnitude of the difference and the number of correlation failures. In this case, for example, the greater the degree of correlation failure, the higher the degree of the measurement target P being in the abnormal state, and the higher the value of the degree of abnormality is calculated. However, the method of calculating the degree of abnormality by the degree of abnormality calculation means 11a is not limited to the above-mentioned method, and any method may be used.
ここで、生成手段11bが生成する異常度グラフの一例を図5に示す。図5に示すように、異常グラフの縦軸は異常度であり、横軸は時刻である。そして、異常度グラフは、時間の経過とともに異常度の値が変化する時系列データであり、「異常度の値」(他のパラメータ)と、その異常度の値が継続する「継続期間」(所定のパラメータ)と、といった複数のパラメータ(変数)を含むよう構成されている。
Here, FIG. 5 shows an example of the abnormality degree graph generated by the generation means 11b. As shown in FIG. 5, the vertical axis of the abnormality graph is the degree of abnormality, and the horizontal axis is the time. The abnormality degree graph is time-series data in which the abnormality degree value changes with the passage of time, and is a "abnormality degree value" (other parameters) and a "duration" (duration period) in which the abnormality degree value continues. It is configured to include a plurality of parameters (variables) such as a predetermined parameter).
また、生成手段11bが生成する異常グラフは、計測対象Pの状態を含んでもよい。具体的には、生成手段11bは、計測対象期間のうち、どの期間が正常期間であり、どの期間が異常期間であるか、を含む異常グラフを生成する。このとき、生成手段11bは、例えば、既に経過した過去の時刻において判定された計測対象Pの状態、つまり、正常状態である正常期間と、異常状態である異常期間とを、異常度グラフ内の時刻に対応付けて設定することで、計測対象Pの状態を含んだ異常度グラフを生成する。ここで、状態を含む異常度グラフの一例を図5に示す。この図の例では、正常期間、異常期間、正常期間、という順番で時間の経過に伴い状態が変化するよう設定されているが、さらに異なる異常期間が設定されていてもよく、その場合には、後述するように異なる異常期間同士を区別することとする。
Further, the abnormality graph generated by the generation means 11b may include the state of the measurement target P. Specifically, the generation means 11b generates an abnormality graph including which period is the normal period and which period is the abnormal period among the measurement target periods. At this time, the generation means 11b indicates, for example, the state of the measurement target P determined at the past time that has already passed, that is, the normal period that is the normal state and the abnormal period that is the abnormal state in the abnormality degree graph. By setting in association with the time, an abnormality degree graph including the state of the measurement target P is generated. Here, an example of an abnormality degree graph including a state is shown in FIG. In the example of this figure, the state is set to change with the passage of time in the order of normal period, abnormal period, and normal period, but different abnormal periods may be set in that case. , As will be described later, different abnormal periods will be distinguished from each other.
抽出手段12は、上述したように設定された計測対象Pが正常状態であると判断された正常期間の異常度グラフを用いて、計測対象Pが正常状態であると判定される限度となる「異常度の値」と「継続期間」との組み合わせである閾値の候補を抽出する。言い換えると、閾値の候補は、「異常度」及び「継続期間」が両方とも、その値を超えると異常状態であると判定される値である。なお、ここでは、「異常度の値」と「継続期間」との組み合わせである閾値を、「最小被覆値」(以下、「正常期間最大値」とも記載する。)と呼ぶこととする。以下、最小被覆値の抽出方法を、図6乃至図9を参照して説明する。
The extraction means 12 is a limit at which the measurement target P is determined to be in the normal state by using the abnormality degree graph of the normal period in which the measurement target P set as described above is determined to be in the normal state. Extract threshold candidates that are a combination of "abnormality value" and "duration". In other words, the threshold candidate is a value that is determined to be in an abnormal state when both the "abnormality" and the "duration" exceed the values. Here, the threshold value that is a combination of the "abnormality value" and the "duration" is referred to as a "minimum covering value" (hereinafter, also referred to as a "normal period maximum value"). Hereinafter, a method for extracting the minimum coating value will be described with reference to FIGS. 6 to 9.
まず、抽出手段12は、異常度グラフ内のすべての正常期間を、最小被覆値の抽出処理の対象とする。なお、図6乃至図9の例では、左側の正常期間のみを対象として最小被覆値の抽出処理を行っているが、実際にはすべての正常期間を対象とする。そして、抽出手段12は、「継続期間の最大値」を設定する。例えば、「継続期間の最大値」として、最も短い異常期間や、最大の正常期間、1日、といった期間を設定する。
First, the extraction means 12 targets all the normal periods in the abnormality degree graph for the extraction processing of the minimum coverage value. In the examples of FIGS. 6 to 9, the extraction process of the minimum coating value is performed only for the normal period on the left side, but in reality, all the normal periods are targeted. Then, the extraction means 12 sets the “maximum value of the duration”. For example, as the "maximum value of the duration", a period such as the shortest abnormal period, the maximum normal period, and one day is set.
続いて、抽出手段12は、上述した「継続期間の最大値」より小さい値の継続期間のウインドウWを異常度グラフ上に設定し、ウインドウW内における異常度の値の最大値を求める。このとき、抽出手段12は、図6に示すように、まずは継続期間を最小値である「1」としたウインドウWを設定し、かかるウインドウWを、図6の矢印に示すように異常度グラフ上をスライドさせて、異常度の最大値を求める。すると、継続期間「1」の場合には、図7に示すように異常度の最大値が「10」となる。このため、「継続期間,異常度」の組み合わせである最小被覆値として、まず[1,10]が抽出される。
Subsequently, the extraction means 12 sets a window W having a duration smaller than the above-mentioned "maximum value of the duration" on the abnormality degree graph, and obtains the maximum value of the abnormality degree value in the window W. At this time, as shown in FIG. 6, the extraction means 12 first sets the window W whose duration is the minimum value “1”, and displays the window W in the abnormality degree graph as shown by the arrow in FIG. Slide up to find the maximum anomaly. Then, in the case of the duration "1", the maximum value of the degree of abnormality becomes "10" as shown in FIG. Therefore, [1,10] is first extracted as the minimum coating value, which is a combination of “duration, degree of abnormality”.
その後、抽出手段12は、図8に示すように、継続期間を「+1」だけ増加させて「2」としたウインドウWを設定し、かかるウインドウWを異常度グラフ上でスライドさせて、異常度の最大値を求める。つまり、抽出手段12は、「2」の期間が継続した異常度の最大値を求める。すると、継続期間「2」の場合には、図8に示すように異常度の最大値が「10」となる。このため、「継続期間,異常度」の組み合わせである最小被覆値として[2,10]が抽出される。但し、抽出手段12は、新たに抽出した最小被覆値[2,10]の異常度「10」が、それ以前に抽出した最小被覆値[1,10]の異常度と同一である場合には、新たに抽出した最小被覆値[2,10]は、最小被覆値から除外する。このようにすることで、異常度が同一である「継続期間,異常度」の組み合わせのうち、「継続期間」が最小であるものだけが最小被覆値として抽出されることとなる。従って、異常度「10」の場合は、「1,10」のみが最小被覆値として抽出されることとなる。
After that, as shown in FIG. 8, the extraction means 12 sets a window W in which the duration is increased by “+1” to be “2”, and the window W is slid on the abnormality degree graph to obtain the degree of abnormality. Find the maximum value of. That is, the extraction means 12 obtains the maximum value of the degree of abnormality in which the period of "2" continues. Then, in the case of the duration "2", the maximum value of the degree of abnormality becomes "10" as shown in FIG. Therefore, [2,10] is extracted as the minimum coating value which is a combination of “duration, degree of abnormality”. However, in the extraction means 12, when the degree of abnormality "10" of the newly extracted minimum coating value [2,10] is the same as the degree of abnormality of the previously extracted minimum covering value [1,10], , The newly extracted minimum coating value [2,10] is excluded from the minimum coating value. By doing so, among the combinations of "duration and anomaly" having the same degree of anomaly, only the combination having the smallest "duration" is extracted as the minimum covering value. Therefore, when the degree of abnormality is "10", only "1,10" is extracted as the minimum coating value.
続いて、抽出手段12は、図9に示すように、継続期間をさらに「+1」だけ増加させて「3」としたウインドウWを設定し、かかるウインドウWを異常度グラフ上でスライドさせて、異常度の最大値を求める。つまり、抽出手段12は、「3」の期間が継続した異常度の最大値を求める。すると、継続期間「3」の場合には、図9に示すように異常度の最大値が「9」となる。このため、「継続期間,異常度」の組み合わせである最小被覆値として[3,9]が抽出される。
Subsequently, as shown in FIG. 9, the extraction means 12 sets a window W in which the duration is further increased by “+1” to be “3”, and the window W is slid on the abnormality degree graph. Find the maximum value of the degree of anomaly. That is, the extraction means 12 obtains the maximum value of the degree of abnormality in which the period of "3" continues. Then, in the case of the duration "3", the maximum value of the degree of abnormality becomes "9" as shown in FIG. Therefore, [3, 9] is extracted as the minimum coating value, which is a combination of “duration, degree of abnormality”.
そして、抽出手段12は、上述したように継続期間を「+1」だけ増加させたウインドウWで最小被覆値の抽出を繰り返し、継続期間が上述したように設定した「継続期間の最大値」となるまで行う。これにより、一例として、図12に示すように、正常期間における最小被覆値として、[1,10],[3,9],[4,3],[7,1],[9,0]といった複数の閾値の候補が抽出されることとなる。
Then, the extraction means 12 repeats the extraction of the minimum coating value in the window W in which the duration is increased by "+1" as described above, and the duration becomes the "maximum value of the duration" set as described above. Do up to. As a result, as an example, as shown in FIG. 12, the minimum coverage value in the normal period is [1,10], [3,9], [4,3], [7,1], [9,0]. Candidates for a plurality of threshold values such as are extracted.
また、抽出手段12は、上述したように設定された計測対象Pが異常状態であると判断された異常期間の異常度グラフを用いて、計測対象Pが異常状態であると判断できる限度となる「異常度の値」と「継続期間」との組み合わせである閾値の候補を抽出する。なお、ここでは、「異常度の値」と「継続期間」との組み合わせである閾値を、「最大被覆値」(以下「異常期間最大値」とも記載する。)と呼ぶこととする。以下、最大被覆値の抽出方法を、図10乃至図11Aを参照して説明する。
Further, the extraction means 12 reaches a limit at which the measurement target P can be determined to be in the abnormal state by using the abnormality degree graph of the abnormal period in which the measurement target P set as described above is determined to be in the abnormal state. Extract threshold candidates that are a combination of "abnormality value" and "duration". Here, the threshold value that is a combination of the "abnormality degree value" and the "duration" is referred to as the "maximum covering value" (hereinafter, also referred to as the "abnormal period maximum value"). Hereinafter, a method for extracting the maximum coating value will be described with reference to FIGS. 10 to 11A.
まず、抽出手段12は、異常度グラフ内の各異常期間を、それぞれ抽出処理の対象とする。つまり、抽出手段12は、異常期間毎に、それぞれ最大被覆値を抽出する。なお、図10乃至図11Aの例では、1つの異常期間のみを対象として最大被覆値の抽出処理を行っているが、複数の異常期間が存在する場合には、異常期間毎に区別して最大被覆値の抽出を行う。
First, the extraction means 12 targets each abnormality period in the abnormality degree graph for extraction processing. That is, the extraction means 12 extracts the maximum coverage value for each abnormal period. In the examples of FIGS. 10 to 11A, the maximum covering value is extracted only for one abnormal period, but when there are a plurality of abnormal periods, the maximum covering is distinguished for each abnormal period. Extract the value.
続いて、抽出手段12は、上述したように設定した「継続期間の最大値」の継続期間のウインドウWを異常度グラフ上に設定し、ウインドウW内における異常度の値の最大値を求める。例えば、抽出手段12は、図10に示すように、まずは継続期間を異常期間である「10」としたウインドウWを設定し、かかるウインドウWを異常度グラフ上でスライドさせて、異常度の最大値を求める。すると、継続期間「10」の場合には、図10に示すように異常度の最大値が「2」となる。このため、「継続期間,異常度」の組み合わせである最大被覆値として、まず[10,2]が抽出される。
Subsequently, the extraction means 12 sets the window W of the duration of the "maximum value of the duration" set as described above on the abnormality degree graph, and obtains the maximum value of the abnormality degree value in the window W. For example, as shown in FIG. 10, the extraction means 12 first sets a window W having a duration of “10”, which is an abnormal period, and slides the window W on the abnormality degree graph to maximize the degree of abnormality. Find the value. Then, in the case of the duration "10", the maximum value of the degree of abnormality becomes "2" as shown in FIG. Therefore, [10, 2] is first extracted as the maximum coverage value which is a combination of “duration, degree of abnormality”.
その後、抽出手段12は、継続期間を「-1」だけ減少させてウインドウWを設定し、かかるウインドウWを異常度グラフ上でスライドさせて、異常度の最大値を求めることを繰り返す。ここで、図11Aは、継続期間を「3」としたウインドウWを設定し、かかるウインドウWを異常度グラフ上でスライドさせて、異常度の最大値を求めた例である。すると、継続期間「3」の場合には、図11Aに示すように異常度の最大値が「15」となる。このため、「継続期間,異常度」の組み合わせである最大被覆値として[3,15]が抽出される。また、同様にして、最大被覆値として[1,25]が抽出される。
After that, the extraction means 12 reduces the duration by "-1" to set the window W, slides the window W on the abnormality degree graph, and repeats to obtain the maximum value of the abnormality degree. Here, FIG. 11A is an example in which a window W having a duration of “3” is set and the window W is slid on the abnormality degree graph to obtain the maximum value of the abnormality degree. Then, in the case of the duration "3", the maximum value of the degree of abnormality becomes "15" as shown in FIG. 11A. Therefore, [3,15] is extracted as the maximum coverage value which is a combination of “duration, degree of abnormality”. Similarly, [1,25] is extracted as the maximum coverage value.
これにより、一例として、図12に示すように、1つの異常期間である「異常期間1」における複数の最大被覆値[1,25],[3,15],[10,2]が抽出されることとなる。
As a result, as shown in FIG. 12, a plurality of maximum covering values [1,25], [3,15], and [10,2] in one abnormal period "abnormal period 1" are extracted. The Rukoto.
なお、抽出手段12は、さらに異なる異常期間がある場合には、その異常期間に対しても上述同様に最大被覆値の抽出を行う。例えば、図示しないが、異常度グラフ上に別の異常期間である「異常期間2」がある場合には、図12に示すように、かかる「異常期間2」における最大被覆値[1,40]が抽出されることとなる。
If the extraction means 12 has a different abnormal period, the extraction means 12 extracts the maximum covering value in the same manner as described above for the abnormal period. For example, although not shown, when there is another abnormal period “abnormal period 2” on the anomaly degree graph, as shown in FIG. 12, the maximum coverage value [1,40] in such “abnormal period 2”. Will be extracted.
上記算出手段13は、上述したように正常期間について抽出したすべての最小被覆値である閾値の候補のうち、いずれを閾値として設定するかを決定する。このとき、算出手段13は、各最小被覆値について、異常期間毎に抽出した各最大被覆値に対する余裕の度合いを表す余裕値を算出し、かかる余裕値に基づいて閾値を決定する。以下、算出手段13による処理の具体例を説明する。
The calculation means 13 determines which of the threshold candidates, which is the minimum coverage value extracted for the normal period as described above, is set as the threshold. At this time, the calculation means 13 calculates a margin value indicating the degree of margin for each maximum coating value extracted for each abnormal period for each minimum coating value, and determines a threshold value based on the margin value. Hereinafter, a specific example of the processing by the calculation means 13 will be described.
まず、算出手段13は、全ての最小被覆値のうち1つを選択する。そして、異常期間毎に、選択した最小被覆値について、すべての最大被覆値のそれぞれに対する余裕値を算出する。このとき、余裕値は、最小被覆値及び最大被覆値を構成するパラメータである「継続期間」と「異常度」とを比較して、「継続期間」と「異常度」のうち余裕のない方を選択し、その割合を余裕値として算出する。ここでは、以下に示すように、予め設定された基準に従って、最小被覆値を構成するパラメータの値自体から余裕度合いを設定し、あるいは、最小被覆値を構成するパラメータの値の最大被覆値に対する余裕度合いを算出し、その余裕度合いの値が大きい値ほど、余裕がない、と判断する。一例として、最小被覆値として[1,10]を選択した場合(異常度が10まで正常と判定するとした場合)を考えると、この最小被覆値[1,10](w0)と、異常期間1の各最大被覆値[1,25](w1),[3,15](w2),[10,2](w3)それぞれとの余裕値を算出する(図11B参照)。このとき、最小被覆値[1,10]の「継続期間」は「1」であり、それ以下の値は考えられないことから、その余裕度合いは無限にあると定義し、余裕値は「0」とする。このため、「継続期間」に対して「異常度」の方が余裕がないと判断し、「異常度」の割合を余裕値として算出する。なお、ここでは、余裕値の値が小さいほど余裕があることとする。
First, the calculation means 13 selects one of all the minimum coating values. Then, for each abnormal period, a margin value for each of all the maximum covering values is calculated for the selected minimum covering value. At this time, the margin value is the one of the "duration" and the "abnormality" that has no margin by comparing the "duration" and the "abnormality", which are the parameters constituting the minimum coating value and the maximum coating value. Is selected, and the ratio is calculated as a margin value. Here, as shown below, the margin is set from the value of the parameter that constitutes the minimum coating value itself, or the margin of the value of the parameter that constitutes the minimum coating value with respect to the maximum coating value, according to a preset standard. The degree is calculated, and it is determined that the larger the value of the margin degree, the less the margin. As an example, considering the case where [1,10] is selected as the minimum coating value (when the degree of abnormality is determined to be normal up to 10), this minimum coating value [1,10] (w0) and the abnormality period 1 are considered. The margin values for each of the maximum covering values [1,25] (w1), [3,15] (w2), and [10,2] (w3) are calculated (see FIG. 11B). At this time, the "duration" of the minimum covering value [1,10] is "1", and since a value less than that cannot be considered, the margin value is defined as infinite, and the margin value is "0". ". Therefore, it is determined that there is no margin in the "abnormality" with respect to the "duration", and the ratio of the "abnormality" is calculated as a margin value. Here, it is assumed that the smaller the margin value, the more margin there is.
すると、最小被覆値[1,10](w0)と、異常期間1の各最大被覆値[1,25](w1),[3,15](w2),[10,2](w3)と、の余裕値は、それぞれMAX(0,10/25)=0.4、MAX(0,10/15)=0.66、MAX(0,10/2)=5、となる。そして、算出手段12は、算出した余裕値のうち、最も低い値、つまり、最も余裕がある値を、選択した最小被覆値の対象としている異常期間に対する余裕値とする。この場合、最小被覆値[1,10](w0)の異常期間1に対する余裕値は「0.4」となる(図11B参照。)。
Then, the minimum covering value [1,10] (w0) and the maximum covering values [1,25] (w1), [3,15] (w2), [10,2] (w3) of the abnormal period 1 are obtained. The margin values of, are MAX (0,10 / 25) = 0.4, MAX (0,10 / 15) = 0.66, and MAX (0,10 / 2) = 5, respectively. Then, the calculation means 12 sets the lowest value, that is, the value having the most margin among the calculated margin values, as the margin value for the abnormal period targeted by the selected minimum covering value. In this case, the margin value of the minimum coating value [1,10] (w0) with respect to the abnormal period 1 is “0.4” (see FIG. 11B).
また、算出手段13は、選択した最小被覆値[1,10]について、異常期間2の各最大被覆値[1,40]に対する余裕値も算出する。すると、上述と同様の計算により、余裕値はMAX(0,10/40)=0.25、となる。
The calculation means 13 also calculates a margin value for each maximum cover value [1,40] in the abnormal period 2 for the selected minimum cover value [1,10]. Then, by the same calculation as described above, the margin value becomes MAX (0,10 / 40) = 0.25.
そして、算出手段13は、選択した最小被覆値について、異常期間毎に算出した余裕値のうち最大の値を、その最小被覆値の余裕値と決定する。つまり、最小被覆値[1,10]については、異常期間1について算出した余裕値「0.4」と、異常期間2について算出した余裕値「0.25」とのうち、最大の値「0.4」が余裕値となる。
Then, the calculation means 13 determines the maximum value among the margin values calculated for each abnormal period as the margin value of the minimum coating value for the selected minimum coating value. That is, for the minimum covering value [1,10], the maximum value "0" of the margin value "0.4" calculated for the abnormal period 1 and the margin value "0.25" calculated for the abnormal period 2 .4 ”is the margin value.
続いて、算出手段13は、次の最小被覆値を選択し、上述同様に異常期間毎に、選択した最小被覆値について、すべての最大被覆値のそれぞれに対する余裕値を算出する。このとき、最小被覆値として[3,9]を選択した場合を考えると、この最小被覆値[3,9]と、異常期間1の各最大被覆値[1,25],[3,15],[10,2]それぞれとの余裕値を算出する。すると、余裕値は、それぞれMAX(3/1,9/25)=3、MAX(3/3,9/15)=1、MAX(3/10,9/2)=4.5、となる。そして、算出手段12は、算出した余裕値のうち、最も低い値、つまり、最も余裕がある値を、選択した最小被覆値の対象としている異常期間に対する余裕値とする。この場合、最小被覆値[3,9]の異常期間1に対する余裕値は「1」となる。
Subsequently, the calculation means 13 selects the next minimum coating value, and calculates a margin value for each of all the maximum coating values for the selected minimum coating value for each abnormal period as described above. At this time, considering the case where [3,9] is selected as the minimum covering value, the minimum covering value [3,9] and the maximum covering values [1,25] and [3,15] of the abnormal period 1 are taken into consideration. , [10, 2] Calculate the margin value with each. Then, the margin values are MAX (3/1, 9/25) = 3, MAX (3/3, 9/15) = 1, and MAX (3/10, 9/2) = 4.5, respectively. .. Then, the calculation means 12 sets the lowest value, that is, the value having the most margin among the calculated margin values, as the margin value for the abnormal period targeted by the selected minimum covering value. In this case, the margin value for the abnormal period 1 of the minimum covering value [3, 9] is "1".
また、算出手段13は、上述同様に、選択した最小被覆値[3,9]について、異常期間2の各最大被覆値[1,40]に対する余裕値も算出する。すると、上述と同様の計算により、異常期間2に対する余裕値はMAX(3/1,9/40)=3、となる。そして、算出手段13は、各異常期間に対する余裕値のうち最大の値「3」を、最小被覆値[3,9]に対する余裕値とする。
Further, the calculation means 13 also calculates a margin value for each maximum cover value [1,40] in the abnormal period 2 for the selected minimum cover value [3, 9] in the same manner as described above. Then, by the same calculation as described above, the margin value for the abnormal period 2 is MAX (3/1, 9/40) = 3. Then, the calculation means 13 sets the maximum value "3" of the margin values for each abnormal period as the margin value for the minimum coating value [3, 9].
以上のようにして、全ての最小被覆値について余裕値を算出すると、図13の最右列に示すようになる。そして、さらに算出手段13は、全ての最小被覆値のうち余裕値が最小値のものを、閾値として決定する。この例では、余裕値「0.4」が最小値であることから、最小被覆値[1,10]を閾値として決定する。
When the margin values are calculated for all the minimum coating values as described above, they are shown in the rightmost column of FIG. Then, the calculation means 13 further determines, among all the minimum coating values, the one having the minimum margin value as the threshold value. In this example, since the margin value "0.4" is the minimum value, the minimum coating value [1,10] is used as the threshold value.
ここで、上述した取得手段11、抽出手段12、算出手段13による処理は、計測対象Pから取得された時系列データセットから上述とは異なる分析パラメータに基づいて生成された別の異常度グラフに対して行われてもよい。そして、異なる分析パラメータに基づいて生成された別の異常度グラフに対して上述同様に最小被覆値の候補を抽出し、その中から閾値を決定してもよい。これに加え、算出手段13は、各分析パラメータに基づいてそれぞれ生成された各異常度グラフについて決定した閾値のうち、最も小さい値を最終的な閾値として決定し、その異常度グラフを生成するための分析パラメータを最適パラメータとして決定してもよい。
Here, the processing by the acquisition means 11, the extraction means 12, and the calculation means 13 described above is performed on another abnormality graph generated from the time series data set acquired from the measurement target P based on the analysis parameters different from the above. It may be done against. Then, a candidate for the minimum coverage value may be extracted from another abnormality graph generated based on different analysis parameters in the same manner as described above, and the threshold value may be determined from the candidates. In addition to this, the calculation means 13 determines the smallest value among the threshold values determined for each abnormality degree graph generated based on each analysis parameter as the final threshold value, and generates the abnormality degree graph. The analysis parameter of may be determined as the optimum parameter.
上記監視手段14は、上述したように決定した閾値を用いて、計測対象Pから計測された時系列データセットから、計測対象Pに異常状態が生じたか否かの分析を行い監視する。具体的に、監視手段14は、分析手段14aと判定手段14bと出力手段14cとを備える。分析手段14aは、上述したように、計測対象Pから計測された時系列データセットから異常度を算出し、異常度の値と、かかる異常度の値が継続する期間と、の両方が閾値を超えているか否かを調べる。判定手段14bは、算出した異常度と継続期間との値が閾値を超えたときに、計測対象Pが異常状態であると判定する。出力手段14cは、計測対象Pが異常状態であることを判定した際に、その旨の出力を行う。例えば、出力手段14cは、登録された監視者のメールアドレスに対して異常が生じている旨を表す通知情報を送信したり、時系列データ処理装置10に接続された監視者が操作する監視端末の表示画面に通知情報を表示するよう出力する。
The monitoring means 14 analyzes and monitors whether or not an abnormal state has occurred in the measurement target P from the time series data set measured from the measurement target P using the threshold value determined as described above. Specifically, the monitoring means 14 includes an analysis means 14a, a determination means 14b, and an output means 14c. As described above, the analysis means 14a calculates the degree of abnormality from the time-series data set measured from the measurement target P, and both the value of the degree of abnormality and the period during which the value of the degree of abnormality continues set a threshold value. Check if it exceeds. The determination means 14b determines that the measurement target P is in an abnormal state when the calculated values of the degree of abnormality and the duration exceed the threshold value. When the output means 14c determines that the measurement target P is in an abnormal state, the output means 14c outputs to that effect. For example, the output means 14c transmits notification information indicating that an abnormality has occurred to the registered e-mail address of the observer, or a monitoring terminal operated by the observer connected to the time-series data processing device 10. Output to display the notification information on the display screen of.
[動作]
次に、上述した時系列データ処理装置10の動作を、主に図14乃至図15のフローチャートを参照して説明する。まず、図14のフローチャートを参照して、計測対象Pの異常状態を判定するための閾値を決定するときの動作を説明する。 [motion]
Next, the operation of the time-seriesdata processing device 10 described above will be described mainly with reference to the flowcharts of FIGS. 14 to 15. First, the operation when determining the threshold value for determining the abnormal state of the measurement target P will be described with reference to the flowchart of FIG.
次に、上述した時系列データ処理装置10の動作を、主に図14乃至図15のフローチャートを参照して説明する。まず、図14のフローチャートを参照して、計測対象Pの異常状態を判定するための閾値を決定するときの動作を説明する。 [motion]
Next, the operation of the time-series
時系列データ処理装置10は、計測対象Pに設置された各種センサにて計測された各データ項目の計測値を所定の時間間隔で時系列データセットとして取得して、計測データ記憶手段15に記憶する(ステップS1)。そして、時系列データ処理装置10は、取得した時系列データセットから各時刻における異常度を算出して、時系列データである異常度グラフを生成する(ステップS2)。このとき、時系列データ処理装置10は、正常期間と異常期間とを設定した異常度グラフを生成する(ステップS3)。
The time-series data processing device 10 acquires the measured values of each data item measured by various sensors installed in the measurement target P as a time-series data set at predetermined time intervals, and stores them in the measurement data storage means 15. (Step S1). Then, the time-series data processing device 10 calculates the degree of abnormality at each time from the acquired time-series data set, and generates an abnormality degree graph which is time-series data (step S2). At this time, the time-series data processing device 10 generates an abnormality degree graph in which the normal period and the abnormal period are set (step S3).
続いて、時系列データ処理装置10は、異常度グラフの正常期間から、閾値の候補となる最小被覆値を抽出する(ステップS4)。このとき、時系列データ処理装置10は、図6乃至図9に示すように、各継続期間のウインドウWを異常度グラフ上でスライドさせて、各継続期間における異常度の最大値を特定し、[継続期間,異常度]のパラメータからなる最小被覆値を抽出する。なお、時系列データ処理装置10は、異常度が同一である「継続期間,異常度」の組み合わせのうち、「継続期間」が最小であるものだけを最小被覆値として抽出する。これにより、例えば、図12に示すように、複数の最小被覆値が抽出されることとなる。
Subsequently, the time-series data processing device 10 extracts the minimum coverage value as a threshold candidate from the normal period of the abnormality degree graph (step S4). At this time, as shown in FIGS. 6 to 9, the time-series data processing device 10 slides the window W of each duration on the abnormality degree graph to specify the maximum value of the abnormality degree in each continuation period. Extract the minimum coverage value consisting of the parameters of [duration, degree of anomaly]. The time-series data processing device 10 extracts only the combination of the "duration and the degree of abnormality" having the same degree of abnormality as the minimum coverage value having the smallest "duration". As a result, for example, as shown in FIG. 12, a plurality of minimum coating values are extracted.
続いて、時系列データ処理装置10は、異常度グラフの異常期間から最大被覆値を抽出する(ステップS5)。このとき、時系列データ処理装置10は、図10乃至図11Aに示すように、各継続期間のウインドウWを異常度グラフ上でスライドさせて、各継続期間における異常度の最大値を特定し、[継続期間,異常度]のパラメータからなる最大被覆値を抽出する。これにより、例えば、図12に示すように、複数の最大被覆値が抽出されることとなる。なお、時系列データ処理装置10は、異常度グラフの異常状態毎に、それぞれ最大被覆値を抽出する。
Subsequently, the time series data processing device 10 extracts the maximum coverage value from the abnormal period of the abnormality degree graph (step S5). At this time, as shown in FIGS. 10 to 11A, the time-series data processing device 10 slides the window W of each duration on the abnormality degree graph to specify the maximum value of the abnormality degree in each continuation period. Extract the maximum coverage value consisting of the parameters of [duration, degree of abnormality]. As a result, for example, as shown in FIG. 12, a plurality of maximum covering values are extracted. The time-series data processing device 10 extracts the maximum coverage value for each abnormal state in the abnormality degree graph.
続いて、時系列データ処理装置10は、正常期間から抽出したすべての最小被覆値である閾値の候補のうち、いずれを閾値として設定するかを決定する。このため、時系列データ処理装置10は、各最小被覆値について、異常期間毎に抽出した各最大被覆値に対する余裕の度合いを表す余裕値を算出する(ステップS6)。そして、時系列データ処理装置10は、算出した余裕値のうち、最も低い値、つまり、最も余裕がある値を、選択した最小被覆値の対象としている異常期間に対する余裕値とする。このようにして、時系列データ処理装置10は、図11B、図13に示すように各最小被覆値の各異常期間に対する余裕値を算出する。さらに、時系列データ処理装置10は、図13の最右列に示すように、各最小被覆値について、全ての異常期間に対する余裕値のうち最高値を、最終的な余裕値として算出する。
Subsequently, the time-series data processing device 10 determines which of the threshold candidates, which are all the minimum covering values extracted from the normal period, is set as the threshold. Therefore, the time-series data processing device 10 calculates a margin value indicating the degree of margin for each maximum coating value extracted for each abnormal period for each minimum coating value (step S6). Then, the time-series data processing device 10 sets the lowest value, that is, the value having the most margin among the calculated margin values, as the margin value for the abnormal period targeted by the selected minimum covering value. In this way, the time-series data processing device 10 calculates the margin value for each abnormal period of each minimum covering value as shown in FIGS. 11B and 13. Further, as shown in the rightmost column of FIG. 13, the time series data processing device 10 calculates the maximum value among the margin values for all the abnormal periods as the final margin value for each minimum coating value.
そして、時系列データ処理装置10は、全ての最小被覆値について算出した最終的な余裕値のうち、最小値となる最小被覆値を、閾値として決定する(ステップS7)。
Then, the time-series data processing device 10 determines the minimum covering value, which is the minimum value, as the threshold value among the final margin values calculated for all the minimum covering values (step S7).
次に、図15のフローチャートを参照して、計測対象Pの状態を分析して監視する処理について説明する。まず、時系列データ処理装置10は、新たに計測対象Pから計測された時系列データセットを取得し(ステップS11)、各時刻における異常度を算出する(ステップS12)。
Next, the process of analyzing and monitoring the state of the measurement target P will be described with reference to the flowchart of FIG. First, the time-series data processing device 10 newly acquires the time-series data set measured from the measurement target P (step S11), and calculates the degree of abnormality at each time (step S12).
そして、時系列データ処理装置10は、算出した異常度とその継続期間との両方が、上述したように決定した閾値を超えているか否かを調べる(ステップS13)。そして、時系列データ処理装置10は、算出した異常度と継続期間との値が閾値を超えたときに(ステップS13でYes)、計測対象Pが異常状態であると判定する(ステップS14)。さらに、時系列データ処理装置10は、異常状態が生じた旨の出力を行う(ステップS15)。
Then, the time-series data processing device 10 examines whether or not both the calculated abnormality degree and the duration thereof exceed the threshold value determined as described above (step S13). Then, when the calculated values of the degree of abnormality and the duration exceed the threshold value (Yes in step S13), the time-series data processing device 10 determines that the measurement target P is in an abnormal state (step S14). Further, the time-series data processing device 10 outputs that an abnormal state has occurred (step S15).
以上のように、本発明では、計測対象Pから計測した計測値から算出した異常度グラフのうち、計測対象Pが正常状態である正常期間から、異常状態と判定できるパラメータの閾値の候補を抽出している。このため、計測対象Pに異常状態が発生することが少ない場合であっても、正常期間のデータから適切な閾値の候補を抽出することができ、この中から適切な閾値を決定することができる。
As described above, in the present invention, from the abnormality degree graph calculated from the measured values measured from the measurement target P, the threshold candidates of the parameters that can be determined to be the abnormal state are extracted from the normal period in which the measurement target P is in the normal state. doing. Therefore, even when an abnormal state rarely occurs in the measurement target P, a candidate for an appropriate threshold value can be extracted from the data in the normal period, and an appropriate threshold value can be determined from the candidates. ..
また、本発明では、異常度グラフのうち計測対象Pが異常状態である異常期間から、異常状態と判定できるパラメータの最大値を抽出し、かかる値を利用して、閾値の候補から閾値を決定している。このように異常状態の値を考慮することで、より適切な閾値を決定することができる。
Further, in the present invention, the maximum value of the parameter that can be determined to be in the abnormal state is extracted from the abnormal period in which the measurement target P is in the abnormal state in the abnormality degree graph, and the threshold value is determined from the threshold candidates by using such a value. doing. By considering the value of the abnormal state in this way, a more appropriate threshold value can be determined.
<実施形態2>
次に、本発明の第2の実施形態を、図16を参照して説明する。図16は、実施形態2における時系列データ処理装置の処理動作を説明するための図である。 <Embodiment 2>
Next, a second embodiment of the present invention will be described with reference to FIG. FIG. 16 is a diagram for explaining the processing operation of the time series data processing apparatus according to the second embodiment.
本実施形態における時系列データ処理装置は、上述した実施形態1において説明した図4に示す構成と同様の構成をとっている。但し、本実施形態と実施形態1とは、閾値の候補として抽出した最小被覆値から閾値を決定する方法が異なる。例えば、本実施形態における算出手段13は、図16に示すように、まず全ての最大被覆値をグラフ上に配置し、それらを直線で結ぶ。そして、最大被覆値間を結んだ直線に対する各最小被覆値からの距離Tを算出し、かかる距離Tが最も大きい最小被覆値を閾値として決定する。
The time-series data processing apparatus in this embodiment has the same configuration as that shown in FIG. 4 described in the above-described first embodiment. However, the method of determining the threshold value from the minimum coating value extracted as a candidate for the threshold value is different between the present embodiment and the first embodiment. For example, in the calculation means 13 of the present embodiment, as shown in FIG. 16, first, all the maximum covering values are arranged on the graph, and they are connected by a straight line. Then, the distance T from each minimum covering value with respect to the straight line connecting the maximum covering values is calculated, and the minimum covering value having the largest such distance T is determined as a threshold value.
但し、上述した最小被覆値から閾値を決定する方法は一例であって、本発明では、いかなる方法で複数の最小被覆値から1つの閾値を決定してもよい。また、上記では、最大被覆値を用いて最小被覆値の余裕値を算出して閾値を決定しているが、必ずしも最大被覆値を用いることに限定されない。つまり、本発明では、最大被覆値を抽出せずに最小被覆値のみを抽出して、かかる最小被覆値から任意の方法で1つの閾値を決定してもよい。一例として、算出手段13は、最小被覆値を構成する複数のパラメータについて優先度を設定しておき、かかる優先度が最も高いパラメータが最大の値となる最小被覆値を、閾値として決定してもよい。また、別の例として、算出手段13は、パラメータの値に対して、各パラメータに設定された優先度に対応する重み付けを付与し、かかる値が最大となる最小被覆値を閾値として決定してもよい。なお、最小被覆値が1つしか抽出できなかった場合には、その1つを閾値として決定してもよい。
However, the method of determining the threshold value from the above-mentioned minimum coating value is an example, and in the present invention, one threshold value may be determined from a plurality of minimum coating values by any method. Further, in the above, the threshold value is determined by calculating the margin value of the minimum coating value using the maximum coating value, but the maximum coating value is not always used. That is, in the present invention, one threshold value may be determined by an arbitrary method from the minimum coating value by extracting only the minimum coating value without extracting the maximum coating value. As an example, the calculation means 13 may set priorities for a plurality of parameters constituting the minimum covering value, and determine the minimum covering value at which the parameter having the highest priority is the maximum value as a threshold value. Good. Further, as another example, the calculation means 13 assigns a weight corresponding to the priority set for each parameter to the value of the parameter, and determines the minimum covering value at which the value is the maximum as the threshold value. May be good. If only one minimum coating value can be extracted, that one may be used as a threshold value.
<実施形態3>
次に、本発明の第3の実施形態を、図17を参照して説明する。図17は、実施形態3における時系列データ処理装置の処理動作を説明するための図である。 <Embodiment 3>
Next, a third embodiment of the present invention will be described with reference to FIG. FIG. 17 is a diagram for explaining the processing operation of the time series data processing apparatus according to the third embodiment.
次に、本発明の第3の実施形態を、図17を参照して説明する。図17は、実施形態3における時系列データ処理装置の処理動作を説明するための図である。 <
Next, a third embodiment of the present invention will be described with reference to FIG. FIG. 17 is a diagram for explaining the processing operation of the time series data processing apparatus according to the third embodiment.
本実施形態における時系列データ処理装置は、上述した実施形態1において説明した図4に示す構成と同様の構成をとっている。但し、本実施形態では、時系列データである異常度グラフから異常状態を検出するときに着目するパラメータが、実施形態1,2とは異なる。例えば、本実施形態では、図17に示すように、異常度グラフにおける「異常度」(所定のパラメータ)と「単位時間あたりの異常度の上昇回数」(他のパラメータ)との組み合わせに基づいて、異常状態を検出することとする。
The time-series data processing apparatus in this embodiment has the same configuration as that shown in FIG. 4 described in the above-described first embodiment. However, in the present embodiment, the parameters to be focused on when detecting the abnormal state from the abnormality degree graph which is the time series data are different from those in the first and second embodiments. For example, in the present embodiment, as shown in FIG. 17, based on the combination of "abnormality" (predetermined parameter) and "number of increases in abnormality per unit time" (other parameters) in the abnormality graph. , It is decided to detect an abnormal state.
このため、本実施形態では、抽出手段12は、異常度グラフの正常期間において、「異常度」と「単位時間あたりの異常度の上昇回数」との組み合わせを最小被覆値(正常期間最大値)として抽出する。例えば、図17に示すように、異常度グラフ上に単位時間あたりのウインドウWを設定してスライドさせ、ウインドウW内における「異常度」の値と、その異常度の値までの「上昇回数」と、を最小被覆値として抽出する。このとき、「異常度」毎に、「上昇回数」の最大値の組み合わせを、最小被覆値として抽出する。また、同様に、異常度グラフの異常期間において、「異常度」と「単位時間あたりの異常度の上昇回数」との組み合わせを最大被覆値(異常期間最大値)として抽出する。
Therefore, in the present embodiment, the extraction means 12 sets the combination of the “abnormality” and the “number of increases in the abnormality per unit time” as the minimum covering value (maximum value in the normal period) in the normal period of the abnormality graph. Extract as. For example, as shown in FIG. 17, a window W per unit time is set on the abnormality degree graph and slid, and the value of the “abnormality degree” in the window W and the “number of rises” up to the value of the abnormality degree. And are extracted as the minimum coating value. At this time, the combination of the maximum values of the "number of rises" is extracted as the minimum coating value for each "abnormality degree". Similarly, in the abnormal period of the abnormality degree graph, the combination of the “abnormality degree” and the “number of increases in the abnormality degree per unit time” is extracted as the maximum covering value (abnormality period maximum value).
そして、上述したように抽出した最小被覆値のうちいずれかを、閾値として決定する。このとき、各最小被覆値の各最大被覆値に対する余裕度合い(異常度の余裕、上昇回数の余裕)を算出して、閾値とする最小被覆値を決定してもよく、いかなる方法で決定してもよい。これにより、「異常度」の閾値と、「単位時間あたりの異常度の上昇回数」の閾値と、の組み合わせによる閾値を設定することができる。
Then, one of the minimum coating values extracted as described above is determined as the threshold value. At this time, the minimum coating value as a threshold value may be determined by calculating the margin degree (margin of the degree of abnormality, the margin of the number of increases) for each maximum coating value of each minimum coating value, and it is determined by any method. May be good. Thereby, it is possible to set the threshold value by the combination of the threshold value of the "abnormality degree" and the threshold value of the "number of times the abnormality degree increases per unit time".
但し、本発明において、時系列データである異常度グラフから異常状態を検出するときに着目するパラメータはいかなるパラメータであってもよい。これに伴い、最小被覆値や最大被覆値として抽出するパラメータの組み合わせも、いかなるパラメータであってもよい。例えば、パラメータの組み合わせとして、異常度グラフ中における単位時間当たりの異常度の累積値と、設定された閾値を累積値が超えた回数、を用いてもよい。また、パラメータの組み合わせとして、異常度の単位時間当たりの変化率と、設定された閾値を変化率が超えた回数、を用いてもよい。
However, in the present invention, the parameter to be focused on when detecting the abnormal state from the abnormality degree graph which is time series data may be any parameter. Along with this, the combination of parameters extracted as the minimum coating value and the maximum coating value may be any parameter. For example, as a combination of parameters, the cumulative value of the degree of abnormality per unit time in the degree of abnormality graph and the number of times the cumulative value exceeds the set threshold value may be used. Further, as a combination of parameters, the rate of change of the degree of abnormality per unit time and the number of times the rate of change exceeds the set threshold value may be used.
また、上述した実施形態では、時系列データとして異常度グラフを用いているが、時系列データは必ずしも異常度グラフであることに限定されず、いかなるパラメータを含む時系列データであってもよい。例えば、計測対象Pから計測した所定のデータ項目の計測値自体を時系列データとして扱い、かかる時系列データに対して上述同様に最小被覆値の抽出処理等を行って、異常判定の閾値を設定してもよい。
Further, in the above-described embodiment, the abnormality degree graph is used as the time series data, but the time series data is not necessarily limited to the abnormality degree graph, and may be time series data including any parameter. For example, the measured value itself of a predetermined data item measured from the measurement target P is treated as time-series data, and the minimum covering value is extracted from the time-series data in the same manner as described above to set the threshold value for abnormality determination. You may.
<実施形態4>
次に、本発明の第4の実施形態を、図18乃至図20を参照して説明する。図18乃至図19は、実施形態4における時系列データ処理装置の構成を示すブロック図であり、図20は、時系列データ処理装置の動作を示すフローチャートである。なお、本実施形態では、上述した各実施形態で説明した時系列データ処理装置及び時系列データ処理方法の構成の概略を示している。 <Embodiment 4>
Next, a fourth embodiment of the present invention will be described with reference to FIGS. 18 to 20. 18 to 19 are block diagrams showing the configuration of the time-series data processing device according to the fourth embodiment, and FIG. 20 is a flowchart showing the operation of the time-series data processing device. In this embodiment, the outline of the configuration of the time-series data processing apparatus and the time-series data processing method described in each of the above-described embodiments is shown.
次に、本発明の第4の実施形態を、図18乃至図20を参照して説明する。図18乃至図19は、実施形態4における時系列データ処理装置の構成を示すブロック図であり、図20は、時系列データ処理装置の動作を示すフローチャートである。なお、本実施形態では、上述した各実施形態で説明した時系列データ処理装置及び時系列データ処理方法の構成の概略を示している。 <
Next, a fourth embodiment of the present invention will be described with reference to FIGS. 18 to 20. 18 to 19 are block diagrams showing the configuration of the time-series data processing device according to the fourth embodiment, and FIG. 20 is a flowchart showing the operation of the time-series data processing device. In this embodiment, the outline of the configuration of the time-series data processing apparatus and the time-series data processing method described in each of the above-described embodiments is shown.
まず、図18を参照して、本実施形態における時系列データ処理装置100のハードウェア構成を説明する。時系列データ処理装置100は、一般的な情報処理装置にて構成されており、一例として、以下のようなハードウェア構成を装備している。
・CPU(Central Processing Unit)101(演算装置)
・ROM(Read Only Memory)102(記憶装置)
・RAM(Random Access Memory)103(記憶装置)
・RAM303にロードされるプログラム群104
・プログラム群304を格納する記憶装置105
・情報処理装置外部の記憶媒体110の読み書きを行うドライブ装置106
・情報処理装置外部の通信ネットワーク111と接続する通信インタフェース107
・データの入出力を行う入出力インタフェース108
・各構成要素を接続するバス109 First, the hardware configuration of the time-seriesdata processing device 100 according to the present embodiment will be described with reference to FIG. The time-series data processing device 100 is composed of a general information processing device, and is equipped with the following hardware configuration as an example.
-CPU (Central Processing Unit) 101 (arithmetic unit)
-ROM (Read Only Memory) 102 (storage device)
-RAM (Random Access Memory) 103 (storage device)
-Program group 104 loaded into RAM 303
Astorage device 105 that stores the program group 304.
Adrive device 106 that reads and writes the storage medium 110 external to the information processing device.
-Communication interface 107 that connects to the communication network 111 outside the information processing device
-I /O interface 108 for inputting / outputting data
-Bus 109 connecting each component
・CPU(Central Processing Unit)101(演算装置)
・ROM(Read Only Memory)102(記憶装置)
・RAM(Random Access Memory)103(記憶装置)
・RAM303にロードされるプログラム群104
・プログラム群304を格納する記憶装置105
・情報処理装置外部の記憶媒体110の読み書きを行うドライブ装置106
・情報処理装置外部の通信ネットワーク111と接続する通信インタフェース107
・データの入出力を行う入出力インタフェース108
・各構成要素を接続するバス109 First, the hardware configuration of the time-series
-CPU (Central Processing Unit) 101 (arithmetic unit)
-ROM (Read Only Memory) 102 (storage device)
-RAM (Random Access Memory) 103 (storage device)
-
A
A
-
-I /
-Bus 109 connecting each component
そして、時系列データ処理装置100は、プログラム群104をCPU101が取得して当該CPU101が実行することで、図19に示す抽出手段121を構築して装備することができる。なお、プログラム群104は、例えば、予め記憶装置105やROM102に格納されており、必要に応じてCPU101がRAM103にロードして実行する。また、プログラム群104は、通信ネットワーク111を介してCPU101に供給されてもよいし、予め記憶媒体110に格納されており、ドライブ装置106が該プログラムを読み出してCPU101に供給してもよい。但し、上述した抽出手段121は、電子回路で構築されるものであってもよい。
Then, the time-series data processing device 100 can construct and equip the extraction means 121 shown in FIG. 19 by the CPU 101 acquiring the program group 104 and executing the program group 104. The program group 104 is stored in, for example, a storage device 105 or a ROM 102 in advance, and the CPU 101 loads the program group 104 into the RAM 103 and executes the program group 104 as needed. Further, the program group 104 may be supplied to the CPU 101 via the communication network 111, or may be stored in the storage medium 110 in advance, and the drive device 106 may read the program and supply the program to the CPU 101. However, the extraction means 121 described above may be constructed by an electronic circuit.
なお、図18は、時系列データ処理装置100である情報処理装置のハードウェア構成の一例を示しており、情報処理装置のハードウェア構成は上述した場合に限定されない。例えば、情報処理装置は、ドライブ装置106を有さないなど、上述した構成の一部から構成されてもよい。
Note that FIG. 18 shows an example of the hardware configuration of the information processing device which is the time series data processing device 100, and the hardware configuration of the information processing device is not limited to the above case. For example, the information processing device may be composed of a part of the above-described configuration, such as not having the drive device 106.
そして、時系列データ処理装置100は、上述したようにプログラムによって構築された抽出手段121の機能により、図20のフローチャートに示す時系列データ処理方法を実行する。
Then, the time-series data processing device 100 executes the time-series data processing method shown in the flowchart of FIG. 20 by the function of the extraction means 121 constructed by the program as described above.
図20に示すように、時系列データ処理装置100は、
計測対象から計測されたデータに基づく複数のパラメータを含む時系列データのうち、計測対象が正常状態と判定された期間の時系列データである正常期間時系列データから、複数のパラメータの組み合わせのうち所定のパラメータの値に対する他のパラメータの値が最大となる組み合わせを正常期間最大値として抽出する(ステップS1)、
という処理を実行する。 As shown in FIG. 20, the time seriesdata processing device 100 is
Of the time series data including multiple parameters based on the data measured from the measurement target, among the combination of multiple parameters from the normal period time series data which is the time series data of the period when the measurement target is determined to be in the normal state. The combination in which the values of the other parameters are maximized with respect to the values of the predetermined parameters is extracted as the maximum value in the normal period (step S1).
Is executed.
計測対象から計測されたデータに基づく複数のパラメータを含む時系列データのうち、計測対象が正常状態と判定された期間の時系列データである正常期間時系列データから、複数のパラメータの組み合わせのうち所定のパラメータの値に対する他のパラメータの値が最大となる組み合わせを正常期間最大値として抽出する(ステップS1)、
という処理を実行する。 As shown in FIG. 20, the time series
Of the time series data including multiple parameters based on the data measured from the measurement target, among the combination of multiple parameters from the normal period time series data which is the time series data of the period when the measurement target is determined to be in the normal state. The combination in which the values of the other parameters are maximized with respect to the values of the predetermined parameters is extracted as the maximum value in the normal period (step S1).
Is executed.
本発明は、以上のように構成されることにより、複数のパラメータを含む時系列データのうち、計測対象が正常状態であるときのデータから、あるパラメータが最大となる値を閾値の候補として抽出している。このため、計測対象の異常状態におけるデータを用いることなく閾値の候補を抽出することができ、適切な閾値を決定することができる。
The present invention is configured as described above, and among the time series data including a plurality of parameters, the value at which a certain parameter is maximized is extracted as a threshold candidate from the data when the measurement target is in the normal state. doing. Therefore, threshold candidates can be extracted without using the data in the abnormal state of the measurement target, and an appropriate threshold can be determined.
<付記>
上記実施形態の一部又は全部は、以下の付記のようにも記載されうる。以下、本発明における時系列データ処理方法、時系列データ処理装置、プログラムの構成の概略を説明する。但し、本発明は、以下の構成に限定されない。 <Additional notes>
Part or all of the above embodiments may also be described as in the appendix below. Hereinafter, the outline of the time-series data processing method, the time-series data processing apparatus, and the program configuration in the present invention will be described. However, the present invention is not limited to the following configurations.
(付記1)
計測対象から計測されたデータに基づく複数のパラメータを含む時系列データのうち、前記計測対象が正常状態と判定された期間の時系列データである正常期間時系列データから、複数のパラメータの組み合わせのうち所定のパラメータの値に対する他のパラメータの値が最大となる組み合わせを正常期間最大値として抽出する、
時系列データ処理方法。 (Appendix 1)
Of the time-series data including a plurality of parameters based on the data measured from the measurement target, the combination of a plurality of parameters is selected from the normal period time-series data which is the time-series data of the period in which the measurement target is determined to be in the normal state. Of these, the combination that maximizes the value of the other parameter with respect to the value of the predetermined parameter is extracted as the maximum value during the normal period.
Time series data processing method.
(付記2)
付記1に記載の時系列データ処理方法であって、
前記正常期間時系列データから、前記所定のパラメータの値ごとに前記他のパラメータの値が最大となる複数のパラメータの組み合わせを、前記正常期間最大値として抽出する、
時系列データ処理方法。 (Appendix 2)
The time-series data processing method described inAppendix 1
From the normal period time series data, a combination of a plurality of parameters having the maximum value of the other parameter for each value of the predetermined parameter is extracted as the maximum value of the normal period.
Time series data processing method.
付記1に記載の時系列データ処理方法であって、
前記正常期間時系列データから、前記所定のパラメータの値ごとに前記他のパラメータの値が最大となる複数のパラメータの組み合わせを、前記正常期間最大値として抽出する、
時系列データ処理方法。 (Appendix 2)
The time-series data processing method described in
From the normal period time series data, a combination of a plurality of parameters having the maximum value of the other parameter for each value of the predetermined parameter is extracted as the maximum value of the normal period.
Time series data processing method.
(付記3)
付記2に記載の時系列データ処理方法であって、
前記他のパラメータの値が同一である前記正常期間最大値のうち、前記所定のパラメータが最小である値を含む複数のパラメータの組み合わせ以外を、前記正常期間最大値から除外する、
時系列データ処理方法。 (Appendix 3)
The time-series data processing method described in Appendix 2,
Among the maximum values of the normal period in which the values of the other parameters are the same, a combination of a plurality of parameters including a value in which the predetermined parameter is the minimum is excluded from the maximum value of the normal period.
Time series data processing method.
(付記4)
付記1乃至3のいずれかに記載の時系列データ処理方法であって、
前記正常期間最大値のうちいずれかを、複数のパラメータを含む時系列データにおいて前記計測対象が異常状態であることを判定するための閾値とする、
時系列データ処理方法。 (Appendix 4)
The time-series data processing method according to any one ofSupplementary notes 1 to 3.
One of the maximum values during the normal period is set as a threshold value for determining that the measurement target is in an abnormal state in time series data including a plurality of parameters.
Time series data processing method.
付記1乃至3のいずれかに記載の時系列データ処理方法であって、
前記正常期間最大値のうちいずれかを、複数のパラメータを含む時系列データにおいて前記計測対象が異常状態であることを判定するための閾値とする、
時系列データ処理方法。 (Appendix 4)
The time-series data processing method according to any one of
One of the maximum values during the normal period is set as a threshold value for determining that the measurement target is in an abnormal state in time series data including a plurality of parameters.
Time series data processing method.
(付記5)
付記4に記載の時系列データ処理方法であって、
前記時系列データのうち前記計測対象が異常状態と判定された期間の時系列データである異常期間時系列データから、複数のパラメータの組み合わせのうち前記所定のパラメータに対する前記他のパラメータが最大となる組み合わせを異常期間最大値として抽出し、
前記正常期間最大値と前記異常期間最大値とに基づいて、前記正常期間最大値のうちいずれかを前記閾値とする、
時系列データ処理方法。 (Appendix 5)
The time-series data processing method described inAppendix 4,
From the abnormal period time-series data, which is the time-series data of the period during which the measurement target is determined to be in an abnormal state among the time-series data, the other parameter with respect to the predetermined parameter among the combination of a plurality of parameters becomes the maximum. Extract the combination as the maximum value during the abnormal period,
Based on the normal period maximum value and the abnormal period maximum value, any one of the normal period maximum values is set as the threshold value.
Time series data processing method.
付記4に記載の時系列データ処理方法であって、
前記時系列データのうち前記計測対象が異常状態と判定された期間の時系列データである異常期間時系列データから、複数のパラメータの組み合わせのうち前記所定のパラメータに対する前記他のパラメータが最大となる組み合わせを異常期間最大値として抽出し、
前記正常期間最大値と前記異常期間最大値とに基づいて、前記正常期間最大値のうちいずれかを前記閾値とする、
時系列データ処理方法。 (Appendix 5)
The time-series data processing method described in
From the abnormal period time-series data, which is the time-series data of the period during which the measurement target is determined to be in an abnormal state among the time-series data, the other parameter with respect to the predetermined parameter among the combination of a plurality of parameters becomes the maximum. Extract the combination as the maximum value during the abnormal period,
Based on the normal period maximum value and the abnormal period maximum value, any one of the normal period maximum values is set as the threshold value.
Time series data processing method.
(付記6)
付記5に記載の時系列データ処理方法であって、
前記異常期間時系列データから、前記所定のパラメータの値ごとに前記他のパラメータの値が最大となる複数のパラメータの組み合わせを、前記異常期間最大値として抽出する、
時系列データ処理方法。 (Appendix 6)
The time-series data processing method described inAppendix 5.
From the abnormal period time series data, a combination of a plurality of parameters having the maximum value of the other parameter for each value of the predetermined parameter is extracted as the abnormal period maximum value.
Time series data processing method.
付記5に記載の時系列データ処理方法であって、
前記異常期間時系列データから、前記所定のパラメータの値ごとに前記他のパラメータの値が最大となる複数のパラメータの組み合わせを、前記異常期間最大値として抽出する、
時系列データ処理方法。 (Appendix 6)
The time-series data processing method described in
From the abnormal period time series data, a combination of a plurality of parameters having the maximum value of the other parameter for each value of the predetermined parameter is extracted as the abnormal period maximum value.
Time series data processing method.
(付記7)
付記5又は6に記載の時系列データ処理方法であって、
前記計測対象の異常状態毎の前記異常期間時系列データから、前記計測対象の異常状態毎における前記異常期間最大値を抽出する、
時系列データ処理方法。 (Appendix 7)
The time-series data processing method according toAppendix 5 or 6.
From the abnormal period time series data for each abnormal state of the measurement target, the maximum value of the abnormal period for each abnormal state of the measurement target is extracted.
Time series data processing method.
付記5又は6に記載の時系列データ処理方法であって、
前記計測対象の異常状態毎の前記異常期間時系列データから、前記計測対象の異常状態毎における前記異常期間最大値を抽出する、
時系列データ処理方法。 (Appendix 7)
The time-series data processing method according to
From the abnormal period time series data for each abnormal state of the measurement target, the maximum value of the abnormal period for each abnormal state of the measurement target is extracted.
Time series data processing method.
(付記8)
付記5乃至7のいずれかに記載の時系列データ処理方法であって、
前記正常期間最大値のそれぞれにおけるいずれかのパラメータについて、前記異常期間最大値のそれぞれにおけるいずれかのパラメータに対する割合に基づく値である余裕値を算出し、
前記余裕値に基づいて前記正常期間最大値のうちいずれかを前記閾値とする、
時系列データ処理方法。 (Appendix 8)
The time-series data processing method according to any one ofAppendix 5 to 7.
For any of the parameters in each of the maximum values of the normal period, a margin value which is a value based on the ratio of the maximum value of the abnormal period to any parameter is calculated.
One of the maximum values during the normal period is set as the threshold value based on the margin value.
Time series data processing method.
付記5乃至7のいずれかに記載の時系列データ処理方法であって、
前記正常期間最大値のそれぞれにおけるいずれかのパラメータについて、前記異常期間最大値のそれぞれにおけるいずれかのパラメータに対する割合に基づく値である余裕値を算出し、
前記余裕値に基づいて前記正常期間最大値のうちいずれかを前記閾値とする、
時系列データ処理方法。 (Appendix 8)
The time-series data processing method according to any one of
For any of the parameters in each of the maximum values of the normal period, a margin value which is a value based on the ratio of the maximum value of the abnormal period to any parameter is calculated.
One of the maximum values during the normal period is set as the threshold value based on the margin value.
Time series data processing method.
(付記9)
付記1乃至8のいずれかに記載の時系列データ処理方法であって、
前記他のパラメータを、前記計測されたデータから算出された前記計測対象が異常状態である度合いを表す値である異常度とし、前記所定のパラメータを、前記異常度の値が継続する期間とする、
時系列データ処理方法。 (Appendix 9)
The time-series data processing method according to any one ofAppendix 1 to 8.
The other parameter is an abnormality degree which is a value indicating the degree to which the measurement target is in an abnormal state calculated from the measured data, and the predetermined parameter is a period during which the value of the abnormality degree continues. ,
Time series data processing method.
付記1乃至8のいずれかに記載の時系列データ処理方法であって、
前記他のパラメータを、前記計測されたデータから算出された前記計測対象が異常状態である度合いを表す値である異常度とし、前記所定のパラメータを、前記異常度の値が継続する期間とする、
時系列データ処理方法。 (Appendix 9)
The time-series data processing method according to any one of
The other parameter is an abnormality degree which is a value indicating the degree to which the measurement target is in an abnormal state calculated from the measured data, and the predetermined parameter is a period during which the value of the abnormality degree continues. ,
Time series data processing method.
(付記10)
計測対象から計測されたデータに基づく複数のパラメータを含む時系列データのうち、前記計測対象が正常状態と判定された期間の時系列データである正常期間時系列データから、複数のパラメータの組み合わせのうち所定のパラメータの値に対する他のパラメータの値が最大となる組み合わせを正常期間最大値として抽出する抽出手段、
を備えた時系列データ処理装置。 (Appendix 10)
Of the time-series data including a plurality of parameters based on the data measured from the measurement target, the combination of a plurality of parameters is selected from the normal period time-series data which is the time-series data of the period in which the measurement target is determined to be in the normal state. An extraction means that extracts the combination that maximizes the values of other parameters with respect to the value of a predetermined parameter as the maximum value during the normal period.
Time series data processing device equipped with.
(付記11)
付記10に記載の時系列データ処理装置であって、
前記正常期間最大値のうちいずれかを、複数のパラメータを含む時系列データにおいて前記計測対象が異常状態であることを判定するための閾値とする算出手段を備えた、
時系列データ処理装置。 (Appendix 11)
The time-series data processing apparatus according toAppendix 10.
A calculation means is provided for setting any one of the maximum values during the normal period as a threshold value for determining that the measurement target is in an abnormal state in time series data including a plurality of parameters.
Time series data processing device.
付記10に記載の時系列データ処理装置であって、
前記正常期間最大値のうちいずれかを、複数のパラメータを含む時系列データにおいて前記計測対象が異常状態であることを判定するための閾値とする算出手段を備えた、
時系列データ処理装置。 (Appendix 11)
The time-series data processing apparatus according to
A calculation means is provided for setting any one of the maximum values during the normal period as a threshold value for determining that the measurement target is in an abnormal state in time series data including a plurality of parameters.
Time series data processing device.
(付記12)
付記11に記載の時系列データ処理装置であって、
前記抽出手段は、前記時系列データのうち前記計測対象が異常状態と判定された期間の時系列データである異常期間時系列データから、複数のパラメータの組み合わせのうち前記所定のパラメータに対する前記他のパラメータが最大となる組み合わせを異常期間最大値として抽出し、
前記算出手段は、前記正常期間最大値と前記異常期間最大値とに基づいて、前記正常期間最大値のうちいずれかを前記閾値とする、
時系列データ処理装置。 (Appendix 12)
The time-series data processing apparatus according toAppendix 11,
The extraction means refers to the other of the combination of a plurality of parameters with respect to the predetermined parameter from the abnormal period time series data which is the time series data of the period during which the measurement target is determined to be in the abnormal state among the time series data. Extract the combination with the maximum parameter as the maximum value during the abnormal period,
The calculation means sets any one of the normal period maximum values as the threshold value based on the normal period maximum value and the abnormal period maximum value.
Time series data processing device.
付記11に記載の時系列データ処理装置であって、
前記抽出手段は、前記時系列データのうち前記計測対象が異常状態と判定された期間の時系列データである異常期間時系列データから、複数のパラメータの組み合わせのうち前記所定のパラメータに対する前記他のパラメータが最大となる組み合わせを異常期間最大値として抽出し、
前記算出手段は、前記正常期間最大値と前記異常期間最大値とに基づいて、前記正常期間最大値のうちいずれかを前記閾値とする、
時系列データ処理装置。 (Appendix 12)
The time-series data processing apparatus according to
The extraction means refers to the other of the combination of a plurality of parameters with respect to the predetermined parameter from the abnormal period time series data which is the time series data of the period during which the measurement target is determined to be in the abnormal state among the time series data. Extract the combination with the maximum parameter as the maximum value during the abnormal period,
The calculation means sets any one of the normal period maximum values as the threshold value based on the normal period maximum value and the abnormal period maximum value.
Time series data processing device.
(付記13)
付記12に記載の時系列データ処理装置であって、
前記算出手段は、前記正常期間最大値のそれぞれにおけるいずれかのパラメータについて、前記異常期間最大値のそれぞれにおけるいずれかのパラメータに対する割合に基づく値である余裕値を算出し、当該余裕値に基づいて前記正常期間最大値のうちいずれかを前記閾値とする、
時系列データ処理装置。 (Appendix 13)
The time-series data processing apparatus according toAppendix 12,
The calculation means calculates a margin value which is a value based on the ratio of the abnormal period maximum value to any parameter for any parameter in each of the normal period maximum values, and based on the margin value. One of the maximum values during the normal period is set as the threshold value.
Time series data processing device.
付記12に記載の時系列データ処理装置であって、
前記算出手段は、前記正常期間最大値のそれぞれにおけるいずれかのパラメータについて、前記異常期間最大値のそれぞれにおけるいずれかのパラメータに対する割合に基づく値である余裕値を算出し、当該余裕値に基づいて前記正常期間最大値のうちいずれかを前記閾値とする、
時系列データ処理装置。 (Appendix 13)
The time-series data processing apparatus according to
The calculation means calculates a margin value which is a value based on the ratio of the abnormal period maximum value to any parameter for any parameter in each of the normal period maximum values, and based on the margin value. One of the maximum values during the normal period is set as the threshold value.
Time series data processing device.
(付記14)
情報処理装置に、
計測対象から計測されたデータに基づく複数のパラメータを含む時系列データのうち、前記計測対象が正常状態と判定された期間の時系列データである正常期間時系列データから、複数のパラメータの組み合わせのうち所定のパラメータに対する他のパラメータが最大となる組み合わせを正常期間最大値として抽出する抽出手段、
を実現させるためのプログラム。 (Appendix 14)
For information processing equipment
Of the time-series data including a plurality of parameters based on the data measured from the measurement target, the combination of a plurality of parameters is selected from the normal period time-series data which is the time-series data of the period in which the measurement target is determined to be in the normal state. An extraction means that extracts the combination that maximizes the other parameters for a predetermined parameter as the maximum value during the normal period.
A program to realize.
(付記15)
付記14に記載のプログラムであって、
前記情報処理装置に、さらに、
前記正常期間最大値のうちいずれかを、複数のパラメータを含む時系列データにおいて前記計測対象が異常状態であることを判定するための閾値とする算出手段、
を実現させるためのプログラム。 (Appendix 15)
The program described inAppendix 14,
In addition to the information processing device,
A calculation means, in which any one of the maximum values during the normal period is used as a threshold value for determining that the measurement target is in an abnormal state in time-series data including a plurality of parameters.
A program to realize.
付記14に記載のプログラムであって、
前記情報処理装置に、さらに、
前記正常期間最大値のうちいずれかを、複数のパラメータを含む時系列データにおいて前記計測対象が異常状態であることを判定するための閾値とする算出手段、
を実現させるためのプログラム。 (Appendix 15)
The program described in
In addition to the information processing device,
A calculation means, in which any one of the maximum values during the normal period is used as a threshold value for determining that the measurement target is in an abnormal state in time-series data including a plurality of parameters.
A program to realize.
(付記16)
計測対象から計測されたデータに基づく複数のパラメータを含む時系列データのうち、前記計測対象が正常状態と判定された期間の時系列データである正常期間時系列データから、複数のパラメータの組み合わせのうち所定のパラメータの値に対する他のパラメータの値が最大となる組み合わせを正常期間最大値として抽出する抽出手段、
を備えた時系列データ処理システム。 (Appendix 16)
Of the time-series data including a plurality of parameters based on the data measured from the measurement target, the combination of a plurality of parameters is selected from the normal period time-series data which is the time-series data of the period in which the measurement target is determined to be in the normal state. An extraction means that extracts the combination that maximizes the values of other parameters with respect to the value of a predetermined parameter as the maximum value during the normal period.
Time series data processing system equipped with.
(付記17)
付記16に記載の時系列データ処理システムであって、
前記正常期間最大値のうちいずれかを、複数のパラメータを含む時系列データにおいて前記計測対象が異常状態であることを判定するための閾値とする算出手段を備えた、
時系列データ処理システム。 (Appendix 17)
The time-series data processing system according toAppendix 16.
A calculation means is provided for setting any one of the maximum values during the normal period as a threshold value for determining that the measurement target is in an abnormal state in time series data including a plurality of parameters.
Time series data processing system.
付記16に記載の時系列データ処理システムであって、
前記正常期間最大値のうちいずれかを、複数のパラメータを含む時系列データにおいて前記計測対象が異常状態であることを判定するための閾値とする算出手段を備えた、
時系列データ処理システム。 (Appendix 17)
The time-series data processing system according to
A calculation means is provided for setting any one of the maximum values during the normal period as a threshold value for determining that the measurement target is in an abnormal state in time series data including a plurality of parameters.
Time series data processing system.
(付記18)
付記17に記載の時系列データ処理システムであって、
前記抽出手段は、前記時系列データのうち前記計測対象が異常状態と判定された期間の時系列データである異常期間時系列データから、複数のパラメータの組み合わせのうち前記所定のパラメータに対する前記他のパラメータが最大となる組み合わせを異常期間最大値として抽出し、
前記算出手段は、前記正常期間最大値と前記異常期間最大値とに基づいて、前記正常期間最大値のうちいずれかを前記閾値とする、
時系列データ処理システム。 (Appendix 18)
The time-series data processing system described in Appendix 17,
The extraction means refers to the other of the combination of a plurality of parameters with respect to the predetermined parameter from the abnormal period time series data which is the time series data of the period during which the measurement target is determined to be in the abnormal state among the time series data. Extract the combination with the maximum parameter as the maximum value during the abnormal period,
The calculation means sets any one of the normal period maximum values as the threshold value based on the normal period maximum value and the abnormal period maximum value.
Time series data processing system.
(付記19)
付記18に記載の時系列データ処理システムであって、
前記算出手段は、前記正常期間最大値のそれぞれにおけるいずれかのパラメータについて、前記異常期間最大値のそれぞれにおけるいずれかのパラメータに対する割合に基づく値である余裕値を算出し、当該余裕値に基づいて前記正常期間最大値のうちいずれかを前記閾値とする、
時系列データ処理システム。 (Appendix 19)
The time-series data processing system described in Appendix 18,
The calculation means calculates a margin value which is a value based on the ratio of the abnormal period maximum value to any parameter for any parameter in each of the normal period maximum values, and based on the margin value. One of the maximum values during the normal period is set as the threshold value.
Time series data processing system.
なお、上述したプログラムは、様々なタイプの非一時的なコンピュータ可読媒体(non-transitory computer readable medium)を用いて格納され、コンピュータに供給することができる。非一時的なコンピュータ可読媒体は、様々なタイプの実体のある記録媒体(tangible storage medium)を含む。非一時的なコンピュータ可読媒体の例は、磁気記録媒体(例えばフレキシブルディスク、磁気テープ、ハードディスクドライブ)、光磁気記録媒体(例えば光磁気ディスク)、CD-ROM(Read Only Memory)、CD-R、CD-R/W、半導体メモリ(例えば、マスクROM、PROM(Programmable ROM)、EPROM(Erasable PROM)、フラッシュROM、RAM(Random Access Memory))を含む。また、プログラムは、様々なタイプの一時的なコンピュータ可読媒体(transitory computer readable medium)によってコンピュータに供給されてもよい。一時的なコンピュータ可読媒体の例は、電気信号、光信号、及び電磁波を含む。一時的なコンピュータ可読媒体は、電線及び光ファイバ等の有線通信路、又は無線通信路を介して、プログラムをコンピュータに供給できる。
The above-mentioned program can be stored and supplied to a computer using various types of non-transitory computer readable medium. Non-temporary computer-readable media include various types of tangible storage media. Examples of non-temporary computer-readable media include magnetic recording media (eg, flexible disks, magnetic tapes, hard disk drives), magneto-optical recording media (eg, magneto-optical disks), CD-ROMs (Read Only Memory), CD-Rs, Includes CD-R / W, semiconductor memory (for example, mask ROM, PROM (Programmable ROM), EPROM (Erasable PROM), flash ROM, RAM (RandomAccessMemory)). The program may also be supplied to the computer by various types of temporary computer readable media. Examples of temporary computer-readable media include electrical, optical, and electromagnetic waves. The temporary computer-readable medium can supply the program to the computer via a wired communication path such as an electric wire and an optical fiber, or a wireless communication path.
以上、上記実施形態等を参照して本願発明を説明したが、本願発明は、上述した実施形態に限定されるものではない。本願発明の構成や詳細には、本願発明の範囲内で当業者が理解しうる様々な変更をすることができる。また、上述した取得手段、抽出手段、算出手段、計測データ記憶手段、閾値記憶手段の機能のうちの少なくとも一以上の機能は、ネットワーク上のいかなる場所に設置され接続された情報処理装置で実行されてもよく、つまり、いわゆるクラウドコンピューティングで実行されてもよい。
Although the invention of the present application has been described above with reference to the above-described embodiment and the like, the present invention is not limited to the above-described embodiment. Various changes that can be understood by those skilled in the art can be made to the structure and details of the present invention within the scope of the present invention. Further, at least one or more of the functions of the acquisition means, the extraction means, the calculation means, the measurement data storage means, and the threshold storage means described above are executed by an information processing device installed and connected to any place on the network. That is, it may be executed by so-called cloud computing.
10 時系列データ処理装置
11 取得手段
11a 異常度算出手段
11b 生成手段
12 抽出手段
13 算出手段
14 監視手段
14a 分析手段
14b 判定手段
14c 出力手段
15 計測データ記憶手段
16 閾値記憶手段
100 時系列データ処理装置
101 CPU
102 ROM
103 RAM
104 プログラム群
105 記憶装置
106 ドライブ装置
107 通信インタフェース
108 入出力インタフェース
109 バス
110 記憶媒体
111 通信ネットワーク
121 抽出手段
10 Time-seriesdata processing device 11 Acquisition means 11a Abnormality calculation means 11b Generation means 12 Extraction means 13 Calculation means 14 Monitoring means 14a Analysis means 14b Judgment means 14c Output means 15 Measurement data storage means 16 Threshold storage means 100 Time-series data processing device 101 CPU
102 ROM
103 RAM
104Program group 105 Storage device 106 Drive device 107 Communication interface 108 Input / output interface 109 Bus 110 Storage medium 111 Communication network 121 Extraction means
11 取得手段
11a 異常度算出手段
11b 生成手段
12 抽出手段
13 算出手段
14 監視手段
14a 分析手段
14b 判定手段
14c 出力手段
15 計測データ記憶手段
16 閾値記憶手段
100 時系列データ処理装置
101 CPU
102 ROM
103 RAM
104 プログラム群
105 記憶装置
106 ドライブ装置
107 通信インタフェース
108 入出力インタフェース
109 バス
110 記憶媒体
111 通信ネットワーク
121 抽出手段
10 Time-series
102 ROM
103 RAM
104
Claims (15)
- 計測対象から計測されたデータに基づく複数のパラメータを含む時系列データのうち、前記計測対象が正常状態と判定された期間の時系列データである正常期間時系列データから、複数のパラメータの組み合わせのうち所定のパラメータの値に対する他のパラメータの値が最大となる組み合わせを正常期間最大値として抽出する、
時系列データ処理方法。 Of the time-series data including a plurality of parameters based on the data measured from the measurement target, the combination of a plurality of parameters is selected from the normal period time-series data which is the time-series data of the period in which the measurement target is determined to be in the normal state. Of these, the combination that maximizes the value of the other parameter with respect to the value of the predetermined parameter is extracted as the maximum value during the normal period.
Time series data processing method. - 請求項1に記載の時系列データ処理方法であって、
前記正常期間時系列データから、前記所定のパラメータの値ごとに前記他のパラメータの値が最大となる複数のパラメータの組み合わせを、前記正常期間最大値として抽出する、
時系列データ処理方法。 The time-series data processing method according to claim 1.
From the normal period time series data, a combination of a plurality of parameters having the maximum value of the other parameter for each value of the predetermined parameter is extracted as the maximum value of the normal period.
Time series data processing method. - 請求項2に記載の時系列データ処理方法であって、
前記他のパラメータの値が同一である前記正常期間最大値のうち、前記所定のパラメータが最小である値を含む複数のパラメータの組み合わせ以外を、前記正常期間最大値から除外する、
時系列データ処理方法。 The time series data processing method according to claim 2.
Among the maximum values of the normal period in which the values of the other parameters are the same, a combination of a plurality of parameters including a value in which the predetermined parameter is the minimum is excluded from the maximum value of the normal period.
Time series data processing method. - 請求項1乃至3のいずれかに記載の時系列データ処理方法であって、
前記正常期間最大値のうちいずれかを、複数のパラメータを含む時系列データにおいて前記計測対象が異常状態であることを判定するための閾値とする、
時系列データ処理方法。 The time-series data processing method according to any one of claims 1 to 3.
One of the maximum values during the normal period is set as a threshold value for determining that the measurement target is in an abnormal state in time series data including a plurality of parameters.
Time series data processing method. - 請求項4に記載の時系列データ処理方法であって、
前記時系列データのうち前記計測対象が異常状態と判定された期間の時系列データである異常期間時系列データから、複数のパラメータの組み合わせのうち前記所定のパラメータに対する前記他のパラメータが最大となる組み合わせを異常期間最大値として抽出し、
前記正常期間最大値と前記異常期間最大値とに基づいて、前記正常期間最大値のうちいずれかを前記閾値とする、
時系列データ処理方法。 The time-series data processing method according to claim 4.
From the abnormal period time-series data, which is the time-series data of the period during which the measurement target is determined to be in an abnormal state among the time-series data, the other parameter with respect to the predetermined parameter among the combination of a plurality of parameters becomes the maximum. Extract the combination as the maximum value during the abnormal period,
Based on the normal period maximum value and the abnormal period maximum value, any one of the normal period maximum values is set as the threshold value.
Time series data processing method. - 請求項5に記載の時系列データ処理方法であって、
前記異常期間時系列データから、前記所定のパラメータの値ごとに前記他のパラメータの値が最大となる複数のパラメータの組み合わせを、前記異常期間最大値として抽出する、
時系列データ処理方法。 The time series data processing method according to claim 5.
From the abnormal period time series data, a combination of a plurality of parameters having the maximum value of the other parameter for each value of the predetermined parameter is extracted as the abnormal period maximum value.
Time series data processing method. - 請求項5又は6に記載の時系列データ処理方法であって、
前記計測対象の異常状態毎の前記異常期間時系列データから、前記計測対象の異常状態毎における前記異常期間最大値を抽出する、
時系列データ処理方法。 The time series data processing method according to claim 5 or 6.
From the abnormal period time series data for each abnormal state of the measurement target, the maximum value of the abnormal period for each abnormal state of the measurement target is extracted.
Time series data processing method. - 請求項5乃至7のいずれかに記載の時系列データ処理方法であって、
前記正常期間最大値のそれぞれにおけるいずれかのパラメータについて、前記異常期間最大値のそれぞれにおけるいずれかのパラメータに対する割合に基づく値である余裕値を算出し、
前記余裕値に基づいて前記正常期間最大値のうちいずれかを前記閾値とする、
時系列データ処理方法。 The time-series data processing method according to any one of claims 5 to 7.
For any of the parameters in each of the maximum values of the normal period, a margin value which is a value based on the ratio of the maximum value of the abnormal period to any parameter is calculated.
One of the maximum values during the normal period is set as the threshold value based on the margin value.
Time series data processing method. - 請求項1乃至8のいずれかに記載の時系列データ処理方法であって、
前記他のパラメータを、前記計測されたデータから算出された前記計測対象が異常状態である度合いを表す値である異常度とし、前記所定のパラメータを、前記異常度の値が継続する期間とする、
時系列データ処理方法。 The time-series data processing method according to any one of claims 1 to 8.
The other parameter is an abnormality degree which is a value indicating the degree to which the measurement target is in an abnormal state calculated from the measured data, and the predetermined parameter is a period during which the value of the abnormality degree continues. ,
Time series data processing method. - 計測対象から計測されたデータに基づく複数のパラメータを含む時系列データのうち、前記計測対象が正常状態と判定された期間の時系列データである正常期間時系列データから、複数のパラメータの組み合わせのうち所定のパラメータの値に対する他のパラメータの値が最大となる組み合わせを正常期間最大値として抽出する抽出手段、
を備えた時系列データ処理システム。 Of the time-series data including a plurality of parameters based on the data measured from the measurement target, the combination of a plurality of parameters is selected from the normal period time-series data which is the time-series data of the period in which the measurement target is determined to be in the normal state. An extraction means that extracts the combination that maximizes the values of other parameters with respect to the value of a predetermined parameter as the maximum value during the normal period.
Time series data processing system equipped with. - 請求項10に記載の時系列データ処理システムであって、
前記正常期間最大値のうちいずれかを、複数のパラメータを含む時系列データにおいて前記計測対象が異常状態であることを判定するための閾値とする算出手段を備えた、
時系列データ処理システム。 The time-series data processing system according to claim 10.
A calculation means is provided for setting any one of the maximum values during the normal period as a threshold value for determining that the measurement target is in an abnormal state in time series data including a plurality of parameters.
Time series data processing system. - 請求項11に記載の時系列データ処理システムであって、
前記抽出手段は、前記時系列データのうち前記計測対象が異常状態と判定された期間の時系列データである異常期間時系列データから、複数のパラメータの組み合わせのうち前記所定のパラメータに対する前記他のパラメータが最大となる組み合わせを異常期間最大値として抽出し、
前記算出手段は、前記正常期間最大値と前記異常期間最大値とに基づいて、前記正常期間最大値のうちいずれかを前記閾値とする、
時系列データ処理システム。 The time-series data processing system according to claim 11.
The extraction means refers to the other of the combination of a plurality of parameters with respect to the predetermined parameter from the abnormal period time series data which is the time series data of the period during which the measurement target is determined to be in the abnormal state among the time series data. Extract the combination with the maximum parameter as the maximum value during the abnormal period,
The calculation means sets any one of the normal period maximum values as the threshold value based on the normal period maximum value and the abnormal period maximum value.
Time series data processing system. - 請求項12に記載の時系列データ処理システムであって、
前記算出手段は、前記正常期間最大値のそれぞれにおけるいずれかのパラメータについて、前記異常期間最大値のそれぞれにおけるいずれかのパラメータに対する割合に基づく値である余裕値を算出し、当該余裕値に基づいて前記正常期間最大値のうちいずれかを前記閾値とする、
時系列データ処理システム。 The time-series data processing system according to claim 12.
The calculation means calculates a margin value which is a value based on the ratio of the abnormal period maximum value to any parameter for any parameter in each of the normal period maximum values, and based on the margin value. One of the maximum values during the normal period is set as the threshold value.
Time series data processing system. - 情報処理装置に、
計測対象から計測されたデータに基づく複数のパラメータを含む時系列データのうち、前記計測対象が正常状態と判定された期間の時系列データである正常期間時系列データから、複数のパラメータの組み合わせのうち所定のパラメータに対する他のパラメータが最大となる組み合わせを正常期間最大値として抽出する抽出手段、
を実現させるためのプログラム。 For information processing equipment
Of the time-series data including a plurality of parameters based on the data measured from the measurement target, the combination of a plurality of parameters is selected from the normal period time-series data which is the time-series data of the period in which the measurement target is determined to be in the normal state. An extraction means that extracts the combination that maximizes the other parameters for a predetermined parameter as the maximum value during the normal period.
A program to realize. - 請求項14に記載のプログラムであって、
前記情報処理装置に、さらに、
前記正常期間最大値のうちいずれかを、複数のパラメータを含む時系列データにおいて前記計測対象が異常状態であることを判定するための閾値とする算出手段、
を実現させるためのプログラム。
The program according to claim 14.
In addition to the information processing device,
A calculation means, in which any one of the maximum values during the normal period is used as a threshold value for determining that the measurement target is in an abnormal state in time-series data including a plurality of parameters.
A program to realize.
Priority Applications (3)
| Application Number | Priority Date | Filing Date | Title |
|---|---|---|---|
| JP2021552071A JP7315017B2 (en) | 2019-10-18 | 2019-10-18 | Time series data processing method |
| US17/764,639 US11885720B2 (en) | 2019-10-18 | 2019-10-18 | Time series data processing method |
| PCT/JP2019/041013 WO2021075039A1 (en) | 2019-10-18 | 2019-10-18 | Time-series data processing method |
Applications Claiming Priority (1)
| Application Number | Priority Date | Filing Date | Title |
|---|---|---|---|
| PCT/JP2019/041013 WO2021075039A1 (en) | 2019-10-18 | 2019-10-18 | Time-series data processing method |
Publications (1)
| Publication Number | Publication Date |
|---|---|
| WO2021075039A1 true WO2021075039A1 (en) | 2021-04-22 |
Family
ID=75537359
Family Applications (1)
| Application Number | Title | Priority Date | Filing Date |
|---|---|---|---|
| PCT/JP2019/041013 WO2021075039A1 (en) | 2019-10-18 | 2019-10-18 | Time-series data processing method |
Country Status (3)
| Country | Link |
|---|---|
| US (1) | US11885720B2 (en) |
| JP (1) | JP7315017B2 (en) |
| WO (1) | WO2021075039A1 (en) |
Citations (3)
| Publication number | Priority date | Publication date | Assignee | Title |
|---|---|---|---|---|
| JP2008059270A (en) * | 2006-08-31 | 2008-03-13 | Toshiba Corp | Process abnormality diagnostic device and process monitoring system |
| WO2011036809A1 (en) * | 2009-09-28 | 2011-03-31 | 株式会社 東芝 | Abnormality identification system and method thereof |
| JP2014228887A (en) * | 2013-05-17 | 2014-12-08 | 株式会社東芝 | Operation data analysis device and method therefor, and program |
Family Cites Families (1)
| Publication number | Priority date | Publication date | Assignee | Title |
|---|---|---|---|---|
| JP6564799B2 (en) | 2017-03-03 | 2019-08-21 | 日本電信電話株式会社 | Threshold determination device, threshold determination method and program |
-
2019
- 2019-10-18 WO PCT/JP2019/041013 patent/WO2021075039A1/en active Application Filing
- 2019-10-18 JP JP2021552071A patent/JP7315017B2/en active Active
- 2019-10-18 US US17/764,639 patent/US11885720B2/en active Active
Patent Citations (3)
| Publication number | Priority date | Publication date | Assignee | Title |
|---|---|---|---|---|
| JP2008059270A (en) * | 2006-08-31 | 2008-03-13 | Toshiba Corp | Process abnormality diagnostic device and process monitoring system |
| WO2011036809A1 (en) * | 2009-09-28 | 2011-03-31 | 株式会社 東芝 | Abnormality identification system and method thereof |
| JP2014228887A (en) * | 2013-05-17 | 2014-12-08 | 株式会社東芝 | Operation data analysis device and method therefor, and program |
Also Published As
| Publication number | Publication date |
|---|---|
| JPWO2021075039A1 (en) | 2021-04-22 |
| JP7315017B2 (en) | 2023-07-26 |
| US20220334030A1 (en) | 2022-10-20 |
| US11885720B2 (en) | 2024-01-30 |
Similar Documents
| Publication | Publication Date | Title |
|---|---|---|
| JP6777069B2 (en) | Information processing equipment, information processing methods, and programs | |
| US9274869B2 (en) | Apparatus, method and storage medium for fault cause extraction utilizing performance values | |
| KR20190006032A (en) | Method for determining importance of abnormality data and method for determining importance of abnormality data | |
| US11152126B2 (en) | Abnormality diagnosis system and abnormality diagnosis method | |
| US20150304346A1 (en) | Apparatus and method for detecting anomaly of network | |
| JP6708203B2 (en) | Information processing apparatus, information processing method, and program | |
| JP6370132B2 (en) | Communication abnormality detection device, communication abnormality detection method and program | |
| US10047757B2 (en) | Predicting a surge event in a compressor of a turbomachine | |
| KR101988164B1 (en) | Monitoring system for equipments and the method thereof | |
| WO2018216197A1 (en) | Anomaly seriousness computation system, anomaly seriousness computation device, and anomaly seriousness computation program | |
| WO2019087508A1 (en) | Monitoring target selecting device, monitoring target selecting method and program | |
| JP2018007179A (en) | Device, method and program for monitoring | |
| KR102006436B1 (en) | Method for detecting false alarm | |
| EP3187950B1 (en) | A method for managing alarms in a control system | |
| WO2021075039A1 (en) | Time-series data processing method | |
| JP2016003875A (en) | Motor abnormality detecting system, motor abnormality detecting method, and motor abnormality detecting program | |
| JP7239022B2 (en) | Time series data processing method | |
| Salvador et al. | Online detection of shutdown periods in chemical plants: A case study | |
| WO2020189211A1 (en) | Monitoring method, monitoring device, and program | |
| JP2010039733A (en) | Method, program and system for monitoring manufacturing process and method for manufacturing product | |
| US11467214B2 (en) | Anomaly detection system and method for electric drives | |
| JP7111173B2 (en) | Information processing equipment | |
| WO2020245980A1 (en) | Time-series data processing method | |
| JP2014026327A (en) | Device state diagnostic apparatus using actual operation data | |
| KR20240031891A (en) | Method and system for diagnosing faults in induction motors using rms measurement of input current |
Legal Events
| Date | Code | Title | Description |
|---|---|---|---|
| 121 | Ep: the epo has been informed by wipo that ep was designated in this application |
Ref document number: 19949268 Country of ref document: EP Kind code of ref document: A1 |
|
| ENP | Entry into the national phase |
Ref document number: 2021552071 Country of ref document: JP Kind code of ref document: A |
|
| NENP | Non-entry into the national phase |
Ref country code: DE |
|
| 122 | Ep: pct application non-entry in european phase |
Ref document number: 19949268 Country of ref document: EP Kind code of ref document: A1 |