WO2020195871A1 - 分析装置及び分析方法 - Google Patents
分析装置及び分析方法 Download PDFInfo
- Publication number
- WO2020195871A1 WO2020195871A1 PCT/JP2020/010705 JP2020010705W WO2020195871A1 WO 2020195871 A1 WO2020195871 A1 WO 2020195871A1 JP 2020010705 W JP2020010705 W JP 2020010705W WO 2020195871 A1 WO2020195871 A1 WO 2020195871A1
- Authority
- WO
- WIPO (PCT)
- Prior art keywords
- reaction
- reaction region
- count value
- calculation unit
- signal
- Prior art date
Links
Images


Classifications
-
- G—PHYSICS
- G01—MEASURING; TESTING
- G01N—INVESTIGATING OR ANALYSING MATERIALS BY DETERMINING THEIR CHEMICAL OR PHYSICAL PROPERTIES
- G01N21/00—Investigating or analysing materials by the use of optical means, i.e. using sub-millimetre waves, infrared, visible or ultraviolet light
- G01N21/17—Systems in which incident light is modified in accordance with the properties of the material investigated
- G01N21/25—Colour; Spectral properties, i.e. comparison of effect of material on the light at two or more different wavelengths or wavelength bands
- G01N21/251—Colorimeters; Construction thereof
- G01N21/253—Colorimeters; Construction thereof for batch operation, i.e. multisample apparatus
-
- G—PHYSICS
- G01—MEASURING; TESTING
- G01N—INVESTIGATING OR ANALYSING MATERIALS BY DETERMINING THEIR CHEMICAL OR PHYSICAL PROPERTIES
- G01N21/00—Investigating or analysing materials by the use of optical means, i.e. using sub-millimetre waves, infrared, visible or ultraviolet light
- G01N21/17—Systems in which incident light is modified in accordance with the properties of the material investigated
- G01N21/1717—Systems in which incident light is modified in accordance with the properties of the material investigated with a modulation of one or more physical properties of the sample during the optical investigation, e.g. electro-reflectance
-
- G—PHYSICS
- G01—MEASURING; TESTING
- G01N—INVESTIGATING OR ANALYSING MATERIALS BY DETERMINING THEIR CHEMICAL OR PHYSICAL PROPERTIES
- G01N21/00—Investigating or analysing materials by the use of optical means, i.e. using sub-millimetre waves, infrared, visible or ultraviolet light
- G01N21/17—Systems in which incident light is modified in accordance with the properties of the material investigated
- G01N21/55—Specular reflectivity
-
- G—PHYSICS
- G01—MEASURING; TESTING
- G01N—INVESTIGATING OR ANALYSING MATERIALS BY DETERMINING THEIR CHEMICAL OR PHYSICAL PROPERTIES
- G01N33/00—Investigating or analysing materials by specific methods not covered by groups G01N1/00 - G01N31/00
- G01N33/48—Biological material, e.g. blood, urine; Haemocytometers
- G01N33/50—Chemical analysis of biological material, e.g. blood, urine; Testing involving biospecific ligand binding methods; Immunological testing
- G01N33/53—Immunoassay; Biospecific binding assay; Materials therefor
-
- B—PERFORMING OPERATIONS; TRANSPORTING
- B01—PHYSICAL OR CHEMICAL PROCESSES OR APPARATUS IN GENERAL
- B01L—CHEMICAL OR PHYSICAL LABORATORY APPARATUS FOR GENERAL USE
- B01L9/00—Supporting devices; Holding devices
- B01L9/56—Means for indicating position of a recipient or sample in an array
-
- G—PHYSICS
- G01—MEASURING; TESTING
- G01N—INVESTIGATING OR ANALYSING MATERIALS BY DETERMINING THEIR CHEMICAL OR PHYSICAL PROPERTIES
- G01N21/00—Investigating or analysing materials by the use of optical means, i.e. using sub-millimetre waves, infrared, visible or ultraviolet light
- G01N21/17—Systems in which incident light is modified in accordance with the properties of the material investigated
- G01N2021/1789—Time resolved
- G01N2021/1791—Time resolved stroboscopic; pulse gated; time range gated
-
- G—PHYSICS
- G01—MEASURING; TESTING
- G01N—INVESTIGATING OR ANALYSING MATERIALS BY DETERMINING THEIR CHEMICAL OR PHYSICAL PROPERTIES
- G01N35/00—Automatic analysis not limited to methods or materials provided for in any single one of groups G01N1/00 - G01N33/00; Handling materials therefor
- G01N35/00029—Automatic analysis not limited to methods or materials provided for in any single one of groups G01N1/00 - G01N33/00; Handling materials therefor provided with flat sample substrates, e.g. slides
Definitions
- the present disclosure relates to an analyzer and an analysis method for analyzing a biological substance such as an antigen or an antibody.
- An immunoassay (immunoassay) is known that quantitatively analyzes the effects of disease detection and treatment by detecting a specific antigen or antibody associated with a disease as a biomarker.
- Patent Document 1 in the sample detection unit, a plurality of wells serving as a reaction region are formed by a cartridge having a plurality of through holes and an analysis substrate.
- a measurement range which is a range for the analyzer to count fine particles, is preset on the analysis substrate, and wells are formed at positions where the measurement area and the through hole coincide with each other. ing.
- a buffer solution containing the antibody is injected into the well to fix the antibody on the analysis substrate, and then washed and dried.
- a sample solution containing the substance to be detected is injected into the well, and the substance to be detected is bound to the antibody, followed by washing and drying.
- a buffer solution containing fine particles that bind to the detection target substance is injected into the well, and the fine particles are bound to the detection target substance to form a reaction region in which the detection target substance is captured by the antibody and the fine particles.
- the substance to be detected is indirectly quantified by removing the cartridge from the sample detection unit in which the reaction region is formed, applying the analysis substrate from which the cartridge has been removed to an analyzer, and counting the fine particles detected from the measurement range. ..
- the reaction region may be formed at a position deviated from the preset measurement range on the analysis substrate. If the reaction region deviates from the measurement range, it is not possible to accurately quantify the fine particles in the measurement range, which causes deterioration of the analysis accuracy.
- the measurement range is set smaller than the reaction region so that the reaction region does not deviate from the measurement range in consideration of the deviation amount of the reaction region, the binding status between the antibody and the substance to be detected in the reaction region or
- a region having a large count value and a region having a small count value coexist, so that an in-plane distribution of the count value occurs, which is a factor that deteriorates the analysis accuracy. ..
- the fine particles can be accurately quantified and the deterioration of the analysis accuracy can be suppressed. It is an object of the present invention to provide an analyzer and an analysis method capable of performing the same.
- an analyzer using an analytical substrate in which a plurality of reaction regions are formed by fixing fine particles labeling the detection target substance to the detection target substance captured on the track In an analyzer using an analytical substrate in which a plurality of reaction regions are formed by fixing fine particles labeling the detection target substance to the detection target substance captured on the track.
- An optical pickup that receives reflected light obtained by irradiating the analysis substrate with laser light and generates a light reception level signal, and a measurement range is preset on the analysis substrate.
- a gate signal corresponding to a plurality of divided measurement ranges divided in the circumferential direction is generated for each of the plurality of tracks within the range, and a fine particle pulse signal is extracted from the received light level signal using the gate signal.
- a signal processing circuit that counts the number of pulses for each gate signal from the extracted fine particle pulse signal and outputs a count value for each divided measurement range, and the measurement based on the count value output from the signal processing circuit.
- a count value in-plane distribution generator that generates count value in-plane distribution data in a range, a reaction region position coordinate calculation unit that estimates the positions of all the reaction regions based on the count value in-plane distribution data, and an estimation.
- An analyzer is provided that includes a count value calculation unit in the reaction region for calculating the count value for all the reaction regions.
- the optical pickup is attached to the analysis substrate in which a plurality of reaction regions are formed by fixing the fine particles labeling the detection target substance to the detection target substance captured on the track.
- the reflected light obtained by irradiating the laser beam is received and a light receiving level signal is generated
- the signal processing circuit has a measurement range set in advance on the analysis substrate, and a plurality of measurement ranges within the measurement range are set in advance.
- a gate signal corresponding to a plurality of divided measurement ranges divided in the circumferential direction is generated for each of the tracks, and a fine particle pulse signal is extracted from the light receiving level signal using the gate signal, and the extracted fine particles.
- the number of pulses is counted for each gate signal from the pulse signal, the count value is output for each divided measurement range, and the count value in-plane distribution generator measures the measurement based on the count value output from the signal processing circuit.
- the count value in-plane distribution data in the range is generated, the reaction region position coordinate calculation unit estimates the positions of all the reaction regions based on the count value in-plane distribution data, and the reaction region count value calculation unit , An analysis method for calculating a count value is provided for all of the estimated reaction regions.
- the fine particles can be accurately quantified, and the analysis accuracy can be improved. Deterioration can be suppressed.
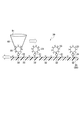
- the analyzer 1 includes a turntable 2, a clamper 3, a turntable drive unit 4, a turntable drive circuit 5, a reference position detection sensor 6, a guide shaft 7, an optical pickup 8, and an optical pickup drive circuit 9. And. Further, the analyzer 1 includes a signal processing circuit 11, a control unit 12, a count value in-plane distribution generation unit 13, a reaction region position coordinate calculation unit 14, a reaction region position determination unit 15, and a reaction region in-plane count value. It includes a calculation unit 16.
- CPU Central
- a plurality of reaction regions 30 are formed on the analysis substrate 20.
- the analysis substrate 20 is placed on the turntable 2 so that the reaction region 30 faces downward.
- the analysis substrate 20 is, for example, an optical disc having a disk shape.
- the clamper 3 is driven in the direction of separation and the direction of approaching the turntable 2.
- the analysis substrate 20 is held by the clamper 3 and the turntable 2.
- the turntable drive unit 4 rotationally drives the turntable 2 together with the analysis board 20 and the clamper 3 around the rotation axis C2.
- a spindle motor may be used as the turntable drive unit 4.
- the turntable drive circuit 5 controls the turntable drive unit 4.
- the turntable drive circuit 5 controls the turntable drive unit 4 so that the turntable 2 rotates together with the analysis board 20 and the clamper 3 at a constant linear velocity.
- the reference position detection sensor 6 is arranged near the outer peripheral portion of the analysis substrate 20.
- the reference position detection sensor 6 is an optical sensor such as a photoreflector.
- the reference position detection sensor 6 irradiates the outer peripheral portion of the analysis substrate 20 with the detection light 6a while the analysis substrate 20 is rotating, and receives the reflected light from the analysis substrate 20.
- the reference position detection sensor 6 detects the notch 21 of the analysis board 20 to generate a reference position detection signal KS, and outputs the reference position detection signal KS to the signal processing circuit 11.
- the reference position detection signal KS is, for example, a pulse that rises and turns on when the notch 21 reaches the detection position of the reference position detection sensor 6, that is, a position where the detection light 6a is irradiated, and falls and turns off when it passes. It is a signal.
- the reference position detection sensor 6 detects the reference position for each rotation cycle and track of the analysis substrate 20.
- a transmissive optical sensor may be used as the reference position detection sensor 6.
- the reference position detection sensor 6 irradiates the analysis substrate 20 with the detection light 6a and receives the detection light 6a passing through the notch 21 to reference the rotation cycle of the analysis substrate 20 and each track. Detect the position.
- the guide shaft 7 is arranged parallel to the analysis substrate 20 and along the radial direction of the analysis substrate 20.
- the optical pickup 8 is supported by a guide shaft 7.
- the optical pickup 8 has an objective lens 81.
- the optical pickup drive circuit 9 controls the drive of the optical pickup 8.
- the optical pickup drive circuit 9 moves the optical pickup 8 along the guide shaft 7 and moves the objective lens 81 of the optical pickup 8 in the vertical direction.
- the optical pickup 8 is driven along the guide shaft 7 in a direction orthogonal to the rotation axis C2 of the turntable 2, in the radial direction of the analysis substrate 20, and in parallel with the analysis substrate 20.
- the optical pickup 8 irradiates the laser beam 82 toward the analysis substrate 20.
- the laser beam 82 is focused by the objective lens 81 on the track region 22 in which the reaction region 30 of the analysis substrate 20 is formed.
- the optical pickup 8 is driven in the radial direction of the analysis substrate 20.
- the optical pickup 8 receives the reflected light from the analysis substrate 20.
- the optical pickup 8 detects the light receiving level of the reflected light, generates a light receiving level signal JS, and outputs the light receiving level signal JS to the signal processing circuit 11.
- the control unit 12 controls the turntable drive circuit 5, the optical pickup drive circuit 9, and the signal processing circuit 11.
- the control unit 12 controls the turntable drive circuit 5 to rotate or stop the turntable 2 at a constant linear speed, for example.
- the control unit 12 controls the optical pickup drive circuit 9 to move the optical pickup 8 to a target position in the radial direction of the analysis substrate 20, or an objective lens so that the laser beam 82 is focused on the track region 22. Adjust the vertical position of 81.
- the control unit 12 outputs the measurement parameter SP to the signal processing circuit 11.
- the measurement parameter SP is a measurement parameter for generating a plurality of measurement gate signals GS, and includes the number of reaction regions 30, the time corresponding to the distance from the notch 21 to each reaction region 30, and the measurement gate in each track. Includes measurement information such as signal GS timing and gate width.
- the signal processing circuit 11 is, for example, a counter. The processing of the count value in-plane distribution generation unit 13, the reaction region position coordinate calculation unit 14, the reaction region position determination unit 15, and the reaction region in-plane count value calculation unit 16 will be described later.
- FIG. 2 shows a state in which the analysis substrate 20 shown in FIG. 1 is turned upside down.
- a plurality of antibodies 32 that bind to a specific antigen of the substance to be detected 31 are immobilized on the analysis substrate 20.
- the substance to be detected 31 binds to the antibody 32 and is fixed on the analysis substrate 20.
- a plurality of antibodies that bind to a specific antigen of the detection target substance 31 are immobilized on the surface of the fine particles 33 that label the detection target substance 31.
- the fine particles 33 are specifically bound to the substance to be detected 31 and captured on the analysis substrate 20. Therefore, the substance to be detected 31 is captured by the antibody 32 and the fine particles 33 on the track of the analysis substrate 20 by the sandwich method.
- the substance to be detected 31 is, for example, an exosome.
- step S1 the control unit 12 controls the turntable drive circuit 5 so that the analysis substrate 20 rotates at a constant linear speed, for example, and the turntable drive unit 4 rotates and drives the turntable 2. Let me.
- step S2 the control unit 12 irradiates the detection light 6a from the reference position detection sensor 6 toward the analysis substrate 20.
- step S3 the control unit 12 irradiates the laser beam 82 from the optical pickup 8 toward the analysis substrate 20.
- the control unit 12 may execute step S3 after step S2, may execute step S2 after step S3, or may execute step S2 and step S3 at the same time.
- step S4 the control unit 12 controls the optical pickup drive circuit 9 and moves the optical pickup 8 so that the target track of the analysis substrate 20 is irradiated with the laser beam 82.
- step S5 the reference position detection sensor 6 generates the reference position detection signal KS by detecting the notch portion 21, and outputs the reference position detection signal KS to the signal processing circuit 11.
- the optical pickup 8 receives the reflected light from the analysis substrate 20 in step S6.
- the optical pickup 8 detects the light receiving level of the reflected light, generates a light receiving level signal JS (first detection signal), and outputs the light receiving level signal JS (first detection signal) to the signal processing circuit 11.
- the control unit 12 outputs the measurement parameter SP to the signal processing circuit 11.
- the signal processing circuit 11 acquires the reference position detection signal KS from the reference position detection sensor 6, acquires the light receiving level signal JS from the optical pickup 8, and acquires the measurement parameter SP and the track information TF from the control unit 12.
- the track information TF includes information (for example, information such as a track number or a track position) of a target track (track to be measured) to which the laser beam 82 is irradiated in step S4.
- step S8 the signal processing circuit 11 acquires the phase SA in the track TR to be measured based on the reference position detection signal KS and the track information TF.
- the phase SA is preset for each track.
- the signal processing circuit 11 may have a storage unit that stores the phase SA set for each track as table format data.
- the signal processing circuit 11 can recognize the track number or track position of the track currently being measured from the track information TF, and can acquire the phase SA corresponding to that track.
- the signal processing circuit 11 generates a plurality of measurement gate signals GS based on the reference position detection signal KS, the phase SA, and the measurement parameter SP.
- FIG. 4 shows the reference position detection signal KS in the track TR, (b) to (g) show a plurality of measurement gate signals GS1 to GSm in the track TR, and (h) shows the light receiving level in the track TR. It shows the signal JS.
- the signal processing circuit 11 generates the measurement gate signal GS1 that rises from the falling point of the reference position detection signal KS to the time after the phase SA on the track currently being measured, based on the measurement parameter SP. Further, the signal processing circuit 11 generates the measurement gate signal GS2 that rises at the time when the measurement gate signal GS1 falls. In this way, the signal processing circuit 11 generates a plurality of measurement gate signals GS in the track currently being measured. Further, the signal processing circuit 11 generates a plurality of measurement gate signals GS for each track based on the reference position detection signal KS, the phase SA, and the measurement parameter SP in each track. That is, the signal processing circuit 11 generates a gate signal GS corresponding to a plurality of divided measurement ranges divided in the circumferential direction for each of the plurality of tracks TR in the measurement range RM.
- FIG. 5 shows the positional relationship between the reaction region 30, the measurement range RM by the measurement gate signals GS1 to GSm, and the tracks TR1 to TRn to be measured.
- the reaction region 30 when formed at the target position on the analysis substrate 20 is shown by a solid line
- the reaction region 30 when formed at a position deviated from the target position is shown by a two-dot chain line. ing. Even if the reaction region 30 is formed at a position deviated from the target position, it is desirable that the measurement range RM is set larger than the reaction region 30 so that the reaction region 30 is located within the measurement range RM.
- step S9 the signal processing circuit 11 performs fine particle pulse signals BS1 to BSm (second second) from the light receiving level signal JS output from the optical pickup 8 for each measurement gate signal GS1 to GSm in all the tracks TR1 to TRn.
- the detection signal) is extracted, the number of pulses is counted for each of the fine particle pulse signals BS1 to BSm, and the count value CV for each measurement gate signal GS1 to GSm of all the tracks TR1 to TRn is acquired. That is, the signal processing circuit 11 counts the fine particles 33 specifically bound to the detection target substance 31 captured in the reaction region 30 for each measurement gate signal GS.
- FIG. 4H shows an example of the fine particle pulse signals BS1 to BSm in the track TRk shown in FIG.
- step S10 the count value in-plane distribution generation unit 13 acquires the reference position detection signal KS, the track information TF, and the count value CV from the signal processing circuit 11 via the control unit 12, and in the measurement range RM.
- the in-plane distribution data of the count value is generated as the count data TCD in a table format.
- the table-format count data TCD is simply referred to as the table data TCD.
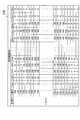
- FIG. 6 shows an example of table data TCD.
- the numerical values in FIG. 6 show an example of the count value CV of the number of pulses in the fine particle pulse signal BS for each measurement gate signal GS1 to GSm of the tracks TR1 to TRn in the measurement range RM.
- the count value CV is indicated by a numerical value of 10, 50, or 100 in FIG. 6, the actual count value is actually input. That is, in the reaction region 30, the number of pulses in the fine particle pulse signal BS is counted for each of the plurality of divided measurement ranges divided in the circumferential direction with respect to each of the plurality of tracks TR in the measurement range RM.
- the reaction area position coordinate calculation unit 14 acquires the table data TCD from the count value in-plane distribution generation unit 13 in step S11. Further, the reaction region position coordinate calculation unit 14 acquires the in-plane distribution of the count value from the table data TCD and estimates the position of the reaction region 30 (for example, the center coordinates of the reaction region 30). The reaction region position coordinate calculation unit 14 estimates the position of the reaction region 30 from the total value of the count values CV included in the shape having a predetermined size based on the count value in-plane distribution data.
- the reaction region position coordinate calculation unit 14 corresponds to the above circle by processing the in-plane distribution of the count values in the table data TCD as an image.
- the region may be specified and the center coordinates of the reaction region 30 may be estimated from the center position of the circle.
- the reaction region position coordinate calculation unit 14 may estimate the position (range) of the reaction region 30 from a predetermined radius and center coordinates.
- the reaction region position coordinate calculation unit 14 scans the circle corresponding to the reaction region 30 with respect to the table data TCD, and sets the center position (center) of the circle having the maximum total count value in the circle as the reaction region 30. It may be a position (center coordinates).
- the reaction area position coordinate calculation unit 14 may acquire the score SC indicating the certainty of detection from the in-plane distribution of the count values.
- the score SC is an index generally used in image recognition, and indicates the degree to which a figure obtained from an in-plane distribution and a circle having a predetermined radius match. The higher the degree of matching, the higher the score SC.
- the control unit 12, the reference position detection sensor 6, the optical pickup 8, the signal processing circuit 11, the count value in-plane distribution generation unit 13, or the reaction region position coordinate calculation unit 14 may perform steps S4 to S11 for all reaction regions 30. Execute the process. As a result, the reaction region position coordinate calculation unit 14 estimates the positions (center coordinates) of all the reaction regions 30 and acquires the score SC.
- the reaction region position determination unit 15 estimates the positions (center coordinates) of all the reaction regions 30 from the reaction region position coordinate calculation unit 14, and acquires the score SC. Further, the reaction region position determination unit 15 determines at least one of the position (center coordinates) of the reaction region 30 and the score SC, and based on the determination result, determines the reference reaction region 30 (first reaction region). Select. The number of the first reaction regions selected by the reaction region position determination unit 15 is two or three.
- the reaction region position determination unit 15 determines whether or not the center coordinates C30 are located in a predetermined region for all the reaction regions 30, and the reaction region 30 whose center coordinates are located in the predetermined region. May be selected as the reference reaction region 30.
- the reaction region position determination unit 15 determines, for example, whether or not the score SC is equal to or higher than the threshold value for all the reaction regions 30, and selects the reaction region 30 having the score SC equal to or higher than the threshold value as the reference reaction region 30. You may.
- the reaction region position determination unit 15 may select, for example, the reaction region 30 in which the difference in the count values of the continuous gate signals GS is larger than the threshold value as the reference reaction region 30.
- the operator may confirm the in-plane distribution of the count value and select the reference reaction region 30 by GUI (Graphical User Interface) or the like.
- GUI Graphic User Interface
- FIG. 7 shows a state in which eight reaction regions 30 are formed on the same circumference at equal intervals on the analysis substrate 20. In order to distinguish the eight reaction regions 30, they are shown as reaction regions 30a to 30h in FIG. The case where the reaction region position determination unit 15 selects the three reaction regions 30a, 30d, and 30f shown in FIG. 7 as the reference reaction region 30 in step S12 will be described below.
- the reaction area position coordinate calculation unit 14 acquires the determination result JR from the reaction area position determination unit 15 in step S21. Further, the reaction region position coordinate calculation unit 14 acquires the center coordinates C30a, C30d, and C30f of the reference reaction regions 30a, 30d, and 30f (first reaction region) from the determination result JR. Further, the reaction region position coordinate calculation unit 14 determines the circle CE from the center coordinates C30a, C30d, and C30f as a perfect circle passing through the centers of the reaction regions 30a, 30d, and 30f, for example. That is, the reaction regions 30a, 30d, and 30f are arranged so as to be located on the circle CE whose centers are perfect circles. Further, the reaction region position coordinate calculation unit 14 calculates the center point CEC of the circle CE.
- the reaction region position coordinate calculation unit 14 calculates the rotation phase error PDa of the reaction region 30a, the rotation phase error PDd of the reaction region 30d, and the rotation phase error PDf of the reaction region 30f.
- the rotational phase error PDa is the phase difference in the rotational direction from the phase reference PRa to, for example, the center of the reaction region 30a.
- the phase reference PRa can be set arbitrarily.
- n is the number of reaction regions 30 formed on the analysis substrate 20.
- the rotational phase error PDd is the phase difference in the rotational direction from the phase reference PRd to, for example, the center of the reaction region 30d.
- the rotational phase error PDFf is the phase difference in the rotational direction from the phase reference PRf to, for example, the center of the reaction region 30f.
- the reaction region position coordinate calculation unit 14 calculates, for example, the average value of the rotation phase errors PDa, PDd, and PDf, and acquires the average rotation phase error APD.
- the reaction region position coordinate calculation unit 14 specifies the positions of the reaction regions 30b, 30c, 30e, 30g, and 30h (second reaction region) other than the reference reaction regions 30a, 30d, and 30f. To do. Specifically, the reaction region position coordinate calculation unit 14 calculates the center coordinates C30b when the center of the reaction region 30b is located on the circle CE based on the phase reference PRb and the average rotation phase error APD. Similarly, in the reaction region position coordinate calculation unit 14, the centers of the reaction regions 30c, 30e, 30g, and 30h are on the circle CE based on the phase reference PRc, PRE, PRg, and PRh and the average rotation phase error APD.
- the center coordinates C30c, C30e, C30g, and C30h when they are located at are calculated. That is, the reaction region position coordinate calculation unit 14 performs all the above based on the circumference of the circle CE passing through each center position of the selected first reaction region and the respective center positions of the first reaction region.
- the position of the reaction region can be specified.
- reaction region position coordinate calculation unit 14 can specify the position (range) of the reaction regions 30a to 30h based on the center coordinates C30a to C30h and the design radius (or diameter) of the reaction region 30. .. Further, the reaction area position coordinate calculation unit 14 outputs the position information CF of the reaction areas 30a to 30h and the table data TCD to the reaction area count value calculation unit 16.
- the position information CF includes the design radius (or diameter) of the reaction region 30 and the center coordinates C30a to C30h.
- step S24 the count value calculation unit 16 in the reaction region specifies the count values corresponding to the reaction regions 30a to 30h from the table data TCD based on the position information CF, and adds up for each reaction region 30.
- the analyzer 1 can calculate the count value of each reaction region 30.
- the analyzer 1 may output the total count value for each reaction region 30 to a display device or the like. Even when four or more reaction regions 30 are selected as the reference reaction regions 30, the count value of each reaction region 30 can be calculated by the same procedure.
- the reaction area position coordinate calculation unit 14 acquires the determination result JR from the reaction area position determination unit 15 in step S31. Further, the reaction region position coordinate calculation unit 14 acquires the center coordinates C30a and C30d of the reference reaction regions 30a and 30d (first reaction region) from the determination result JR. Further, the reaction region position coordinate calculation unit 14 applies the circumference of a circle CE having a preset size to the center positions of the center coordinates C30a and C30d, respectively, so that, for example, each of the reaction regions 30a and 30d Determine the circle CE that passes through the center.
- the circle CE passing through the centers of the reaction regions 30a and 30d can be determined based on the center coordinates C30a and C30d and the radius of the circle CE. That is, the reaction regions 30a and 30d are arranged so that their centers are located on the circle CE. Further, the reaction region position coordinate calculation unit 14 calculates the center point CEC of the circle CE.
- step S32 the reaction region position coordinate calculation unit 14 calculates the rotation phase error PDa of the reaction region 30a and the rotation phase error PDd of the reaction region 30d. Further, the reaction region position coordinate calculation unit 14 calculates, for example, the average value of the rotation phase errors PDa and PDd, and acquires the average rotation phase error APD.
- the reaction region position coordinate calculation unit 14 specifies the positions of the reaction regions 30b, 30c, and 30e to 30h (second reaction region) other than the reference reaction regions 30a and 30d.
- the positions of the reaction regions 30b, 30c, and 30e to 30h can be specified by the same procedure as in step S23. That is, the reaction region position coordinate calculation unit 14 can specify the positions of all the reaction regions based on the circumference of the circle CE determined in step S31 and the center positions of the first reaction regions. Further, the reaction area position coordinate calculation unit 14 outputs the position information CF of the reaction areas 30a to 30h and the table data TCD to the reaction area count value calculation unit 16.
- step S34 the count value calculation unit 16 in the reaction region specifies the count values corresponding to the reaction regions 30a to 30h from the table data TCD based on the position information CF, and adds up for each reaction region 30.
- the analyzer 1 can acquire only the count value of each reaction region 30.
- the analyzer 1 may output the total count value for each reaction region 30 to a display device or the like.
- the table data TCD is generated, the position of each reaction region 30 is estimated based on the table data TCD, and the reference reaction region 30 is selected. Further, in the analyzer 1 and the analysis method of the present embodiment, the circle CE in which all the reaction regions 30 are arranged is determined based on the reference reaction region 30, and each reaction region 30 is determined based on the rotation phase error PD. By specifying the position and specifying the count value corresponding to the specified reaction region 30, only the count value in the range corresponding to the reaction region 30 can be obtained from the table data TCD.
- the shape of the reaction region 30 has been described as a circle having a predetermined radius, but the shape of the reaction region 30 is not limited to a circle, and any other shape can be used as long as the center can be specified. There may be.
- the analyzer 1 and the analysis method of the present embodiment even if the reaction region 30 is formed at a position deviated from the target position on the analysis substrate 20, the count value of the reaction region 30 at the deviated position Since only can be extracted, deterioration of analysis accuracy can be suppressed.
Abstract
分析装置(1)は光ピックアップ(8)と信号処理回路(11)とカウント値面内分布生成部(13)と反応領域位置座標演算部(14)と反応領域内カウント値演算部(16)とを備える。信号処理回路(11)は複数の分割測定範囲に対応したゲート信号(GS)を用いて、光ピックアップ(8)が生成した受光レベル信号(JS)から微粒子パルス信号(BS)を抽出し、ゲート信号(GS)ごとにパルス数をカウントし、分割測定範囲ごとにカウント値(CV)を出力する。カウント値面内分布生成部(13)はカウント値(CV)に基づいて測定範囲(RM)におけるカウント値面内分布データを生成する。反応領域位置座標演算部(14)はカウント値面内分布データから全ての反応領域(30)の位置を推定する。反応領域内カウント値演算部(16)は推定された全ての反応領域(30)についてカウント値(CV)を算出する。
Description
本開示は、抗原または抗体等の生体物質を分析するための分析装置及び分析方法に関する。
疾病に関連付けられた特定の抗原または抗体をバイオマーカーとして検出することで、疾病の発見及び治療の効果等を定量的に分析する免疫検定法(immunoassay)が知られている。
特許文献1では、検体検出用ユニットは、複数の貫通孔を有したカートリッジと分析用基板とにより反応領域となる複数のウェルが形成されている。なお、特許文献1では、分析用基板には、分析装置が微粒子をカウントするための範囲である測定範囲が予め設定されており、ウェルは測定領域と貫通孔とを一致させた位置に形成されている。
更に、上記の検体検出用ユニットを用いた分析法として以下のことが記載されている。まず、ウェル内に抗体を含む緩衝液を注入して分析用基板上に抗体を固定した後に、洗浄し、乾燥する。次に、このウェル内に検出対象物質を含む試料液を注入して、抗体に検出対象物質を結合させた後に、洗浄し、乾燥する。さらに、このウェル内に検出対象物質と結合する微粒子を含む緩衝液を注入して、この検出対象物質に微粒子を結合させて、検出対象物質が抗体と微粒子とによって捕捉された反応領域を形成する。反応領域が形成された検体検出用ユニットから、カートリッジを取り外し、カートリッジが取り外された分析用基板を分析装置にかけ、測定範囲から検出した微粒子をカウントすることにより、検出対象物質を間接的に定量する。
しかしながら、ウェルと分析用基板との位置合わせ精度等により、反応領域が分析用基板上に予め設定された測定範囲からずれた位置に形成される場合がある。反応領域が測定範囲からずれると、測定範囲における微粒子の定量を精度よくおこなうことができず、分析精度を悪化させる要因となる。
この対策として、反応領域のずれ量を考慮して、反応領域が測定範囲からはずれないように測定範囲を反応領域よりも小さく設定すると、反応領域内で抗体と検出対象物質の間の結合状況または検出対象物質と微粒子との間の結合状況にばらつきが発生した場合、カウント値が大きい領域と小さい領域とが混在するため、カウント値の面内分布が発生し、分析精度を悪化させる要因となる。
実施形態は、反応領域が分析用基板上に予め設定された測定範囲からずれた位置に形成された場合であっても、微粒子を精度よく定量することができ、分析精度の悪化を抑制することができる分析装置及び分析方法を提供することを目的とする。
実施形態の第1の形態によれば、トラック上に捕捉された検出対象物質に前記検出対象物質を標識する微粒子が固定されることにより反応領域が複数形成された分析用基板を用いる分析装置において、前記分析用基板に対しレーザ光を照射することにより得られた反射光を受光し、受光レベル信号を生成する光ピックアップと、前記分析用基板には測定範囲が予め設定されており、前記測定範囲内の複数の前記トラックのそれぞれに対して周方向に分割した複数の分割測定範囲に対応したゲート信号を生成するとともに、前記ゲート信号を用いて前記受光レベル信号から微粒子パルス信号を抽出し、抽出された前記微粒子パルス信号から前記ゲート信号ごとにパルス数をカウントし、分割測定範囲ごとにカウント値を出力する信号処理回路と、前記信号処理回路から出力された前記カウント値に基づいて前記測定範囲におけるカウント値面内分布データを生成するカウント値面内分布生成部と、前記カウント値面内分布データに基づいて、全ての前記反応領域の位置を推定する反応領域位置座標演算部と、推定された全ての前記反応領域について、カウント値を算出する反応領域内カウント値演算部とを備える分析装置が提供される。
実施形態の第2の形態によれば、光ピックアップが、トラック上に捕捉された検出対象物質に前記検出対象物質を標識する微粒子が固定されることにより反応領域が複数形成された分析用基板に対し、レーザ光を照射することにより得られた反射光を受光し受光レベル信号を生成し、信号処理回路が、前記分析用基板に測定範囲が予め設定されており、前記測定範囲内の複数の前記トラックのそれぞれに対して周方向に分割した複数の分割測定範囲に対応したゲート信号を生成するとともに、前記ゲート信号を用いて前記受光レベル信号から微粒子パルス信号を抽出し、抽出された前記微粒子パルス信号から前記ゲート信号ごとにパルス数をカウントし、分割測定範囲ごとにカウント値を出力し、カウント値面内分布生成部が、前記信号処理回路から出力された前記カウント値に基づいて前記測定範囲におけるカウント値面内分布データを生成し、反応領域位置座標演算部が、前記カウント値面内分布データに基づいて、全ての前記反応領域の位置を推定し、反応領域内カウント値演算部が、推定された全ての前記反応領域の全てについて、カウント値を算出する分析方法が提供される。
実施形態の分析装置及び分析方法によれば、反応領域が分析用基板上の目的の位置からずれた位置に形成された場合であっても、微粒子を精度よく定量することができ、分析精度の悪化を抑制することができる。
図1を用いて、一実施形態の分析装置の構成例を説明する。分析装置1は、ターンテーブル2と、クランパ3と、ターンテーブル駆動部4と、ターンテーブル駆動回路5と、基準位置検出センサ6と、ガイド軸7と、光ピックアップ8と、光ピックアップ駆動回路9とを備える。さらに、分析装置1は、信号処理回路11と、制御部12と、カウント値面内分布生成部13と、反応領域位置座標演算部14と、反応領域位置判定部15と、反応領域内カウント値演算部16とを備える。信号処理回路11、制御部12、カウント値面内分布生成部13、反応領域位置座標演算部14、反応領域位置判定部15、及び反応領域内カウント値演算部16として、コンピュータ機器またはCPU(Central Processing Unit)を用いてもよい。
分析用基板20上には複数の反応領域30が形成されている。分析用基板20は、反応領域30が下向きになるようにターンテーブル2上に載置される。分析用基板20は、例えば円板形状を有する光ディスクである。クランパ3は、ターンテーブル2に対して離隔する方向及び接近する方向に駆動される。分析用基板20は、クランパ3とターンテーブル2とによって保持される。
ターンテーブル駆動部4は、ターンテーブル2を分析用基板20及びクランパ3と共に、回転軸C2回りに回転駆動させる。ターンテーブル駆動部4としてスピンドルモータを用いてもよい。ターンテーブル駆動回路5はターンテーブル駆動部4を制御する。例えば、ターンテーブル駆動回路5は、ターンテーブル2が分析用基板20及びクランパ3と共に一定の線速度で回転するようにターンテーブル駆動部4を制御する。
基準位置検出センサ6は、分析用基板20の外周部の近傍に配置されている。基準位置検出センサ6は、例えばフォトリフレクタ等の光センサである。基準位置検出センサ6は、分析用基板20が回転している状態で、分析用基板20の外周部に検出光6aを照射し、分析用基板20からの反射光を受光する。
基準位置検出センサ6は、分析用基板20の切欠き部21を検出して基準位置検出信号KSを生成し、信号処理回路11へ出力する。基準位置検出信号KSは、例えば切欠き部21が基準位置検出センサ6の検出位置、即ち検出光6aが照射される位置に到達すると立ち上がってオン状態となり、通過すると立ち下がってオフ状態となるパルス信号である。
即ち、基準位置検出センサ6は、分析用基板20の回転周期及びトラック毎に基準位置を検出する。基準位置検出センサ6として透過型の光センサを用いてもよい。この場合、基準位置検出センサ6は、分析用基板20に検出光6aを照射し、切欠き部21を通過する検出光6aを受光することにより、分析用基板20の回転周期及びトラック毎に基準位置を検出する。
ガイド軸7は、分析用基板20と平行に、かつ、分析用基板20の半径方向に沿って配置されている。光ピックアップ8は、ガイド軸7に支持されている。光ピックアップ8は対物レンズ81を有する。光ピックアップ駆動回路9は、光ピックアップ8の駆動を制御する。光ピックアップ駆動回路9は、光ピックアップ8をガイド軸7に沿って移動させたり、光ピックアップ8の対物レンズ81を上下方向に移動させたりする。光ピックアップ8は、ガイド軸7に沿って、ターンテーブル2の回転軸C2に直交する方向であり、分析用基板20の半径方向に、かつ、分析用基板20と平行に駆動する。
光ピックアップ8は、分析用基板20に向けてレーザ光82を照射する。レーザ光82は、対物レンズ81によって分析用基板20の反応領域30が形成されているトラック領域22に集光される。分析用基板20を回転させた状態で、光ピックアップ8を分析用基板20の半径方向に駆動させる。光ピックアップ8は、分析用基板20からの反射光を受光する。光ピックアップ8は、反射光の受光レベルを検出して受光レベル信号JSを生成し、信号処理回路11へ出力する。
制御部12は、ターンテーブル駆動回路5、光ピックアップ駆動回路9、及び信号処理回路11を制御する。制御部12は、ターンテーブル駆動回路5を制御して、ターンテーブル2を例えば一定の線速度で回転させたり、停止させたりする。制御部12は、光ピックアップ駆動回路9を制御して、光ピックアップ8を分析用基板20の半径方向の目標位置まで移動させたり、レーザ光82がトラック領域22に集光されるように対物レンズ81の上下位置を調整したりする。
制御部12は、計測パラメータSPを信号処理回路11へ出力する。計測パラメータSPは、複数の計測ゲート信号GSを生成するための計測パラメータであり、反応領域30の数、切欠き部21から各反応領域30までの距離に相当する時間、及び各トラックにおける計測ゲート信号GSのタイミング及びゲート幅等の計測情報を含む。信号処理回路11は、例えばカウンタである。カウント値面内分布生成部13、反応領域位置座標演算部14、反応領域位置判定部15、及び、反応領域内カウント値演算部16の処理については後述する。
図2は、図1に示す分析用基板20を上下に反転させた状態を示している。反応領域30には、検出対象物質31の特定の抗原と結合する複数の抗体32が分析用基板20上に固定されている。検出対象物質31は抗体32と結合して分析用基板20上に固定されている。検出対象物質31を標識する微粒子33の表面には、検出対象物質31の特定の抗原と結合する複数の抗体が固定されている。微粒子33は検出対象物質31と特異的に結合して分析用基板20上に捕捉されている。従って、検出対象物質31は、抗体32と微粒子33とによって分析用基板20のトラック上にサンドイッチ法により捕捉されている。検出対象物質31は例えばエクソソームである。
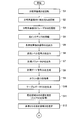
図3A及び図3Bに示すフローチャート、及び図4~図7を用いて、一実施形態の分析方法の一例を説明する。図3Aにおいて、制御部12は、ステップS1にて、分析用基板20が例えば一定の線速度で回転するようにターンテーブル駆動回路5を制御し、ターンテーブル駆動部4にターンテーブル2を回転駆動させる。
制御部12は、ステップS2にて、基準位置検出センサ6から分析用基板20に向けて検出光6aを照射させる。制御部12は、ステップS3にて、光ピックアップ8から分析用基板20に向けてレーザ光82を照射させる。なお、制御部12は、ステップS2の後にステップS3を実行してもよいし、ステップS3の後にステップS2を実行してもよいし、ステップS2とステップS3とを同時に実行してもよい。
制御部12は、ステップS4にて、光ピックアップ駆動回路9を制御し、分析用基板20の目的のトラックにレーザ光82が照射されるように光ピックアップ8を移動させる。基準位置検出センサ6は、ステップS5にて、切欠き部21を検出することにより基準位置検出信号KSを生成し、信号処理回路11へ出力する。
光ピックアップ8は、ステップS6にて、分析用基板20からの反射光を受光する。光ピックアップ8は、反射光の受光レベルを検出して受光レベル信号JS(第1の検出信号)を生成し、信号処理回路11へ出力する。制御部12は、ステップS7にて、計測パラメータSPを信号処理回路11へ出力する。
信号処理回路11は、基準位置検出センサ6から基準位置検出信号KSを取得し、光ピックアップ8から受光レベル信号JSを取得し、制御部12から計測パラメータSP及びトラック情報TFを取得する。トラック情報TFは、上記のステップS4においてレーザ光82が照射される目的のトラック(測定対象のトラック)の情報(例えばトラック番号またはトラック位置等の情報)を含む。
図4に示すように、信号処理回路11は、ステップS8にて、基準位置検出信号KSとトラック情報TFとに基づいて、測定対象のトラックTRにおける位相SAを取得する。位相SAは、トラックごとに予め設定されている。信号処理回路11は、トラックごとに設定された位相SAをテーブル形式のデータとして記憶する記憶部を有していてもよい。信号処理回路11は、トラック情報TFから現在測定しているトラックのトラック番号またはトラック位置を認識し、そのトラックに対応する位相SAを取得することができる。
信号処理回路11は、基準位置検出信号KSと位相SAと計測パラメータSPとに基づいて、複数の計測ゲート信号GSを生成する。図4において、(a)はトラックTRにおける基準位置検出信号KSを示し、(b)~(g)はトラックTRにおける複数の計測ゲート信号GS1~GSmを示し、(h)はトラックTRにおける受光レベル信号JSを示している。
例えば、信号処理回路11は、現在測定しているトラックにおいて、計測パラメータSPに基づいて、基準位置検出信号KSの立ち下がり時点から位相SA後の時点で立ち上がる計測ゲート信号GS1を生成する。さらに、信号処理回路11は、計測ゲート信号GS1の立ち下がり時点で立ち上がる計測ゲート信号GS2を生成する。このようにして、信号処理回路11は、現在測定しているトラックにおいて、複数の計測ゲート信号GSを生成する。さらに、信号処理回路11は、各トラックにおける基準位置検出信号KSと位相SAと計測パラメータSPとに基づいて、トラックごとに複数の計測ゲート信号GSを生成する。即ち、信号処理回路11は、測定範囲RM内の複数のトラックTRのそれぞれに対して周方向に分割した複数の分割測定範囲に対応したゲート信号GSを生成する。
図5は、反応領域30と、計測ゲート信号GS1~GSmによる測定範囲RMと、測定対象のトラックTR1~TRnとの位置関係を示している。図5には、分析用基板20上の目的の位置に形成された場合の反応領域30を実線で示し、目的の位置からずれた位置に形成された場合の反応領域30を2点鎖線で示している。反応領域30が目的の位置からずれた位置に形成されたとしても、反応領域30が測定範囲RM内に位置するように、測定範囲RMは反応領域30よりも大きく設定されていることが望ましい。
信号処理回路11は、ステップS9にて、全てのトラックTR1~TRnにおいて、計測ゲート信号GS1~GSmごとに、光ピックアップ8から出力された受光レベル信号JSから微粒子パルス信号BS1~BSm(第2の検出信号)を抽出して微粒子パルス信号BS1~BSmごとにパルス数をカウントし、全てのトラックTR1~TRnの計測ゲート信号GS1~GSmごとのカウント値CVを取得する。即ち、信号処理回路11は、反応領域30に捕捉されている検出対象物質31と特異的に結合している微粒子33を、計測ゲート信号GSごとにカウントする。図4の(h)は、図5に示すトラックTRkにおける微粒子パルス信号BS1~BSmの一例を示している。
カウント値面内分布生成部13は、ステップS10にて、信号処理回路11から制御部12を介して、基準位置検出信号KS、トラック情報TF、及び、カウント値CVを取得し、測定範囲RMにおけるカウント値面内分布データを、テーブル形式のカウントデータTCDとして生成する。以下、テーブル形式のカウントデータTCDを、単にテーブルデータTCDとする。
図6はテーブルデータTCDの一例を示している。図6中の数値は、測定範囲RMにおけるトラックTR1~TRnの計測ゲート信号GS1~GSmごとの微粒子パルス信号BS内のパルス数のカウント値CVの一例を示している。なお、図6では、カウント値CVを10、50、または100の数値で示しているが、実際には実カウント値が入力される。即ち、反応領域30では、測定範囲RM内の複数のトラックTRのそれぞれに対して周方向に分割した複数の分割測定範囲ごとに微粒子パルス信号BS内のパルス数がカウントされることになる。
反応領域位置座標演算部14は、ステップS11にて、カウント値面内分布生成部13からテーブルデータTCDを取得する。さらに、反応領域位置座標演算部14は、テーブルデータTCDからカウント値の面内分布を取得し、反応領域30の位置(例えば反応領域30の中心座標)を推定する。反応領域位置座標演算部14は、カウント値面内分布データに基づいて、所定の大きさの形状に含まれるカウント値CVの合計値から反応領域30の位置を推定する。
反応領域30が所定の半径を有する円として設定されている場合、反応領域位置座標演算部14は、テーブルデータTCDにおけるカウント値の面内分布を画像として処理することにより、上記の円に対応する領域を特定し、円の中心位置から反応領域30の中心座標を推定してもよい。反応領域位置座標演算部14は、所定の半径と中心座標とから、反応領域30の位置(範囲)を推定してもよい。反応領域位置座標演算部14は、テーブルデータTCDに対して、反応領域30に対応する円を走査し、円内のカウント値の合計が最大となる円の中心位置(中心)を反応領域30の位置(中心座標)としてもよい。
反応領域位置座標演算部14は、カウント値の面内分布から、検出の確からしさを示すスコアSCを取得してもよい。スコアSCは一般的に画像認識で用いられる指標であり、面内分布から得られる図形と所定の半径を有する円とが一致する度合いを示す。スコアSCは、一致する度合いが高いほど高い値を示す。
制御部12、基準位置検出センサ6、光ピックアップ8、信号処理回路11、カウント値面内分布生成部13、または反応領域位置座標演算部14は、全ての反応領域30について、ステップS4~S11の処理を実行する。これにより、反応領域位置座標演算部14は、全ての反応領域30の位置(中心座標)を推定し、スコアSCを取得する。
反応領域位置判定部15は、ステップS12にて、反応領域位置座標演算部14から、全ての反応領域30の位置(中心座標)を推定し、スコアSCを取得する。さらに、反応領域位置判定部15は、反応領域30の位置(中心座標)及びスコアSCの少なくともいずれかを判定し、判定結果に基づいて、基準となる反応領域30(第1の反応領域)を選定する。反応領域位置判定部15で選定する第1の反応領域の数は2個または3個である。
反応領域位置判定部15は、全ての反応領域30について、例えば中心座標C30が所定の領域内に位置しているか否かを判定し、中心座標が所定の領域内に位置している反応領域30を、基準となる反応領域30として選定してもよい。
反応領域位置判定部15は、全ての反応領域30について、例えばスコアSCが閾値以上であるか否かを判定し、スコアSCが閾値以上である反応領域30を、基準となる反応領域30として選定してもよい。反応領域位置判定部15は、例えば連続するゲート信号GSのカウント値の差が閾値よりも大きい反応領域30を、基準となる反応領域30として選定してもよい。
オペレータがカウント値の面内分布を確認し、GUI(Graphical User Interface)等により、基準となる反応領域30を選定してもよい。なお、後述する精度のよい円CEを決定するためには、互いに離れた位置の複数の反応領域30を、基準となる反応領域30として選定することが好ましい。
図7は、分析用基板20上に8つの反応領域30が同一円周上に等間隔に形成されている状態を示している。8つの反応領域30を区別するために、図7には、反応領域30a~30hとして示している。以下に、ステップS12にて、反応領域位置判定部15が、基準となる反応領域30として図7に示す3つの反応領域30a、30d、及び30fを選定した場合について説明する。
図3Bにおいて、反応領域位置座標演算部14は、ステップS21にて、反応領域位置判定部15から判定結果JRを取得する。さらに、反応領域位置座標演算部14は、判定結果JRから、基準となる反応領域30a、30d、及び30f(第1の反応領域)の中心座標C30a、C30d、及びC30fを取得する。さらに、反応領域位置座標演算部14は、中心座標C30a、C30d、及びC30fから、例えば反応領域30a、30d、及び30fの各中心を通る正円として円CEを決定する。即ち、反応領域30a、30d、及び30fは、各中心が正円である円CE上に位置するように配置されていることになる。さらに、反応領域位置座標演算部14は、円CEの中心点CECを算出する。
反応領域位置座標演算部14は、ステップS22にて、反応領域30aの回転位相誤差PDa、反応領域30dの回転位相誤差PDd、及び、反応領域30fの回転位相誤差PDfを算出する。回転位相誤差PDaは、位相基準PRaから反応領域30aの例えば中心までの回転方向の位相差である。位相基準PRaは任意に設定することができる。
位相基準PRaから位相基準PRdまで回転方向の位相差は、関係式3/8(n=8)×2πにより算出することができる。nは分析用基板20上に形成されている反応領域30の数である。回転位相誤差PDdは、位相基準PRdから反応領域30dの例えば中心までの回転方向の位相差である。位相基準PRaから位相基準PRfまで回転方向の位相差は、関係式5/8(n=8)×2πにより算出することができる。回転位相誤差PDfは、位相基準PRfから反応領域30fの例えば中心までの回転方向の位相差である。さらに、反応領域位置座標演算部14は、回転位相誤差PDa、PDd、及びPDfの例えば平均値を算出し、平均回転位相誤差APDを取得する。
反応領域位置座標演算部14は、ステップS23にて、基準となる反応領域30a、30d、及び30f以外の反応領域30b、30c、30e、30g、及び30h(第2の反応領域)の位置を特定する。具体的には、反応領域位置座標演算部14は、位相基準PRbと平均回転位相誤差APDとに基づいて、反応領域30bの中心が円CE上に位置するときの中心座標C30bを算出する。同様に、反応領域位置座標演算部14は、位相基準PRc、PRe、PRg、及びPRhと平均回転位相誤差APDとに基づいて、反応領域30c、30e、30g、及び30hの各中心が円CE上に位置するときの中心座標C30c、C30e、C30g、及びC30hを算出する。即ち、反応領域位置座標演算部14は、選定された第1の反応領域のそれぞれの中心位置を通る円CEの円周と前記第1の反応領域のそれぞれの中心位置とに基づいて全ての前記反応領域の位置を特定することができる。
さらに、反応領域位置座標演算部14は、中心座標C30a~C30hと反応領域30の設計上の半径(または直径)とに基づいて、反応領域30a~30hの位置(範囲)を特定することができる。さらに、反応領域位置座標演算部14は、反応領域30a~30hの位置情報CF、及び、テーブルデータTCDを反応領域内カウント値演算部16へ出力する。位置情報CFは、反応領域30の設計上の半径(または直径)と中心座標C30a~C30hとを含む。
反応領域内カウント値演算部16は、ステップS24にて、位置情報CFに基づいて、テーブルデータTCDから、反応領域30a~30hに対応するカウント値を特定し、反応領域30ごとに合算する。これにより、分析装置1は、各反応領域30のカウント値を算出することができる。分析装置1は、反応領域30ごとに合算されたカウント値を表示装置等へ出力してもよい。なお、基準となる反応領域30として4つ以上の反応領域30が選定された場合についても、同様の手順により、各反応領域30のカウント値を算出することができる。
以下に、ステップS12にて、反応領域位置判定部15が、基準となる反応領域30として2つの反応領域30a及び30dを選定した場合について説明する。図3Bにおいて、反応領域位置座標演算部14は、ステップS31にて、反応領域位置判定部15から判定結果JRを取得する。さらに、反応領域位置座標演算部14は、判定結果JRから、基準となる反応領域30a及び30d(第1の反応領域)の中心座標C30a及びC30dを取得する。さらに、反応領域位置座標演算部14は、中心座標C30a及びC30dそれぞれの中心位置に対して、予め設定されている大きさの円CEの円周を当てはめることにより、例えば反応領域30a及び30dの各中心を通る円CEを決定する。
円CEの半径(または直径)は予め設定されているため、中心座標C30a及びC30dと円CEの半径とに基づいて、反応領域30a及び30dの各中心を通る円CEを決定することができる。即ち、反応領域30a及び30dは、各中心が円CE上に位置するように配置されていることになる。さらに、反応領域位置座標演算部14は、円CEの中心点CECを算出する。
反応領域位置座標演算部14は、ステップS32にて、反応領域30aの回転位相誤差PDa、及び、反応領域30dの回転位相誤差PDdを算出する。さらに、反応領域位置座標演算部14は、回転位相誤差PDa及びPDdの例えば平均値を算出し、平均回転位相誤差APDを取得する。
反応領域位置座標演算部14は、ステップS33にて、基準となる反応領域30a及び30d以外の反応領域30b、30c、及び30e~30h(第2の反応領域)の位置を特定する。反応領域30b、30c、及び30e~30hの位置(中心座標C30b、C30c、及びC30e~C30h)は、ステップS23と同様の手順により特定することができる。即ち、反応領域位置座標演算部14は、ステップS31にて決定した円CEの円周と第1の反応領域のそれぞれの中心位置とに基づいて全ての反応領域の位置を特定することができる。さらに、反応領域位置座標演算部14は、反応領域30a~30hの位置情報CF、及び、テーブルデータTCDを反応領域内カウント値演算部16へ出力する。
反応領域内カウント値演算部16は、ステップS34にて、位置情報CFに基づいて、テーブルデータTCDから、反応領域30a~30hに対応するカウント値を特定し、反応領域30ごとに合算する。これにより、分析装置1は、各反応領域30のカウント値のみを取得することができる。分析装置1は、反応領域30ごとに合算されたカウント値を表示装置等へ出力してもよい。
本実施形態の分析装置1及び分析方法では、テーブルデータTCDを生成し、テーブルデータTCDに基づいて各反応領域30の位置を推定し、基準となる反応領域30を選定する。さらに、本実施形態の分析装置1及び分析方法では、基準となる反応領域30に基づいて全ての反応領域30が配置される円CEを決定し、回転位相誤差PDに基づいて各反応領域30の位置を特定し、特定された反応領域30に対応するカウント値を特定することにより、テーブルデータTCDから反応領域30に対応する範囲のカウント値のみを取得することができる。
本実施形態の分析装置及び分析方法では、反応領域30の形状が所定の半径を有する円として説明したが、反応領域30の形状は円形に限らず、中心が特定できる形状あれば他の形状であってもよい。
従って、本実施形態の分析装置1及び分析方法によれば、反応領域30が分析用基板20上の目的の位置からずれた位置に形成されたとしても、ずれた位置における反応領域30のカウント値のみを抽出することができるため、分析精度の悪化を抑制することができる。
本発明は、上述した実施形態に限定されるものではなく、本発明の要旨を逸脱しない範囲において種々変更可能である。
本願の開示は、2019年3月25日に出願された特願2019-056601号に記載の主題と関連しており、それらの全ての開示内容は引用によりここに援用される。
Claims (7)
- トラック上に捕捉された検出対象物質に前記検出対象物質を標識する微粒子が固定されることにより反応領域が複数形成された分析用基板を用いる分析装置において、
前記分析用基板に対しレーザ光を照射することにより得られた反射光を受光し、受光レベル信号を生成する光ピックアップと、
前記分析用基板には測定範囲が予め設定されており、前記測定範囲内の複数の前記トラックのそれぞれに対して周方向に分割した複数の分割測定範囲に対応したゲート信号を生成するとともに、前記ゲート信号を用いて前記受光レベル信号から微粒子パルス信号を抽出し、抽出された前記微粒子パルス信号から前記ゲート信号ごとにパルス数をカウントし、分割測定範囲ごとにカウント値を出力する信号処理回路と、
前記信号処理回路から出力された前記カウント値に基づいて前記測定範囲におけるカウント値面内分布データを生成するカウント値面内分布生成部と、
前記カウント値面内分布データに基づいて、全ての前記反応領域の位置を推定する反応領域位置座標演算部と、
推定された全ての前記反応領域について、カウント値を算出する反応領域内カウント値演算部と、
を備える分析装置。 - 前記反応領域は、前記測定範囲の大きさに含まれる所定の大きさの形状であり、
前記反応領域位置座標演算部は、前記カウント値面内分布データに基づいて、前記所定の大きさの形状に含まれるカウント値の合計値から前記反応領域の位置を推定する、
請求項1に記載の分析装置。 - 前記反応領域位置座標演算部において推定した全ての前記反応領域から、第1の反応領域を選定する反応領域位置判定部をさらに備え、
前記反応領域位置座標演算部は、前記第1の反応領域の位置に基づいて、全ての前記反応領域の位置を特定し、
前記反応領域内カウント値演算部は、特定された全ての前記反応領域について、それぞれカウント値を算出する、
請求項1または2に記載の分析装置。 - 前記反応領域位置判定部で選定する前記第1の反応領域の数は2個または3個である、
請求項3に記載の分析装置。 - 前記反応領域位置判定部で選定する前記第1の反応領域の数が2個の場合、
2個の前記第1の反応領域のそれぞれの中心位置に対して、所定の大きさの正円の円周を当てはめることにより、前記円周と前記第1の反応領域のそれぞれの中心位置とに基づいて全ての前記反応領域の位置を特定する、
請求項4に記載の分析装置。 - 前記反応領域位置判定部で選定する前記第1の反応領域の数が3個の場合、
前記反応領域位置座標演算部は、選定された前記第1の反応領域のそれぞれの中心位置を通る正円の円周と前記第1の反応領域のそれぞれの中心位置とに基づいて全ての前記反応領域の位置を特定する、
請求項4に記載の分析装置。 - 光ピックアップが、トラック上に捕捉された検出対象物質に前記検出対象物質を標識する微粒子が固定されることにより反応領域が複数形成された分析用基板に対し、レーザ光を照射することにより得られた反射光を受光し受光レベル信号を生成し、
信号処理回路が、前記分析用基板に測定範囲が予め設定されており、前記測定範囲内の複数の前記トラックのそれぞれに対して周方向に分割した複数の分割測定範囲に対応したゲート信号を生成するとともに、前記ゲート信号を用いて前記受光レベル信号から微粒子パルス信号を抽出し、抽出された前記微粒子パルス信号から前記ゲート信号ごとにパルス数をカウントし、分割測定範囲ごとにカウント値を出力し、
カウント値面内分布生成部が、前記信号処理回路から出力された前記カウント値に基づいて前記測定範囲におけるカウント値面内分布データを生成し、
反応領域位置座標演算部が、前記カウント値面内分布データに基づいて、全ての前記反応領域の位置を推定し、
反応領域内カウント値演算部が、推定された全ての前記反応領域の全てについて、カウント値を算出する、
分析方法。
Priority Applications (2)
| Application Number | Priority Date | Filing Date | Title |
|---|---|---|---|
| EP20777591.7A EP3951396A4 (en) | 2019-03-25 | 2020-03-12 | ANALYTICAL DEVICE AND ANALYTICAL METHOD |
| US17/477,685 US20220003672A1 (en) | 2019-03-25 | 2021-09-17 | Analysis device and analysis method |
Applications Claiming Priority (2)
| Application Number | Priority Date | Filing Date | Title |
|---|---|---|---|
| JP2019056601A JP7310199B2 (ja) | 2019-03-25 | 2019-03-25 | 分析装置 |
| JP2019-056601 | 2019-03-25 |
Related Child Applications (1)
| Application Number | Title | Priority Date | Filing Date |
|---|---|---|---|
| US17/477,685 Continuation US20220003672A1 (en) | 2019-03-25 | 2021-09-17 | Analysis device and analysis method |
Publications (1)
| Publication Number | Publication Date |
|---|---|
| WO2020195871A1 true WO2020195871A1 (ja) | 2020-10-01 |
Family
ID=72611480
Family Applications (1)
| Application Number | Title | Priority Date | Filing Date |
|---|---|---|---|
| PCT/JP2020/010705 WO2020195871A1 (ja) | 2019-03-25 | 2020-03-12 | 分析装置及び分析方法 |
Country Status (4)
| Country | Link |
|---|---|
| US (1) | US20220003672A1 (ja) |
| EP (1) | EP3951396A4 (ja) |
| JP (1) | JP7310199B2 (ja) |
| WO (1) | WO2020195871A1 (ja) |
Citations (5)
| Publication number | Priority date | Publication date | Assignee | Title |
|---|---|---|---|---|
| JP2017058242A (ja) | 2015-09-16 | 2017-03-23 | 株式会社Jvcケンウッド | 検体検出用ユニット、分析装置、及び、分析方法 |
| WO2017134944A1 (ja) * | 2016-02-03 | 2017-08-10 | 株式会社Jvcケンウッド | 分析装置及び分析方法 |
| WO2018135404A1 (ja) * | 2017-01-19 | 2018-07-26 | パナソニック株式会社 | 試料収容ディスクおよび蛍光検出装置 |
| JP2018136297A (ja) * | 2017-02-22 | 2018-08-30 | 株式会社Jvcケンウッド | 分析装置及び分析方法 |
| JP2019056601A (ja) | 2017-09-20 | 2019-04-11 | 東芝産業機器システム株式会社 | 液面表示装置及び液冷式電気機器 |
Family Cites Families (2)
| Publication number | Priority date | Publication date | Assignee | Title |
|---|---|---|---|---|
| JP6586997B2 (ja) * | 2015-09-30 | 2019-10-09 | 株式会社Jvcケンウッド | 分析装置及び分析方法 |
| JP6959742B2 (ja) * | 2017-02-16 | 2021-11-05 | スタンレー電気株式会社 | 液晶表示装置、および、液晶モジュール |
-
2019
- 2019-03-25 JP JP2019056601A patent/JP7310199B2/ja active Active
-
2020
- 2020-03-12 EP EP20777591.7A patent/EP3951396A4/en not_active Withdrawn
- 2020-03-12 WO PCT/JP2020/010705 patent/WO2020195871A1/ja unknown
-
2021
- 2021-09-17 US US17/477,685 patent/US20220003672A1/en active Pending
Patent Citations (5)
| Publication number | Priority date | Publication date | Assignee | Title |
|---|---|---|---|---|
| JP2017058242A (ja) | 2015-09-16 | 2017-03-23 | 株式会社Jvcケンウッド | 検体検出用ユニット、分析装置、及び、分析方法 |
| WO2017134944A1 (ja) * | 2016-02-03 | 2017-08-10 | 株式会社Jvcケンウッド | 分析装置及び分析方法 |
| WO2018135404A1 (ja) * | 2017-01-19 | 2018-07-26 | パナソニック株式会社 | 試料収容ディスクおよび蛍光検出装置 |
| JP2018136297A (ja) * | 2017-02-22 | 2018-08-30 | 株式会社Jvcケンウッド | 分析装置及び分析方法 |
| JP2019056601A (ja) | 2017-09-20 | 2019-04-11 | 東芝産業機器システム株式会社 | 液面表示装置及び液冷式電気機器 |
Non-Patent Citations (1)
| Title |
|---|
| See also references of EP3951396A4 |
Also Published As
| Publication number | Publication date |
|---|---|
| EP3951396A1 (en) | 2022-02-09 |
| US20220003672A1 (en) | 2022-01-06 |
| JP2020159733A (ja) | 2020-10-01 |
| EP3951396A4 (en) | 2022-06-08 |
| JP7310199B2 (ja) | 2023-07-19 |
Similar Documents
| Publication | Publication Date | Title |
|---|---|---|
| US10627398B2 (en) | Analysis device and analysis method | |
| JP6740703B2 (ja) | 分析方法及び分析装置 | |
| JP5776433B2 (ja) | 光学的分析装置、光学的分析方法 | |
| WO2017134944A1 (ja) | 分析装置及び分析方法 | |
| US20200088626A1 (en) | Analysis device and analysis method | |
| JP6958166B2 (ja) | 分析装置及び分析方法 | |
| JP5510388B2 (ja) | 光学的分析装置、光学的分析方法 | |
| JP4498082B2 (ja) | 光学分析装置およびその粒子カウント方法 | |
| WO2020195871A1 (ja) | 分析装置及び分析方法 | |
| WO2019235208A1 (ja) | 分析用閾値生成装置及び分析用閾値生成方法 | |
| JP6883248B2 (ja) | 微粒子計測機、分析装置、及び、分析方法 | |
| WO2019235209A1 (ja) | 分析用閾値決定装置及び分析用閾値決定方法 | |
| JP7208468B2 (ja) | 分析装置及び分析方法 | |
| US10809178B2 (en) | Analysis device and analysis method | |
| JP7183899B2 (ja) | 分析装置及び分析方法 | |
| JP7218788B2 (ja) | 分析用閾値生成装置及び分析用閾値生成方法 | |
| CN112219107B (zh) | 分析用阈值生成装置以及分析用阈值生成方法 |
Legal Events
| Date | Code | Title | Description |
|---|---|---|---|
| 121 | Ep: the epo has been informed by wipo that ep was designated in this application |
Ref document number: 20777591 Country of ref document: EP Kind code of ref document: A1 |
|
| NENP | Non-entry into the national phase |
Ref country code: DE |
|
| ENP | Entry into the national phase |
Ref document number: 2020777591 Country of ref document: EP Effective date: 20211025 |