WO2020162069A1 - 異常検知装置 - Google Patents
異常検知装置 Download PDFInfo
- Publication number
- WO2020162069A1 WO2020162069A1 PCT/JP2019/050704 JP2019050704W WO2020162069A1 WO 2020162069 A1 WO2020162069 A1 WO 2020162069A1 JP 2019050704 W JP2019050704 W JP 2019050704W WO 2020162069 A1 WO2020162069 A1 WO 2020162069A1
- Authority
- WO
- WIPO (PCT)
- Prior art keywords
- state observer
- state
- target data
- abnormality
- detection device
- Prior art date
- Legal status (The legal status is an assumption and is not a legal conclusion. Google has not performed a legal analysis and makes no representation as to the accuracy of the status listed.)
- Ceased
Links
Images


Classifications
-
- G—PHYSICS
- G01—MEASURING; TESTING
- G01M—TESTING STATIC OR DYNAMIC BALANCE OF MACHINES OR STRUCTURES; TESTING OF STRUCTURES OR APPARATUS, NOT OTHERWISE PROVIDED FOR
- G01M17/00—Testing of vehicles
- G01M17/007—Wheeled or endless-tracked vehicles
-
- F—MECHANICAL ENGINEERING; LIGHTING; HEATING; WEAPONS; BLASTING
- F02—COMBUSTION ENGINES; HOT-GAS OR COMBUSTION-PRODUCT ENGINE PLANTS
- F02D—CONTROLLING COMBUSTION ENGINES
- F02D45/00—Electrical control not provided for in groups F02D41/00 - F02D43/00
-
- G—PHYSICS
- G05—CONTROLLING; REGULATING
- G05B—CONTROL OR REGULATING SYSTEMS IN GENERAL; FUNCTIONAL ELEMENTS OF SUCH SYSTEMS; MONITORING OR TESTING ARRANGEMENTS FOR SUCH SYSTEMS OR ELEMENTS
- G05B23/00—Testing or monitoring of control systems or parts thereof
- G05B23/02—Electric testing or monitoring
-
- G—PHYSICS
- G06—COMPUTING OR CALCULATING; COUNTING
- G06F—ELECTRIC DIGITAL DATA PROCESSING
- G06F18/00—Pattern recognition
- G06F18/20—Analysing
- G06F18/21—Design or setup of recognition systems or techniques; Extraction of features in feature space; Blind source separation
- G06F18/213—Feature extraction, e.g. by transforming the feature space; Summarisation; Mappings, e.g. subspace methods
- G06F18/2133—Feature extraction, e.g. by transforming the feature space; Summarisation; Mappings, e.g. subspace methods based on naturality criteria, e.g. with non-negative factorisation or negative correlation
-
- G—PHYSICS
- G06—COMPUTING OR CALCULATING; COUNTING
- G06F—ELECTRIC DIGITAL DATA PROCESSING
- G06F18/00—Pattern recognition
- G06F18/20—Analysing
- G06F18/21—Design or setup of recognition systems or techniques; Extraction of features in feature space; Blind source separation
- G06F18/214—Generating training patterns; Bootstrap methods, e.g. bagging or boosting
-
- G—PHYSICS
- G06—COMPUTING OR CALCULATING; COUNTING
- G06F—ELECTRIC DIGITAL DATA PROCESSING
- G06F18/00—Pattern recognition
- G06F18/20—Analysing
- G06F18/24—Classification techniques
- G06F18/243—Classification techniques relating to the number of classes
- G06F18/2433—Single-class perspective, e.g. one-against-all classification; Novelty detection; Outlier detection
-
- G—PHYSICS
- G06—COMPUTING OR CALCULATING; COUNTING
- G06N—COMPUTING ARRANGEMENTS BASED ON SPECIFIC COMPUTATIONAL MODELS
- G06N3/00—Computing arrangements based on biological models
- G06N3/02—Neural networks
- G06N3/04—Architecture, e.g. interconnection topology
- G06N3/044—Recurrent networks, e.g. Hopfield networks
-
- G—PHYSICS
- G06—COMPUTING OR CALCULATING; COUNTING
- G06N—COMPUTING ARRANGEMENTS BASED ON SPECIFIC COMPUTATIONAL MODELS
- G06N3/00—Computing arrangements based on biological models
- G06N3/02—Neural networks
- G06N3/04—Architecture, e.g. interconnection topology
- G06N3/045—Combinations of networks
-
- G—PHYSICS
- G06—COMPUTING OR CALCULATING; COUNTING
- G06N—COMPUTING ARRANGEMENTS BASED ON SPECIFIC COMPUTATIONAL MODELS
- G06N3/00—Computing arrangements based on biological models
- G06N3/02—Neural networks
- G06N3/08—Learning methods
Definitions
- the present disclosure relates to a device for detecting an abnormality or a sign of an abnormality of a device, in particular, a transportation device such as an automobile, an agricultural equipment, or a construction device by using a competitive neural network.
- Machine learning can be said to be a system with intelligence, and has the characteristic that it can improve the detection accuracy by itself.
- the neural network is modeled by paying attention to the characteristic function of the nervous system of an organism, and its usefulness is recognized.
- Patent Document 1 a competitive neural network is used for a device or equipment such as a rotating machine, and even if there are variations in the normal state due to the number of revolutions, aging deterioration, date and time, season, etc., actual sensor observation values can be obtained.
- An abnormality monitoring device that appropriately diagnoses the presence or absence of an abnormality by performing learning uniformly is disclosed.
- Patent Document 2 discloses an abnormality predictive diagnosis device that generates a normal model by machine learning and an actual sensor value, detects an abnormality by threshold value determination, and reconstructs the entire normal model according to changes in the external environment. Has been done.
- the purpose of the present disclosure is to perform highly accurate abnormality detection by performing learning by reflecting the function and failure mechanism of the device.
- An abnormality detection device includes a signal acquisition unit that acquires learning target data and monitoring target data, and a state observer generation unit that generates a state observer using variables included in an input variable configuration.
- a normal model generation unit that generates a threshold value by combining the learning target data and a first state observation value obtained by inputting the learning target data into the state observer, and inputting the learning target data to a competitive neural network
- an abnormality degree for calculating an anomaly degree by combining the monitoring target data and the second state observation value obtained by inputting the monitoring target data to the state observing device and inputting them to the competitive neural network.
- a determination unit that obtains a determination result by comparing the threshold value and the abnormality degree.
- An abnormality detection method acquires learning target data, generates a state observer using variables included in the input variable configuration, and inputs the learning target data to the state observer.
- the first state observation value obtained as a result and the learning target data are combined and input to a competitive neural network to generate a threshold value, obtain monitoring target data, and obtain the monitoring target data from the state observing device.
- Calculating an abnormality degree by combining the second state observation value obtained by inputting the second state observation value and the monitoring target data into the competitive neural network, and comparing the threshold value with the abnormality degree.
- the determination result is obtained by.
- a computer-executable abnormality detection program acquires learning target data, generates a state observer using variables included in the input variable configuration, and sets the learning target data to the state.
- a first state observation value obtained by inputting to an observer and the learning target data are combined and input to a competitive neural network to generate a threshold value, obtain monitoring target data, and obtain the monitoring target data.
- Is input to the state observer and the second state observation value and the monitoring target data are combined and input to the competitive neural network to calculate the abnormality degree, and the threshold value and the abnormality degree are calculated.
- the judgment result is obtained by comparing and.
- the function and the failure mechanism of the device are reflected by using the state observer, and the anomaly degree is calculated based on this by using the competitive neural network.
- highly accurate abnormality detection can be performed.
- FIG. 1 is a block diagram illustrating the configuration of the abnormality detection device according to the embodiment
- FIG. 2 is an explanatory diagram illustrating a state observer of the abnormality detection device according to the embodiment
- FIG. 3 is an explanatory diagram illustrating processing of the state observer generation unit of the abnormality detection device of the embodiment
- FIG. 4 is a flowchart illustrating the operation of the abnormality degree calculation unit of the abnormality detection device of the embodiment
- FIG. 5 is an explanatory diagram illustrating information displayed on the display unit of the abnormality detection device according to the embodiment
- FIG. 6 is a flowchart for explaining the operation at the time of learning of the abnormality detection device of the embodiment
- FIG. 7 is a flowchart for explaining the generation operation of the state observer of the abnormality detection device of the embodiment
- FIG. 8 is a flowchart for explaining the operation of the abnormality detection device of the embodiment during monitoring and factor analysis.
- the configuration disclosed in each embodiment is not limited to each embodiment alone, and it is possible to combine the embodiments.
- the configuration disclosed in one embodiment may be combined with another embodiment.
- the disclosed configurations may be collected and combined in each of the plurality of embodiments.
- the findings and problems described in the present disclosure are not known problems, but are the findings of the present inventor, and are facts that affirm the inventive step along with the configuration and method of the present disclosure.
- an in-vehicle abnormality detection device mainly mounted in an automobile will be described as an example, but the present invention is not limited to the in-vehicle abnormality detection device for a vehicle, unless otherwise limited by the claims. Is included.
- an abnormality detection device provided outside the vehicle and used by being connected to a connected ECU of the vehicle by wire or wirelessly can be used.
- the following embodiments include abnormality detection devices for vehicles and for vehicles other than vehicles.
- the "abnormality detection device” includes not only a device that detects an abnormality, but also a device that detects a sign of abnormality such as a sign of failure.
- the abnormality detection device 100 includes a signal acquisition unit 101, a learning target data storage unit 102, a monitoring target data storage unit 103, a state observer generation unit 104, a state observer information storage unit 105, a normal model generation unit 106, and a normal model parameter storage.
- a unit 107, an abnormality degree calculation unit 108, a determination unit 109, a factor analysis unit 110, and a display unit 111 are included.
- the signal acquisition unit 101 acquires “learning target data” and “monitoring target data”. Specifically, data acquired from various sensors directly or indirectly connected to the signal acquisition unit 101, for example, engine speed, turbine speed, oxygen sensor voltage, air-fuel ratio sensor current, etc. may be mentioned. In addition to these, temperature, humidity, position information, and the like are included.
- the learning target data and the monitoring target data can be indirectly acquired through a network as well as directly acquired from various sensors. For example, in the case of learning target data, it may be acquired by downloading from a database that stores reference values instead of from various sensors. Further, the signal acquisition unit 101 is not limited to the case of being acquired from the sensor, and may be a control input value, for example.
- the “learning target data” may be any data used for learning, and whether or not it is used for other purposes is arbitrary.
- the “monitoring target data” may be any monitoring target data, and whether or not it is used for another purpose is arbitrary. For example, it may be data that is also used as a learning target.
- Examples of various sensors include a thermometer, a hygrometer, a GPS, and the like, a drive system electronic control device that controls an engine, a steering wheel, a brake, and the like, a vehicle body system electronic control device that controls a meter, a power window, or the like, or an obstacle.
- An example is a sensor connected to a safety control system electronic control unit that performs control for preventing a collision with an object or a pedestrian, which is mounted on an automobile.
- the learning target data storage unit 102 stores the learning target data acquired by the signal acquisition unit 101. Then, the stored learning target data is input to the normal model generation unit 106 described later.
- the monitoring target data storage unit 103 also stores the monitoring target data acquired by the signal acquisition unit 101. Then, the stored monitoring target data is input to the abnormality degree calculating unit 108 described later.
- These storage units are assumed to be hard disks (HDD), flash memories, etc., but may be random access memories (RAM). Further, it may be either a volatile memory or a non-volatile memory.
- the state observer generation unit 104 generates a state observer using the variables included in the “variable structure”.
- the state observer is also called an observer or a soft sensor.
- the variables are variables corresponding to the learning target data and the monitoring target data acquired by the signal acquisition unit 101.
- the state observer generation unit 104 has an input means (corresponding to “input unit”), it is necessary or useful for the state observer to express the function or failure mechanism of the device based on the knowledge of the setter. You may make it input a variable structure. Specific examples of the state observer and variables constituting the state observer will be described later.
- the “variable configuration” refers to one variable or a combination of a plurality of variables.
- the state observer generation unit 104 generates a state observer by linearly combining the variables included in the input variable configuration, as shown in Expression (1).
- the initial value of the coefficient a is set to a random value, and the learning target data is used to perform the coupling to generate the initial state of the state observer.
- a coefficient, x: Variable, p: number of state observers, n: number of variables a p X p: p th state observer (state observation)
- the state observing device “reflects” the function of the device to be detected by the abnormality detection device 100 or the “device failure mechanism”.
- the function of the device include driving, which is the function of the automobile, and air-fuel ratio, which is the function of the automobile.
- driving which is the function of the automobile
- air-fuel ratio which is the function of the automobile.
- An example of a device failure mechanism is an engine overheat mechanism. Engine overheating is a mechanism in which the engine temperature rises due to abnormalities in the cooling system and engine overload, causing seizure.
- the “device failure mechanism” refers to a mechanism in which a device failure occurs.
- “reflecting” means that the state observation value output from the state observer changes according to the function of the device or the failure mechanism of the device.
- the variable included in the variable configuration of the state observer is preferably a “factor” of the function of the device to be detected by the abnormality detection device 100 or the failure mechanism of the device.
- the engine temperature is a direct factor that causes overheating
- the engine speed and the amount of coolant are the direct factors that cause the engine temperature to rise. That is, it is an indirect factor that causes overheating.
- factors of the function of the device will be described below as the present embodiment.
- the “factor” refers to the fact that affects the function of the device or the failure mechanism of the device.
- a drive system state observing device (corresponding to “first state observing device”) for a drive system of an automobile is generated
- a variable related to the drive system of the automobile for example, engine rotation speed
- the state observer of the equation (2) is generated by linearly combining the number (x 11 ) and the turbine speed (x 12 ).
- a 11 , a 12 initial value of coefficient u: drive system state observation value
- an air-fuel ratio system state observing device (“second state”) for the ratio of air and fuel supplied to the engine.
- a variable related to the air-fuel ratio of the engine for example, the oxygen sensor voltage (x 21 ) and the air-fuel ratio sensor current (x 22 ) is linearly combined to obtain the state of the equation (3).
- a 21 , a 22 initial value of coefficient v: air-fuel ratio system state observed value
- variables other than these variables may be used.
- the number of variables to be combined is not limited to two.
- the number of state observers is not limited to two. For example, one may be used, or the third and subsequent state observers (corresponding to the “third state observer”) may be generated.
- an example of the state observing device has a two-layer structure of input and output, but it may have three or more layers.
- a hierarchical neural network may be used for the description.
- it may be described using the kernel space.
- a regularization term may be introduced.
- linearly combining variables has been described as a state observer, but the present invention is not limited to this, and may be configured by non-linear combination.
- a state observer e.g., a hierarchical neural network is used for description, since a sigmoid function is used, it is composed of nonlinear couplings.
- the learning target data used when the state observer generation unit 104 generates the state observer may be subjected to distribution conversion that approximates a normal distribution.
- distribution transformation include Box-Cox transformation or Johnson transformation. By doing so, the abnormality detection accuracy of the determination unit 109 described below may be improved.
- the distribution conversion parameter is stored in the state observer information storage unit 105, which will be described later, and is output to the normal model generation unit 106 and the abnormality degree calculation unit 108. Then, similar distribution conversion is performed on the learning target data input to the normal model generation unit 106 and the monitoring target data input to the abnormality degree calculation unit 108.
- the number of state observers is plural, it is desirable to further maximize the correlation between the state observers as shown in FIG.
- the state observer is composed of the first state observer and the second state observer
- the correlation between the first state observer and the second state observer is maximized under the constraint condition. ..
- the number of state observers is three or more, the correlation between two state observers of an arbitrary combination is maximized under the constraint conditions. As a result, the fluctuation range of normal data due to noise is limited, and the accuracy of abnormality detection can be improved.
- the correlation can be maximized by adjusting the two coefficients.
- the numerator of equation (4) is the sample covariance of the first state observer and the second state observer, and the denominator is the sample variance of the first state observer and the sample variance of the second state observer, respectively. is there.
- the second line of the equation (4) is a constraint condition of Lagrange's undetermined multiplier method, which is 1 in the case of the present embodiment.
- ⁇ Correlation n: nth state observer m: mth state observer a: coefficient V: variance
- the state observer comprises three of the first state observer, the second state observer, and the third state observer, as shown in FIG. It is desirable to maximize the sum.
- the maximization is performed in the same manner as in the case of three.
- the "sum” may include a sum in the calculation such as a sum of squares, a sum of absolute values, etc. in addition to a simple sum.
- the sum of the correlations between the two state observers can be maximized.
- g is a function representing the sum, and the parenthesized object is the target of the sum, that is, the correlation between the nth state observer and the mth state observer.
- N total number of state observers
- the state observer information storage unit 105 stores the coefficient of the state observer obtained by the state observer generator 104, and in the present embodiment, the coefficient (a 11 , a 12 ) of the drive system state observer obtained by maximizing the correlation. ), and the coefficients (a 21 , a 22 ) of the air-fuel ratio system state observer are stored. The variable configuration of the state observer is also saved.
- the state observer generation unit 104 only needs to be provided when generating the state observer, and once the state observer is generated, the variable configuration of the state observer and the coefficient of the state observer are stored in the state observer information storage unit. After being stored in 105 for use, it may be separated from the abnormality detection device 100.
- the normal model generation unit 106 "combines" the first state observation value obtained by inputting the learning target data into the state observer and the learning target data, and inputs the normal model into the competitive neural network.
- the first state observation value is obtained by reading the variable configuration and the coefficient of the state observer from the state observer information storage unit 105 and applying the learning target data read from the learning target data storage unit 102 to the variable.
- the engine rotation speed and the turbine rotation speed acquired as the learning target data are input to the equation (2) to obtain the drive system state observation value (u 1 ) (corresponding to the “first state observation value”).
- the oxygen sensor voltage and the air-fuel ratio sensor current acquired as the learning target data are input to the equation (3) to obtain the air-fuel ratio system state observation value (v 1 ) (corresponding to the “first state observation value”).
- the air-fuel ratio system state observation value (v 1 ) (corresponding to the “first state observation value”).
- six data of the engine speed, the turbine speed, the drive system state observation value (u 1 ), the oxygen sensor voltage, the air-fuel ratio sensor current, and the air-fuel ratio system state observation value (v 1 ) are used as the competitive neural network ( NN).
- “combined" is sufficient as long as the first state observation value and the learning target data can be simultaneously input to the competitive neural network.
- the initial value given to the competitive neural network for example, when there are a plurality of combinations of attributes of input data such as vehicle type, measurement season, day and night, customized specifications, and fiscal year, it is desirable to sample uniformly. .. Alternatively, it is desirable to sample at random. This makes it possible to speed up the convergence of the neuron weight vector on the map of the competitive neural network at the time of learning.
- a competitive neural network is a network consisting of only an input layer and an output layer, and is composed of a plurality of input layer neurons and a plurality of output layer neurons that are fully connected to the input layer neurons.
- the degree of abnormality which is the difference between the learning target data and the state observation value input to the competitive neural network, and the neuron weight data of the winner unit is obtained.
- the threshold is obtained using the set of differences. For example, a constant multiple of the 99.9% quantile of the set of differences (absolute values) is used as the threshold value.
- the normal model parameter storage unit 107 stores the threshold value obtained by the normal model generation unit 106.
- the abnormality degree calculation unit 108 "combines" the second state observation value obtained by inputting the monitoring target data into the state observing device and the monitoring target data and inputs the data into the competitive neural network, thereby outputting the output layer.
- the degree of abnormality is calculated using the weight data of the neuron.
- the second state observation value is obtained by reading the variable configuration and coefficient of the state observer from the state observer information storage unit 105 and applying the monitoring target data read from the monitoring target data storage unit 103 to such variable. Ask for.
- the distribution conversion parameter is read from the state observer information storage unit 105 and the distribution conversion is performed on the monitoring target data.
- the engine rotation speed and the turbine rotation speed acquired as the monitoring target data are input to the equation (2) to obtain the drive system state observation value (u 2 ) (corresponding to the “second state observation value”).
- the oxygen sensor voltage and the air-fuel ratio sensor current acquired as the data to be monitored are input to the equation (3) to obtain the air-fuel ratio system state observation value (v 2 ) (corresponding to the “second state observation value”).
- six data of engine speed, turbine speed, drive system state observation value (u 2 ), oxygen sensor voltage, air-fuel ratio sensor current, and air-fuel ratio system state observation value (v 2 ) are provided to the competitive neural network ( NN).
- “combined" is sufficient as long as the second state observation value and the monitoring target data can be simultaneously input to the competitive neural network.
- the degree of abnormality is calculated from the difference value between the monitoring target data and state observation value input to the competitive neural network and the weight data of each output layer neuron.
- the loop counter (l) is set to 1 (S101). Monitored data at the monitoring point (k) (Z k), it weights the data (W i, j) of the neurons of the closest neural network minimum Euclidean distance (d ⁇ k, l) and obtaining the (S102) ..
- the symbols “d ⁇ ” in this specification mean d with a tilde.
- the cosine similarity (cos ⁇ k,l ) between the monitored data (Z k ) and the neuron weight data (W′ k,l ) of the neural network close to it is calculated (S103).
- the degree of abnormality (c k,l ) is obtained from the minimum Euclidean distance (d to k,l ) and the cosine similarity (cos ⁇ k,l ) (S104). If the loop counter (l) does not exceed the predetermined loop count (L) (S105:N), the loop counter (l) is incremented (S106), and the neuron ( W'k,l ) closest to the monitored data is acquired. W i,j ) corresponding to is removed from the neuron set (W) (S107), and the process returns to S102.
- the loop counter (l) exceeds the predetermined number of loops (L) (S105: Y)
- the sum of the abnormalities corresponding to the predetermined number of loops (L) is set as the abnormality level (c k ) (S108). ..
- the loop count (L) can be set arbitrarily, and is set to 10 times, for example.
- the determination unit 109 obtains a determination result by comparing the threshold value read from the normal model parameter storage unit 107 and the abnormality degree (c k ) output from the abnormality degree calculation unit 108. Specifically, if the degree of abnormality is greater than or equal to the threshold value, the determination result that there is abnormality is output. If the degree of abnormality is less than the threshold value, the determination result that there is no abnormality is output.
- the factor analysis unit 110 uses the second state observation value and the monitoring target data that have caused the determination of “abnormal” to determine the cause of “abnormal”. Identify.
- the factor analysis unit 110 further uses the second state observation value and the monitoring target data that are the cause of the abnormality determination as a reference, and the second state observation value and the monitoring state before and after, or before and after in time.
- the target data may be used to identify the cause of the abnormality.
- identifying the cause of the abnormality is called factor analysis.
- "abnormality" includes not only an abnormality but also a sign of abnormality.
- the cause of the abnormality is specified by using the second state observation value and the monitoring target data that are determined to be abnormal, and a total of 11 points of data of 5 points before and after them.
- f k calculated by the abnormality degree calculation unit 108 and the values of five points before and after the f k are read from a separately provided storage unit, and are read as F To do.
- s is a value that specifies the monitoring target data or the state observation value, and 1 ⁇ s ⁇ S.
- S is the total number of monitored data and state observation values.
- the correspondence is assumed to be as follows.
- F includes each abnormality degree of the state observer and each abnormality degree of the monitoring target data.
- the degree of abnormality of each state observer and the overall tendency of abnormality are compared in the form of similarity. Then, the functional block of the device to which the state observer s having the maximum absolute value of the similarity ⁇ s corresponds is estimated to be the functional block causing the abnormality.
- the Pearson product moment correlation of the equation (9) is used as a method for examining the similarity.
- the cosine similarity, the Spearman rank correlation coefficient, the Kendall rank correlation coefficient, and the cross correlation function are used.
- DTW, KL distance, etc. may be used.
- the relation between f all and f k,s may be regarded as a graphical model, and regularization may be introduced to eliminate pseudo correlation or weak correlation.
- FIG. 5A shows information displayed on the display unit 111. According to this view, displaying the overall abnormal trends f all, the degree of abnormality f k for each state observers, s, error probability f k of the actual sensor and the control input value, s, and their similarity gamma s Therefore, it is possible to visually identify which functional block, the actual sensor, or the like has an abnormality. In addition, display by drilling down or rolling up may be introduced in order to select display contents and prevent unnecessary information from being displayed.
- FIG. 5B is a display example in this embodiment.
- FIG. 6 is a flowchart showing the learning operation of the abnormality detection device 100.
- the signal acquisition unit 101 acquires learning target data from various sensors and the like (S201).
- the signal acquisition unit 101 performs distribution conversion on the learning target data (S202).
- the learning target data storage unit 102 stores the learning target data after the distribution conversion (S203).
- the state observer generation unit 104 generates a state observer using the variables included in the input variable configuration (S204). The generation of the state observer will be described as a process of a separate subroutine with reference to FIG.
- the normal model generation unit 106 obtains a first state observation value obtained by inputting the learning target data to the state observer (S205).
- the normal model generation unit 106 combines the first state observation value and the learning target data (S206).
- the normal model generation unit 106 randomly performs sampling from a combination of data obtained by combining the first state observation value and the learning target data (S207).
- the competitive neural network of the normal model generation unit 106 generates a threshold value from the first state observation value and learning target data (S208).
- the normal model parameter storage unit 107 stores the threshold value of the normal model (S209).
- FIG. 7 is a flowchart of a subroutine showing the state observer generation operation in the state observer generation unit 104 of the abnormality detection device 100.
- the variable configuration is input to the state observer generation unit 104 (S301).
- the state observer generation unit 104 uses the variables included in the input variable configuration, sets the coefficient to an initial value, and combines the learning target data to generate a state observer (S302).
- the state observer generation unit 104 determines whether the generated state observer is single or plural (S303). If it is singular, the coefficient and variable configuration of the state observer is stored in the state observer information storage unit 105 (S304), and the process ends. If there is more than one, the process proceeds to S305.
- the state observer generation unit 104 determines whether there are two or three or more generated state observers (S305). If there are two, the process proceeds to S306. If there are three or more, the process moves to S307. When there are two generated state observers, the state observer generation unit 104 maximizes the correlation between the two state observers (S306), and moves the process to S304. When the number of generated state observers is three or more, the state observer generation unit 104 maximizes the sum of correlations between the two state observers (S307), and moves the process to S304.
- FIG. 8 is a flowchart showing operations during monitoring and factor analysis of the abnormality detection device 100.
- the signal acquisition unit 101 acquires monitoring target data from various sensors and the like (S401).
- the signal acquisition unit 101 reads the distribution conversion parameter from the state observer information storage unit 105 and performs distribution conversion on the monitoring target data (S402).
- the abnormality degree calculation unit 108 obtains a second state observation value obtained by inputting the monitoring target data to the state observer (S403).
- the abnormality degree calculation unit 108 combines the second state observation value and the monitoring target data (S404).
- the competitive neural network of the abnormality degree calculation unit 108 calculates the abnormality degree from the combined data (S405).
- the determination unit 109 obtains a determination result by comparing the threshold value read from the normal model parameter storage unit 107 and the abnormality degree output from the abnormality degree calculation unit 108 (S406). If the degree of abnormality is less than or equal to the threshold value, the result of determination of normality is output (S407). If the degree of abnormality is larger than the threshold value, the determination result of abnormality is output (S408). When the determination result of the determination unit 109 indicates an abnormality (S408), the factor analysis unit 110 identifies the cause of the abnormality using the second state observation value and the monitoring target data that have caused the determination to be abnormal (S408). S409).
- the block diagram used in the description of the embodiment shows the configuration of the abnormality detection device classified and organized by function. These functional blocks are realized by any combination of hardware and software. Further, since the functions are shown, the block diagram can be understood as the disclosure of the method invention.
- first and second used in each embodiment and in the claims are used to distinguish two or more configurations and methods of the same kind, and do not limit the order or superiority or inferiority. ..
- the abnormality detection device of the present disclosure is mounted on a vehicle, that is, the vehicle-mounted device is described, but it may be mounted on or connected to a device other than the vehicle.
- An example of an abnormality detection device is a failure diagnosis tool, but it is not limited to this form or name.
- parts and semi-finished products include semiconductors, electronic circuits, modules, and ECUs (electronic control units).
- ECUs electronic control units
- completed products include drive recorders, car navigation systems, smartphones, personal computers, mobile phones, and personal digital assistants.
- the present disclosure can be realized not only by dedicated hardware having the configuration and function described in each embodiment, but also by a program for realizing the present disclosure recorded in a recording medium such as a memory or a hard disk, and It can also be realized as a combination with general-purpose hardware having an executable dedicated or general-purpose CPU and memory.
- a program stored in a non-transitional physical recording medium of dedicated or general-purpose hardware for example, external storage device (hard disk, USB memory, CD/BD, etc.), or internal storage device (RAM, ROM, etc.)
- dedicated or general-purpose hardware for example, external storage device (hard disk, USB memory, CD/BD, etc.), or internal storage device (RAM, ROM, etc.)
- RAM random access memory
- ROM read-only memory
- the anomaly detection device can be used to detect anomalies in various devices as well as in-vehicle applications.
Landscapes
- Engineering & Computer Science (AREA)
- Physics & Mathematics (AREA)
- Theoretical Computer Science (AREA)
- General Physics & Mathematics (AREA)
- Data Mining & Analysis (AREA)
- General Engineering & Computer Science (AREA)
- Evolutionary Computation (AREA)
- Life Sciences & Earth Sciences (AREA)
- Artificial Intelligence (AREA)
- Computational Linguistics (AREA)
- Molecular Biology (AREA)
- Computing Systems (AREA)
- Biophysics (AREA)
- Biomedical Technology (AREA)
- Mathematical Physics (AREA)
- Software Systems (AREA)
- Health & Medical Sciences (AREA)
- General Health & Medical Sciences (AREA)
- Computer Vision & Pattern Recognition (AREA)
- Evolutionary Biology (AREA)
- Bioinformatics & Cheminformatics (AREA)
- Bioinformatics & Computational Biology (AREA)
- Automation & Control Theory (AREA)
- Chemical & Material Sciences (AREA)
- Combustion & Propulsion (AREA)
- Mechanical Engineering (AREA)
- Testing And Monitoring For Control Systems (AREA)
- Combined Controls Of Internal Combustion Engines (AREA)
Abstract
機器の機能や故障メカニズムを反映させて学習を行うことで、高精度の異常検知を行う。 異常検知装置(100)は、学習対象データ及び監視対象データを取得する信号取得部(101)と、入力された変数構成に含まれる変数を用いて状態観測器を生成する状態観測器生成部(104)と、学習対象データを状態観測器に入力して得られる第1の状態観測値、及び学習対象データ、を結合して競合型ニューラルネットワークに入力することにより閾値を生成する正常モデル生成部(106)と、監視対象データを状態観測器に入力して得られる第2の状態観測値、及び監視対象データ、を結合して競合型ニューラルネットワークに入力することにより異常度を計算する異常度算出部(108)と、閾値と異常度とを比較することにより判定結果を求める判定部(109)とを有する。
Description
本出願は、2019年2月7日に出願された日本特許出願番号2019-021084号に基づくもので、ここにその記載内容を援用する。
本開示は、競合型ニューラルネットワークを用いて、機器の異常や異常の予兆、特に自動車などの輸送機器や農具機器、建設機器の異常や異常の予兆を検知する装置に関するものである。
近年、機械学習を用いた各種機器の異常検知が提案されている。機械学習は知能を持ったシステムとも言え、自ら検知精度を高めることができるという特質を有する。特に、ニューラルネットワークは、生物の神経系の特徴的な機能に着目してモデル化を行ったものであり、その有用性が認識されている。
例えば、特許文献1には、回転機器等の装置や設備に対し、競合型ニューラルネットワークを用い、回転数、経年劣化、日時、季節等によって正常状態にばらつきがある場合でも、実センサ観測値を万遍なく学習させることにより異常の有無を適切に診断する異常監視装置が開示されている。
また、特許文献2には、機械学習と実センサ値によって正常モデルを生成し、閾値判定により異常を検出し、外部環境の変化に応じて正常モデルの全体を再構築する異常予兆診断装置が開示されている。
また、特許文献2には、機械学習と実センサ値によって正常モデルを生成し、閾値判定により異常を検出し、外部環境の変化に応じて正常モデルの全体を再構築する異常予兆診断装置が開示されている。
本発明者の詳細な検討の結果、実センサの観測値から読み取れる情報や特徴から異常を検出するための閾値を求める場合、外部環境の変化に伴い、異常を正常と判定する誤判定が生じやすい。また、機器の機能や故障メカニズムを考慮せず学習を進めると、あるべき方向とは異なる学習を進めてしまい、機器の機能や故障メカニズムから乖離してしまうという課題を見出だした。
本開示の目的は、機器の機能や故障メカニズムを反映させて学習を行うことで、高精度の異常検知を行うことにある。
本開示の一態様による異常検知装置は、学習対象データ及び監視対象データを取得する信号取得部と、入力された変数構成に含まれる変数を用いて状態観測器を生成する状態観測器生成部と、前記学習対象データを前記状態観測器に入力して得られる第1の状態観測値、及び前記学習対象データ、を結合して競合型ニューラルネットワークに入力することにより閾値を生成する正常モデル生成部と、前記監視対象データを前記状態観測器に入力して得られる第2の状態観測値、及び前記監視対象データ、を結合して前記競合型ニューラルネットワークに入力することにより異常度を計算する異常度算出部と、前記閾値と前記異常度とを比較することにより判定結果を求める判定部と、を有するものである。
本開示の他の態様による異常検知方法は、学習対象データを取得し、入力された変数構成に含まれる変数を用いて状態観測器を生成し、前記学習対象データを前記状態観測器に入力して得られる第1の状態観測値、及び前記学習対象データ、を結合して競合型ニューラルネットワークに入力することにより閾値を生成し、監視対象データを取得し、前記監視対象データを前記状態観測器に入力して得られる第2の状態観測値、及び前記監視対象データ、を結合して前記競合型ニューラルネットワークに入力することにより異常度を計算し、前記閾値と前記異常度とを比較することにより判定結果を求める。
本開示の他の態様によるコンピュータで実行可能な異常検知プログラムは、学習対象データを取得し、入力された変数構成に含まれる変数を用いて状態観測器を生成し、前記学習対象データを前記状態観測器に入力して得られる第1の状態観測値、及び前記学習対象データ、を結合して競合型ニューラルネットワークに入力することにより閾値を生成し、監視対象データを取得し、前記監視対象データを前記状態観測器に入力して得られる第2の状態観測値、及び前記監視対象データ、を結合して前記競合型ニューラルネットワークに入力することにより異常度を計算し、前記閾値と前記異常度とを比較することにより判定結果を求める。
本開示の異常検知装置、異常検知方法、及び異常検知プログラムによれば、状態観測器を用いることにより機器の機能や故障メカニズムを反映させ、これを基に競合型ニューラルネットワークを用いて異常度を計算することで、高精度の異常検知を行うことができる。
また、このような状態観測器を用いることにより、機器のどの機能やどの部分で異常が生じているのか、あるいは異常が生じる可能性があるのかを分析することができる。
また、このような状態観測器を用いることにより、機器のどの機能やどの部分で異常が生じているのか、あるいは異常が生じる可能性があるのかを分析することができる。
以下、本開示の実施形態について、図面を参照して説明する。
なお、以下に示す本発明とは、請求の範囲に記載された発明を意味するものであり、以下の実施形態に限定されるものではない。また、少なくともダブルクォーテーション内の語句は、請求の範囲に記載された語句を意味し、同じく以下の実施形態に限定されるものではない。
請求の範囲の従属項に記載の構成及び方法、従属項に記載の構成及び方法に対応する実施形態の構成及び方法、並びに請求の範囲に記載がなく実施形態のみに記載の構成及び方法は、本発明においては任意の構成及び方法である。請求の範囲の記載が実施形態の記載よりも広い場合における実施形態に記載の構成及び方法も、本発明の構成及び方法の例示であるという意味で、本発明においては任意の構成及び方法である。いずれの場合も、請求の範囲の独立項に記載することで、本発明の必須の構成及び方法となる。
実施形態に記載した効果は、本発明の例示としての実施形態の構成を有する場合の効果であり、必ずしも本発明が有する効果ではない。
複数の実施形態がある場合、各実施形態に開示の構成は各実施形態のみで閉じるものではなく、実施形態をまたいで組み合わせることが可能である。例えば一の実施形態に開示の構成を、他の実施形態に組み合わせても良い。また、複数の実施形態それぞれに開示の構成を集めて組み合わせても良い。
本開示に記載した知見や課題は公知の課題ではなく、本発明者が独自に知見したものであり、本開示の構成及び方法と共に発明の進歩性を肯定する事実である。
なお、以下に示す本発明とは、請求の範囲に記載された発明を意味するものであり、以下の実施形態に限定されるものではない。また、少なくともダブルクォーテーション内の語句は、請求の範囲に記載された語句を意味し、同じく以下の実施形態に限定されるものではない。
請求の範囲の従属項に記載の構成及び方法、従属項に記載の構成及び方法に対応する実施形態の構成及び方法、並びに請求の範囲に記載がなく実施形態のみに記載の構成及び方法は、本発明においては任意の構成及び方法である。請求の範囲の記載が実施形態の記載よりも広い場合における実施形態に記載の構成及び方法も、本発明の構成及び方法の例示であるという意味で、本発明においては任意の構成及び方法である。いずれの場合も、請求の範囲の独立項に記載することで、本発明の必須の構成及び方法となる。
実施形態に記載した効果は、本発明の例示としての実施形態の構成を有する場合の効果であり、必ずしも本発明が有する効果ではない。
複数の実施形態がある場合、各実施形態に開示の構成は各実施形態のみで閉じるものではなく、実施形態をまたいで組み合わせることが可能である。例えば一の実施形態に開示の構成を、他の実施形態に組み合わせても良い。また、複数の実施形態それぞれに開示の構成を集めて組み合わせても良い。
本開示に記載した知見や課題は公知の課題ではなく、本発明者が独自に知見したものであり、本開示の構成及び方法と共に発明の進歩性を肯定する事実である。
(実施形態)
1.異常検知装置の構成
まず、図1を用いて、本実施形態の異常検知装置100(“異常検知装置”に相当)の構成を説明する。
なお、以下の実施形態は、主として自動車に搭載された車載用の異常検知装置を例として説明するが、本発明は、特許請求の範囲で限定がない限り、車載用以外の車両用異常検知装置を含むものである。例えば、車両の外部に設けられ、車両のコネクテッィドECUに有線又は無線で接続して用いる異常検知装置が挙げられる。
さらに、以下の実施形態は、車載用や車両用以外の異常検知装置も含むものである。
ここで、“異常検知装置”とは、異常を検知する装置だけでなく、故障の予兆など、異常の予兆を検知する装置も含む。
1.異常検知装置の構成
まず、図1を用いて、本実施形態の異常検知装置100(“異常検知装置”に相当)の構成を説明する。
なお、以下の実施形態は、主として自動車に搭載された車載用の異常検知装置を例として説明するが、本発明は、特許請求の範囲で限定がない限り、車載用以外の車両用異常検知装置を含むものである。例えば、車両の外部に設けられ、車両のコネクテッィドECUに有線又は無線で接続して用いる異常検知装置が挙げられる。
さらに、以下の実施形態は、車載用や車両用以外の異常検知装置も含むものである。
ここで、“異常検知装置”とは、異常を検知する装置だけでなく、故障の予兆など、異常の予兆を検知する装置も含む。
異常検知装置100は、信号取得部101、学習対象データ記憶部102、監視対象データ記憶部103、状態観測器生成部104、状態観測器情報記憶部105、正常モデル生成部106、正常モデルパラメータ記憶部107、異常度算出部108、判定部109、要因分析部110、表示部111、を有する。
信号取得部101は、“学習対象データ”及び“監視対象データ”を取得する。具体的には、信号取得部101に直接又は間接的に接続された各種センサから取得したデータ、例えばエンジン回転数、タービン回転数、酸素センサ電圧、空燃比センサ電流、などが挙げられる。この他、温度、湿度、位置情報、等が挙げられる。学習対象データ及び監視対象データは、各種センサから直接取得する場合の他、ネットワークを通じて間接的に取得することもできる。例えば、学習対象データの場合、各種センサからではなく、基準値を保存したデータベースからダウンロードすることにより取得してもよい。また、信号取得部101はセンサから取得される場合に限らず、例えば制御入力値であってもよい。
ここで、“学習対象データ”とは、学習に用いるためのデータあればよく、他の目的に用いられるかどうかは任意である。
また、“監視対象データ”とは、監視対象のデータであればよく、他の目的に用いられるかどうかは任意である。例えば学習対象にも用いられるデータであってもよい。
ここで、“学習対象データ”とは、学習に用いるためのデータあればよく、他の目的に用いられるかどうかは任意である。
また、“監視対象データ”とは、監視対象のデータであればよく、他の目的に用いられるかどうかは任意である。例えば学習対象にも用いられるデータであってもよい。
各種センサの例として、温度計、湿度計、GPS等の他、エンジン、ハンドル、ブレーキ等の制御を行う駆動系電子制御装置、メータやパワーウインドウ等の制御を行う車体系電子制御装置、又は障害物や歩行者との衝突を防止するための制御を行う安全制御系電子制御装置、に接続されたセンサであって自動車に搭載されたものが挙げられる。
学習対象データ記憶部102は、信号取得部101で取得した学習対象データを記憶する。そして、記憶された学習対象データは、後述の正常モデル生成部106に入力される。
また、監視対象データ記憶部103は、信号取得部101で取得した監視対象データを記憶する。そして、記憶された監視対象データは、後述の異常度算出部108に入力される。
これらの記憶部は、ハードディスク(HDD)やフラッシュメモリ等を想定しているが、ランダムアクセスメモリ(RAM)であってもよい。また、揮発性メモリ、不揮発性メモリのいずれであってもよい。
また、監視対象データ記憶部103は、信号取得部101で取得した監視対象データを記憶する。そして、記憶された監視対象データは、後述の異常度算出部108に入力される。
これらの記憶部は、ハードディスク(HDD)やフラッシュメモリ等を想定しているが、ランダムアクセスメモリ(RAM)であってもよい。また、揮発性メモリ、不揮発性メモリのいずれであってもよい。
状態観測器生成部104は、“変数構成”に含まれる変数を用いて状態観測器を生成する。状態観測器はオブザーバ、又はソフトセンサともいう。変数とは、信号取得部101で取得する学習対象データ及び監視対象データに対応する変数である。状態観測器生成部104に入力手段(“入力部”に相当)を有している場合、設定者の知見に基づき、状態観測器が機器の機能や故障メカニズムを表現するために必要又は有益な変数構成を入力するようにしてもよい。状態観測器および状態観測器を構成する変数の具体例は後述する。
ここで、“変数構成”とは、1つの変数、又は複数の変数の組み合わせ、をいう。
ここで、“変数構成”とは、1つの変数、又は複数の変数の組み合わせ、をいう。
状態観測器生成部104は、例えば、式(1)で示す通り、入力された変数構成に含まれる変数を線形結合することにより状態観測器を生成する。なお、係数aの初期値はランダムな値としつつ、学習対象データを用いて結合を実施し、状態観測器の初期状態を生成する。

a:係数、x:変数、p:状態観測器の番号、n:変数の番号
apXp:p番目の状態観測器(状態観測値)
apXp:p番目の状態観測器(状態観測値)
状態観測器は、異常検知装置100で検知の対象となる機器の機能、又は“機器の故障メカニズム”を“反映している”ことが望ましい。
機器の機能の例として、自動車の機能である駆動や自動車の機能である空燃比が挙げられる。本実施形態ではこの例を説明する。
また、機器の故障メカニズムの例として、例えば、エンジンのオーバーヒートのメカニズムが挙げられる。エンジンのオーバーヒートは、冷却系の異常やエンジンの過負荷によりエンジンの温度が上昇し、焼き付けを起こすという仕組みである。
ここで、“機器の故障メカニズム”とは、機器の故障が生じる仕組みをいう。
また、“反映している”とは、機器の機能又は機器の故障メカニズムに応じて状態観測器から出力される状態観測値が変化することをいう。
機器の機能の例として、自動車の機能である駆動や自動車の機能である空燃比が挙げられる。本実施形態ではこの例を説明する。
また、機器の故障メカニズムの例として、例えば、エンジンのオーバーヒートのメカニズムが挙げられる。エンジンのオーバーヒートは、冷却系の異常やエンジンの過負荷によりエンジンの温度が上昇し、焼き付けを起こすという仕組みである。
ここで、“機器の故障メカニズム”とは、機器の故障が生じる仕組みをいう。
また、“反映している”とは、機器の機能又は機器の故障メカニズムに応じて状態観測器から出力される状態観測値が変化することをいう。
状態観測器の変数構成に含まれる変数は、異常検知装置100で検知の対象となる機器の機能、又は機器の故障メカニズムの“因子”であることが望ましい。
例えば、機器の故障メカニズムの例で挙げたエンジンのオーバーヒートの場合、エンジンの温度がオーバーヒートを引き起こす直接的な因子であり、エンジン回転数や冷却液の量はエンジンの温度上昇を引き起こす直接的な因子、すなわちオーバーヒートを引き起こす間接的な因子である。
機器の機能の因子の例は、以下に本実施形態として説明する。
ここで、“因子”とは、機器の機能又は機器の故障メカニズムに影響を与える事実をいう。
例えば、機器の故障メカニズムの例で挙げたエンジンのオーバーヒートの場合、エンジンの温度がオーバーヒートを引き起こす直接的な因子であり、エンジン回転数や冷却液の量はエンジンの温度上昇を引き起こす直接的な因子、すなわちオーバーヒートを引き起こす間接的な因子である。
機器の機能の因子の例は、以下に本実施形態として説明する。
ここで、“因子”とは、機器の機能又は機器の故障メカニズムに影響を与える事実をいう。
以下、自動車の機能に基づく状態観測器の例を挙げる。
例えば、図2で示す通り、自動車の駆動系を対象とした駆動系状態観測器(“第1の状態観測器”に相当)を生成する場合、自動車の駆動系に関係する変数、例えばエンジン回転数(x11)及びタービン回転数(x12)を線形結合することにより、式(2)の状態観測器を生成する。

a11、a12:係数の初期値
u:駆動系状態観測値
例えば、図2で示す通り、エンジンに供給する空気と燃料の比を対象とした空燃比系状態観測器(“第2の状態観測器”に相当)を生成する場合、エンジンの空燃比に関係する変数、例えば酸素センサ電圧(x21)及び空燃比センサ電流(x22)を線形結合することにより、式(3)の状態観測器を生成する。

a21、a22:係数の初期値
v:空燃比系状態観測値
例えば、図2で示す通り、自動車の駆動系を対象とした駆動系状態観測器(“第1の状態観測器”に相当)を生成する場合、自動車の駆動系に関係する変数、例えばエンジン回転数(x11)及びタービン回転数(x12)を線形結合することにより、式(2)の状態観測器を生成する。
u:駆動系状態観測値
例えば、図2で示す通り、エンジンに供給する空気と燃料の比を対象とした空燃比系状態観測器(“第2の状態観測器”に相当)を生成する場合、エンジンの空燃比に関係する変数、例えば酸素センサ電圧(x21)及び空燃比センサ電流(x22)を線形結合することにより、式(3)の状態観測器を生成する。
v:空燃比系状態観測値
もちろん、これらの変数以外の変数を用いてもよい。また、結合する変数の数は2つに限らない。さらに、状態観測器の数は2つに限らない。例えば1つでも良いし、3つ目以降の状態観測器(“第3の状態観測器”に相当)を生成してもよい。
本実施形態では状態観測器の例として入力―出力の2層構造を有するものを挙げたが、3層以上であってもよい。その場合、階層型ニューラルネットを用いて記述してもよい。あるいはカーネル空間を利用して記述してもよい。さらに、正則化項を導入してもよい。
状態観測器として変数を線形で結合する例を挙げたが、これに限らず、非線形な結合で構成されてもよい。例えば、階層型ニューラルネットワークを用いて記述する場合は、シグモイド関数を用いるので、非線形の結合で構成されることになる。
状態観測器を生成することで、直接センサ等で測定することができない状態観測値を推定することができる。また、状態観測器に機器の機能や故障メカニズムを反映させることにより、故障の検知精度を高めることができる他、故障の要因分析が容易になる。
なお、状態観測器生成部104で状態観測器を生成する際に用いる学習対象データに対して、正規分布に近づける分布変換を行なってもよい。分布変換の例として、Box-Cox変換、又はJohnson変換が挙げられる。こうすることにより、後述の判定部109の異常検知精度が向上する可能性がある。
分布変換を行った場合は、分布変換パラメータを後述の状態観測器情報記憶部105に記憶し、正常モデル生成部106及び異常度算出部108に出力する。そして、正常モデル生成部106に入力される学習対象データ、及び異常度算出部108に入力される監視対象データに対しても同様の分布変換を行う。
分布変換を行った場合は、分布変換パラメータを後述の状態観測器情報記憶部105に記憶し、正常モデル生成部106及び異常度算出部108に出力する。そして、正常モデル生成部106に入力される学習対象データ、及び異常度算出部108に入力される監視対象データに対しても同様の分布変換を行う。
状態観測器の数が複数の場合、図3で示す通りさらに状態観測器同士の相関を最大化することが望ましい。
例えば、状態観測器が第1の状態観測器及び第2の状態観測器の2つからなる場合、第1の状態観測器と第2の状態観測器との相関を制約条件下で最大化する。3つ以上の状態観測器からなる場合は、任意の組み合わせの2つの状態観測器同士の相関をそれぞれ制約条件下で最大化する。
これにより、正常なデータのノイズによる変動範囲を限定することになり、異常検知の精度を上げることができる。
例えば、状態観測器が第1の状態観測器及び第2の状態観測器の2つからなる場合、第1の状態観測器と第2の状態観測器との相関を制約条件下で最大化する。3つ以上の状態観測器からなる場合は、任意の組み合わせの2つの状態観測器同士の相関をそれぞれ制約条件下で最大化する。
これにより、正常なデータのノイズによる変動範囲を限定することになり、異常検知の精度を上げることができる。
具体的には、(4)式の1行目に示す通り、2つの係数を調整することで相関を最大化することができる。(4)式の分子は、第1の状態観測器と第2の状態観測器の標本共分散、分母は、それぞれ第1の状態観測器の標本分散、第2の状態観測器の標本分散である。
(4)式の2行目は、ラグランジュの未定乗数法の制約条件であり、本実施形態の場合1となる。
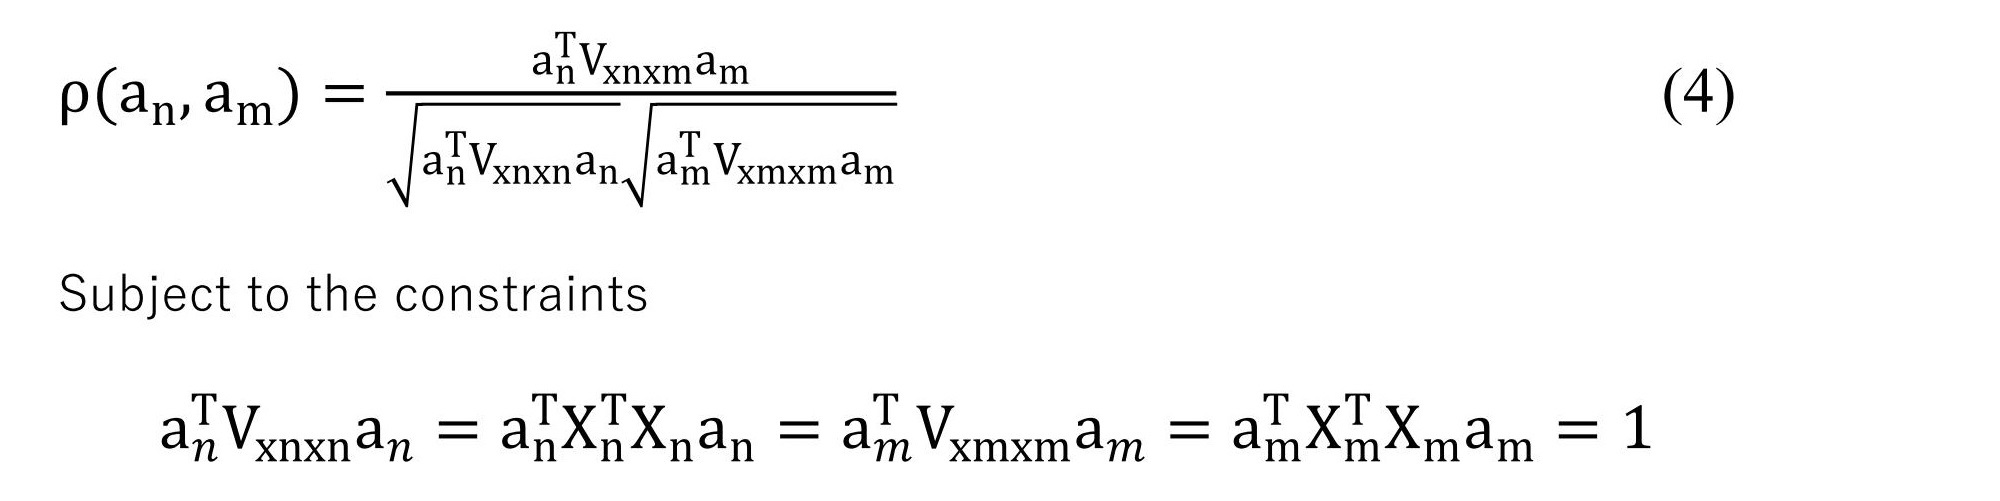
ρ:相関
n:第nの状態観測器
m:第mの状態観測器
a:係数
V:分散
(4)式の2行目は、ラグランジュの未定乗数法の制約条件であり、本実施形態の場合1となる。
n:第nの状態観測器
m:第mの状態観測器
a:係数
V:分散
さらに、状態観測器が第1の状態観測器、第2の状態観測器、及び第3の状態観測器の3つからなる場合、図3で示す通り、2つの状態観測器同士の相関の“和”を最大化することが望ましい。
状態観測器が4つ以上の場合も、3つの場合と同様の方法で最大化を行う。
これにより、正常なデータのノイズによる変動範囲を限定することになり、異常検知の精度を上げることができる。
ここで、“和”とは、単純和の他、二乗和、絶対値和など、演算に和を含んでいればよい。
状態観測器が4つ以上の場合も、3つの場合と同様の方法で最大化を行う。
これにより、正常なデータのノイズによる変動範囲を限定することになり、異常検知の精度を上げることができる。
ここで、“和”とは、単純和の他、二乗和、絶対値和など、演算に和を含んでいればよい。
具体的には、(5)式に示す通り、2つの状態観測器同士の相関の和を最大化することができる。gは和を表す関数であり、括弧内は和の対象、すなわち第nの状態観測器と第mの状態観測器の相関である。

N:状態観測器の総数
状態観測器情報記憶部105は、状態観測器生成部104で求めた状態観測器の係数、本実施形態では、相関の最大化により得られた駆動系状態観測器の係数(a11、a12)、及び空燃比系状態観測器の係数(a21、a22)を保存する。また、状態観測器の変数構成も併せて保存する。
なお、状態観測器生成部104は、状態観測器を生成するときに備えていればよく、一旦状態観測器を生成し状態観測器の変数構成及び状態観測器の係数を状態観測器情報記憶部105に保存して利用できるようにした後は、異常検知装置100から切り離してもよい。
正常モデル生成部106は、学習対象データを状態観測器に入力して得られる第1の状態観測値、及び学習対象データ、を“結合して”競合型ニューラルネットワークに入力することにより正常モデルを生成する。本実施形態の場合、状態観測器情報記憶部105から状態観測器の変数構成及び係数を読み出し、かかる変数に学習対象データ記憶部102から読み出した学習対象データを当てはめることにより第1の状態観測値を求める。
例えば、学習対象データとして取得したエンジン回転数及びタービン回転数を(2)式に入力して駆動系状態観測値(u1)(“第1の状態観測値”に相当)を求める。また、学習対象データとして取得した酸素センサ電圧及び空燃比センサ電流を(3)式に入力して空燃比系状態観測値(v1)(“第1の状態観測値”に相当)を求める。そして、エンジン回転数、タービン回転数、駆動系状態観測値(u1)、酸素センサ電圧、空燃比センサ電流、及び空燃比系状態観測値(v1)の6つのデータを競合型ニューラルネットワーク(NN)に入力する。
ここで、“結合して”とは、第1の状態観測値と学習対象データとを同時に競合型ニューラルネットワークに入力できる状態であれば足りる。
例えば、学習対象データとして取得したエンジン回転数及びタービン回転数を(2)式に入力して駆動系状態観測値(u1)(“第1の状態観測値”に相当)を求める。また、学習対象データとして取得した酸素センサ電圧及び空燃比センサ電流を(3)式に入力して空燃比系状態観測値(v1)(“第1の状態観測値”に相当)を求める。そして、エンジン回転数、タービン回転数、駆動系状態観測値(u1)、酸素センサ電圧、空燃比センサ電流、及び空燃比系状態観測値(v1)の6つのデータを競合型ニューラルネットワーク(NN)に入力する。
ここで、“結合して”とは、第1の状態観測値と学習対象データとを同時に競合型ニューラルネットワークに入力できる状態であれば足りる。
なお、競合型ニューラルネットワークに与える初期値としては、例えば、車種、測定季節、昼夜、カスタマイズ仕様、経年度など、入力されるデータの属性の組み合わせが複数ある場合、万遍なくサンプリングすることが望ましい。あるいはランダムにサンプリングすることが望ましい。これにより、競合型ニューラルネットワークのマップ上のニューロン重みベクトルの学習時の収束を速くすることができる。
競合型ニューラルネットワークは、入力層と出力層だけからなるネットワークであり、複数個の入力層ニューロンと、入力層ニューロンに全結合で結ばれた複数個の出力層ニューロンで構成されている。
本実施形態では、競合型ニューラルネットワークに入力された学習対象データ及び状態観測値と、勝者ユニットのニューロン重みデータとの差分である異常度を求める。そして差分の集合を用いて閾値を求める。例えば差分(絶対値)の集合の99.9%分位点の定数倍を閾値として用いるようにする。
本実施形態では、競合型ニューラルネットワークに入力された学習対象データ及び状態観測値と、勝者ユニットのニューロン重みデータとの差分である異常度を求める。そして差分の集合を用いて閾値を求める。例えば差分(絶対値)の集合の99.9%分位点の定数倍を閾値として用いるようにする。
正常モデルパラメータ記憶部107は、正常モデル生成部106で求めた閾値を記憶する。
異常度算出部108は、監視対象データを状態観測器に入力して得られる第2の状態観測値、及び監視対象データ、を“結合して”競合型ニューラルネットワークに入力することにより、出力層ニューロンの重みデータを用いて異常度を計算する。本実施形態の場合、状態観測器情報記憶部105から状態観測器の変数構成及び係数を読み出し、かかる変数に監視対象データ記憶部103から読み出した監視対象データを当てはめることにより第2の状態観測値を求める。なお、状態観測器の生成時に学習対象データに対して分布変換を行った場合は、状態観測器情報記憶部105から分布変換パラメータを読み出し、監視対象データに対して分布変換を行っておく。
例えば、監視対象データとして取得したエンジン回転数及びタービン回転数を(2)式に入力して駆動系状態観測値(u2)(“第2の状態観測値”に相当)を求める。また、監視対象データとして取得した酸素センサ電圧及び空燃比センサ電流を(3)式に入力して空燃比系状態観測値(v2)(“第2の状態観測値”に相当)を求める。そして、エンジン回転数、タービン回転数、駆動系状態観測値(u2)、酸素センサ電圧、空燃比センサ電流、及び空燃比系状態観測値(v2)の6つのデータを競合型ニューラルネットワーク(NN)に入力する。
ここで、“結合して”とは、第2の状態観測値と監視対象データとを同時に競合型ニューラルネットワークに入力できる状態であれば足りる。
例えば、監視対象データとして取得したエンジン回転数及びタービン回転数を(2)式に入力して駆動系状態観測値(u2)(“第2の状態観測値”に相当)を求める。また、監視対象データとして取得した酸素センサ電圧及び空燃比センサ電流を(3)式に入力して空燃比系状態観測値(v2)(“第2の状態観測値”に相当)を求める。そして、エンジン回転数、タービン回転数、駆動系状態観測値(u2)、酸素センサ電圧、空燃比センサ電流、及び空燃比系状態観測値(v2)の6つのデータを競合型ニューラルネットワーク(NN)に入力する。
ここで、“結合して”とは、第2の状態観測値と監視対象データとを同時に競合型ニューラルネットワークに入力できる状態であれば足りる。
競合型ニューラルネットワークに入力された監視対象データ及び状態観測値と、各出力層ニューロンの重みデータとの差分値から異常度を求める。
以下、図4を用いて、異常度算出部108における異常度の求め方を説明する。
図中の記号の意味は以下の通りである。
W:ニューロン集合
k:監視時点
l:ループカウンタ
L:ループ回数
i、j:ニューラルネットワークのニューロン番地
図中の記号の意味は以下の通りである。
W:ニューロン集合
k:監視時点
l:ループカウンタ
L:ループ回数
i、j:ニューラルネットワークのニューロン番地
ループカウンタ(l)を1に設定する(S101)。
監視時点(k)での監視対象データ(Zk)と、それに一番近いニューラルネットワークのニューロンの重みデータ(Wi,j)との最小ユークリッド距離(d~k、l)を求める(S102)。なお、本明細書中の符号“d~”はチルダ付きのdを意味する。
監視対象データ(Zk)と、それに近いニューラルネットワークのニューロンの重みデータ(W‘k,l)とのコサイン類似度(cosθk、l)を求める(S103)。
最小ユークリッド距離(d~k、l)とコサイン類似度(cosθk、l)から、異常度(ck、l)を求める(S104)。
ループカウンタ(l)が所定のループ回数(L)を超えていなければ(S105:N)、ループカウンタ(l)をインクリメントし(S106)、監視対象データと一番近いニューロン(W‘k,lに当たるWi,j)をニューロン集合(W)から除いて(S107)、S102に戻る。ループカウンタ(l)が所定のループ回数(L)を超えていれば(S105:Y)、所定のループ回数(L)分の異常度の総和をもって、異常度(ck)とする(S108)。
なお、ループ回数(L)は、任意に設定が可能であり、例えば10回とする。
監視時点(k)での監視対象データ(Zk)と、それに一番近いニューラルネットワークのニューロンの重みデータ(Wi,j)との最小ユークリッド距離(d~k、l)を求める(S102)。なお、本明細書中の符号“d~”はチルダ付きのdを意味する。
監視対象データ(Zk)と、それに近いニューラルネットワークのニューロンの重みデータ(W‘k,l)とのコサイン類似度(cosθk、l)を求める(S103)。
最小ユークリッド距離(d~k、l)とコサイン類似度(cosθk、l)から、異常度(ck、l)を求める(S104)。
ループカウンタ(l)が所定のループ回数(L)を超えていなければ(S105:N)、ループカウンタ(l)をインクリメントし(S106)、監視対象データと一番近いニューロン(W‘k,lに当たるWi,j)をニューロン集合(W)から除いて(S107)、S102に戻る。ループカウンタ(l)が所定のループ回数(L)を超えていれば(S105:Y)、所定のループ回数(L)分の異常度の総和をもって、異常度(ck)とする(S108)。
なお、ループ回数(L)は、任意に設定が可能であり、例えば10回とする。
なお、異常の原因を特定するために後述の要因分析部110で要因分析を行う場合に備えて、(6)式のfkの値、すなわち異常度(ck、l)を求める際に用いた監視対象データ(Zk)及びl=1時に選ばれた重みニューロン(W‘k,l)の差分ベクトルを2乗し平方根を取った値を別途設けた保存部に保存しておいてもよい。sは監視対象データ又は状態観測値を特定する値であり、1≦s≦Sとする。Sは監視対象データおよび状態観測値の合計数である。

判定部109は、正常モデルパラメータ記憶部107から読み出した閾値と、異常度算出部108から出力された異常度(ck)を比較することにより判定結果を求める。具体的には、異常度が閾値以上であれば、異常ありとの判定結果を出力する。異常度が閾値未満であれば、異常なしとの判定結果を出力する。
要因分析部110は、判定部109の判定結果が“異常”を示す場合、“異常”と判定される原因となった第2の状態観測値及び監視対象データを用いて“異常”の原因を特定する。要因分析部110は、さらに、異常と判定される原因となった第2の状態観測値及び監視対象データを基準に時間的に前、後、又は前及び後の第2の状態観測値及び監視対象データを用いて異常の原因を特定してもよい。本実施形態では、異常の原因を特定することを要因分析と呼ぶ。
ここで、“異常”とは、異常のみならず、異常の予兆も含む。
ここで、“異常”とは、異常のみならず、異常の予兆も含む。
例えば、本実施形態では、異常ありと判定された第2の状態観測値及び監視対象データと、それらの前後5点の計11点データを用いて異常の原因を特定する。
監視時点(k)で異常と判定された場合、異常度算出部108で算出した(6)式で示されるfk及びその前後5点の値を別途設けた保存部から読み出し、これをFとする。sは監視対象データ又は状態観測値を特定する値であり、1≦s≦Sとする。Sは監視対象データおよび状態観測値の合計数である。本実施形態では、以下のように対応付けられているとする。
s=1:エンジン回転数
s=2:タービン回転数
s=3:駆動系状態観測値(u2)
s=4:酸素センサ電圧
s=5:空燃比センサ電流
s=6:空燃比系状態観測値(v2)

監視時点(k)で異常と判定された場合、異常度算出部108で算出した(6)式で示されるfk及びその前後5点の値を別途設けた保存部から読み出し、これをFとする。sは監視対象データ又は状態観測値を特定する値であり、1≦s≦Sとする。Sは監視対象データおよび状態観測値の合計数である。本実施形態では、以下のように対応付けられているとする。
s=1:エンジン回転数
s=2:タービン回転数
s=3:駆動系状態観測値(u2)
s=4:酸素センサ電圧
s=5:空燃比センサ電流
s=6:空燃比系状態観測値(v2)
このように、Fには状態観測器の各異常度と監視対象データの各異常度が含まれている。要因分析で異常度に寄与する要因を分析する際に、少数の監視対象データのみを用いるとノイズによる影響によって正確な分析が難しい。また、監視対象の機器の機能を表す機能ブロックのいずれに要因があるかを見極めるのは困難である。
そこで、本実施形態では、Fに含まれる状態観測値、本実施形態ではs=3、及びs=6の状態観測値を、複数の測定点を用いて分析することにより、ノイズに対してロバストにすることができる。
そこで、本実施形態では、Fに含まれる状態観測値、本実施形態ではs=3、及びs=6の状態観測値を、複数の測定点を用いて分析することにより、ノイズに対してロバストにすることができる。
各状態観測器から求められた値であるfk、Sの総和fallを全体の異常傾向とした場合、各状態観測器との類似度γsは(9)式で求めることができる。f‘は、平均との偏差ベクトルを示している。(8)式では、状態観測器から求められた値のみの総和を求めているが、本実施形態ではs=3とs=6の2つの場合の和となる。

(9)式の通り、各状態観測器の異常度と全体の異常傾向を類似度という形で比べる。そして、類似度γsの絶対値の最大値を持つ状態観測器sが対応する機器の機能ブロックを、異常の原因が発生している機能ブロックであると推定する。
なお、類似度を調べる方法として、本実施形態では(9)式のピアソンの積率相関を用いているが、コサイン類似度、スピアマンの順位相関係数、ケンドールの順位相関係数、相互相関関数、DTW、KL距離等を用いても良い。また、fallとfk、sの関係性をグラフィカルモデルとみなし、正則化を導入して疑似相関や弱い相関を排除してもよい。
さらに、機能ブロックだけでなく、異常の原因となる実センサや制御入力値を含めて要因分析を行うために、全体の異常傾向fallと、実センサや制御入力値の異常度fk、sとの類似度を求めてもよい。すなわち、本実施形態では、s=1,2,4,5についても、類似度γsを求めてもよい。
そして、異常の原因を特定する情報、本実施形態では類似度γs、及びそれに関連する情報、を表示部111に表示するようにしてもよい。図5(a)は、表示部111に表示される情報を示している。この表示によれば、全体の異常傾向fall、各状態観測器の異常度fk、s、実センサや制御入力値の異常度fk、s、及びそれらの類似度γsを表示しているので、視覚的にどの機能ブロックや実センサ等に異常が生じているかを特定することができる。また、表示内容を選別し不要な情報を表示させないようにするため、ドリルダウンやロールアップによる表示を取り入れてもよい。図5(b)は、本実施形態における表示例である。
2.異常検知装置の動作
次に、図6から図8を用いて、本実施形態の異常検知装置100の動作を説明する。
なお、図6から図8のフローにおいて、後段の処理又は判断が前段の処理又は判断の結果を前提としていない場合は、前段と後段の順序を入れ替えることができる。また、図6から図8は、異常検知装置100の異常検知方法を示すだけでなく、異常検知装置100で実行されるプログラムの処理手順を示すものである。
次に、図6から図8を用いて、本実施形態の異常検知装置100の動作を説明する。
なお、図6から図8のフローにおいて、後段の処理又は判断が前段の処理又は判断の結果を前提としていない場合は、前段と後段の順序を入れ替えることができる。また、図6から図8は、異常検知装置100の異常検知方法を示すだけでなく、異常検知装置100で実行されるプログラムの処理手順を示すものである。
(1)学習時の動作
図6は、異常検知装置100の学習時の動作を示すフローチャートである。
信号取得部101は、各種センサ等から学習対象データを取得する(S201)。
信号取得部101は、学習対象データに対して分布変換を行う(S202)。
学習対象データ記憶部102は、分布変換後の学習対象データを記憶する(S203)。
状態観測器生成部104は、入力された変数構成に含まれる変数を用いて状態観測器を生成する(S204)。状態観測器の生成は、別途サブルーチンの処理として図7を用いて説明する。
正常モデル生成部106は、学習対象データを状態観測器に入力して得られる第1の状態観測値を求める(S205)。
正常モデル生成部106は、第1の状態観測値及び学習対象データを結合する(S206)。
正常モデル生成部106は、第1の状態観測値及び学習対象データを結合したデータの組み合わせから、ランダムにサンプリングを行う(S207)。
正常モデル生成部106の競合型ニューラルネットワークは、第1の状態観測値及び学習対象データから閾値を生成する(S208)。
正常モデルパラメータ記憶部107は、正常モデルの閾値を記憶する(S209)。
図6は、異常検知装置100の学習時の動作を示すフローチャートである。
信号取得部101は、各種センサ等から学習対象データを取得する(S201)。
信号取得部101は、学習対象データに対して分布変換を行う(S202)。
学習対象データ記憶部102は、分布変換後の学習対象データを記憶する(S203)。
状態観測器生成部104は、入力された変数構成に含まれる変数を用いて状態観測器を生成する(S204)。状態観測器の生成は、別途サブルーチンの処理として図7を用いて説明する。
正常モデル生成部106は、学習対象データを状態観測器に入力して得られる第1の状態観測値を求める(S205)。
正常モデル生成部106は、第1の状態観測値及び学習対象データを結合する(S206)。
正常モデル生成部106は、第1の状態観測値及び学習対象データを結合したデータの組み合わせから、ランダムにサンプリングを行う(S207)。
正常モデル生成部106の競合型ニューラルネットワークは、第1の状態観測値及び学習対象データから閾値を生成する(S208)。
正常モデルパラメータ記憶部107は、正常モデルの閾値を記憶する(S209)。
(2)状態観測器の生成動作
図7は、異常検知装置100の状態観測器生成部104における状態観測器の生成動作を示すサブルーチンのフローチャートである。
状態観測器生成部104に、変数構成が入力される(S301)。
状態観測器生成部104は、入力された変数構成に含まれる変数を用い、係数を初期値に設定し、学習対象データを結合することにより状態観測器を生成する(S302)。
状態観測器生成部104は、生成された状態観測器が単数か複数かを判断する(S303)。単数であれば、状態観測器の係数及び変数構成を状態観測器情報記憶部105に保存して(S304)、処理を終了する。複数であれば、S305に処理を移す。
状態観測器生成部104は、生成された状態観測器が2つか、3つ以上かを判断する(S305)。2つであれば、S306に処理を移す。3つ以上であれば、S307に処理を移す。
生成された状態観測器が2つの場合、状態観測器生成部104は、2つの状態観測器同士の相関を最大化して(S306)、処理をS304に移す。
生成された状態観測器が3つ以上の場合、状態観測器生成部104は、2つの状態観測器同士の相関の総和を最大化して(S307)、処理をS304に移す。
図7は、異常検知装置100の状態観測器生成部104における状態観測器の生成動作を示すサブルーチンのフローチャートである。
状態観測器生成部104に、変数構成が入力される(S301)。
状態観測器生成部104は、入力された変数構成に含まれる変数を用い、係数を初期値に設定し、学習対象データを結合することにより状態観測器を生成する(S302)。
状態観測器生成部104は、生成された状態観測器が単数か複数かを判断する(S303)。単数であれば、状態観測器の係数及び変数構成を状態観測器情報記憶部105に保存して(S304)、処理を終了する。複数であれば、S305に処理を移す。
状態観測器生成部104は、生成された状態観測器が2つか、3つ以上かを判断する(S305)。2つであれば、S306に処理を移す。3つ以上であれば、S307に処理を移す。
生成された状態観測器が2つの場合、状態観測器生成部104は、2つの状態観測器同士の相関を最大化して(S306)、処理をS304に移す。
生成された状態観測器が3つ以上の場合、状態観測器生成部104は、2つの状態観測器同士の相関の総和を最大化して(S307)、処理をS304に移す。
(3)監視時及び要因分析時の動作
図8は、異常検知装置100の監視時及び要因分析時の動作を示すフローチャートである。
信号取得部101は、各種センサ等から監視対象データを取得する(S401)。
信号取得部101は、状態観測器情報記憶部105から分布変換パラメータを読み出し、監視対象データに対して分布変換を行う(S402)。
異常度算出部108は、監視対象データを状態観測器に入力して得られる第2の状態観測値を求める(S403)。
異常度算出部108は、第2の状態観測値及び監視対象データを結合する(S404)。
異常度算出部108の競合型ニューラルネットワークは、結合したデータから異常度を計算する(S405)。
判定部109は、正常モデルパラメータ記憶部107から読み出した閾値と、異常度算出部108から出力された異常度と、を比較することにより判定結果を求める(S406)。異常度が閾値以下であれば、正常との判定結果を出力する(S407)。異常度が閾値より大きければ、異常との判定結果を出力する(S408)。
要因分析部110は、判定部109の判定結果が異常を示す場合(S408)、異常と判定される原因となった第2の状態観測値及び監視対象データを用いて異常の原因を特定する(S409)。
図8は、異常検知装置100の監視時及び要因分析時の動作を示すフローチャートである。
信号取得部101は、各種センサ等から監視対象データを取得する(S401)。
信号取得部101は、状態観測器情報記憶部105から分布変換パラメータを読み出し、監視対象データに対して分布変換を行う(S402)。
異常度算出部108は、監視対象データを状態観測器に入力して得られる第2の状態観測値を求める(S403)。
異常度算出部108は、第2の状態観測値及び監視対象データを結合する(S404)。
異常度算出部108の競合型ニューラルネットワークは、結合したデータから異常度を計算する(S405)。
判定部109は、正常モデルパラメータ記憶部107から読み出した閾値と、異常度算出部108から出力された異常度と、を比較することにより判定結果を求める(S406)。異常度が閾値以下であれば、正常との判定結果を出力する(S407)。異常度が閾値より大きければ、異常との判定結果を出力する(S408)。
要因分析部110は、判定部109の判定結果が異常を示す場合(S408)、異常と判定される原因となった第2の状態観測値及び監視対象データを用いて異常の原因を特定する(S409)。
(総括)
以上、本開示の実施形態における異常検知装置の特徴について説明した。
以上、本開示の実施形態における異常検知装置の特徴について説明した。
各実施形態で使用した用語は例示であるので、同義の用語、あるいは同義の機能を含む用語に置き換えてもよい。
実施形態の説明に用いたブロック図は、異常検知装置の構成を機能毎に分類及び整理したものである。これらの機能ブロックは、ハードウェア又はソフトウェアの任意の組み合わせで実現される。また、機能を示したものであることから、かかるブロック図は方法の発明の開示としても把握できるものである。
各実施形態に記載した処理、フロー、及び方法として把握できる機能ブロックについては、一のステップで他のステップの結果を利用する関係にある等の制約がない限り、順序を入れ替えても良い。
各実施形態、及び請求の範囲で使用する“第1”“第2”の用語は、同種の2以上の構成や方法を区別するために使用しており、順序や優劣を限定するものではない。
なお、上記実施形態では、本開示の異常検知装置を車両に搭載した場合、つまり車載器について説明したが、車両以外の機器に搭載、あるいは接続してもよい。
異常検知装置の例として故障診断ツールが挙げられるが、この形態や名称には限らない。例えば、部品や半完成品としては、半導体、電子回路、モジュール、あるいはECU(エレクトロニックコントロールユニット)が挙げられる。また完成品としては、ドライブレコーダ、カーナビゲーションシステム、スマートフォン、パーソナルコンピュータ、携帯電話、携帯情報端末が挙げられる。
加えて、本開示は、各実施形態で説明した構成及び機能を有する専用のハードウェアで実現できるだけでなく、メモリやハードディスク等の記録媒体に記録した本開示を実現するためのプログラム、及びこれを実行可能な専用又は汎用CPU及びメモリ等を有する汎用のハードウェアとの組み合わせとしても実現できる。
専用や汎用のハードウェアの非遷移的実体的記録媒体(例えば、外部記憶装置(ハードディスク、USBメモリ、CD/BD等)、又は内部記憶装置(RAM、ROM等))に格納されるプログラムは、記録媒体を介して、あるいは記録媒体を介さずにサーバから通信回線を経由して、専用又は汎用のハードウェアに提供することもできる。これにより、プログラムのアップグレードを通じて常に最新の機能を提供することができる。
本開示にかかる異常検知装置は、車載用途に限らず、様々な機器の異常検知に用いることができる。
Claims (13)
- 学習対象データ及び監視対象データを取得する信号取得部(101)と、
入力された変数構成に含まれる変数を用いて状態観測器を生成する状態観測器生成部(104)と、
前記学習対象データを前記状態観測器に入力して得られる第1の状態観測値、及び前記学習対象データ、を結合して競合型ニューラルネットワークに入力することにより閾値を生成する正常モデル生成部(106)と、
前記監視対象データを前記状態観測器に入力して得られる第2の状態観測値、及び前記監視対象データ、を結合して前記競合型ニューラルネットワークに入力することにより異常度を計算する異常度算出部(108)と、
前記閾値と前記異常度とを比較することにより判定結果を求める判定部(109)と、
を有する異常検知装置(100)。 - 前記状態観測器は、当該異常検知装置で検知の対象となる機器の機能、又は前記機器の故障メカニズムを反映している、
請求項1記載の異常検知装置。 - 前記変数構成に含まれる前記変数は、当該異常検知装置で検知の対象となる機器の機能、又は前記機器の故障メカニズムの因子である、
請求項1記載の異常検知装置。 - 前記状態観測器生成部は、前記変数構成に含まれる変数を線形結合し、前記学習対象データを入力することにより前記状態観測器を生成する、
請求項1記載の異常検知装置。 - さらに、前記変数構成を入力する入力部を有する、
請求項1記載の異常検知装置。 - 前記状態観測器は、第1の状態観測器及び第2の状態観測器からなり、
前記第1の状態観測器と前記第2の状態観測器との相関が最大化されている、
請求項1記載の異常検知装置。 - 前記状態観測器は、第1の状態観測器、第2の状態観測器、及び第3の状態観測器からなり、
前記第1の状態観測器と前記第2の状態観測器との相関である第1の相関、前記第2の状態観測器と前記第3の状態観測器との相関である第2の相関、及び前記第3の状態観測器と前記第1の状態観測器との相関である第3の相関、の和が最大化されている、
請求項1記載の異常検知装置。 - 前記第1の状態観測器は、自動車の駆動系を対象とした駆動系状態観測器、前記第2の状態観測器は、エンジンに供給する空気と燃料の比を対象とした空燃比系状態観測器、であり、
前記駆動系状態観測器の前記変数構成は、前記変数としてエンジン回転数、及びタービン回転数を含み、
前記空燃比系状態観測器の前記変数構成は、前記変数として酸素センサ電圧、及び空燃比センサ電流を含む、
請求項6又は7記載の異常検知装置。 - さらに、前記判定結果が異常を示す場合、異常と判定される原因となった前記第2の状態観測値及び前記監視対象データを用いて異常の原因を特定する要因分析部(110)、を有する、
請求項1記載の異常検知装置。 - 前記要因分析部は、さらに、異常と判定される原因となった前記第2の状態観測値及び前記監視対象データを基準に時間的に前、後、又は前及び後の前記第2の状態観測値及び前記監視対象データを用いて異常の原因を特定する、
請求項9記載の異常検知装置。 - さらに、前記異常の原因を特定する情報を表示する表示部(111)を有する、
請求項9記載の異常検知装置。 - 学習対象データを取得し(S201)、
入力された変数構成に含まれる変数を用いて状態観測器を生成し(S204)、
前記学習対象データを前記状態観測器に入力して得られる第1の状態観測値、及び前記学習対象データ、を結合して競合型ニューラルネットワークに入力することにより閾値を生成し(S205,S206,S208)、
監視対象データを取得し(S401)、
前記監視対象データを前記状態観測器に入力して得られる第2の状態観測値、及び前記監視対象データ、を結合して前記競合型ニューラルネットワークに入力することにより異常度を計算し(S403,S404,S405)、
前記閾値と前記異常度とを比較することにより判定結果を求める(S406、S407、S408)、
異常検知方法。 - 学習対象データを取得し(S201)、
入力された変数構成に含まれる変数を用いて状態観測器を生成し(S204)、
前記学習対象データを前記状態観測器に入力して得られる第1の状態観測値、及び前記学習対象データ、を結合して競合型ニューラルネットワークに入力することにより閾値を生成し(S205,S206,S208)、
監視対象データを取得し(S401)、
前記監視対象データを前記状態観測器に入力して得られる第2の状態観測値、及び前記監視対象データ、を結合して前記競合型ニューラルネットワークに入力することにより異常度を計算し(S403,S404,S405)、
前記閾値と前記異常度とを比較することにより判定結果を求める(S406、S407、S408)、
コンピュータで実行可能な異常検知プログラム。
Priority Applications (3)
| Application Number | Priority Date | Filing Date | Title |
|---|---|---|---|
| DE112019006835.0T DE112019006835B4 (de) | 2019-02-07 | 2019-12-24 | Anomalieerfassungsvorrichtung |
| CN201980091150.9A CN113396369B (zh) | 2019-02-07 | 2019-12-24 | 异常检测装置 |
| US17/388,505 US12460994B2 (en) | 2019-02-07 | 2021-07-29 | Abnormality detection device |
Applications Claiming Priority (2)
| Application Number | Priority Date | Filing Date | Title |
|---|---|---|---|
| JP2019021084A JP7115346B2 (ja) | 2019-02-07 | 2019-02-07 | 異常検知装置 |
| JP2019-021084 | 2019-02-07 |
Related Child Applications (1)
| Application Number | Title | Priority Date | Filing Date |
|---|---|---|---|
| US17/388,505 Continuation US12460994B2 (en) | 2019-02-07 | 2021-07-29 | Abnormality detection device |
Publications (1)
| Publication Number | Publication Date |
|---|---|
| WO2020162069A1 true WO2020162069A1 (ja) | 2020-08-13 |
Family
ID=71948215
Family Applications (1)
| Application Number | Title | Priority Date | Filing Date |
|---|---|---|---|
| PCT/JP2019/050704 Ceased WO2020162069A1 (ja) | 2019-02-07 | 2019-12-24 | 異常検知装置 |
Country Status (5)
| Country | Link |
|---|---|
| US (1) | US12460994B2 (ja) |
| JP (1) | JP7115346B2 (ja) |
| CN (1) | CN113396369B (ja) |
| DE (1) | DE112019006835B4 (ja) |
| WO (1) | WO2020162069A1 (ja) |
Cited By (3)
| Publication number | Priority date | Publication date | Assignee | Title |
|---|---|---|---|---|
| CN111679651A (zh) * | 2020-06-08 | 2020-09-18 | 中国人民解放军火箭军工程大学 | 用于故障引起的变结构变参数系统的辨识方法及系统 |
| WO2022004662A1 (ja) * | 2020-07-01 | 2022-01-06 | 株式会社デンソー | 要因分析装置、要因分析方法、及び要因分析プログラム |
| WO2022024991A1 (ja) * | 2020-07-31 | 2022-02-03 | 株式会社デンソー | 異常検出装置、異常検出方法および異常検出プログラム |
Families Citing this family (5)
| Publication number | Priority date | Publication date | Assignee | Title |
|---|---|---|---|---|
| JP7600048B2 (ja) * | 2021-08-02 | 2024-12-16 | 株式会社東芝 | 装置診断システムおよび装置診断方法 |
| WO2024185699A1 (ja) | 2023-03-03 | 2024-09-12 | 株式会社デンソー | 工具異常検出システム |
| CN116659037B (zh) * | 2023-03-22 | 2025-12-26 | 宇通客车股份有限公司 | 基于局部异常因子算法的车载空调故障预测方法及系统 |
| CN118928701B (zh) * | 2024-07-22 | 2025-08-01 | 北京世航华远科技有限公司 | 一种提高推进器稳定性的在线故障检测方法及系统 |
| CN119209936A (zh) * | 2024-11-29 | 2024-12-27 | 南京图德科技有限公司 | 一种电力系统源网荷储协同的多目标规划系统 |
Citations (5)
| Publication number | Priority date | Publication date | Assignee | Title |
|---|---|---|---|---|
| JPH063483A (ja) * | 1992-06-23 | 1994-01-11 | Hitachi Ltd | 機器異常監視方法およびその装置 |
| JP2007198918A (ja) * | 2006-01-26 | 2007-08-09 | Matsushita Electric Works Ltd | 異常監視方法、および異常監視装置 |
| JP2015018389A (ja) * | 2013-07-10 | 2015-01-29 | 株式会社日立パワーソリューションズ | 異常予兆診断装置及び異常予兆診断方法 |
| JP2016207208A (ja) * | 2015-04-15 | 2016-12-08 | ハミルトン・サンドストランド・コーポレイションHamilton Sundstrand Corporation | 方法及びコンピュータプログラム製品 |
| CN106338406A (zh) * | 2016-10-19 | 2017-01-18 | 北京交通大学 | 列车牵引电传动系统的在线监测与故障预警系统及方法 |
Family Cites Families (36)
| Publication number | Priority date | Publication date | Assignee | Title |
|---|---|---|---|---|
| US5454358A (en) | 1993-02-26 | 1995-10-03 | Toyota Jidosha Kabushiki Kaisha | Driving power control apparatus for internal combustion engine |
| DE102005018980B4 (de) | 2005-04-21 | 2011-12-01 | Iav Gmbh Ingenieurgesellschaft Auto Und Verkehr | Verfahren und Vorrichtung zur Fehlerdiagnose mechatronischer Systeme |
| JP4356716B2 (ja) * | 2006-08-03 | 2009-11-04 | パナソニック電工株式会社 | 異常監視装置 |
| JP4369961B2 (ja) * | 2007-03-23 | 2009-11-25 | 株式会社日立製作所 | 異常検知装置及び異常検知プログラム |
| US8010476B2 (en) * | 2007-06-04 | 2011-08-30 | Siemens Medical Solutions Usa, Inc. | System and method for medical predictive models using likelihood gamble pricing |
| JP2009053938A (ja) * | 2007-08-27 | 2009-03-12 | Toshiba Corp | 複数モデルに基づく設備診断システム及びその設備診断方法 |
| US8543280B2 (en) | 2011-04-29 | 2013-09-24 | Toyota Motor Engineering & Manufacturing North America, Inc. | Collaborative multi-agent vehicle fault diagnostic system and associated methodology |
| JP4832609B1 (ja) | 2011-06-22 | 2011-12-07 | 株式会社日立エンジニアリング・アンド・サービス | 異常予兆診断装置および異常予兆診断方法 |
| CN102606557A (zh) * | 2012-01-16 | 2012-07-25 | 北京航空航天大学 | 一种基于故障观测器与som的液压系统健康评估方法 |
| CN103259479B (zh) * | 2013-05-28 | 2016-08-10 | 江苏大学 | 一种永磁同步电机神经网络左逆状态观测方法 |
| US10058272B2 (en) * | 2013-12-13 | 2018-08-28 | Koninklijke Philips N.V. | Sleep monitoring system and method |
| JP5753286B1 (ja) * | 2014-02-05 | 2015-07-22 | 株式会社日立パワーソリューションズ | 情報処理装置、診断方法、およびプログラム |
| JP6172678B2 (ja) * | 2014-04-30 | 2017-08-02 | インターナショナル・ビジネス・マシーンズ・コーポレーションInternational Business Machines Corporation | 検出装置、検出方法、およびプログラム |
| WO2016116961A1 (ja) * | 2015-01-21 | 2016-07-28 | 三菱電機株式会社 | 情報処理装置および情報処理方法 |
| JP6772454B2 (ja) | 2015-12-04 | 2020-10-21 | 株式会社Ihi | 異常診断装置、異常診断方法、及び、異常診断プログラム |
| JP6444851B2 (ja) * | 2015-12-24 | 2018-12-26 | ファナック株式会社 | ノイズの発生原因を検出する学習機能を有する制御装置 |
| US9803576B2 (en) | 2016-02-16 | 2017-10-31 | Robert Bosch Gmbh | System and method to predict calibration values based on existing calibrations |
| JP6669397B2 (ja) * | 2016-03-31 | 2020-03-18 | キヤノン株式会社 | 信号抽出処理装置および信号抽出処理方法 |
| CN105798930B (zh) * | 2016-04-01 | 2017-09-05 | 浙江工业大学 | 基于龙伯格状态观测器的柔性机械臂系统饱和补偿控制方法 |
| JP6569985B2 (ja) | 2016-04-17 | 2019-09-04 | 新電元工業株式会社 | 電力変換装置の診断方法 |
| JP6624041B2 (ja) * | 2016-12-19 | 2019-12-25 | トヨタ自動車株式会社 | ガス検出装置 |
| JP6661559B2 (ja) * | 2017-02-03 | 2020-03-11 | 株式会社東芝 | 異常検出装置、異常検出方法およびプログラム |
| JP6683956B2 (ja) * | 2017-02-13 | 2020-04-22 | トヨタ自動車株式会社 | ガス検出装置 |
| JP6527187B2 (ja) | 2017-03-22 | 2019-06-05 | ファナック株式会社 | 学習モデル構築装置、異常検出装置、異常検出システム及びサーバ |
| WO2018188752A1 (en) * | 2017-04-13 | 2018-10-18 | Volvo Truck Corporation | Device usable by robot and human |
| JP6906612B2 (ja) * | 2017-06-14 | 2021-07-21 | 株式会社東芝 | 異常検知装置、異常検知方法、およびプログラム |
| JP6253838B1 (ja) | 2017-07-19 | 2017-12-27 | 株式会社Uncover Truth | 行動ログ生成方法、行動ログ生成装置及び行動ログ生成プログラム |
| JP7118757B2 (ja) * | 2018-01-22 | 2022-08-16 | パナソニック インテレクチュアル プロパティ コーポレーション オブ アメリカ | サーバ、プログラム、及び、方法 |
| JP6919997B2 (ja) * | 2018-02-06 | 2021-08-18 | 株式会社日立製作所 | 制御装置、制御方法、および制御プログラム |
| JP6965798B2 (ja) * | 2018-03-12 | 2021-11-10 | オムロン株式会社 | 制御システムおよび制御方法 |
| JP2019179395A (ja) * | 2018-03-30 | 2019-10-17 | オムロン株式会社 | 異常検知システム、サポート装置および異常検知方法 |
| US10967883B2 (en) * | 2018-04-04 | 2021-04-06 | Ford Global Technologies, Llc | Methods and systems for adjusting vehicle noise for human-in-the-loop cruise control |
| KR101940029B1 (ko) | 2018-07-11 | 2019-01-18 | 주식회사 마키나락스 | 어노말리 디텍션 |
| US10919464B2 (en) * | 2018-07-31 | 2021-02-16 | Lyft, Inc. | Supercapacitor power buffer for vehicle power system |
| JP2020088420A (ja) * | 2018-11-15 | 2020-06-04 | トヨタ自動車株式会社 | 撮影異常診断装置及び車両 |
| JP7472685B2 (ja) | 2020-07-01 | 2024-04-23 | 株式会社デンソー | 要因分析装置、要因分析方法、及び要因分析プログラム |
-
2019
- 2019-02-07 JP JP2019021084A patent/JP7115346B2/ja active Active
- 2019-12-24 WO PCT/JP2019/050704 patent/WO2020162069A1/ja not_active Ceased
- 2019-12-24 CN CN201980091150.9A patent/CN113396369B/zh active Active
- 2019-12-24 DE DE112019006835.0T patent/DE112019006835B4/de active Active
-
2021
- 2021-07-29 US US17/388,505 patent/US12460994B2/en active Active
Patent Citations (5)
| Publication number | Priority date | Publication date | Assignee | Title |
|---|---|---|---|---|
| JPH063483A (ja) * | 1992-06-23 | 1994-01-11 | Hitachi Ltd | 機器異常監視方法およびその装置 |
| JP2007198918A (ja) * | 2006-01-26 | 2007-08-09 | Matsushita Electric Works Ltd | 異常監視方法、および異常監視装置 |
| JP2015018389A (ja) * | 2013-07-10 | 2015-01-29 | 株式会社日立パワーソリューションズ | 異常予兆診断装置及び異常予兆診断方法 |
| JP2016207208A (ja) * | 2015-04-15 | 2016-12-08 | ハミルトン・サンドストランド・コーポレイションHamilton Sundstrand Corporation | 方法及びコンピュータプログラム製品 |
| CN106338406A (zh) * | 2016-10-19 | 2017-01-18 | 北京交通大学 | 列车牵引电传动系统的在线监测与故障预警系统及方法 |
Cited By (4)
| Publication number | Priority date | Publication date | Assignee | Title |
|---|---|---|---|---|
| CN111679651A (zh) * | 2020-06-08 | 2020-09-18 | 中国人民解放军火箭军工程大学 | 用于故障引起的变结构变参数系统的辨识方法及系统 |
| WO2022004662A1 (ja) * | 2020-07-01 | 2022-01-06 | 株式会社デンソー | 要因分析装置、要因分析方法、及び要因分析プログラム |
| US12315313B2 (en) | 2020-07-01 | 2025-05-27 | Denso Corporation | Factor analysis device, factor analysis method, and non-transitory computer-readable storage medium |
| WO2022024991A1 (ja) * | 2020-07-31 | 2022-02-03 | 株式会社デンソー | 異常検出装置、異常検出方法および異常検出プログラム |
Also Published As
| Publication number | Publication date |
|---|---|
| JP2020129233A (ja) | 2020-08-27 |
| DE112019006835B4 (de) | 2024-08-08 |
| JP7115346B2 (ja) | 2022-08-09 |
| DE112019006835T5 (de) | 2022-01-20 |
| CN113396369A (zh) | 2021-09-14 |
| CN113396369B (zh) | 2024-06-14 |
| US20210357727A1 (en) | 2021-11-18 |
| US12460994B2 (en) | 2025-11-04 |
Similar Documents
| Publication | Publication Date | Title |
|---|---|---|
| WO2020162069A1 (ja) | 異常検知装置 | |
| CN109000940B (zh) | 一种机车车辆异常轴温诊断方法及系统 | |
| US7565262B2 (en) | Bayesian sensor estimation for machine condition monitoring | |
| JP4183185B2 (ja) | 診断装置、検出装置、制御方法、検出方法、プログラム、及び記録媒体 | |
| Xu et al. | Application of a modified fuzzy ARTMAP with feature-weight learning for the fault diagnosis of bearing | |
| JP2021528745A (ja) | アプリケーション情報に関連する時系列ズデータに関する深層学習を使用した異常検出 | |
| JP6402541B2 (ja) | 異常診断装置及びプログラム | |
| US20200143292A1 (en) | Signature enhancement for deviation measurement-based classification of a detected anomaly in an industrial asset | |
| JP2013257251A (ja) | 異常検知方法、プログラム及びシステム | |
| CN103198207A (zh) | 诊断算法参数优化 | |
| Xu et al. | A selective fuzzy ARTMAP ensemble and its application to the fault diagnosis of rolling element bearing | |
| CN117171657A (zh) | 风力发电设备故障诊断方法、装置、电子设备及存储介质 | |
| Ghorbani et al. | Estimating remaining useful life of turbofan engine using data-level fusion and feature-level fusion | |
| Hatipoğlu et al. | Enhanced fault classification in bearings: A multi-domain feature extraction approach with LSTM-attention and LASSO | |
| CN114383648A (zh) | 一种温度仪表故障诊断方法及装置 | |
| Jorry et al. | Statistical batch-based bearing fault detection | |
| WO2022024991A1 (ja) | 異常検出装置、異常検出方法および異常検出プログラム | |
| JP2014035282A (ja) | 異常診断装置 | |
| US20230128023A1 (en) | Factor analysis device, factor analysis method, and non-transitory computer-readable storage medium | |
| Yang et al. | A novel time–frequency–space method with parallel factor theory for big data analysis in condition monitoring of complex system | |
| WO2020183781A1 (ja) | 異常診断装置 | |
| Goi et al. | Bridge damage detection using ambient loads by bayesian hypothesis testing for a parametric subspace of an autoregressive model | |
| Viefhues et al. | Fault detection for linear parameter varying systems under changes in the process noise covariance | |
| CN117421551A (zh) | 传感器检测方法、装置、计算机设备以及存储介质 | |
| Jang et al. | Anomaly detection for health monitoring of heavy equipment using hierarchical prediction with correlative feature learning |
Legal Events
| Date | Code | Title | Description |
|---|---|---|---|
| 121 | Ep: the epo has been informed by wipo that ep was designated in this application |
Ref document number: 19914597 Country of ref document: EP Kind code of ref document: A1 |
|
| 122 | Ep: pct application non-entry in european phase |
Ref document number: 19914597 Country of ref document: EP Kind code of ref document: A1 |