WO2020059364A1 - データ分析装置、比較表示装置、治療計画データ編集装置、線量分布測定方法、プログラムおよび線量分布測定装置 - Google Patents
データ分析装置、比較表示装置、治療計画データ編集装置、線量分布測定方法、プログラムおよび線量分布測定装置 Download PDFInfo
- Publication number
- WO2020059364A1 WO2020059364A1 PCT/JP2019/031635 JP2019031635W WO2020059364A1 WO 2020059364 A1 WO2020059364 A1 WO 2020059364A1 JP 2019031635 W JP2019031635 W JP 2019031635W WO 2020059364 A1 WO2020059364 A1 WO 2020059364A1
- Authority
- WO
- WIPO (PCT)
- Prior art keywords
- dose
- distribution
- dose distribution
- response
- particle beam
- Prior art date
- Legal status (The legal status is an assumption and is not a legal conclusion. Google has not performed a legal analysis and makes no representation as to the accuracy of the status listed.)
- Ceased
Links
Images





Classifications
-
- A—HUMAN NECESSITIES
- A61—MEDICAL OR VETERINARY SCIENCE; HYGIENE
- A61N—ELECTROTHERAPY; MAGNETOTHERAPY; RADIATION THERAPY; ULTRASOUND THERAPY
- A61N5/00—Radiation therapy
- A61N5/10—X-ray therapy; Gamma-ray therapy; Particle-irradiation therapy
-
- G—PHYSICS
- G01—MEASURING; TESTING
- G01T—MEASUREMENT OF NUCLEAR OR X-RADIATION
- G01T1/00—Measuring X-radiation, gamma radiation, corpuscular radiation, or cosmic radiation
- G01T1/29—Measurement performed on radiation beams, e.g. position or section of the beam; Measurement of spatial distribution of radiation
-
- G—PHYSICS
- G01—MEASURING; TESTING
- G01T—MEASUREMENT OF NUCLEAR OR X-RADIATION
- G01T7/00—Details of radiation-measuring instruments
Definitions
- the present invention relates to a data analysis device, a comparison display device, a treatment plan data editing device, a dose distribution measuring method, a program, and a dose distribution measuring device.
- the present invention provides a dose distribution in a phantom that has been set up beforehand at a patient position in order to verify the consistency of irradiation and planning in particle beam therapy including proton beams and heavy ion beams and to assure the quality of treatment.
- the present invention relates to a data analyzer, a comparison display device, a treatment plan data editing device, a dose distribution measuring method, a program, and a dose distribution measuring device for measuring the dose.
- Priority is claimed on Japanese Patent Application No. 2018-177593, filed on September 21, 2018, the content of which is incorporated herein by reference.
- Particle beam therapy using proton beams or carbon ion beams uses the Bragg peak (Bragg peak) formed by the energy of charged particles with high rectilinearity to decelerate while dropping energy and drop sharply at the end, for cancer treatment. It is.
- the water equivalent distance at which particles run to the end in a patient is called the range.
- a broad beam method that forms a wide and flat irradiation field, limits it with a collimator, adjusts the range within the irradiation field, and limits the Bragg peak to the cancer target, or scans a narrow pencil beam with an electromagnet
- the range control includes an energy change method using an accelerator, an energy absorber insertion method, and a method using both methods.
- Range modulation for expanding the Bragg peak includes a static filter system and a dynamic range movement system.
- Non-Patent Document 1 discloses an embodiment of a dynamic range modulation broad beam system.
- a multi-point measurement method in which an ionization chamber or semiconductor detector is moved in water, a multi-row detector in which detection elements are arranged in multiple rows, and a two-dimensional A dimensional detector, a film-type dosimeter, a scintillator, or the like is used.
- the ionization chamber can perform accurate dose measurement irrespective of radiation, but has the disadvantage that it has poor spatial resolution and takes time for multipoint measurement.
- Other detectors have the disadvantage that the response efficiency is systematically reduced for proton beams and heavy ion beams, but film dosimeters and scintillators, in particular, are excellent in spatial resolution and uniformity of the phantom structure.
- the film-type dosimeter is inferior to the scintillator in immediacy, but is excellent in simplicity. Therefore, it is most common to use an ionization chamber only for the reference point for absolute dose measurement and to use a film type dosimeter for dose distribution measurement of the beam cross section where the effect of response efficiency deterioration is small.
- a multilayer ionization chamber is generally used for measuring the deep dose distribution in the depth direction, which is a feature of particle beam therapy and is most desired to be verified.
- Non-Patent Document 2 introduces a prototype of a multilayer ionization chamber for performing accurate and high-speed deep dose distribution measurement.
- a depth range of 260 mm in water equivalent is simultaneously measured with a 64-layer ionization chamber type detector. It is necessary to repeat the measurement including intentional range movement to make up for the difference.
- Patent Literature 1 describes a particle beam dose distribution measuring device that measures a particle beam dose distribution by a scanning irradiation method.
- the light emission of the liquid containing the fluorescent substance is arranged on the surface around the water phantom and perpendicular to the central axis of the particle beam irradiation of the water phantom.
- a one-dimensional light intensity distribution calculating unit that extracts a one-dimensional light intensity distribution from the image obtained by processing the image by the camera image processing unit; and a pencil beam from the one-dimensional light intensity distribution extracted by the one-dimensional light intensity distribution calculating unit.
- a dose distribution calculating / evaluating apparatus including a dose distribution evaluator for obtaining PDD and OCR data of the particle beam.
- the position of the Bragg peak and the dose are measured by shooting the light emission in the scintillator with the optical camera for the scanning pencil beam, and the dose distribution calculation function of the treatment planning apparatus is used.
- a dose distribution measurement device that reconstructs the dose distribution of the entire irradiation by calculating the dose distribution at each scanning position by applying the method and integrating it over the irradiation time in the same way as the dose distribution calculation function of the treatment planning device is proposed Have been.
- This method is intended only for the scanning method, and further requires a detection system with a high time resolution to follow the scanning method. Therefore, this method is not necessarily suitable for daily quality assurance requiring simplicity.
- Non-Patent Document 3 proposes a dose distribution measurement device that directly measures a one-dimensional dose distribution in a depth direction, that is, a deep dose distribution by installing a film-type dosimeter in a phantom in parallel with a beam.
- the film-type dosimeter used here does not require development processing and can measure dose by reading the degree of blackening with an optical scanner after irradiation, and is currently widely used mainly for simple cross-section distribution measurement. Is what it is.
- the dose cannot be directly calculated from the measured response for proton beams or heavy ion beams, correction is required for each measurement point.Some of the information necessary for this correction is The independence of the validation is lost because it has to be obtained from a treatment plan. Further, since the detector has no time resolution, it is impossible to reconstruct a dose distribution by applying a treatment plan as proposed in Patent Document 1.
- Non-Patent Document 4 a positron emission nucleus generated by a nuclear reaction in a patient during proton beam therapy is converted into a three-dimensional image by a general positron emission tomography apparatus, and protons are converted from an image captured by mathematical deconvolution processing.
- a method has been proposed in which the energy and position distributions are calculated backward and the dose distribution calculation function of the treatment planning apparatus is applied to reconstruct the dose distribution from the proton distribution as in Patent Document 1.
- positron emission nucleation does not have features such as Bragg peaks in the dose distribution and generally has insufficient resolution in tomography, it is difficult to estimate the particle distribution with deconvolution processing with high accuracy.
- this since this is a post-confirmation of the dose administered to the patient at the time of treatment, the use is different from the prior verification by the dose distribution measuring device of the present invention.
- the heavy ion beam therapy planning apparatus generally calculates a biological dose distribution in a patient body by a mathematical biological effect model based on a measured deep dose distribution of a physical dose, and plans an optimal beam for each treatment.
- Non-Patent Document 5 describes the main biological effect models used to date, but is roughly divided into a model based on photon therapy used mainly in Europe and a human salivary gland mainly used in Japan. There are models based on tumor cell experiments.
- biological effect models are constantly evolving research subjects, so even if they are nominally the same model, they are not always quantitatively the same. Therefore, for example, when using a common treatment protocol in multicenter clinical research, it is necessary to quantitatively evaluate the equivalence of biodoses between centers and confirm that they can be commonly used.
- the present invention is a high-resolution, high-accuracy, simple and suitable for daily operation of the physical dose distribution and biological dose distribution of the therapeutic particle beam, a data analyzer that can measure at low cost, a comparative display device, a treatment plan data editing device, It is an object to provide a dose distribution measuring method, a program, and a dose distribution measuring device. That is, the present invention provides a data analysis device, a comparison display device, a treatment plan data editing device, and a dose distribution measuring method capable of easily and at a low cost obtaining a high-resolution and high-accuracy dose response distribution of a physical dose and a biological dose. And a program and a dose distribution measuring device.
- a response signal to the therapeutic particle beam irradiated on the phantom device is recorded by a dosimeter provided in the phantom device irradiated with the therapeutic particle beam.
- the response signal output or recorded or output by the dosimeter is acquired by a data acquisition device and converted into numerical data, and the phantom device is irradiated based on the signal data converted into numerical data by the data acquisition device.
- Dose response distribution indicating the relationship between the dose response of the therapeutic particle beam and the depth of the phantom device is calculated by a dose response distribution calculation unit, and the dose response distribution calculated by the dose response distribution calculation unit is calculated.
- a data analyzer for performing a process wherein the line calculated by the dose response distribution calculator is By performing deconvolution processing on the response distribution, the configuration of the beam elements constituting the therapeutic particle beam and the deconvolution processing unit for estimating the weight of each beam element are estimated by the deconvolution processing unit.
- a dose distribution reconstructing unit configured to reconstruct a dose distribution of a physical dose and a dose distribution of a biological dose in accordance with the configuration of the obtained beam element.
- the comparison display device uses the weight of each of the beam elements estimated by the deconvolution processing unit of the data analysis device, and uses the weight of each of the beam elements as a source of a simulated treatment plan using the phantom device.
- the dose distribution of the physical dose in the patient and the dose distribution of the biological dose are reconstructed, and the reconstructed physical dose in the patient is calculated.
- the dose distribution of the dose distribution and the biological dose is compared with the dose distribution of the original patient treatment plan.
- the treatment plan data editing apparatus uses the weight of each of the beam elements estimated by the deconvolution processing unit of the data analysis apparatus to change and save the beam information of the original patient treatment plan. I do.
- a dose distribution measuring method is a dose distribution measuring method for measuring a dose distribution of a therapeutic particle beam, wherein the dose provided in a phantom device irradiated with the therapeutic particle beam is provided.
- a dose response distribution calculating step of calculating a response distribution By performing deconvolution processing on the dose response distribution, the configuration of the beam elements constituting the therapeutic particle beam and the deconvolution processing step of estimating the weight of each of the beam elements, and the deconvolution processing step A dose distribution reconstruction step of reconstructing the dose distribution of the physical dose and the dose distribution of the biological dose according to the estimated configuration of the beam element.
- a program is configured such that a response signal to the therapeutic particle beam irradiated on the phantom device is recorded or output by a dosimeter provided in the phantom device irradiated with the therapeutic particle beam.
- the response signal recorded or output by the dosimeter is acquired by a data acquisition device and converted into numerical data, and based on the signal data converted into numerical data by the data acquisition device, the phantom device is irradiated.
- a dose response distribution indicating a relationship between the dose response of the therapeutic particle beam and the depth of the phantom device is calculated by a dose response distribution calculation unit, and a process on the dose response distribution calculated by the dose response distribution calculation unit is performed.
- a dose distribution measuring device is a dose distribution measuring device that measures a dose distribution of a therapeutic particle beam, wherein the phantom device irradiated with the therapeutic particle beam, and the phantom device A dosimeter that is provided, and records or outputs a response signal to the therapeutic particle beam irradiated to the phantom device, and obtains a response signal recorded or output by the dosimeter to generate numerical data.
- a dose response distribution calculator for calculating a response distribution, and deconvolution of the dose response distribution calculated by the dose response distribution calculator.
- the deconvolution processing unit for estimating the configuration of the beam elements constituting the therapeutic particle beam, the weight of each of the beam elements, and the beam element estimated by the deconvolution processing unit.
- a dose distribution reconstructing unit for reconstructing the dose distribution of the physical dose and the dose distribution of the biological dose in accordance with the above configuration.
- the dosimeter is a one-dimensional dosimeter extending in a first direction that is a depth direction of the phantom device
- the dose distribution reconstructing unit includes: The deep dose distribution of the physical dose in the first direction and the deep dose distribution of the biological dose in the first direction may be reconstructed.
- the dosimeter extends in a first direction that is a depth direction of the phantom device, and extends in a second direction orthogonal to the first direction.
- a two-dimensional dosimeter spreading on a first plane wherein the dose distribution reconstruction unit is configured to perform two-dimensional dose distribution of a physical dose on the first plane and two-dimensional distribution of a biological dose on the first plane. The dose distribution may be reconstructed.
- the dosimeter extends at least in a first direction that is a depth direction of the phantom device, and extends in a second direction orthogonal to the first direction.
- the two-dimensional dose distribution of the biological dose on the plane may be reconstructed. Further, a three-dimensional distribution may be reconstructed from the acquired dose distributions on a plurality of planes.
- a dose distribution measuring device which can measure a physical dose distribution and a biological dose distribution of a therapeutic particle beam with high resolution, high accuracy, simplicity suitable for daily operation, and at low cost.
- a data analyzer a comparative display device, a treatment plan data editing device, a dose distribution device capable of easily and at a low cost obtaining a high-resolution and high-accuracy dose response distribution of a physical dose and a biological dose.
- a measurement method, a program, and a dose distribution measurement device can be provided.
- FIG. 2 is a diagram showing a first specific example of the dose distribution measuring device of the first embodiment shown in FIG. 1.
- FIG. 4 is a diagram illustrating an example of information (data) registered in the data analyzer in advance.
- the dose response distribution calculated by the dose response distribution calculator of the data analyzer, the range modulation estimated by the deconvolution processor of the data analyzer, and the physical dose reconstructed by the dose distribution reconstructor of the data analyzer.
- FIG. 5 is a flowchart illustrating an example of a process performed by the dose distribution measurement device according to the first embodiment. It is a figure showing an example of a dose distribution measuring device of a 2nd embodiment. It is a figure showing an example of a phantom device and a dosimeter of a dose distribution measuring device of a 2nd embodiment. It is a figure showing an example of a dose distribution measuring device of a 3rd embodiment. It is a figure showing an example of a phantom device and a dosimeter of a dose distribution measuring device of a 3rd embodiment. It is a figure showing an example of the system which can apply the dose distribution measuring device of a 1st-3rd embodiment.
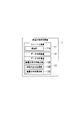
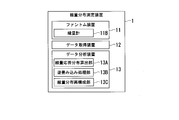
- FIG. 1 is a diagram illustrating an example of the dose distribution measuring device 1 according to the first embodiment.
- the dose distribution measuring device 1 includes a phantom device 11, a data acquisition device 12, and a data analysis device 13.
- the phantom device 11 is irradiated with a therapeutic particle beam (specifically, a therapeutic particle beam that forms an enlarged Bragg peak).
- the phantom device 11 is mainly composed of a liquid such as water.
- the phantom device 11 may be mainly composed of a solid such as plastic.
- the phantom device 11 includes a dosimeter 11A.
- the dosimeter 11A records or outputs a response signal to the therapeutic particle beam irradiated to the phantom device 11.
- the data acquisition device 12 acquires the response signal recorded or output by the dosimeter 11A and converts it into numerical data.
- the data analysis device 13 includes a dose response distribution calculation unit 13A, a deconvolution processing unit 13B, and a dose distribution reconstruction unit 13C.
- the dose response distribution calculation unit 13A indicates the relationship between the dose response of the therapeutic particle beam irradiated on the phantom device 11 and the depth of the phantom device 11 based on the signal data converted into numerical data by the data acquisition device 12. Calculate the dose response distribution.
- the data analyzer 13 includes a dose response distribution calculator 13A.
- the dose response distribution calculation unit 13A may be provided in the data acquisition device 12. That is, in this example, the dose response distribution calculation unit 13A is provided outside the data analyzer 13.
- the deconvolution processing unit 13B performs deconvolution processing on the dose response distribution calculated by the dose response distribution calculation unit 13A, and thereby the configuration of the beam elements forming the therapeutic particle beam. , And the weight of each of the beam elements.
- the dose distribution reconstruction unit 13C reconstructs the dose distribution of the physical dose and the dose distribution of the biological dose according to the configuration of the beam element estimated by the deconvolution processing unit 13B.
- FIG. 2 is a diagram showing a first specific example of the dose distribution measuring device 1 of the first embodiment shown in FIG. 2A shows a first specific example of the phantom device 11 and the dosimeter 11A shown in FIG.
- FIG. 2B shows a first specific example of the data acquisition device 12 shown in FIG.
- FIG. 2C shows a first specific example of the data analyzer 13 shown in FIG.
- the dosimeter 11A is a one-dimensional dosimeter that extends in the first direction D1, which is the depth direction of the phantom device 11 (the left-right direction in FIG. 2A).
- the dosimeter 11A is a film type dosimeter.
- the dosimeter 11A is fixed inside the phantom device 11.
- the phantom device 11 has an approximately uniform structure with respect to the particle beam in the cross section of the dosimeter 11A and its periphery.
- the relationship between the position on the measurement axis 11AX of the dosimeter 11A and the water equivalent depth in the phantom device 11 is calibrated theoretically or experimentally.
- one one-dimensional dosimeter 11A is arranged in the phantom device 11, but in another example, a plurality of one-dimensional dosimeters are arranged in the phantom device 11, and are multiaxially arranged. May be.
- the data acquisition device 12 is an optical scanner.
- the data analyzer 13 is a computer.
- the data acquisition device 12 and the data analysis device 13 are connected via a recording medium such as a flash memory or a network.
- a recording medium such as a flash memory or a network.
- the particle beam is directed rightward from the particle beam irradiation device (not shown) to the phantom device 11 (dosimeter).
- 11A parallel to the measurement axis 11AX.
- the dosimeter 11A responds differently to the irradiated particle beam at different positions in the left-right direction (the depth direction of the phantom device 11) in FIG. 2A.
- the particle beam is emitted from the particle beam irradiation device to the phantom device 11 in accordance with a simulated treatment plan imitating patient treatment.
- the relative position of the phantom device 11 with respect to the particle beam irradiation device is the same as the relative position of the patient (not shown) with respect to the particle beam irradiation device during actual treatment.
- the dosimeter 11 ⁇ / b> A that has shown a different response at different positions in the left-right direction in FIG.
- the dose response distribution calculation unit of the data analysis device 13 (computer) 13A calculates a dose response distribution indicating the relationship between the dose response of the particle beam irradiated to the phantom device 11 and the depth of the phantom device 11. That is, in the example shown in FIG.
- the data acquisition device 12 reads the analog signal of the one-dimensional dosimeter 11 ⁇ / b> A for each depth of the phantom device 11 and sends the data signal (digital data) to the data analysis device 13.
- the dose response distribution calculator 13A of the data analyzer 13 converts the signal of the one-dimensional dosimeter 11A into a dose response and quantifies it. It is assumed that the conversion relationship from the signal of the one-dimensional dosimeter 11A to the dose response has been calibrated in advance by a standard method using a reference radiation such as a photon beam.
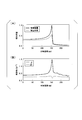
- FIG. 3 is a diagram showing an example of information (data) registered in the data analyzer 13 in advance. More specifically, FIG. 3A shows the depth dose of the quasi-Bragg peak beam which is registered in advance in the data analyzer 13 and is the basis of the beam element whose configuration is estimated by the deconvolution processor 13B of the data analyzer 13. It is a figure which shows distribution ("physical dose”) and the dose response ("dose response") of the film type dosimeter 11A irradiated with the quasi-Bragg peak beam.
- FIG. 3A shows the depth dose of the quasi-Bragg peak beam which is registered in advance in the data analyzer 13 and is the basis of the beam element whose configuration is estimated by the deconvolution processor 13B of the data analyzer 13.
- It is a figure which shows distribution ("physical dose”) and the dose response ("dose response") of the film type dosimeter 11A irradiated with the quasi-Bragg peak beam.
- FIG. 3A shows the depth dose of the quasi-Bragg peak beam which is registered in advance in the data
- FIG. 3B shows the sensitivity parameter of the above-described quasi-Bragg peak beam, which is pre-registered in the data analysis device 13 and serves as a basis of a beam element whose configuration is estimated by the deconvolution processing unit 13B of the data analysis device 13 ( It is a figure which shows the distribution on a water axis of "(alpha)" and "((beta) 1/2 )."
- the horizontal axis in FIGS. 3A and 3B indicates the water equivalent depth (mm) corresponding to the depth of the phantom device 11 (see FIG. 2A).
- the vertical axis in FIG. 3A indicates the relative dose.
- the vertical axis of FIG. 3 (B) indicates sensitivity (Gy ⁇ 1 ).
- FIG. 3A indicates a deep dose distribution (physical dose distribution) of the above-described quasi-Bragg peak beam.
- a broken line (“dose response”) in FIG. 3A shows a dose response (dose response distribution) of the film-type dosimeter 11A irradiated with the above-described quasi-Bragg peak beam.
- the solid line (“ ⁇ ”) in FIG. 3B indicates the sensitivity parameter “ ⁇ ” of the quasi-Bragg peak beam described above.
- the dashed line (“( ⁇ ) 1/2 ”) in FIG. 3B indicates the sensitivity parameter “( ⁇ ) 1/2 ” of the quasi-Bragg peak beam described above.
- the information (data) shown in FIG. 3 is used in processing by the deconvolution processing unit 13B of the data analysis device 13.
- the information (data) shown in FIG. 3 is used for processing (for example, biological dose reconstruction) by the dose distribution reconstruction unit 13C of the data analyzer 13.
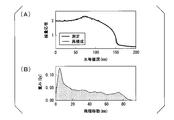
- FIG. 4 shows the dose response distribution calculated by the dose response distribution calculation unit 13A of the data analysis device 13, the range modulation estimated by the deconvolution processing unit 13B of the data analysis device 13, and the dose distribution reconstruction unit of the data analysis device 13. It is a figure which shows an example of the deep dose distribution etc. of the physical dose reconstructed by 13C.
- 4A shows the dose response distribution calculated by the dose response distribution calculator 13A of the data analyzer 13 and the depth of the physical dose reconstructed by the dose distribution reconstructor 13C of the data analyzer 13. It is a figure which shows a dose distribution.
- FIG. 4B is a diagram showing range modulation (weight distribution of range movement) estimated by the deconvolution processing unit 13B of the data analysis device 13. The horizontal axis in FIG.
- FIG. 4A indicates the water equivalent depth (mm) corresponding to the depth of the phantom device 11 (see FIG. 2A).
- the vertical axis in FIG. 4A shows the dose response.
- the horizontal axis in FIG. 4B indicates the range movement (mm).
- the vertical axis of FIG. 4B indicates the weight (Gy).
- the solid line (“measurement”) in FIG. 4A indicates the relationship (dose response distribution) between the dose response calculated by the dose response distribution calculation unit 13A of the data analyzer 13 and the depth of the phantom device 11. .
- a broken line (“reconstruction”) in FIG. 4A indicates a deep dose distribution of the physical dose reconstructed by the dose distribution reconstruction unit 13C of the data analyzer 13.
- FIG. 4B shows the range modulation estimated by the deconvolution processing unit 13B of the data analysis device 13.
- This range modulation corresponds to the configuration of the beam elements constituting the particle beam estimated by the deconvolution processing unit 13B of the data analyzer 13.
- the weight (Gy) shown on the vertical axis in FIG. 4B corresponds to the weight of each beam element estimated by the deconvolution processing unit 13B of the data analysis device 13.
- the deconvolution processing unit 13B of the data analysis device 13 performs deconvolution processing on the dose response distribution (solid line in FIG. 4A) calculated by the dose response distribution calculation unit 13A.
- a general recursive optimization method described in Non-Patent Document 1 is used.
- the deconvolution processing unit 13B of the data analyzer 13 uses the particle beam (FIG. 2) that forms the dose response distribution from the dose response distribution indicated by the solid line in FIG.
- the configuration of the beam elements constituting (A) and the weight of each of the beam elements are estimated.
- the beam element is a basic unit of a set of particles constituting a particle beam. The linear sum of them can describe the particle composition of any complex therapeutic particle beam. For example, in the energy modulation / scanning method, a pencil beam of each energy corresponds to a beam element, and in the range modulation / broad beam method, a Bragg peak beam before range modulation corresponds to a beam element. It is assumed that the dose response distributions of all the beam elements are registered in the data analyzer 13 as information necessary for the deconvolution processing.
- FIG. 5 is a diagram illustrating an example of a deep dose distribution of a physical dose, a deep dose distribution of a biological dose, and the like reconstructed by the dose distribution reconstructing unit 13C of the data analyzer 13. More specifically, FIG. 5A shows the deep dose distribution of the physical dose reconstructed by the dose distribution reconstructing unit 13C of the data analyzer 13 and the deep dose of the physical dose planned by the treatment planning device (not shown). It is a figure which shows a dose distribution.
- FIG. 5B is a diagram showing a deep dose distribution of the biological dose reconstructed by the dose distribution reconstructing unit 13C of the data analysis device 13 and a deep dose distribution of the biological dose planned by the treatment planning device. The horizontal axis of FIGS.
- FIG. 5A and 5B indicates the water equivalent depth (mm) corresponding to the depth of the phantom device 11 (see FIG. 2A).
- the vertical axis of FIG. 5A indicates the physical dose (Gy).
- shaft of FIG.5 (B) has shown biological dose (Gy eq.).
- the solid line (“plan”) in FIG. 5A shows the deep dose distribution of the physical dose planned by the treatment planning device.
- the broken line (“reconstruction”) in FIG. 5A indicates the deep dose distribution of the physical dose reconstructed by the dose distribution reconstruction unit 13C of the data analyzer 13.
- the solid line (“plan”) in FIG. 5B shows the deep dose distribution of the biological dose planned by the treatment planning device.
- the dose distribution reconstruction unit 13C of the data analysis device 13 follows the configuration of the beam element estimated by the deconvolution processing unit 13B (the relationship illustrated in FIG. By weighted superposition), the deep dose distribution of the physical dose shown by the broken line in FIG. 5A is reconstructed.
- the dose distribution reconstruction unit 13C of the data analyzer 13 obtains the biological dose indicated by the broken line in FIG. 5B from the deep dose distribution of the physical dose indicated by the broken line in FIG. Reconstruct the deep dose distribution of the dose.
- FIG. 5B the configuration of the beam element estimated by the deconvolution processing unit 13B (the relationship illustrated in FIG. By weighted superposition), the deep dose distribution of the physical dose shown by the broken line in FIG. 5A is reconstructed.
- the dose distribution reconstruction unit 13C of the data analyzer 13 obtains the biological dose indicated by the broken line in FIG. 5B from the deep dose distribution of the physical dose indicated by the broken line in FIG. Reconstruct the deep dose distribution of the dose.
- the physical dose distribution and the biological dose distribution reconstructed by the dose distribution reconstructing unit 13C are within the range of the measurement error as compared with the planned physical dose distribution and the biological dose distribution, It can be said that it is not inconsistent with the plan. Also, it can be said that a uniform biological dose distribution was achieved within the enlarged Bragg peak as planned for the treatment.
- the dose distribution reconstruction unit 13C of the data analyzer 13 uses the one-dimensional dosimeter 11A according to the range modulation (that is, the configuration of the beam element) estimated by the deconvolution processing unit 13B.
- the physical dose distribution (broken line in FIG. 5A) and the biological dose distribution (broken line in FIG. 5B) on the measurement axis 11AX are reconstructed.
- the data (for example, the information shown in FIG. 3) and calculation codes such as the deep dose distribution in water, the biological effect model, and the susceptibility parameter required for the reconstruction by the dose distribution reconstruction unit 13 ⁇ / b> C of the data analysis device 13 are provided by the treatment planning device (FIG.
- the dose distribution reconstructing unit 13C of the data analyzer 13 performs the deep dose distribution of the physical dose in the first direction D1 (see FIG. 2A) (see FIG. 5A). (Broken line in the middle). Further, the dose distribution reconstruction unit 13C of the data analysis device 13 reconstructs the deep dose distribution (the broken line in FIG. 5B) of the biological dose in the first direction D1. That is, the dose distribution measuring apparatus 1 measures the deep dose distribution (the deep dose distribution of the physical dose and the deep dose distribution of the biological dose) of the therapeutic particle beam.
- the dosimeter 11A is a strip-shaped film dosimeter constituted by a continuous single element
- the data acquisition device Reference numeral 12 denotes an optical scanner. That is, in the first specific example of the dose distribution measuring device 1 of the first embodiment, the dosimeter 11A outputs the dose distribution on the measurement axis 11AX of the dosimeter 11A as a response signal to the particle beam irradiated to the phantom device 11. Record a chemical analog signal indicating The optical scanner as the data acquisition device 12 reads an analog signal recorded on the dosimeter 11A and converts it into a digital signal.
- the dosimeter 11A is a multilayer ionization chamber (not shown) configured by a number of elements and measuring an absorbed dose, and the data acquisition device 12 And an analog-to-digital converter (not shown) for converting an analog signal output from the multilayer ionization chamber into a digital signal, and an electrometer (not shown). That is, in the second specific example of the dose distribution measuring device 1 of the first embodiment, the multi-layer ionization chamber as the dosimeter 11A uses the measurement axis of the dosimeter 11A as a response signal to the particle beam irradiated on the phantom device 11. An electrical analog signal indicating the dose distribution on 11AX is output. An analog-to-digital converter, an electrometer, and the like as the data acquisition device 12 acquire an analog signal output by the multilayer ionization chamber as the dosimeter 11A and convert it into a digital signal.
- the dosimeter 11A is a phosphor film (rod-shaped scintillator) (not shown) composed of a continuous single element, and acquires data.
- the device 12 is a camera (not shown) that images the fluorescent film. That is, in the third specific example of the dose distribution measuring device 1 of the first embodiment, the fluorescent film serving as the dosimeter 11A uses the measurement axis 11AX of the dosimeter 11A as a response signal to the particle beam irradiated on the phantom device 11. Record the chemical analog signal showing the above dose distribution.
- a camera (digital camera) as the data acquisition device 12 reads an analog signal recorded on a fluorescent film as the dosimeter 11A and converts it into a digital signal.
- the dosimeter 11A is a multi-row semiconductor detector (not shown) composed of a large number of elements, and the data acquisition device 12 includes a semiconductor detector , An analog-to-digital converter (not shown) for converting an analog signal output from the device into a digital signal, and an electrometer (not shown).
- the semiconductor detector as the dosimeter 11A uses the measurement axis of the dosimeter 11A as a response signal to the particle beam irradiated on the phantom device 11.
- An electrical analog signal indicating the dose distribution on 11AX is output.
- An analog-to-digital converter, an electrometer, or the like as the data acquisition device 12 acquires an analog signal output by the semiconductor detector as the dosimeter 11A and converts it into a digital signal.
- a standard (general) device is applied according to the type of the dosimeter 11A and used as the data acquisition device 12.
- FIG. 6 is a flowchart illustrating an example of a process performed by the dose distribution measurement device 1 according to the first embodiment.
- the dosimeter 11A of the phantom device 11 records or outputs a response signal to the therapeutic particle beam irradiated on the phantom device 11.
- the data acquisition device 12 acquires the response signal recorded or output by the dosimeter 11A and converts it into numerical data.
- the dose response distribution calculation unit 13A of the data analysis device 13 performs the dose response of the therapeutic particle beam irradiating the phantom device 11 based on the signal data digitized by the data acquisition device 12.
- step S4 the deconvolution processing unit 13B of the data analysis device 13 performs deconvolution processing on the dose response distribution calculated by the dose response distribution calculation unit 13A, thereby forming a beam forming the therapeutic particle beam.
- the configuration of the elements and the weight of each of the beam elements are estimated.
- step S5 the dose distribution reconstructing unit 13C of the data analysis device 13 reconstructs the deep dose distribution of the physical dose and the deep dose distribution of the biological dose in accordance with the configuration of the beam element estimated by the deconvolution processing unit 13B. Constitute. That is, the dose distribution measuring device 1 measures the deep dose distribution of the therapeutic particle beam by executing steps S1 to S5.
- the dose of the particle beam measured by a general dosimeter element such as an ionization chamber, a semiconductor, a film type dosimeter, and a scintillator.
- the particle configuration is back calculated by the deconvolution process, and the physical dose distribution and the biological dose distribution are reconstructed. Therefore, in the dose distribution measuring device 1 of the first embodiment, the physical dose distribution and the biological dose distribution of the therapeutic particle beam can be measured with high resolution, high accuracy, simplicity suitable for daily operation, and at low cost. Verifying the therapeutic particle beam by comparing the dose distribution data (physical dose distribution, biological dose distribution) reconstructed by the dose distribution measuring device 1 of the first embodiment with the corresponding treatment plan data. Can be.
- the dose response distribution calculating unit 13A of the data analyzer 13 allows the dose of the therapeutic particle beam to be increased.
- the response distribution can be calculated.
- the deconvolution processing unit 13B of the data analysis device 13 performs mathematical processing (deconvolution processing) on the dose response distribution calculated by the dose response distribution calculating unit 13A.
- the dose distribution reconstructing unit 13C of the data analyzing device 13 uses the particle configuration of the therapeutic particle beam estimated by the deconvolution processing unit 13B (configuration of beam elements). , The physical dose distribution and the biological dose distribution can be calculated. In the dose distribution measuring device 1 of the first embodiment, an arbitrary biological effect model can be used independently of the treatment plan.
- the dose distribution measuring device 1 according to the second embodiment has the same configuration as the dose distribution measuring device 1 according to the above-described first embodiment, except for the points described below. Therefore, according to the dose distribution measuring device 1 of the second embodiment, the same effects as those of the above-described dose distribution measuring device 1 of the first embodiment can be obtained, except for the following points.
- FIG. 7 is a diagram illustrating an example of the dose distribution measuring device 1 according to the second embodiment.
- the phantom device 11 includes a one-dimensional dosimeter 11A extending in the depth direction (first direction D1) of the phantom device 11 as shown in FIG.
- the phantom device 11 includes a two-dimensional dosimeter 11B having a configuration different from that of the dosimeter 11A.
- FIG. 8 is a diagram illustrating an example of the phantom device 11 and the dosimeter 11B of the dose distribution measuring device 1 according to the second embodiment.
- FIG. 8A is a view (left side view) of the phantom device 11 and the dosimeter 11A viewed from the left side of FIG. 2A (left side view), and the phantom of the dose distribution measuring device 1 of the second embodiment. It is a left view of the apparatus 11 and the dosimeter 11B.
- FIG. 8B is a cross-sectional view taken along line AA of FIG. 8A.
- the dosimeter 11B extends in the first direction D1 that is the depth direction (the left-right direction in FIG.
- the dosimeter 11B is, for example, a film type dosimeter. Further, the dosimeter 11B is fixed inside the phantom device 11.
- a multi-axis particle beam is firstly transmitted from a particle beam irradiation device (not shown) to the phantom device 11.
- a particle beam irradiation device not shown
- Light is emitted in the direction D1 and parallel to the first plane PL1.
- the dosimeter 11B responds differently to the irradiated multi-axis particle beam at each position on the first plane PL1.
- the dosimeter 11 ⁇ / b> B that shows a different response at each position on the first plane PL ⁇ b> 1 is scanned by the data acquisition device 12 (optical scanner).
- the dose response distribution calculation unit of the data analysis device 13 (computer) is based on the signal data (output signal data of the optical scanner) converted into numerical data by the data acquisition device 12 (optical scanner).
- 13A calculates a dose response distribution indicating the relationship between the dose response of the multiaxial particle beam irradiated to the phantom device 11 and each position on the first plane PL1. That is, in the example illustrated in FIG.
- the data acquisition device 12 reads the analog signal of the two-dimensional dosimeter 11B for each position on the first plane PL1 and digitizes the signal data (digital data) to the data analysis device 13. .
- the dose response distribution calculator 13A of the data analyzer 13 converts the signal of the two-dimensional dosimeter 11B into a dose response and quantifies it. It is assumed that the conversion relationship from the signal of the two-dimensional dosimeter 11B to the dose response has been calibrated in advance by a standard method using a reference radiation such as a photon beam.
- the deconvolution processing unit 13B of the data analysis device 13 executes the deconvolution processing on the dose response distribution calculated by the dose response distribution calculation unit 13A, so that the multi-axis particle beam The configuration of the beam elements constituting the beam and the weight of each of the beam elements are estimated.
- the dose distribution reconstruction unit 13C reconstructs the two-dimensional dose distribution of the physical dose and the two-dimensional dose distribution of the biological dose according to the configuration of the beam element estimated by the deconvolution processing unit 13B.
- the dose distribution reconstruction unit 13C includes a two-dimensional dose distribution of the physical dose on the first plane PL1 (physical dose distribution at each position on the first plane PL1) and a biological dose on the first plane PL1. The two-dimensional dose distribution (biological dose distribution at each position on the first plane PL1) is reconstructed.
- the particle configuration is back-calculated by the deconvolution process from the dose response distribution of the multi-axis particle beam measured by the general two-dimensional dosimeter 11B. , The physical dose distribution and the biological dose distribution at each position on the first plane PL1 are reconstructed. Therefore, in the dose distribution measuring device 1 of the second embodiment, the physical dose distribution and the biological dose distribution of the multi-axis therapeutic particle beam are measured with high resolution, high accuracy, simplicity suitable for daily operation, and at low cost. Can be.
- the two-dimensional dosimeter 11B is treated as a set of one-dimensional dosimeters arranged in parallel to the particle beam, thereby simultaneously measuring the multiaxial dose distribution. be able to.
- the dose distribution measuring device 1 of the third embodiment has the same configuration as that of the above-described dose distribution measuring device 1 of the first embodiment, except for the points described below. Therefore, according to the dose distribution measuring device 1 of the third embodiment, the same effects as those of the above-described dose distribution measuring device 1 of the first embodiment can be obtained, except for the following points.
- FIG. 9 is a diagram illustrating an example of the dose distribution measuring device 1 according to the third embodiment.
- the phantom device 11 includes a one-dimensional dosimeter 11A extending in the depth direction (first direction D1) of the phantom device 11 as shown in FIG.
- the phantom device 11 includes a plurality of two-dimensional dosimeters 11B-1, 11B-2, and 11B-3 having a configuration different from that of the dosimeter 11A.
- FIG. 10 is a diagram illustrating an example of the phantom device 11 and the dosimeters 11B-1, 11B-2, and 11B-3 of the dose distribution measuring device 1 according to the third embodiment.
- FIG. 10A corresponds to a view (left side view) of the phantom device 11 and the dosimeter 11A viewed from the left side of FIG. 2A, and is a phantom of the dose distribution measuring device 1 of the third embodiment.
- FIG. 3 is a left side view of the apparatus 11 and dosimeters 11B-1, 11B-2, and 11B-3.
- FIG. 10B is a cross-sectional view taken along the line BB of FIG.
- FIG. 10C is a cross-sectional view taken along line CC of FIG.
- FIG. 10D is a cross-sectional view along the line DD in FIG.
- the phantom device 11 includes a plurality of plate members 11-1 to 11-8.
- the plate members 11-1 to 11-8 are stacked.
- the plate members 11-1 to 11-8 are mainly made of a solid such as plastic.
- the plate members 11-1 to 11-8 are made of a material that is approximately equivalent to a film dosimeter in interaction with the particle beam.
- Each of the plurality of two-dimensional dosimeters 11B-1, 11B-2, and 11B-3 is a strip-shaped or sheet-shaped film dosimeter, and has the same configuration as, for example, the dosimeter 11B shown in FIG.
- the dosimeter 11B-1 is sandwiched between the plate member 11-2 and the plate member 11-3.
- the dosimeter 11B-1 extends in a first direction D1, which is a depth direction (left-right direction in FIG. 10B) of the phantom device 11, and extends in a second direction D2 orthogonal to the first direction D1.
- On the first plane PL11 see FIG. 10B.
- the dosimeter 11B-2 is sandwiched between the plate member 11-4 and the plate member 11-5.
- the dosimeter 11B-2 extends on a second plane PL12 (see FIG. 10C) parallel to the first plane PL11.
- the dosimeter 11B-3 is sandwiched between the plate member 11-6 and the plate member 11-7.
- the dosimeter 11B-3 extends on a third plane PL13 (see FIG. 10D) parallel to the second plane PL12.
- the plurality of plate members 11-1 to 11-8 and the plurality of dosimeters 11B-1, 11B-2, and 11B-3 are fixed by means such as a band, a clamp, and an outer frame structure that are easily disassembled and assembled.
- the layered state is maintained during the irradiation of the particle beam. That is, the dosimeters 11B-1, 11B-2, and 11B-3 are easily configured to be attached to and detached from the plate members 11-1 to 11-8 before and after the irradiation of the particle beam.
- a multi-axis particle beam is first transmitted from a particle beam irradiation device (not shown) to the phantom device 11.
- a particle beam irradiation device (not shown)
- Light is emitted in the direction D1 and parallel to the first plane PL11.
- the two-dimensional dosimeter 11B-1 responds differently to the irradiated multiaxial particle beam at each position on the first plane PL11.
- a multi-axis particle beam is emitted from the particle beam irradiation device to the phantom device 11 in the first direction D1 and to the second plane PL12. Irradiated in parallel.
- the two-dimensional dosimeter 11B-2 responds differently to the irradiated multiaxial particle beam at each position on the second plane PL12.
- a multi-axis particle beam is transmitted from the particle beam irradiation device to the phantom device 11 in the first direction D1 and to the third plane PL13. Irradiated in parallel.
- the two-dimensional dosimeter 11B-3 responds differently to the irradiated multi-axis particle beam at each position on the third plane PL13.
- the two-dimensional dosimeter 11B-1 which has shown a different response at each position on the first plane PL11 is scanned by the data acquisition device 12 (optical scanner). Further, the two-dimensional dosimeter 11B-2 that has shown a different response at each position on the second plane PL12 is scanned by the data acquisition device 12. Similarly, the two-dimensional dosimeter 11B-3 which shows a different response at each position on the third plane PL13 is scanned by the data acquisition device 12.
- the dose response distribution calculation unit of the data analysis device 13 (computer) is based on the signal data (output signal data of the optical scanner) converted into numerical data by the data acquisition device 12 (optical scanner).
- 13A is a dose response distribution indicating a relationship between a dose response of the multi-axis particle beam irradiated to the phantom device 11 and each position on the first plane PL11, and a multi-axis particle beam irradiated to the phantom device 11.
- Response distribution showing the relationship between the dose response of the phantom device and each position on the second plane PL12, and the dose response of the multi-axis particle beam irradiated on the phantom device 11 and each position on the third plane PL13. Calculate the dose response distribution showing the relationship. That is, in the example shown in FIG.
- the data acquisition device 12 reads the analog signal of the two-dimensional dosimeter 11B-1 for each position on the first plane PL11 and digitizes the signal data (digital data).
- Signal data obtained by reading the analog signal of 11B-2 for each position on the second plane PL12 and signal data obtained by reading the analog signal of the two-dimensional dosimeter 11B-3 for each position on the third plane PL13 The data is sent to the data analyzer 13.
- the dose response distribution calculator 13A of the data analyzer 13 converts the signals of the two-dimensional dosimeters 11B-1, 11B-2, and 11B-3 into dose responses and quantifies them. It is assumed that the conversion relationship from the signals of the two-dimensional dosimeters 11B-1, 11B-2, and 11B-3 to the dose response has been calibrated in advance by a standard method using a reference radiation such as a photon beam.
- the deconvolution processing unit 13B of the data analysis device 13 performs deconvolution processing on the dose response distribution on the first plane PL11 calculated by the dose response distribution calculation unit 13A. , And the weights of the beam elements constituting the multi-axis particle beam shown in FIG. 10B are estimated. Also, the deconvolution processing unit 13B performs deconvolution processing on the dose response distribution on the second plane PL12 calculated by the dose response distribution calculation unit 13A, thereby obtaining the multi-axis particle beam illustrated in FIG. The configuration of the beam elements constituting the beam and the weight of each of the beam elements are estimated.
- the deconvolution processing unit 13B performs the deconvolution process on the dose response distribution on the third plane PL13 calculated by the dose response distribution calculation unit 13A, thereby obtaining the multi-axis particles illustrated in FIG.
- the configuration of the beam elements constituting the line beam and the weight of each of the beam elements are estimated.
- the dose distribution reconstruction unit 13C calculates the two-dimensional dose of the physical dose on the first plane PL11 according to the configuration of the beam element of the multi-axis particle beam shown in FIG. 10B, which is estimated by the deconvolution processing unit 13B. Reconstruct the distribution and the two-dimensional dose distribution of the biological dose.
- the dose distribution reconstructing unit 13C performs two-dimensional dose distribution of the physical dose on the first plane PL11 (physical dose distribution at each position on the first plane PL11) and two-dimensional biodose on the first plane PL11.
- the dose distribution biological dose distribution at each position on the first plane PL1
- the dose distribution reconstruction unit 13C calculates the physical dose on the second plane PL12 according to the configuration of the beam element of the multi-axis particle beam shown in FIG. 10C, which is estimated by the deconvolution processing unit 13B. Reconstruct the two-dimensional dose distribution of the two-dimensional dose distribution and the biological dose.
- the dose distribution reconstructing unit 13 ⁇ / b> C performs the two-dimensional dose distribution of the physical dose on the second plane PL ⁇ b> 12 (the physical dose distribution at each position on the second plane PL ⁇ b> 12) and the two-dimensional biological dose on the second plane PL ⁇ b> 12.
- the dose distribution biological dose distribution at each position on the second plane PL12
- the dose distribution reconstruction unit 13C calculates the physical dose on the third plane PL13 according to the beam element configuration of the multi-axis particle beam shown in FIG. 10D, which is estimated by the deconvolution processing unit 13B. Reconstruct the two-dimensional dose distribution and the two-dimensional dose distribution of the biological dose.
- the dose distribution reconstructing unit 13 ⁇ / b> C performs the two-dimensional dose distribution of the physical dose on the third plane PL ⁇ b> 13 (the physical dose distribution at each position on the third plane PL ⁇ b> 13) and the two-dimensional dose of the biological dose on the third plane PL ⁇ b> 13.
- the dose distribution biological dose distribution at each position on the third plane PL13 is reconstructed.
- the dose distribution measuring device 1 of the third embodiment can measure the dose distribution of a plurality (arbitrary number) of planes (for example, the first plane PL11, the second plane PL12, and the third plane PL13). it can.
- the process of verification by the dose distribution measuring device 1 of the present invention in heavy ion therapy in a heavy ion therapy facility was simulated.
- the treatment was planned so as to form an extended Bragg peak with a constant biological dose of 80 mm width by dynamic range modulation.
- a slightly rounded quasi-Bragg peak beam having the physical dose distribution shown in FIG. 3, the dose response distribution of the film-type dosimeter, and the sensitivity parameter distribution was used for dynamic range modulation.
- the phantom device 11 was irradiated with the therapeutic particle beam, the signal was read by the data acquisition device 12, and the data analyzer 13 first measured (calculated) the dose response distribution of the film-type dosimeter 11A.
- the range modulation estimation by the deconvolution process the range is set at a range of 0.5 mm so as to reproduce the measured dose response distribution by a general recursive optimization method as shown in Non-Patent Document 1.
- the estimation result shown in FIG. 4 was obtained by the estimation in the first embodiment.
- the dose response distribution, the physical dose distribution, and the dose average distribution of the sensitivity parameter are reconstructed by weighted superposition of the beam elements, and the biological dose distribution is derived in accordance with the biological effect model.
- a deep dose distribution of the physical dose shown in FIG. 5A and a deep dose distribution of the biological dose shown in FIG. 5B were obtained (reconstructed).
- the measurement results and the comparison results were stored as a record of the treatment beam verification.
- the dose D M (d) of the particle beam at the water equivalent depth d is represented by the following equation (1)
- the dose D i (d) at the depth d of the beam element i constituting the particle beam is It is represented by equation (2).
- w i is the weight of beam element i
- D 0 is the “physical dose” in FIG. 3A
- si is the range shift of beam element i. .
- the relative efficiency of the dose response to a carbon ion beam is a function of the dose average LET (linear energy transfer) L.
- the “dose response” in FIG. 3A is represented by the product of the “physical dose” in FIG. 3A and the relative efficiency described above.
- the dose response F M (d) at the water equivalent depth d is represented by the following equation (4), and the dose response F i (d) at the depth d of the beam element i is represented by the following equation (5).
- F 0 is the “dose response” in FIG.
- the sensitivity parameter “ ⁇ M ” of the particle beam is represented by the following equation (6)
- the sensitivity parameter “( ⁇ M ) 1/2 ” of the particle beam is represented by the following equation (7).
- ⁇ i is the sensitivity parameter “ ⁇ ” in FIG. 3 (B)
- ( ⁇ i ) ⁇ is the sensitivity parameter “( ⁇ ) in FIG. 3 (B). 1/2 ".
- Biological dose B M indicated by a broken line in FIG. 5 (B) is represented by the following formula (8).
- Biological effect E (B), E M (i.e., the function biological effects biological dose B) is represented by the following formula (9) or the following formula (10).
- Biological effects E i of each beam element i is represented by the following formula (11).
- S (B) is the survival rate of the reference cells
- the survival rate S (B) of the reference cells is a function of the function of the biological dose B.
- Weight w i of the beam element i is also represented by the following formula (12).
- dj is the sampling depth of the expanded Bragg peak (the peak dose depth of each beam element).
- Dose response at each sampling depth d j is represented by the following formula (13).
- r Nj is a standard normal distribution random number
- ⁇ N is the relative standard uncertainty of the response measurement.
- Weight w i of the beam element i is also represented by the following formula (14).
- Dose response F R that is reconstructed is represented by the following formula (15).
- the present inventors reconstructed the physical dose distribution shown in FIG. 5A and the biological dose distribution shown in FIG. 5B by using the results described above. In addition, the present inventors compare the reconstructed physical dose distribution with the planned physical dose distribution shown by the solid line in FIG. 5 (A), and compare the reconstructed biological dose distribution with the solid line in FIG. 5 (B). Was compared with the planned biodose distribution shown in Fig.
- FIG. 11 is a diagram showing an example of a system A to which the dose distribution measuring device 1 of the first to third embodiments can be applied.
- the system A includes the dose distribution measurement device 1 of the first to third embodiments, a particle beam irradiation device A1, a storage unit A2, a treatment plan reference unit A3, and a storage unit A4. , A comparison display device A5, and a treatment plan data editing device A6.
- the particle beam irradiation device A1 irradiates the phantom device 11 of the dose distribution measuring device 1 with a therapeutic particle beam that forms an enlarged Bragg peak.
- the storage unit A2 stores a treatment plan and the like.
- the treatment plan reference unit A3 reads the treatment plan stored in the storage unit A2, and refers to the physical dose distribution and the biological dose distribution included in the treatment plan.
- the storage unit A4 stores information (data) related to beam elements as shown in FIGS. 3A and 3B. Specifically, the storage unit A4 stores the unit dose distribution as shown by the solid line in FIG. 3A, the dose response distribution as shown by the broken line in FIG. 3A, and the solid line and the broken line in FIG. And the distribution of biological effect sensitivity parameters as shown by.
- the comparison display device A5 displays the physical dose distribution, the biological dose distribution, and the like reconstructed by the dose distribution reconstruction unit 13C of the data analyzer 13 of the dose distribution measurement device 1.
- the comparison display device A5 displays a physical dose distribution, a biological dose distribution, and the like so as to be able to compare with a treatment plan.
- the dose distribution reconstruction unit 13C of the data analysis device 13 uses the weight of each of the beam elements estimated by the deconvolution processing unit 13B, and performs a simulated treatment using the phantom device 11.
- the dose distribution is calculated using the patient CT image (not shown) used in the actual treatment plan from which the plan was based, and the dose distribution of the physical dose in the patient and the dose distribution of the biological dose are reconstructed. I do.
- the comparison display device A5 compares and displays the dose distribution of the physical dose and the biological dose in the patient reconstructed by the dose distribution reconstructing unit 13C with the dose distribution of the original patient treatment plan. Further, the comparison display device A5 obtains the difference between the dose distribution of the treatment plan for each depth and the measured dose distribution, and displays the determination information as to whether the maximum value is equal to or smaller than a predetermined margin. In the method of the present specification having high measurement accuracy, the user can make a pass / fail judgment with a simple confirmation by using the auxiliary information.
- the treatment plan data editing device A6 changes the beam information of the original patient treatment plan, and then stores the changed beam information in the storage unit A2.
- the treatment plan data editing device A6 uses the respective weights of the beam elements estimated by the deconvolution processing unit 13B of the data analysis device 13.
- the treatment plan edited based on this measurement is sent to an external treatment planning device, where it is used to re-evaluate the dose distribution obtained by re-calculation on the treatment planning device and to perform pre-validation of treatment.
- the data analyzer 13 of the dose distribution measuring device 1 has a partial code of the treatment plan.
- the particle beam irradiation device A1 irradiates a therapeutic particle beam based on the treatment plan and beam information stored in the storage unit A2.
- the deconvolution processing unit 13B of the data analysis device 13 of the dose distribution measurement device 1 performs deconvolution processing based on the information stored in the storage unit A4, and configures the beam elements forming the therapeutic particle beam. , And the weight of each of the beam elements.
- the plan reference section A3 reads out the treatment plan stored in the storage section A2.
- the treatment plan reference unit A3 compares the planned biological dose distribution (solid line in FIG. 5B) with the reconstructed biological dose distribution (dashed line in FIG. 5B). Read the treatment plan stored in the storage unit A2.
- the dose distribution reconstruction unit 13C reconstructs the physical dose distribution (dashed line in FIG. 5A) and the biological dose distribution (dashed line in FIG. 5B) based on the CT image of the patient.
- the dose distribution reconstructing unit 13C may reconstruct the physical dose distribution and the biological dose distribution without being based on the CT image of the patient. It is desirable that the comparison display device A5 be electronically displayed on a display or the like, but it may be one that is printed by a printer or the like and displayed on a paper medium.
- the dose distribution measuring device 1 of the first to third embodiments may be used as an accessory device for independently verifying the quality of a therapeutic particle beam in a particle beam therapy system.
- the dose distribution measuring device 1 of the first to third embodiments is used in a particle beam therapy system in combination with a therapy device (not shown) and another measurement device (not shown).
- the whole or a part of the function of each unit included in the dose distribution measuring device 1 in the above-described embodiment is recorded on a computer-readable recording medium with a program for realizing these functions, and recorded on this recording medium.
- the program may be implemented by causing a computer system to read and execute the program.
- the “computer system” includes an OS and hardware such as peripheral devices.
- the “computer-readable recording medium” refers to a portable medium such as a flexible disk, a magneto-optical disk, a ROM, and a CD-ROM, and a storage unit such as a hard disk built in a computer system.
- a "computer-readable recording medium” refers to a communication line for transmitting a program via a network such as the Internet or a communication line such as a telephone line, and dynamically holds the program for a short time.
- a program may include a program that holds a program for a certain period of time, such as a volatile memory in a computer system serving as a server or a client in that case.
- the above-mentioned program may be for realizing a part of the above-mentioned functions, or may be for realizing the above-mentioned functions in combination with a program already recorded in a computer system.
- the dose distribution measuring apparatus of the present invention can be used to use a film type dosimeter widely used in photon beam therapy for particle beam therapy. Since the biological dose distribution to be flattened in the heavy ion beam therapy can be measured, the dose distribution measuring device of the present invention can be used for intuitive and clinical verification. Since a bioeffect model is provided in the particle beam dose distribution measurement device independently of the treatment plan, it is necessary to implement a standard biodosimeter that evaluates the difference in biodoses between heavy particle beam therapy facilities in multicenter clinical research. The dose distribution measuring device of the invention can be used.
- Dose distribution measuring device 11 ... Phantom device, 11A ... Dosimeter, 11AX ... Measurement axis, 11B ... Dosimeter, 11B-1, 11B-2, 11B-3 ... Dosimeter, 12 ... Data acquisition device, 13 ... Data analysis device, 13A: dose response distribution calculation unit, 13B: deconvolution processing unit, 13C: dose distribution reconstruction unit
Landscapes
- Health & Medical Sciences (AREA)
- Life Sciences & Earth Sciences (AREA)
- Biomedical Technology (AREA)
- General Physics & Mathematics (AREA)
- High Energy & Nuclear Physics (AREA)
- Molecular Biology (AREA)
- Spectroscopy & Molecular Physics (AREA)
- Engineering & Computer Science (AREA)
- Physics & Mathematics (AREA)
- Pathology (AREA)
- Nuclear Medicine, Radiotherapy & Molecular Imaging (AREA)
- Radiology & Medical Imaging (AREA)
- Animal Behavior & Ethology (AREA)
- General Health & Medical Sciences (AREA)
- Public Health (AREA)
- Veterinary Medicine (AREA)
- Radiation-Therapy Devices (AREA)
- Measurement Of Radiation (AREA)
Applications Claiming Priority (2)
| Application Number | Priority Date | Filing Date | Title |
|---|---|---|---|
| JP2018-177593 | 2018-09-21 | ||
| JP2018177593A JP7125109B2 (ja) | 2018-09-21 | 2018-09-21 | データ分析装置、比較表示装置、治療計画データ編集装置、線量分布測定方法、プログラムおよび線量分布測定装置 |
Publications (1)
| Publication Number | Publication Date |
|---|---|
| WO2020059364A1 true WO2020059364A1 (ja) | 2020-03-26 |
Family
ID=69886921
Family Applications (1)
| Application Number | Title | Priority Date | Filing Date |
|---|---|---|---|
| PCT/JP2019/031635 Ceased WO2020059364A1 (ja) | 2018-09-21 | 2019-08-09 | データ分析装置、比較表示装置、治療計画データ編集装置、線量分布測定方法、プログラムおよび線量分布測定装置 |
Country Status (2)
| Country | Link |
|---|---|
| JP (1) | JP7125109B2 (enExample) |
| WO (1) | WO2020059364A1 (enExample) |
Cited By (2)
| Publication number | Priority date | Publication date | Assignee | Title |
|---|---|---|---|---|
| CN111790065A (zh) * | 2020-08-11 | 2020-10-20 | 北京易康医疗科技有限公司 | 一种针对肿瘤的多线束联合放射治疗方法 |
| CN112381914A (zh) * | 2020-11-05 | 2021-02-19 | 华东师范大学 | 一种基于数据驱动的流体动画参数估计与细节增强方法 |
Families Citing this family (1)
| Publication number | Priority date | Publication date | Assignee | Title |
|---|---|---|---|---|
| CN114129912B (zh) * | 2021-11-25 | 2023-01-17 | 北京理工大学 | 一种放疗剂量验证的方法 |
Citations (6)
| Publication number | Priority date | Publication date | Assignee | Title |
|---|---|---|---|---|
| JP2007519426A (ja) * | 2003-05-23 | 2007-07-19 | ニールソン,イェルゲン | 放射線治療における治療前検証のための方法 |
| WO2009139043A1 (ja) * | 2008-05-13 | 2009-11-19 | 三菱電機株式会社 | 粒子線治療装置および粒子線治療方法 |
| US8605857B1 (en) * | 2010-12-23 | 2013-12-10 | Math Resolutions, LLC | Method and system to reconstruct treatment dose to a patient from integrated exit-transit images of radiation fields taken during treatment |
| WO2014102929A1 (ja) * | 2012-12-26 | 2014-07-03 | 三菱電機株式会社 | 線量分布測定装置 |
| WO2014196052A1 (ja) * | 2013-06-06 | 2014-12-11 | 三菱電機株式会社 | 粒子線治療装置および線量校正係数の設定方法 |
| JP2016176948A (ja) * | 2016-04-08 | 2016-10-06 | 三菱電機株式会社 | 線量分布測定装置 |
-
2018
- 2018-09-21 JP JP2018177593A patent/JP7125109B2/ja active Active
-
2019
- 2019-08-09 WO PCT/JP2019/031635 patent/WO2020059364A1/ja not_active Ceased
Patent Citations (6)
| Publication number | Priority date | Publication date | Assignee | Title |
|---|---|---|---|---|
| JP2007519426A (ja) * | 2003-05-23 | 2007-07-19 | ニールソン,イェルゲン | 放射線治療における治療前検証のための方法 |
| WO2009139043A1 (ja) * | 2008-05-13 | 2009-11-19 | 三菱電機株式会社 | 粒子線治療装置および粒子線治療方法 |
| US8605857B1 (en) * | 2010-12-23 | 2013-12-10 | Math Resolutions, LLC | Method and system to reconstruct treatment dose to a patient from integrated exit-transit images of radiation fields taken during treatment |
| WO2014102929A1 (ja) * | 2012-12-26 | 2014-07-03 | 三菱電機株式会社 | 線量分布測定装置 |
| WO2014196052A1 (ja) * | 2013-06-06 | 2014-12-11 | 三菱電機株式会社 | 粒子線治療装置および線量校正係数の設定方法 |
| JP2016176948A (ja) * | 2016-04-08 | 2016-10-06 | 三菱電機株式会社 | 線量分布測定装置 |
Cited By (2)
| Publication number | Priority date | Publication date | Assignee | Title |
|---|---|---|---|---|
| CN111790065A (zh) * | 2020-08-11 | 2020-10-20 | 北京易康医疗科技有限公司 | 一种针对肿瘤的多线束联合放射治疗方法 |
| CN112381914A (zh) * | 2020-11-05 | 2021-02-19 | 华东师范大学 | 一种基于数据驱动的流体动画参数估计与细节增强方法 |
Also Published As
| Publication number | Publication date |
|---|---|
| JP7125109B2 (ja) | 2022-08-24 |
| JP2020044286A (ja) | 2020-03-26 |
Similar Documents
| Publication | Publication Date | Title |
|---|---|---|
| Park et al. | Fast compressed sensing‐based CBCT reconstruction using Barzilai‐Borwein formulation for application to on‐line IGRT | |
| Testa et al. | Proton radiography and proton computed tomography based on time-resolved dose measurements | |
| Parodi et al. | PET/CT imaging for treatment verification after proton therapy: a study with plastic phantoms and metallic implants | |
| Sportelli et al. | First full-beam PET acquisitions in proton therapy with a modular dual-head dedicated system | |
| CN105854191B (zh) | 一种放射治疗中三维剂量验证系统及验证方法 | |
| US8515011B2 (en) | System and method for dose verification radiotherapy | |
| CN111569279B (zh) | 质子治疗的参数监测装置及系统 | |
| Solevi et al. | Performance of MACACO Compton telescope for ion-beam therapy monitoring: first test with proton beams | |
| CN110179486B (zh) | 多能量ct成像系统及其应用 | |
| WO2014179430A2 (en) | System design and method for verifying 3d dosimetric imaging of charged particles in media | |
| Alsanea et al. | Feasibility of RACT for 3D dose measurement and range verification in a water phantom | |
| CN106061554A (zh) | 用于患者专用放疗的治疗验证和质量保障的系统和方法 | |
| Gillam et al. | Monte-Carlo simulations and image reconstruction for novel imaging scenarios in emission tomography | |
| US20180140265A1 (en) | Radiation therapy system and methods of use thereof | |
| Camarlinghi et al. | An in-beam PET system for monitoring ion-beam therapy: test on phantoms using clinical 62 MeV protons | |
| Goulet et al. | High resolution 2D dose measurement device based on a few long scintillating fibers and tomographic reconstruction a | |
| JP7125109B2 (ja) | データ分析装置、比較表示装置、治療計画データ編集装置、線量分布測定方法、プログラムおよび線量分布測定装置 | |
| Yabe et al. | Deep learning-based in vivo dose verification from proton-induced secondary-electron-bremsstrahlung images with various count level | |
| Darne et al. | A proton imaging system using a volumetric liquid scintillator: a preliminary study | |
| CN111991711A (zh) | 质子治疗的参数监测装置及系统 | |
| Parodi et al. | 4D in‐beam positron emission tomography for verification of motion‐compensated ion beam therapy | |
| Onecha et al. | Real-time dose reconstruction in proton therapy from in-beam PET measurements | |
| Papanicolas et al. | A novel analysis method for emission tomography | |
| Elston et al. | ASIM: An analytic PET simulator | |
| Monajemi et al. | A bench‐top megavoltage fan‐beam CT using‐photodiode detectors. II. Image performance evaluation |
Legal Events
| Date | Code | Title | Description |
|---|---|---|---|
| 121 | Ep: the epo has been informed by wipo that ep was designated in this application |
Ref document number: 19862839 Country of ref document: EP Kind code of ref document: A1 |
|
| NENP | Non-entry into the national phase |
Ref country code: DE |
|
| 122 | Ep: pct application non-entry in european phase |
Ref document number: 19862839 Country of ref document: EP Kind code of ref document: A1 |