WO2020045093A1 - 強化ガラスの応力分布の取得方法、強化ガラスの製造方法 - Google Patents
強化ガラスの応力分布の取得方法、強化ガラスの製造方法 Download PDFInfo
- Publication number
- WO2020045093A1 WO2020045093A1 PCT/JP2019/031953 JP2019031953W WO2020045093A1 WO 2020045093 A1 WO2020045093 A1 WO 2020045093A1 JP 2019031953 W JP2019031953 W JP 2019031953W WO 2020045093 A1 WO2020045093 A1 WO 2020045093A1
- Authority
- WO
- WIPO (PCT)
- Prior art keywords
- stress distribution
- tempered glass
- glass
- stress
- tempered
- Prior art date
- Legal status (The legal status is an assumption and is not a legal conclusion. Google has not performed a legal analysis and makes no representation as to the accuracy of the status listed.)
- Ceased
Links
Images


Classifications
-
- G—PHYSICS
- G01—MEASURING; TESTING
- G01L—MEASURING FORCE, STRESS, TORQUE, WORK, MECHANICAL POWER, MECHANICAL EFFICIENCY, OR FLUID PRESSURE
- G01L1/00—Measuring force or stress, in general
- G01L1/24—Measuring force or stress, in general by measuring variations of optical properties of material when it is stressed, e.g. by photoelastic stress analysis using infrared, visible light, ultraviolet
- G01L1/241—Measuring force or stress, in general by measuring variations of optical properties of material when it is stressed, e.g. by photoelastic stress analysis using infrared, visible light, ultraviolet by photoelastic stress analysis
-
- C—CHEMISTRY; METALLURGY
- C03—GLASS; MINERAL OR SLAG WOOL
- C03C—CHEMICAL COMPOSITION OF GLASSES, GLAZES OR VITREOUS ENAMELS; SURFACE TREATMENT OF GLASS; SURFACE TREATMENT OF FIBRES OR FILAMENTS MADE FROM GLASS, MINERALS OR SLAGS; JOINING GLASS TO GLASS OR OTHER MATERIALS
- C03C21/00—Treatment of glass, not in the form of fibres or filaments, by diffusing ions or metals in the surface
-
- G—PHYSICS
- G01—MEASURING; TESTING
- G01L—MEASURING FORCE, STRESS, TORQUE, WORK, MECHANICAL POWER, MECHANICAL EFFICIENCY, OR FLUID PRESSURE
- G01L1/00—Measuring force or stress, in general
-
- G—PHYSICS
- G01—MEASURING; TESTING
- G01L—MEASURING FORCE, STRESS, TORQUE, WORK, MECHANICAL POWER, MECHANICAL EFFICIENCY, OR FLUID PRESSURE
- G01L1/00—Measuring force or stress, in general
- G01L1/24—Measuring force or stress, in general by measuring variations of optical properties of material when it is stressed, e.g. by photoelastic stress analysis using infrared, visible light, ultraviolet
Definitions
- the present invention relates to a method for obtaining a stress distribution of a tempered glass and a method for manufacturing a tempered glass.
- glass may be used for the display unit and the housing body.
- a so-called tempered glass having a surface layer (ion exchange layer) formed by ion exchange on the glass surface is used.
- aluminosilicate glass containing lithium has been widely used.
- chemically strengthened glass in which both ion exchange of lithium ion in glass and sodium ion in molten salt and ion exchange of sodium ion in glass and potassium ion in molten salt are performed. It has been known.
- the stress distribution of the tempered glass containing lithium and having undergone two types of ion exchange shows a characteristic of bending at a predetermined glass depth (DOL_TP).
- the refractive index distribution shows characteristics as shown in FIG.
- the stress distribution on the glass surface layer side than DOL_TP is measured, and the stress distribution on the glass deep layer side from DOL_TP is determined in advance by the stress distribution of the tempered glass manufactured under the same tempering conditions. It was measured and calculated based on the results of the previous measurement. This eliminates the need to measure the stress distribution on the glass deeper side than DOL_TP in the tempered glass manufacturing process, thereby shortening the measurement time.
- the present invention has been made in view of the above points, and has as its object to improve the accuracy of calculating the stress distribution on the glass deeper side than DOL_TP in tempered glass.
- the method for obtaining the stress distribution of the present tempered glass is as a preliminary preparation, measuring the stress distribution for a plurality of tempered glasses including tempered glass having different tempering conditions, and measuring the stress distribution on the glass surface layer side more than the glass depth at the bending position.
- the relationship between the first stress distribution and the second stress distribution is determined based on the measurement result of the first stress distribution and the measurement result of the second stress distribution on the glass deeper side than the glass depth.
- Deriving the parameters shown, and using the parameters to determine the stress distribution of the tempered glass to be measured, comprising the step of obtaining the stress distribution, the step of obtaining the stressed glass for the tempered glass to be measured
- the method includes a step of measuring a first stress distribution and a step of calculating the second stress distribution based on the parameter.
- the accuracy of calculating the stress distribution on the deeper side of the glass than DOL_TP can be improved.
- FIG. 1 is a diagram illustrating a stress distribution in the depth direction of the tempered glass.
- CS2 is a stress value at the outermost surface
- CS_TP is a stress value at a position where the stress distribution is bent
- CT is a stress value at the deepest portion of the glass (that is, the center portion in the plate thickness direction).
- DOL_TP is the glass depth where the stress distribution is bent
- DOL_zero is the glass depth where the stress value becomes zero
- DOL_tail is the glass depth where the stress value becomes the same value as CT.
- the stress distribution on the glass surface side from DOL_TP is referred to as a first stress distribution
- the stress distribution on the glass depth side from DOL_TP is referred to as a second stress distribution.
- the first stress distribution can be measured by photoelasticity techniques, for example, by propagating light along the glass surface using the optical waveguide effect.
- two types of light components P-polarized light and S-polarized light
- the two types of bright line arrays are imaged by an image sensor such as a CCD (Charge Coupled Device), and the positions of at least two or more bright lines in each of the two types of bright line arrays are used to form tempered glass corresponding to two types of light components.
- the refractive index distribution from the surface to the depth direction is calculated.
- the first stress distribution from the surface of the tempered glass to the depth direction can be calculated based on the difference between the refractive index distributions of the two types of light components and the photoelastic constant of the glass.
- the first stress distribution can be measured, for example, using a glass surface stress meter FSM-6000LE manufactured by Orihara Seisakusho.
- the first stress distribution may be measured by any method other than the above, for example, by the well-known inverse @ WKB method (for example, see US Pat. No. 9,140,543).
- the measurement using the optical waveguide effect can measure only a portion where the refractive index decreases from the glass surface toward the glass deep layer. Therefore, this method can be used only for the measurement of the first stress distribution.
- the second stress distribution can be measured, for example, using the principle of photoelastic stress measurement using the polarization phase difference of laser light and scattered light.
- the polarization phase difference of the laser light is changed by one or more wavelengths with respect to the wavelength of the laser light, and the scattered light emitted when the laser light having the changed polarization
- a plurality of images are taken at time intervals to obtain a plurality of images.
- a periodic luminance change of the scattered light is measured using the plurality of acquired images, a phase change of the luminance change is calculated, and a second stress distribution can be calculated based on the phase change.
- the second stress distribution can be measured using, for example, a scattered light photoelastic stress meter SLP-1000 manufactured by Orihara Seisakusho.
- the second stress distribution may be measured by any method other than the above.
- the second stress distribution is obtained by using, for example, a scattered light photoelastic stress meter SLP-2000 or SCALP-04 or SCALP-05 manufactured by Orihara Seisakusho, or a birefringence imaging device abrio manufactured by CRi, USA. It may be measured.
- the reflected light and scattered light on the glass surface overlap with the scattered light from inside the glass and interfere with the measurement, and the measurement accuracy near the glass surface is low. Therefore, this method can be used only for measuring the second stress distribution.
- the manufacturing process of the tempered glass may include a step of measuring the first stress distribution and the second stress distribution, and making a shipping judgment based on the first stress distribution and the second stress distribution.
- the measurement time becomes longer and the productivity is reduced.
- the first stress distribution and the second stress distribution are each measured in advance by an appropriate measurement method, and a database is created.
- a parameter indicating the relationship between the stress distribution and the second stress distribution is derived.
- the first stress distribution is measured, and the second stress distribution is calculated based on parameters derived in advance. This will be described in detail below with reference to FIG.
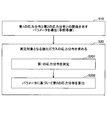
- FIG. 2 is an example of a flowchart showing a method for obtaining a stress distribution of a tempered glass.
- Step S10 in FIG. 2 is a preparatory process performed independently of the tempered glass manufacturing process.
- step S10 first, a stress distribution is measured for a plurality of tempered glasses including tempered glasses having different tempering conditions. Specifically, for example, the first stress distribution is measured using FSM-6000LE, and the second stress distribution is measured using SLP-1000. Then, a parameter indicating the relationship between the first stress distribution and the second stress distribution is derived based on the measurement result of the first stress distribution and the measurement result of the second stress distribution.
- the first stress distribution can be represented, for example, by ⁇ 1 (x, Bn).
- x indicates the position of the tempered glass in the depth direction
- Bn indicates fitting parameters.
- Bn may be plural.
- the first stress distribution can be, for example, linearly approximated.
- the first stress distribution is represented by ⁇ 1 (x, x), where CS2 is the stress value on the outermost surface and a is the gradient of the stress on the tempered glass surface.
- Bn) CS2 + ax (fitting).
- the first stress distribution may be expressed by any fitting function as long as the first stress distribution is a first-order function or more and two or more parameters are used.
- the second stress distribution can be represented, for example, as ⁇ 2 (x, Cm, CT).
- x indicates a position in the depth direction of the tempered glass
- Cm indicates a parameter derived in step S10.
- the parameter Cm may be plural (C1, C2,).
- the parameter Cm can be derived, for example, for each sheet thickness of tempered glass. Alternatively, the thickness of the tempered glass may be included in the parameter.
- a correlation diagram between CS2 and Cm and a correlation diagram between a and Cm can be obtained based on the measurement result of the first stress distribution and the measurement result of the second stress distribution.
- the relationship between CS2 and a and Cm can be derived.
- Cm can be represented by a linear function of CS2 and a.
- Cm may be represented by a quadratic or higher function of CS2 and a. That is, Cm can be a function of first order or higher of Bn.
- step S20 the stress distribution of the tempered glass to be measured is determined.
- Step S20 can be included in a tempered glass manufacturing process.
- Step S20 includes a step S201 of measuring a first stress distribution for the tempered glass to be measured and a step S202 of calculating a second stress distribution based on the parameter Cm derived in step S10.
- step S201 the first stress distribution of the tempered glass to be measured is measured using, for example, FSM-6000LE.
- CS2 and a can be obtained by FSM-6000LE.
- step S202 the second stress distribution is calculated (the second stress distribution is not measured).
- the second stress distribution is represented by ⁇ 2 (x, Cm, CT)
- Cm is a first-order function of CS2 and a, but since CS2 and a are known in step S201, Cm is also known.
- the second stress distribution can be calculated by obtaining CT in step S202.
- the first stress distribution and the second stress distribution are determined based on the stress distribution measurement results for a plurality of tempered glasses including tempered glasses having different tempering conditions. Derive a parameter indicating the relationship. Then, a second stress distribution is calculated based on the derived parameters.
- step S10 shown in FIG. 2 will be described.
- a 0.7 mm-thick lithium-containing aluminosilicate glass was chemically strengthened under the four tempering conditions (conditions 1 to 4) shown in Table 1 to produce a tempered glass.
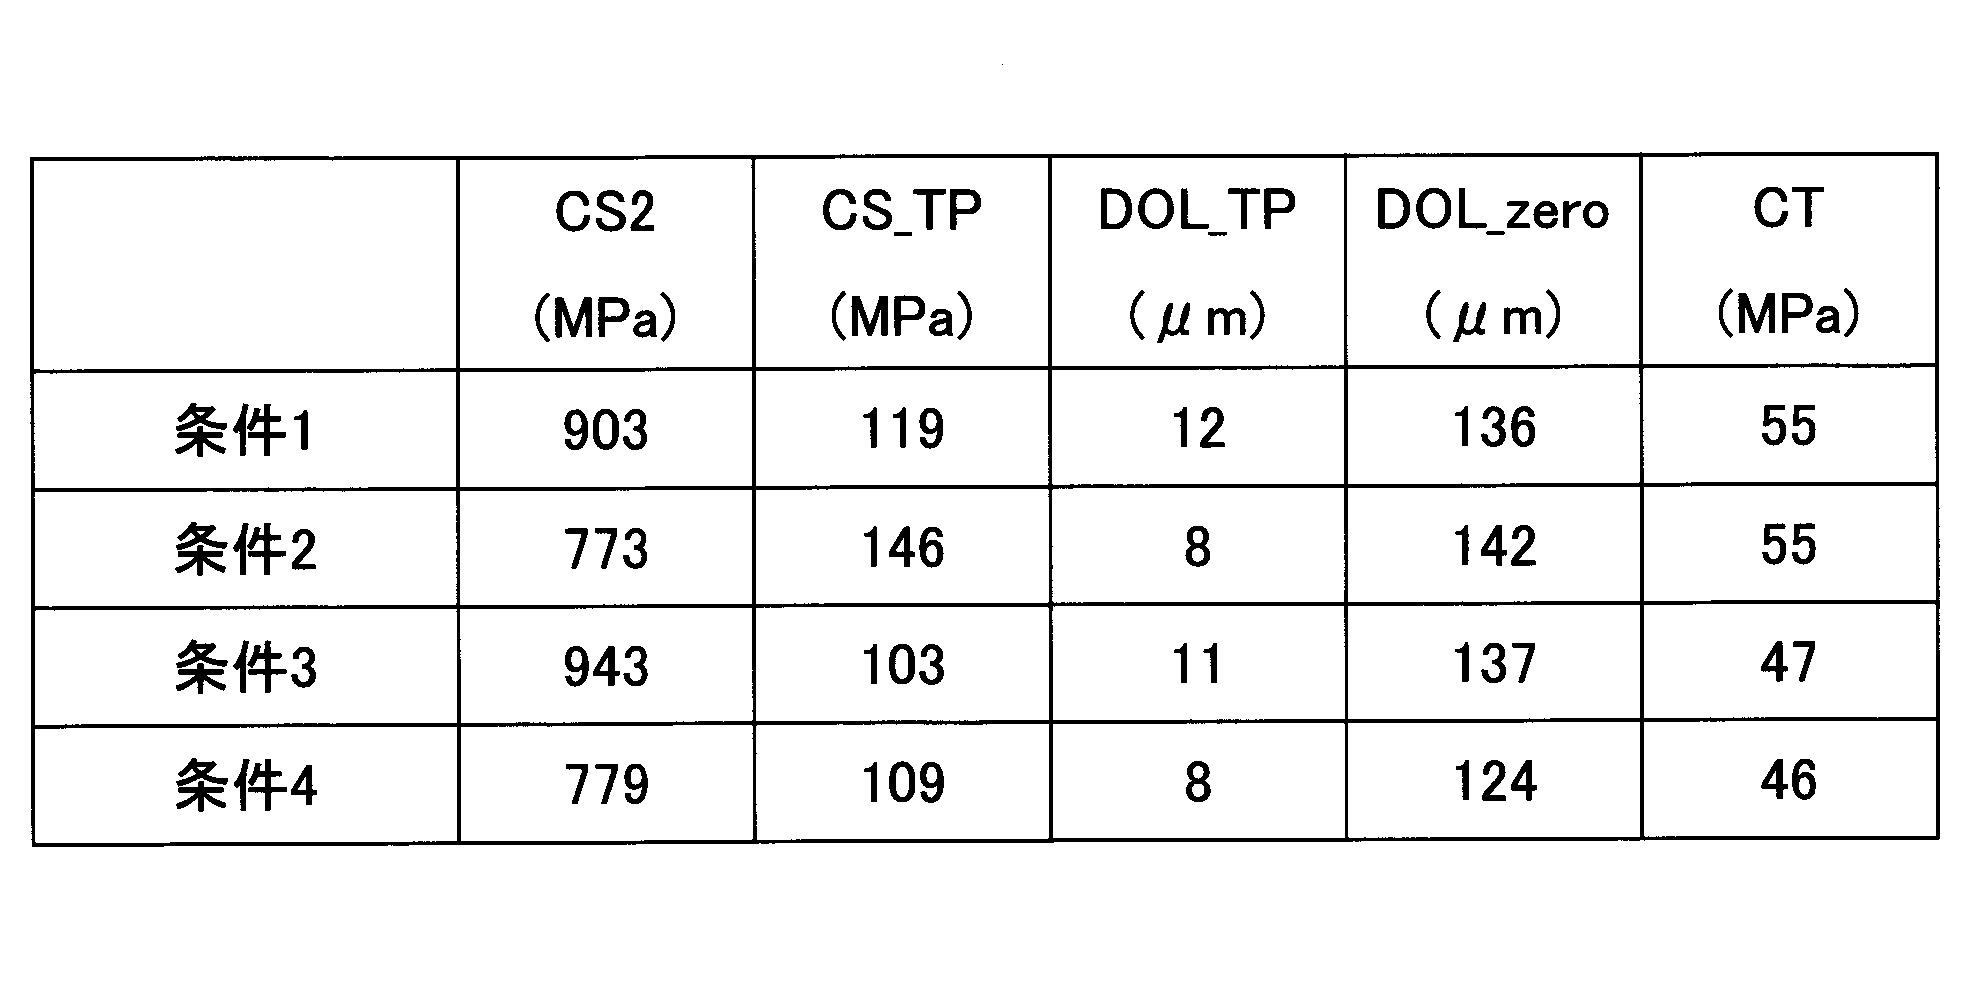
- the first stress distribution was measured by FSM-6000LE (manufactured by Orihara Seisakusho, hereinafter referred to as FSM), and the second stress distribution was measured by SLP-1000 (manufactured by Orihara Seisakusho, hereinafter SLP). 1) to obtain the characteristic values of the stress distribution shown in FIG. Table 2 shows the obtained characteristic values.
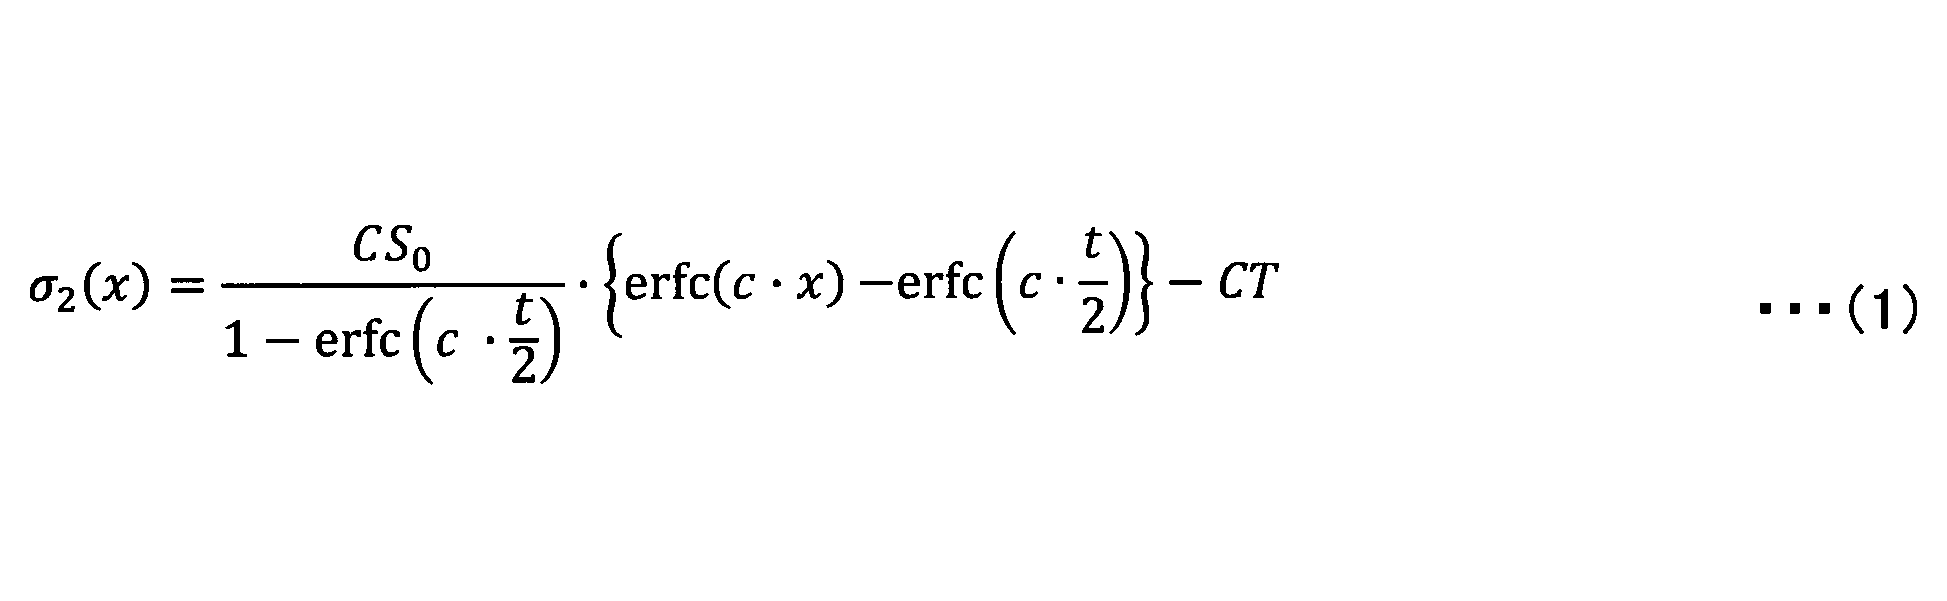
- the second stress distribution measured by the SLP is obtained by fitting the equation (1) to the measurement result. Therefore, for comparison, the measurement results (second stress distribution) by SLP of the four tempered glasses chemically strengthened under the conditions 1 to 4 were fitted by the equation (1) to obtain the average parameters CS0 and c ( Comparative Example in Table 3).
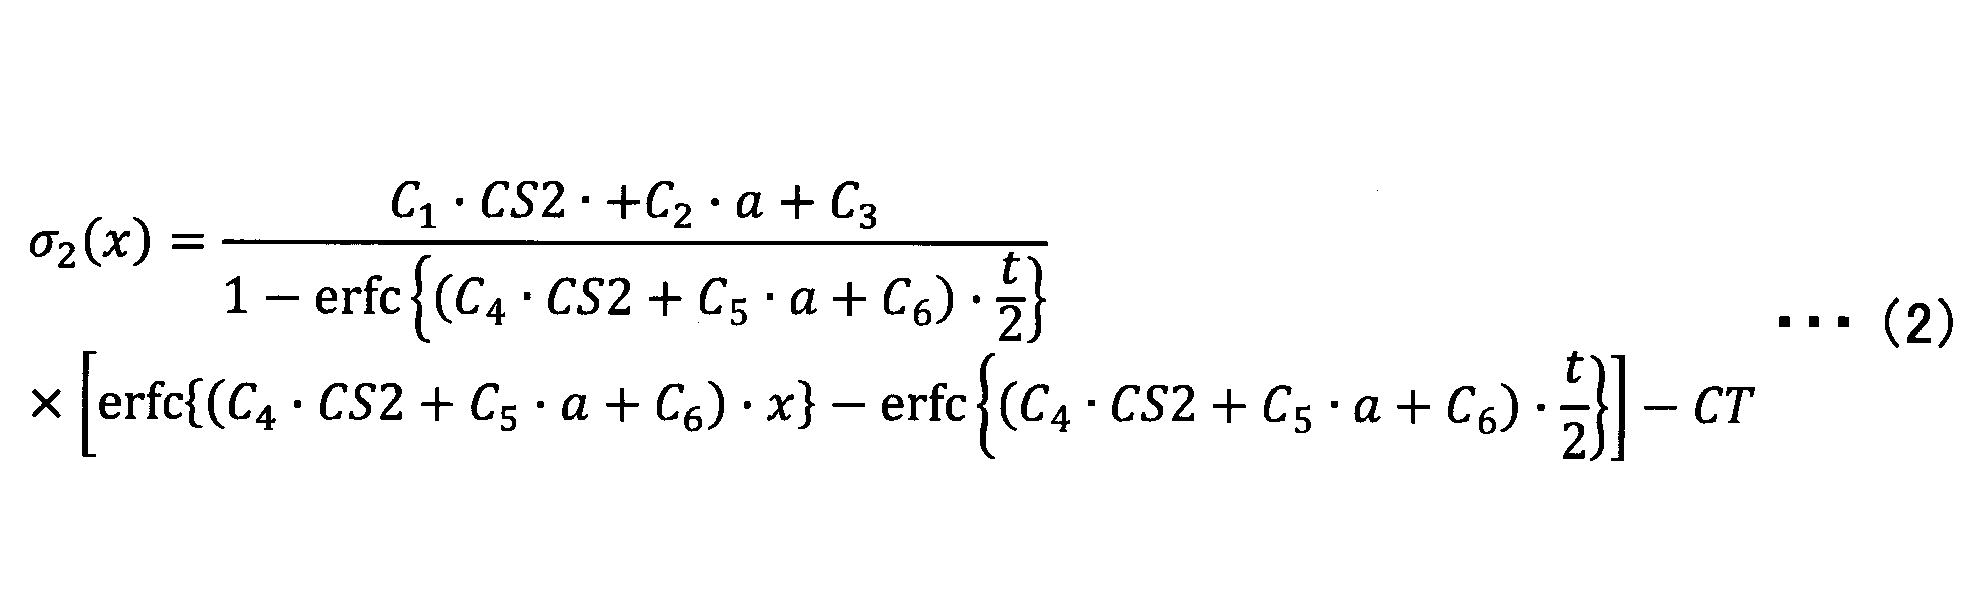
- the measurement results (second stress distribution) of the four tempered glasses chemically strengthened under the conditions 1 to 4 by SLP were fitted by the equation (2) to obtain the parameters C 1 to C 6 .
- the slope a of the stress may be obtained by dividing the CS value measured by the FSM and the DOL.
- the fitting may be determined by a least square method or the like so that an error is minimized.
- step S20 in FIG. 2 will be described.
- Eight types of samples in which the concentration of the reinforcing salt was changed were prepared, and the first stress distribution was measured by FSM.
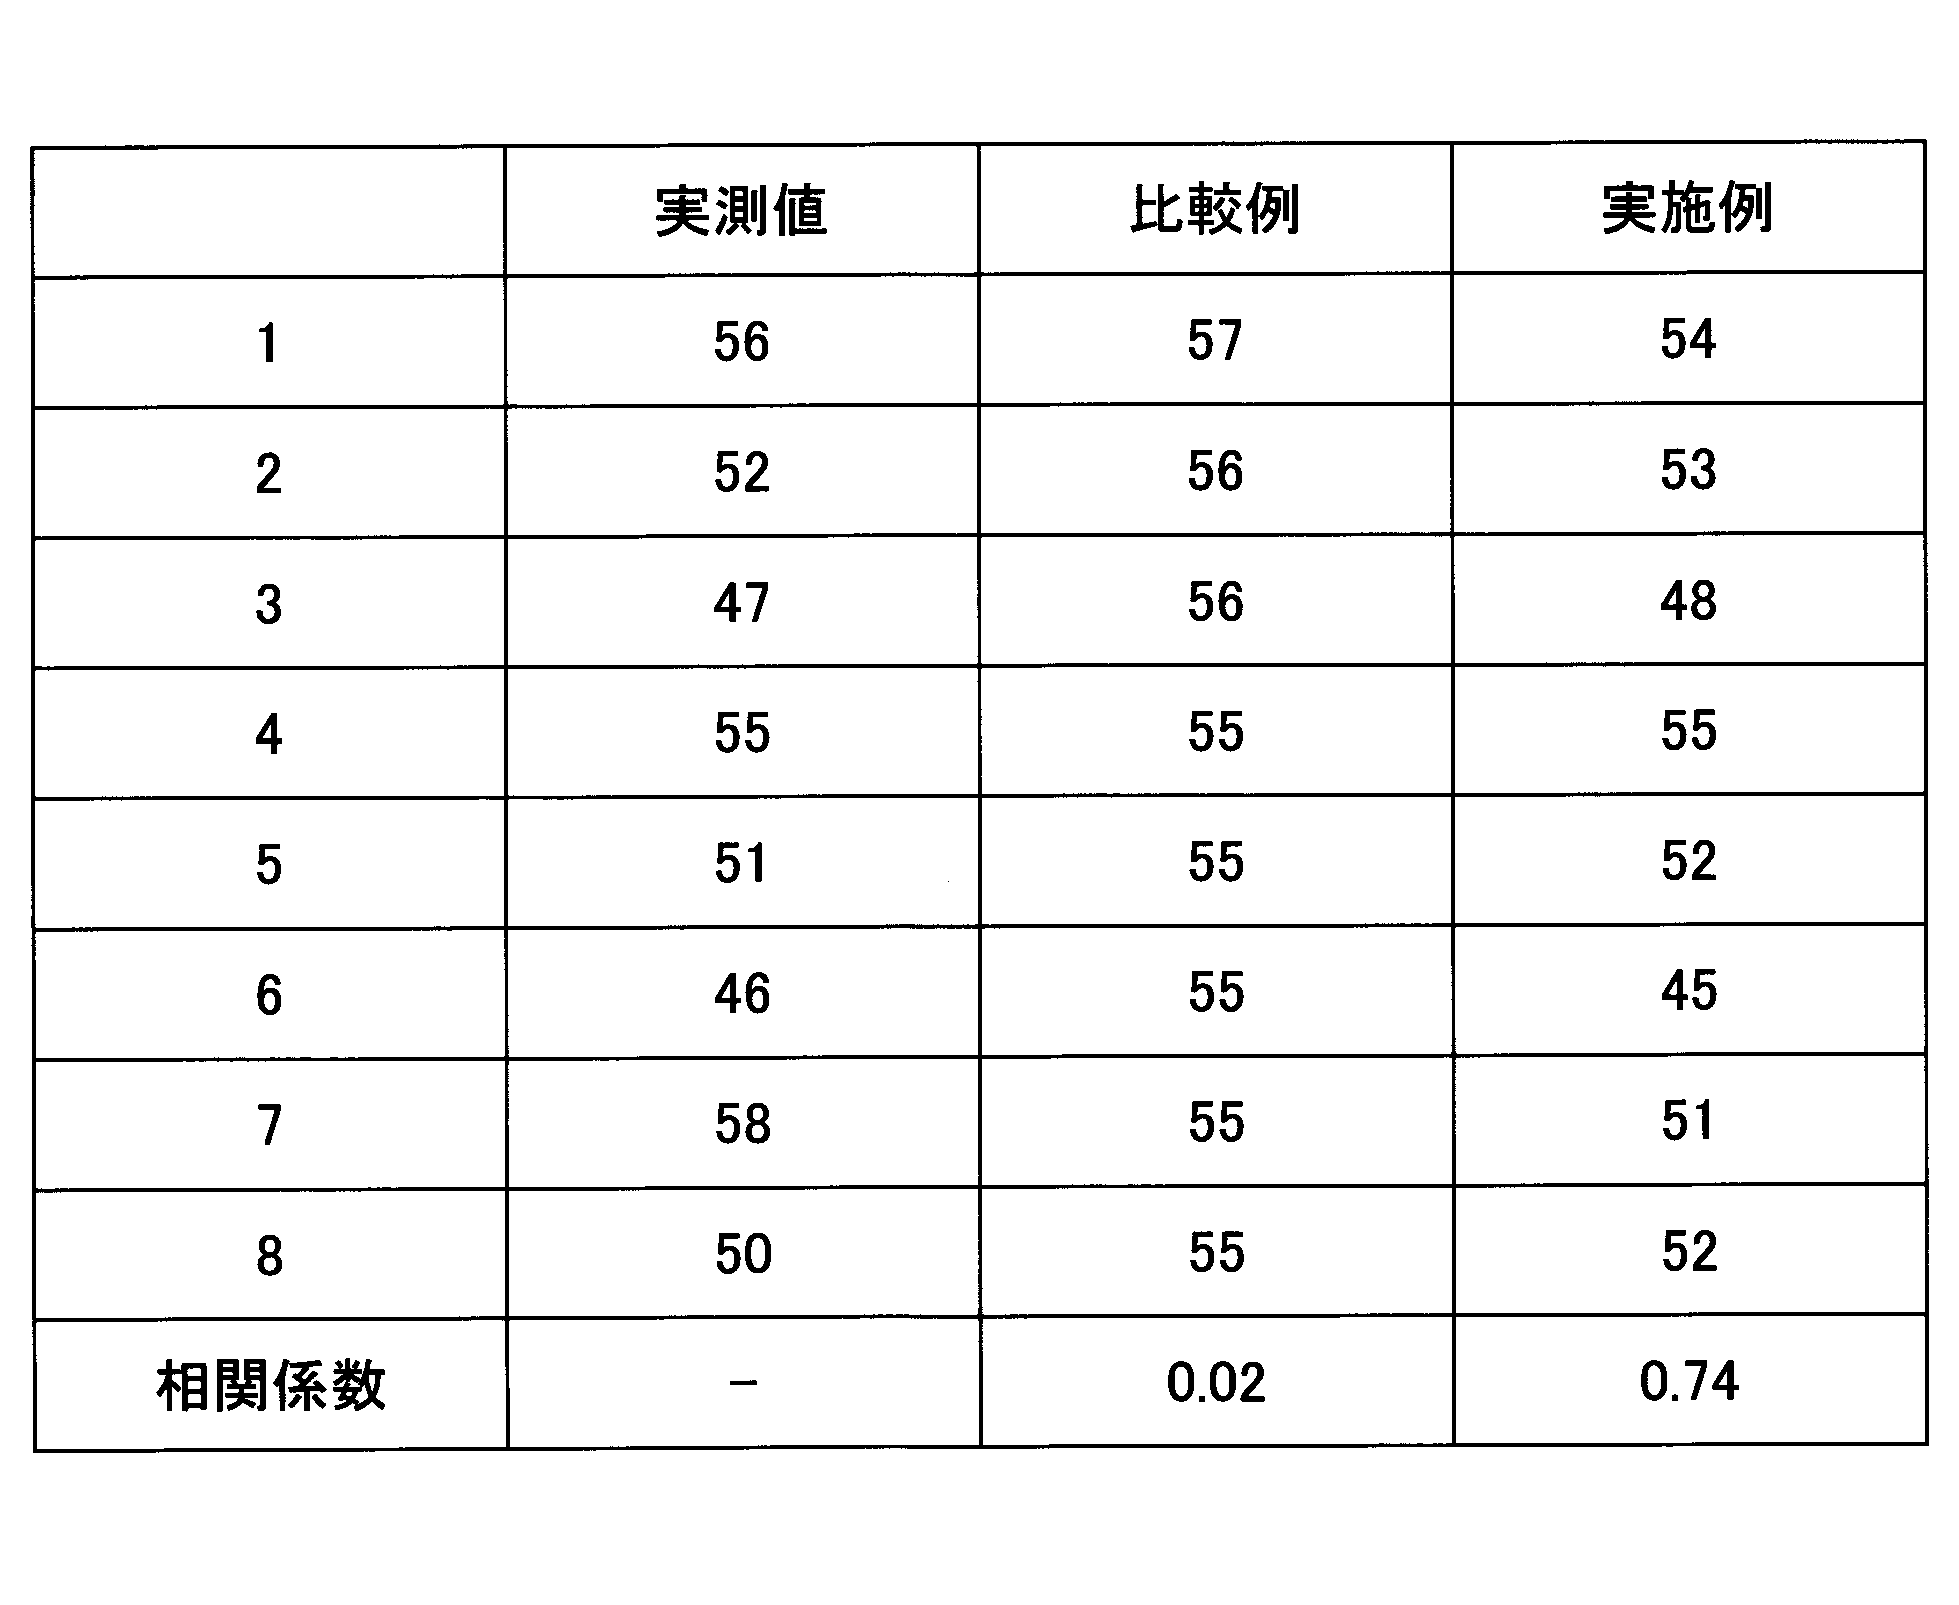
- CT was obtained from the result of the first stress distribution measured by the FSM and the second stress distribution derived from the parameters of the comparative example in Table 3 (Comparative Example in Table 4).
- CT was obtained from the result of the first stress distribution measured by the FSM and the second stress distribution derived from the parameters of the example of Table 3 (Example of Table 4).
- CT was actually measured by SLP, and the results are shown in Table 4 together with the CTs obtained in Comparative Examples and Examples.
- Table 4 shows the correlation coefficient between the actually measured value and the comparative example, and the correlation coefficient between the actually measured value and the example.
- the FSM measurement values for the tempered glass having different tempering conditions are included in the fitting function ⁇ 2 as a part of the parameters, so that the second stress distribution can be accurately calculated even if the tempered glass to be measured changes. Become.
- step S10 the concentration of the strengthening salt is changed as an example of the change of the strengthening conditions of the strengthened glass, but the thickness of the glass, the strengthening temperature and the strengthening time may be changed, and there is no limitation on the changing conditions.
- the concentration of the strengthening salt may be added to the molten salt which increases or decreases when a new tempered glass is strengthened many times.
- a mixed salt of KNO 3 , NaNO 3 , and LiNO 3 was used in the second chemical strengthening.
- a mixture of three kinds of KNO 3 , NaNO 3 , and LiNO 3 may be used.
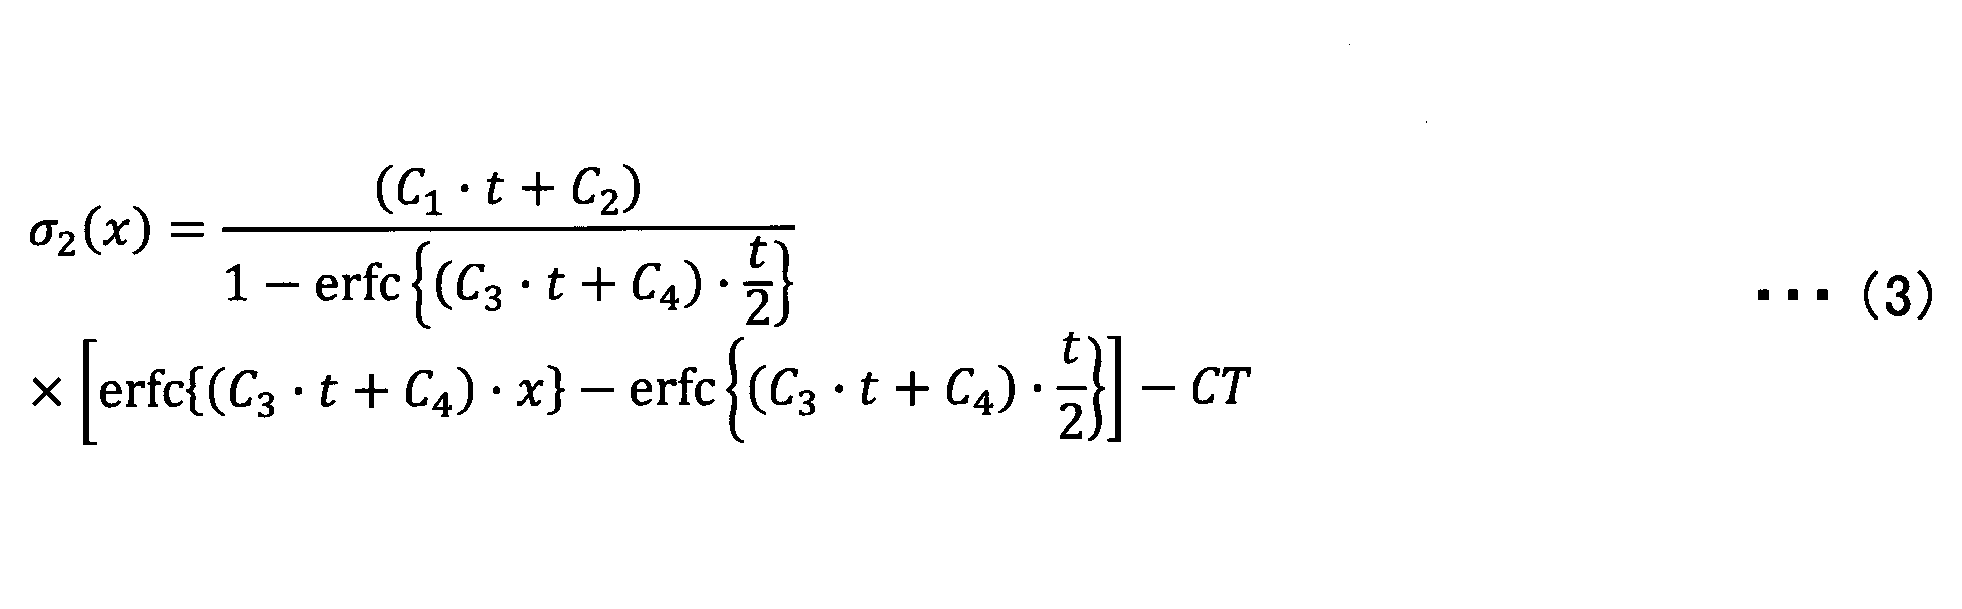
- Cm can be a function of the first order or more of the thickness, and for example, the second stress distribution may be fitted by Expression (3).
- the plate thickness may be measured simultaneously with the stress measurement in step S20.
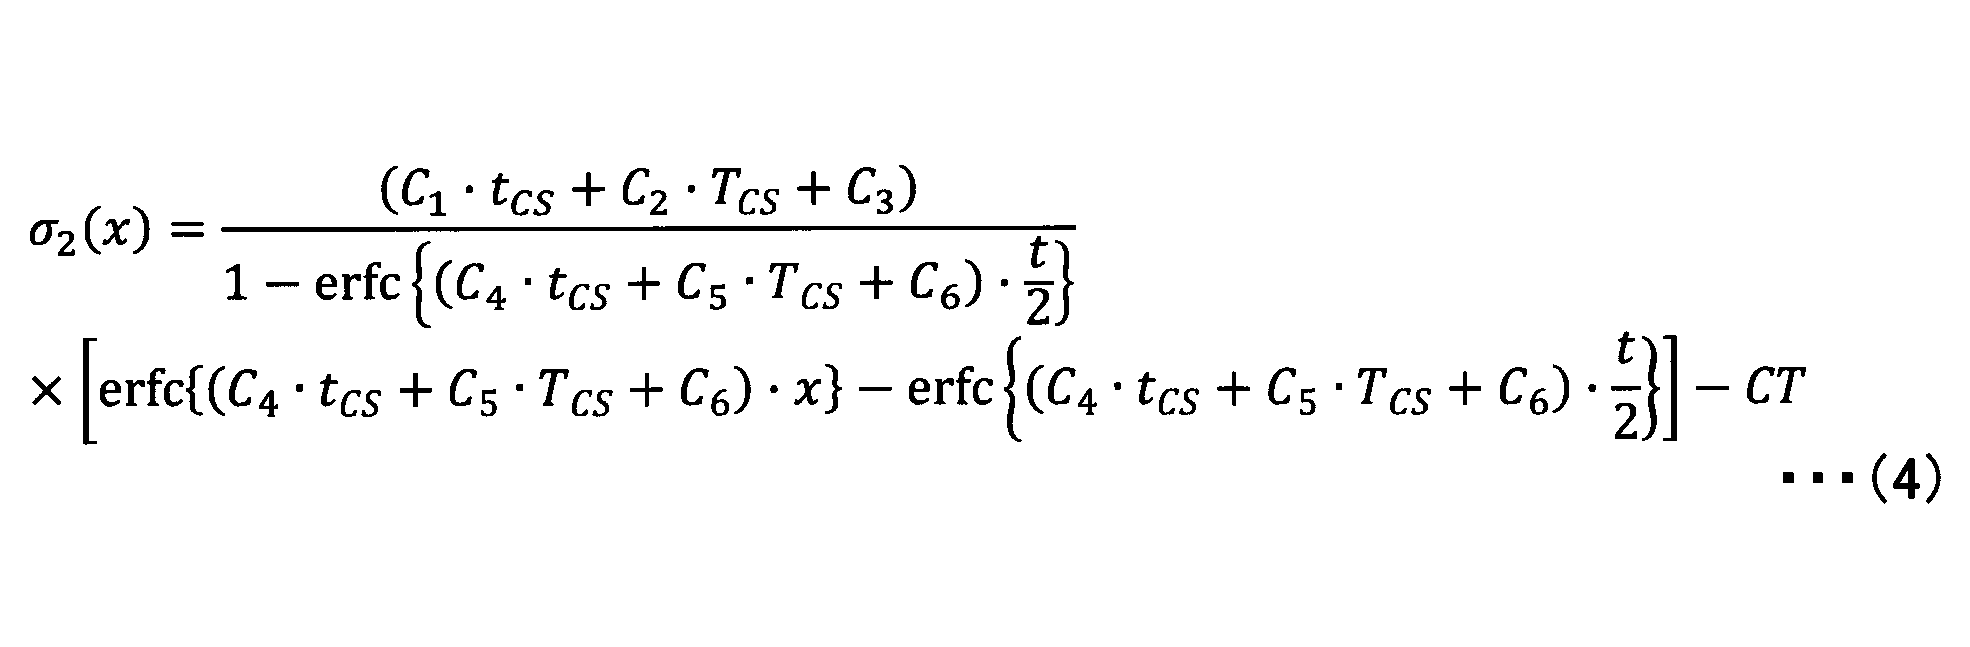
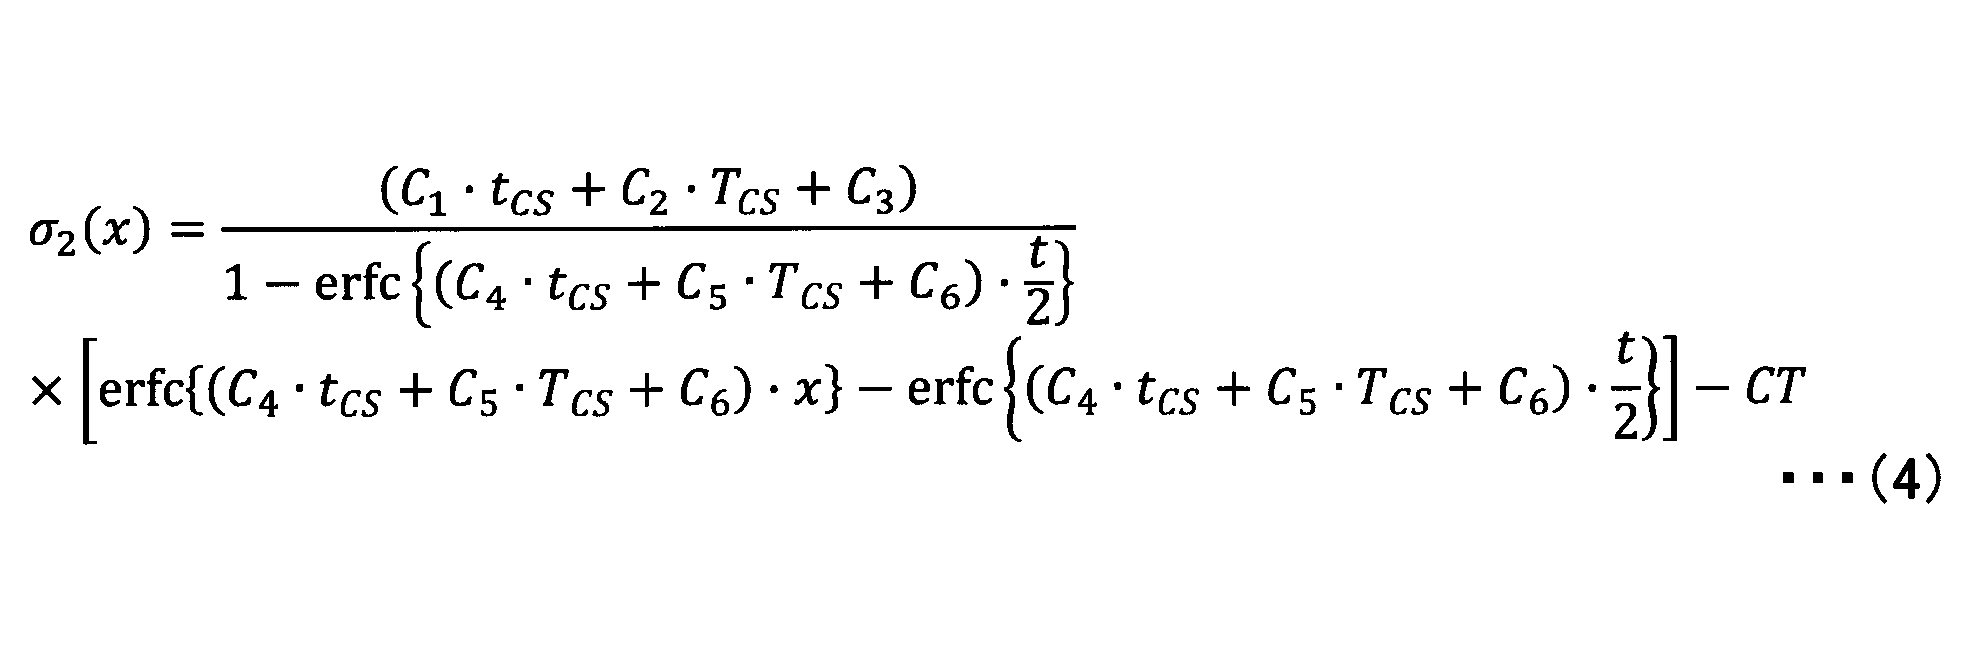
- Cm can be a function of the first order or more of the strengthening time t CS and the strengthening time T CS .
- the second stress distribution is expressed by Equation (4). May be fitted.
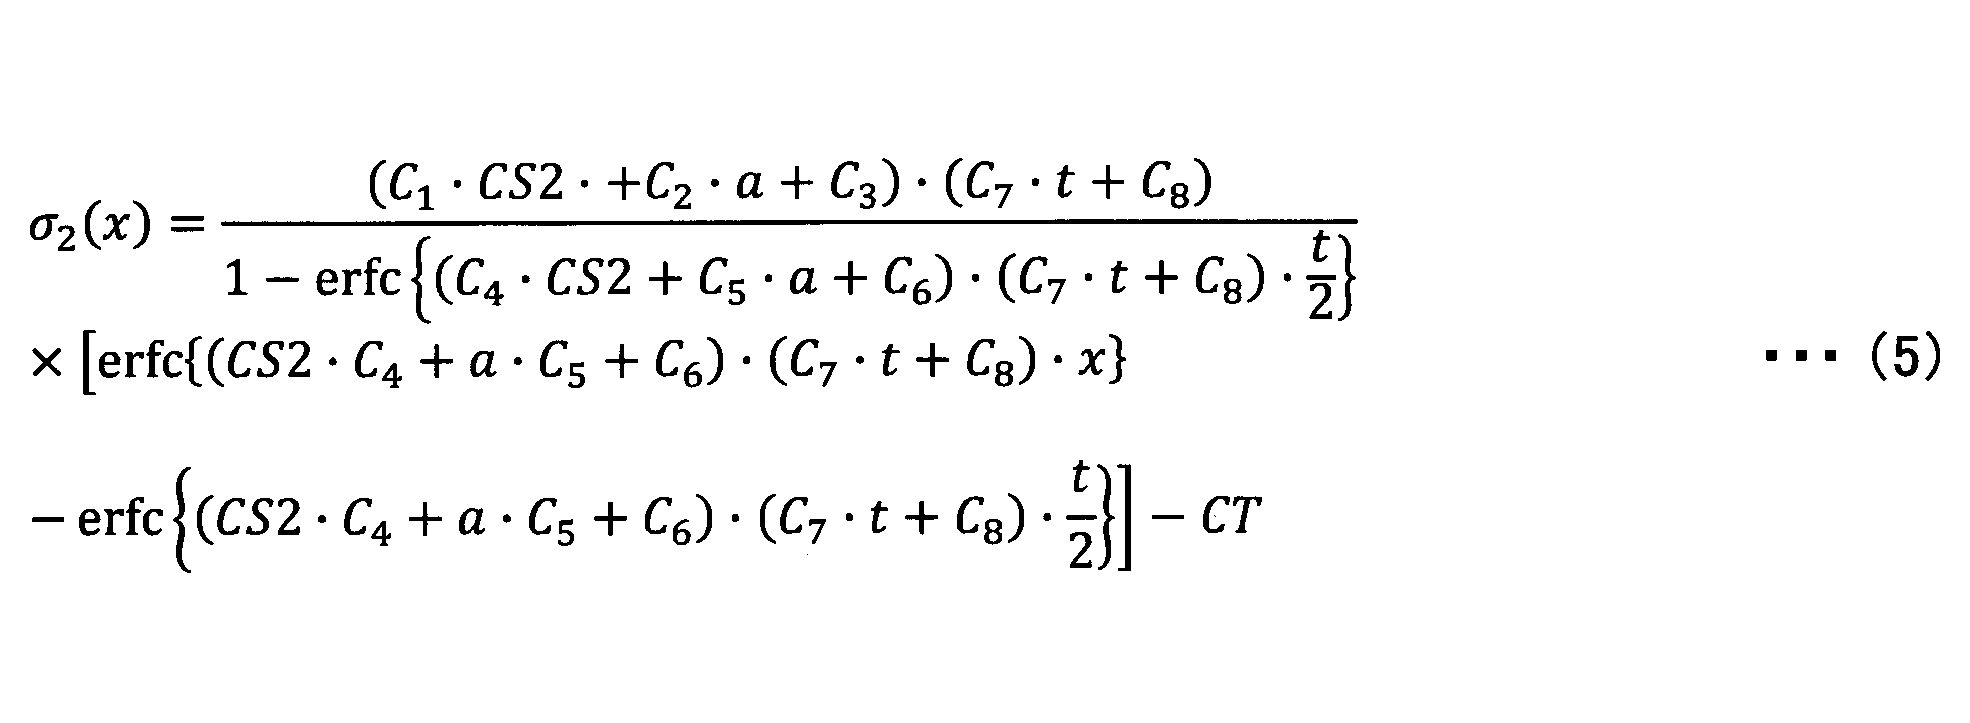
- the second stress distribution may be fitted by equation (5).
- the plate thickness may be measured simultaneously with the stress measurement in step S20.
- the second stress distribution may be fitted by equation (6).
- the plate thickness may be measured simultaneously with the stress measurement in step S10 and / or S20.
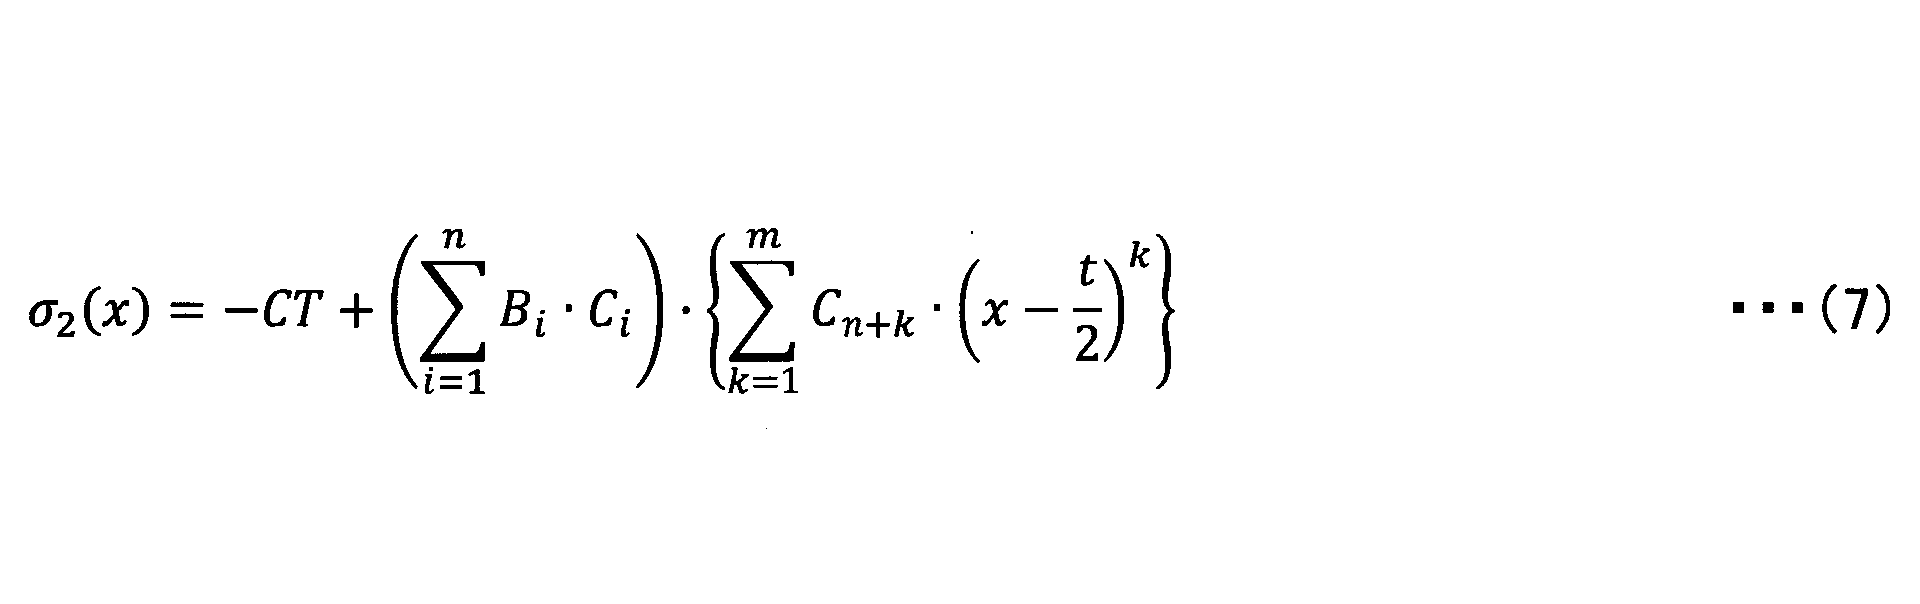
- the second stress distribution may be fitted with equation (7).
- the refractive index or the refractive index distribution of the tempered glass may be measured at the time of the first stress measurement, and the characteristic value may be used as a function of Cm.
- the characteristic value for example, the surface layer refractive index, the deepest part refractive index, the minimum value of the refractive index, and the maximum value / minimum value of the change rate of the refractive index change of the tempered glass can be used.
- Cm can be a function of the first order or higher of the surface layer refractive index or the deepest part refractive index of the tempered glass.
Landscapes
- Chemical & Material Sciences (AREA)
- Physics & Mathematics (AREA)
- General Physics & Mathematics (AREA)
- Life Sciences & Earth Sciences (AREA)
- Engineering & Computer Science (AREA)
- Chemical Kinetics & Catalysis (AREA)
- General Chemical & Material Sciences (AREA)
- Geochemistry & Mineralogy (AREA)
- Materials Engineering (AREA)
- Organic Chemistry (AREA)
- Surface Treatment Of Glass (AREA)
- Investigating Strength Of Materials By Application Of Mechanical Stress (AREA)
Abstract
本強化ガラスの応力分布の取得方法は、事前準備として、強化条件の異なる強化ガラスを含む複数の強化ガラスについて応力分布を測定し、前記応力分布が屈曲する位置のガラス深さよりもガラス表層側の第1の応力分布の測定結果と、前記ガラス深さよりもガラス深層側の第2の応力分布の測定結果と、に基づいて、前記第1の応力分布と前記第2の応力分布との関係を示すパラメータを導出するステップと、前記パラメータを利用して、測定対象となる強化ガラスの応力分布を求めるステップと、を有し、前記応力分布を求めるステップは、測定対象となる前記強化ガラスについて前記第1の応力分布を測定するステップと、前記パラメータに基づいて前記第2の応力分布を算出するステップと、を含む。
Description
本発明は、強化ガラスの応力分布の取得方法、強化ガラスの製造方法に関する。
携帯電話やスマートフォン等の電子機器において、表示部や、筐体本体にガラスが用いられる場合がある。この場合、ガラスの強度を上げるために、例えば、ガラス表面にイオン交換による表面層(イオン交換層)を形成した、所謂強化ガラスが使用される。
近年は、リチウムを含有するアルミノシリケートガラスが広く用いられている。又、リチウムを含有するアルミノシリケートガラスにおいて、ガラス中のリチウムイオンと溶融塩中のナトリウムイオンのイオン交換と、ガラス中のナトリウムイオンと溶融塩中のカリウムイオンのイオン交換を両方行った化学強化ガラスが知られている。
リチウムを含み、2種類のイオン交換がなされた強化ガラスの応力分布は、所定のガラス深さ(DOL_TP)において屈曲する特性を示す。また、屈折率分布は、図3のような特性を示す。しかし、このような強化ガラスにおいて、DOL_TPよりもガラス表層側の応力分布と、DOL_TPよりもガラス深層側の応力分布を、同一の装置により測定することは困難である。
強化ガラスの製造工程において、強化ガラス1つ1つについて、DOL_TPよりもガラス表層側の応力分布と、DOL_TPよりもガラス深層側の応力分布とを異なる測定装置を用いて測定すると、測定時間が長くなり、生産性が低下することになる。
そこで、強化ガラスの製造工程ではDOL_TPよりもガラス表層側の応力分布のみを測定し、DOL_TPよりもガラス深層側の応力分布については、同一の強化条件で作製された強化ガラスの応力分布を事前に測定し、事前の測定結果に基づいて算出していた。これにより、DOL_TPよりもガラス深層側の応力分布については、強化ガラスの製造工程で測定する必要がなくなるため、測定時間の短縮が実現されていた。
しかしながら、上記の方法では、強化条件がばらついた場合、DOL_TPよりもガラス深層側の応力分布の算出結果に誤差が生じるため、精度の向上が求められていた。
本発明は、上記の点に鑑みてなされたものであり、強化ガラスにおいて、DOL_TPよりもガラス深層側の応力分布の算出精度を向上することを目的とする。
本強化ガラスの応力分布の取得方法は、事前準備として、強化条件の異なる強化ガラスを含む複数の強化ガラスについて応力分布を測定し、前記応力分布が屈曲する位置のガラス深さよりもガラス表層側の第1の応力分布の測定結果と、前記ガラス深さよりもガラス深層側の第2の応力分布の測定結果と、に基づいて、前記第1の応力分布と前記第2の応力分布との関係を示すパラメータを導出するステップと、前記パラメータを利用して、測定対象となる強化ガラスの応力分布を求めるステップと、を有し、前記応力分布を求めるステップは、測定対象となる前記強化ガラスについて前記第1の応力分布を測定するステップと、前記パラメータに基づいて前記第2の応力分布を算出するステップと、を含むことを要件とする。
開示の技術によれば、強化ガラスにおいて、DOL_TPよりもガラス深層側の応力分布の算出精度を向上できる。
以下、図面を参照して発明を実施するための形態について説明する。各図面において、同一構成部分には同一符号を付し、重複した説明を省略する場合がある。
図1は、強化ガラスの深さ方向の応力分布を例示する図である。図1において、CS2は最表面の応力値、CS_TPは応力分布が屈曲する位置の応力値、CTはガラス最深部(すなわち、板厚方向の中心部)における応力値である。又、DOL_TPは応力分布が屈曲する位置のガラス深さ、DOL_zeroは応力値がゼロになるガラス深さ、DOL_tailは応力値がCTと同じ値になるガラス深さである。
本明細書では、DOL_TPよりもガラス表層側の応力分布を第1の応力分布、DOL_TPよりもガラス深層側の応力分布を第2の応力分布とする。
第1の応力分布と第2の応力分布は、同一の測定原理により精度よく測定することが困難である。従って、第1の応力分布と第2の応力分布とを精度よく測定する必要がある場合には、異なる測定原理により別々に測定する必要がある。以下に、第1の応力分布と第2の応力分布の測定原理の一例について説明する。
第1の応力分布は、例えば、光ウェーブガイド効果を用いてガラス表面に沿って光を伝搬させ、光弾性技術により測定できる。
より詳しくは、ガラス表面に沿って伝搬させた光の、出射面に対して平行及び垂直に振動する二種の光成分(P偏光とS偏光)について、夫々少なくとも2本以上の輝線を有する二種の輝線列として変換する。そして、二種の輝線列をCCD(Charge Coupled Device)等の撮像素子により撮像し、二種の輝線列の夫々少なくとも2本以上の輝線の位置から、二種の光成分に対応した強化ガラスの表面から深さ方向にわたる屈折率分布を算出する。そして、二種の光成分の屈折率分布の差とガラスの光弾性定数とに基づいて、強化ガラスの表面から深さ方向にわたる第1の応力分布を算出できる。
第1の応力分布は、例えば、折原製作所製のガラス表面応力計FSM-6000LEを用いて測定できる。但し、第1の応力分布は、上記以外の任意の方法で測定して良く、例えば、周知のinverse WKB法(例えば、米国特許第9140543号明細書参照)等により測定できる。なお、光ウェーブガイド効果を用いた測定は、その原理上、ガラス表面からガラス深層に向かって屈折率が低下する部分しか測定できない。したがって、この方法は第1の応力分布の測定にのみ用いることができる。
第2の応力分布は、例えば、レーザ光の偏光位相差と散乱光を利用した光弾性応力測定の原理を用いて測定できる。
より詳しくは、レーザ光の偏光位相差を、レーザ光の波長に対して1波長以上可変し、偏光位相差を可変されたレーザ光が強化ガラスに入射されたことにより発する散乱光を、所定の時間間隔で複数回撮像し、複数の画像を取得する。そして、取得した複数の画像を用いて散乱光の周期的な輝度変化を測定し、輝度変化の位相変化を算出し、位相変化に基づき第2の応力分布を算出できる。
第2の応力分布は、例えば、折原製作所製の散乱光光弾性応力計SLP-1000を用いて測定できる。但し、第2の応力分布は、上記以外の任意の方法で測定して良い。第2の応力分布は、例えば、折原製作所製の散乱光光弾性応力計SLP-2000、ガラス断面応力計SCALP-04又はSCALP-05や、米国CRi社製の複屈折イメージング装置abrio等を用いて測定してもよい。なお、散乱光を利用した測定の場合、その原理上、ガラス表面の反射光や散乱光がガラス内部からの散乱光と重なり邪魔をしてしまい、ガラス表面近傍の測定精度が低い。したがって、この方法は第2の応力分布の測定にのみ用いることができる。
ところで、強化ガラスの製造工程は、第1の応力分布及び第2の応力分布を測定し、第1の応力分布及び第2の応力分布に基づいて出荷判断を行う工程を有する場合がある。この場合、強化ガラス1つ1つについて、第1の応力分布及び第2の応力分布を異なる測定装置を用いて測定すると、測定時間が長くなり、生産性が低下することになる。
そこで、本実施の形態では、強化条件の異なる複数の強化ガラスについて、事前に第1の応力分布及び第2の応力分布を各々に適切な測定方法により測定してデータベースを作成し、第1の応力分布と第2の応力分布との関係を示すパラメータを導出する。そして、強化ガラスの製造工程では、第1の応力分布のみを測定し、第2の応力分布は、事前に導出したパラメータに基づいて算出する。図2を参照して、以下に詳しく説明する。
図2は、強化ガラスの応力分布の取得方法を示すフローチャートの一例である。図2のステップS10は、強化ガラスの製造工程とは独立に行う事前準備の工程である。ステップS10では、まず、強化条件の異なる強化ガラスを含む複数の強化ガラスについての応力分布を測定する。具体的には、例えば、FSM-6000LEを用いて第1の応力分布を測定し、SLP-1000を用いて第2の応力分布を測定する。そして、第1の応力分布の測定結果と第2の応力分布の測定結果とに基づいて、第1の応力分布と第2の応力分布との関係を示すパラメータを導出する。
第1の応力分布は、例えば、σ1(x、Bn)と表すことができる。ここで、xは強化ガラスの深さ方向の位置を示し、Bnはフィッティングのパラメータを意味している。Bnは複数個であってもよい。第1の応力分布は、例えば直線近似することができ、この場合、第1の応力分布は、最表面の応力値をCS2、強化ガラス表面での応力の傾きをaとして、σ1(x、Bn)=CS2+a・xで表す(フィッティングする)ことができる。ここで、B1=CS2、B2=aを意味している。
第1の応力分布は、1次以上の関数で、2つ以上のパラメータを使っていれば、どんなフィッティング関数で表してもよい。ステップS10で第1の応力分布のフィッティングに用いるフィッティング関数σ1(x、Bn)は、例えば、σ1(x、Bn)=B1・erfc(B2・x)としてもよい。又、σ1(x、Bn)=B1/B2
2・(x-B2)2としてもよく、σ1(x、Bn)=B1+B2・x+B3・x2+B4・x3としてもよい。これらの何れの場合でも、B1=CS2としてもよい。なお、erfcは、周知の相補誤差関数である。
又、第2の応力分布は、例えば、σ2(x、Cm、CT)と表すことができる。ここで、xは強化ガラスの深さ方向の位置を示し、CmはステップS10で導出するパラメータを示している。パラメータCmは複数個(C1、C2、・・・)であってもよい。パラメータCmは、例えば、強化ガラスの板厚ごとに導出できる。或いは、強化ガラスの板厚をパラメータに含めてもよい。
第1の応力分布の測定結果と第2の応力分布の測定結果とに基づいて、CS2とCmとの相関図や、aとCmとの相関図を得ることができる。これらを用いて、CS2及びaとCmとの関係を導出できる。例えば、Cmは、CS2とaとの1次関数で表すことができる。必要に応じ、Cmは、CS2とaとの2次以上の関数で表してもよい。すなわち、Cmは、Bnの1次以上の関数にできる。
次に、ステップS20では、測定対象となる強化ガラスの応力分布を求める。ステップS20は、強化ガラスの製造工程に含むことができる。
ステップS20は、測定対象となる強化ガラスについて第1の応力分布を測定するステップS201と、ステップS10で導出したパラメータCmに基づいて第2の応力分布を算出するステップS202とを含む。
ステップS201では、測定対象となる強化ガラスについて、例えば、FSM-6000LEを用いて第1の応力分布を測定する。FSM-6000LEによりCS2及びaを得ることができる。
ステップS202では、第2の応力分布を算出する(第2の応力分布の測定は行わない)。第2の応力分布をσ2(x、Cm、CT)で示した場合、CmはCS2とaとの1次以上の関数であるが、CS2とaはステップS201で既知となっているため、Cmも既知である。そうすると、σ2(x、Cm、CT)において未知な値はCTのみであるため、ステップS202においてCTを求めることで第2の応力分布を算出できる。
CTは、ステップS201で測定した第1の応力分布と、σ2(x、Cm、CT)とを合成し、合成後の応力分布の積分値(x=0~t/2、tは測定対象となる強化ガラスの板厚)がゼロになるように決定できる。これは、一般的に外力が加わらなければ、応力の総和が0であることに基づくものである。
上記積分により、σ2(x、Cm、CT)において未知の値はなくなり、第2の応力分布が算出される。これにより、第1の応力分布と第2の応力分布とを合成した強化ガラス全体の応力分布が得られる。得られた全体の応力分布(第1の応力分布及び第2の応力分布)に基づいて強化ガラスの出荷判断を行うことができる。
このように、本実施の形態では、事前準備として、強化条件の異なる強化ガラスを含む複数の強化ガラスについての応力分布の測定結果に基づいて、第1の応力分布と第2の応力分布との関係を示すパラメータを導出する。そして、導出したパラメータに基づいて、第2の応力分布を算出する。
これにより、事前に測定した同一条件の強化ガラスの応力分布に基づいてパラメータを導出する場合と比較し、強化条件のばらつきに起因する誤差を低減可能となり、第2の応力分布の算出精度を向上できる。特に、強化回数が多くなると誤差が生じやすくなるため、本実施の形態に係る強化ガラスの応力分布の取得方法を採用するメリットが大きくなる。
[実施例、比較例]
最初に、図2に示すステップS10について説明する。板厚0.7mmのリチウム含有のアルミノシリケートガラスを表1に示す4つの強化条件(条件1~条件4)で化学強化して強化ガラスを作製した。そして、各強化ガラスについて、第1の応力分布をFSM-6000LE(折原製作所製:以降、FSMとする)で測定し、かつ第2の応力分布をSLP-1000(折原製作所製:以降、SLPとする)で測定し、図1に示した応力分布の特性値を得た。得られた特性値を表2に示す。
[実施例、比較例]
最初に、図2に示すステップS10について説明する。板厚0.7mmのリチウム含有のアルミノシリケートガラスを表1に示す4つの強化条件(条件1~条件4)で化学強化して強化ガラスを作製した。そして、各強化ガラスについて、第1の応力分布をFSM-6000LE(折原製作所製:以降、FSMとする)で測定し、かつ第2の応力分布をSLP-1000(折原製作所製:以降、SLPとする)で測定し、図1に示した応力分布の特性値を得た。得られた特性値を表2に示す。

従来の方法では、SLPで測定する第2の応力分布は、測定結果に式(1)をフィッティングする。そこで、比較のため、条件1~条件4で化学強化した4つの強化ガラスのSLPによる測定結果(第2の応力分布)を式(1)でフィッティングし、平均のパラメータCS0とcを得た(表3の比較例)。
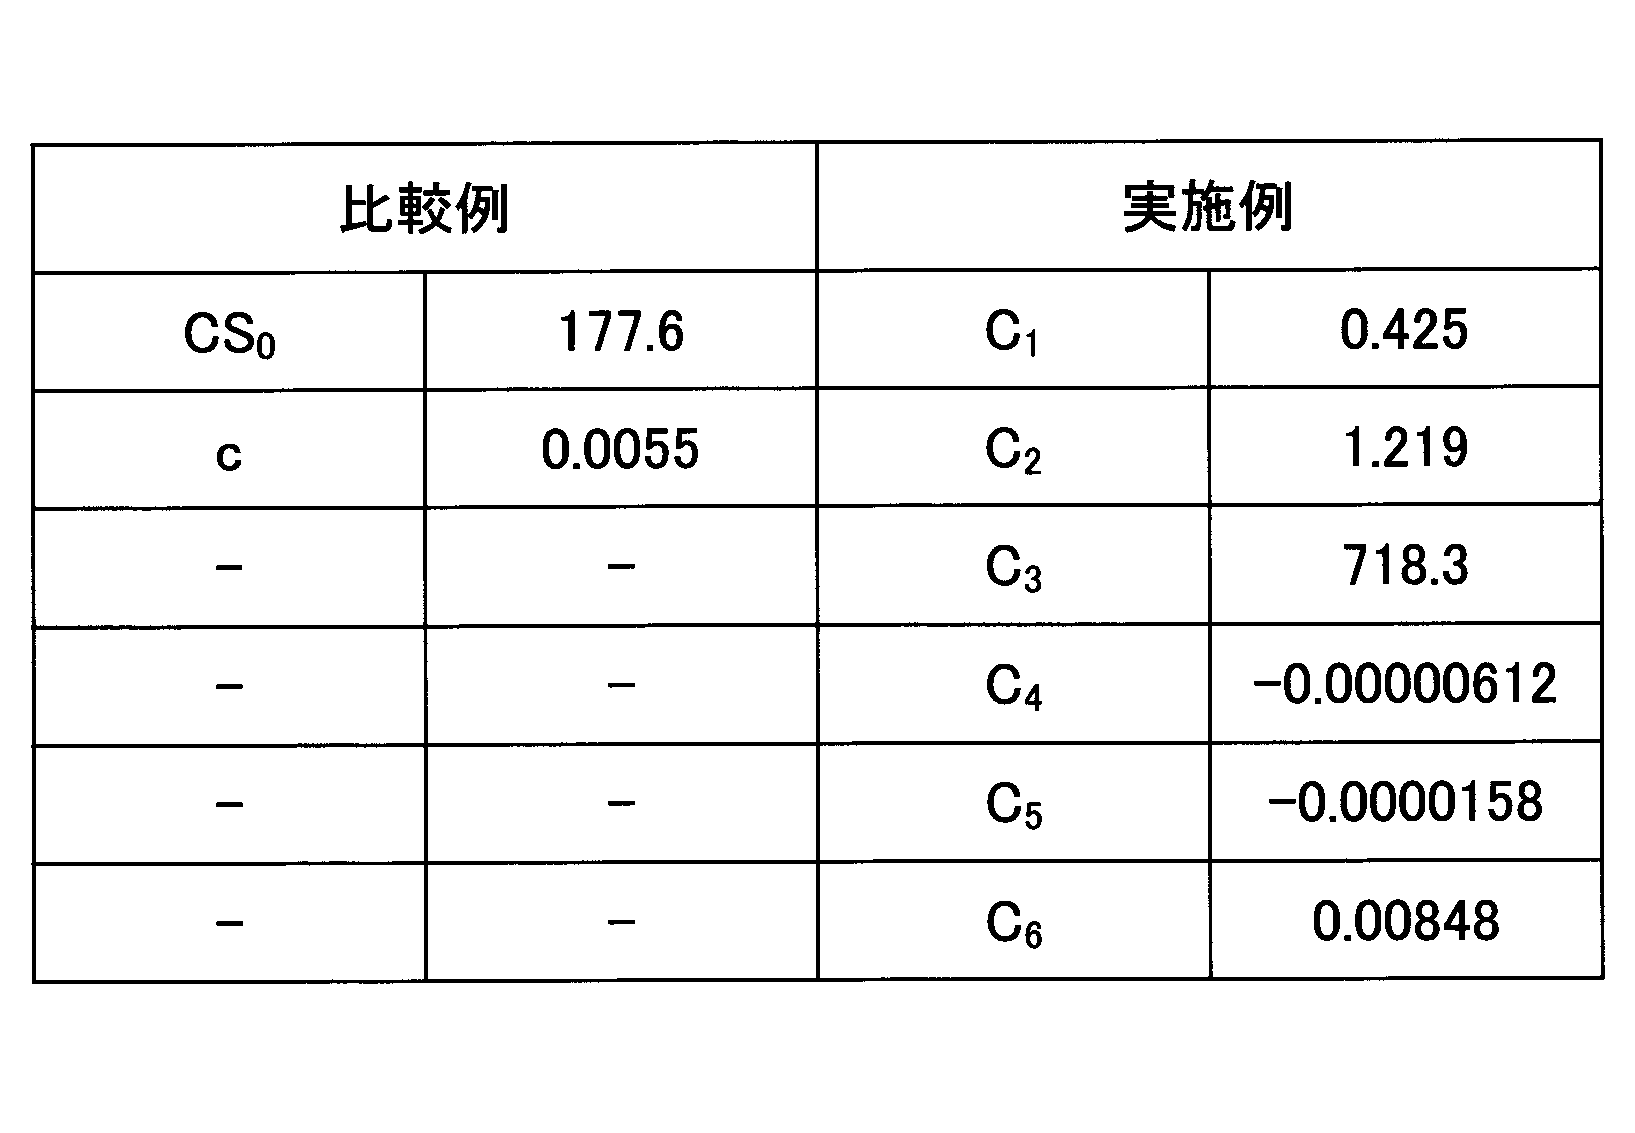
このようにフィッティング関数σ2に、強化条件の異なる強化ガラスに対するFSMの測定値をパラメータの一部として入れることで、測定する強化ガラスが変わっても精度良く第2の応力分布を算出できるようになる。
今回、ステップS10において、強化ガラスの強化条件の変更の例として強化塩の濃度を変更したが、ガラスの板厚や強化温度・強化時間を変更しても良く、変更する条件に制限はない。
又、強化塩の濃度は量産時と同様に、溶融塩に新しい強化ガラスを何度も強化したときに増減する溶融塩を添加しても良い。例えば、二回目の化学強化は、KNO3、NaNO3、LiNO3の混合塩を使ったが、KNO3、NaNO3、LiNO3の3種混合としてもよい。
ガラスの板厚を変更した場合、Cmは板厚の1次以上の関数とすることができ、例えば、第2の応力分布を式(3)でフィッティングしてもよい。板厚は、ステップS20において、応力測定する際、同時に測定してもよい。


本国際出願は2018年8月29日に出願した日本国特許出願2018-160215号に基づく優先権を主張するものであり、日本国特許出願2018-160215号の全内容を本国際出願に援用する。
以上、好ましい実施の形態について詳説したが、上述した実施の形態に制限されることはなく、特許請求の範囲に記載された範囲を逸脱することなく、上述した実施の形態に種々の変形及び置換を加えることができる。
Claims (23)
- 強化ガラスの応力分布の取得方法であって、
事前準備として、強化条件の異なる強化ガラスを含む複数の強化ガラスについて応力分布を測定し、前記応力分布が屈曲する位置のガラス深さよりもガラス表層側の第1の応力分布の測定結果と、前記ガラス深さよりもガラス深層側の第2の応力分布の測定結果と、に基づいて、前記第1の応力分布と前記第2の応力分布との関係を示すパラメータを導出するステップと、
前記パラメータを利用して、測定対象となる強化ガラスの応力分布を求めるステップと、を有し、
前記応力分布を求めるステップは、
測定対象となる前記強化ガラスについて前記第1の応力分布を測定するステップと、
前記パラメータに基づいて前記第2の応力分布を算出するステップと、を含むことを特徴とする、強化ガラスの応力分布の取得方法。 - 前記パラメータを導出するステップでは、
前記第1の応力分布をσ1(x、Bn)、前記第2の応力分布をσ2(x、Cm、CT)でフィッティングしたときに、BnとCmとの関係を導出する(但し、xは強化ガラスの深さ方向の位置、Bn及びCmはフィッティングパラメータ、CTは強化ガラスのガラス最深部の応力値、である)ことを特徴とする、請求項1に記載の強化ガラスの応力分布の取得方法。 - 前記第2の応力分布を算出するステップでは、
前記第1の応力分布を測定するステップで測定した前記第1の応力分布と、前記σ2(x、Cm、CT)とを合成し、合成後の応力分布の積分値(x=0~t/2、tは測定対象となる強化ガラスの板厚)がゼロになるCTを決定することを特徴とする、請求項2に記載の強化ガラスの応力分布の取得方法。 - 前記パラメータを導出するステップでは、前記第1の応力分布をσ1(x、Bn)=CS2+a・xでフィッティングする(但し、CS2は強化ガラスの最表面の応力値、aは強化ガラス表面での応力の傾きである)ことを特徴とする、請求項2又は3に記載の強化ガラスの応力分布の取得方法。
- 前記パラメータを導出するステップでは、前記第1の応力分布をσ1(x、Bn)=B1・erfc(B2・x)でフィッティングすることを特徴とする、請求項2又は3に記載の強化ガラスの応力分布の取得方法。
- 前記パラメータを導出するステップでは、前記第1の応力分布をσ1(x、Bn)=B1/B2 2・(x-B2)2でフィッティングすることを特徴とする、請求項2又は3に記載の強化ガラスの応力分布の取得方法。
- 前記パラメータを導出するステップでは、前記第1の応力分布をσ1(x、Bn)=B1+B2・x+B3・x2+B4・x3でフィッティングすることを特徴とする、請求項2又は3に記載の強化ガラスの応力分布の取得方法。
- 前記B1をCS2とすることを特徴とする、請求項5に記載の強化ガラスの応力分布の取得方法。
- 前記Cmは、前記CS2と前記aとの1次以上の関数であることを特徴とする、請求項4に記載の強化ガラスの応力分布の取得方法。
- 前記Cmは、前記Bnの1次以上の関数であることを特徴とする、請求項5に記載の強化ガラスの応力分布の取得方法。
- 前記σ2(x、Cm、CT)として、式(2)を用いることを特徴とする、請求項4に記載の強化ガラスの応力分布の取得方法。

- 前記パラメータを導出するステップでは、強化条件の異なる強化ガラスを含む複数の強化ガラスについて、少なくとも強化塩の塩濃度を変更したガラスを準備して前記パラメータを導出することを特徴とする、請求項1乃至11の何れか一項に記載の強化ガラスの応力分布の取得方法。
- 前記パラメータを導出するステップでは、強化条件の異なる強化ガラスを含む複数の強化ガラスについて、少なくとも板厚を変更したガラスを準備して前記パラメータを導出することを特徴とする、請求項1乃至12の何れか一項に記載の強化ガラスの応力分布の取得方法。
- 前記Cmは、板厚tの1次以上の関数であることを特徴とする、請求項2又は3に記載の強化ガラスの応力分布の取得方法。
- 前記σ2(x、Cm、CT)として、式(3)を用いることを特徴とする、請求項14に記載の強化ガラスの応力分布の取得方法。
- 前記Cmは、強化時間tCSと強化時間TCSの1次以上の関数であることを特徴とする、請求項2又は3に記載の強化ガラスの応力分布の取得方法。
- 前記σ2(x、Cm、CT)として、式(4)を用いることを特徴とする、請求項16に記載の強化ガラスの応力分布の取得方法。
- 前記σ2(x、Cm、CT)として、式(5)を用いることを特徴とする、請求項4又は14に記載の強化ガラスの応力分布の取得方法。
- 前記σ2(x、Cm、CT)として、式(6)を用いることを特徴とする、請求項4、14、又は16に記載の強化ガラスの応力分布の取得方法。
- 前記σ2(x、Cm、CT)として、式(7)を用いることを特徴とする、請求項10に記載の強化ガラスの応力分布の取得方法。
- 前記Cmは、強化ガラスの表層屈折率又は最深部屈折率の1次以上の関数であることを特徴とする、請求項2又は3に記載の強化ガラスの応力分布の取得方法。
- 強化ガラスがリチウム含有のアルミノシリケートガラスであることを特徴とする、請求項1乃至21の何れか一項に記載の強化ガラスの応力分布の取得方法。
- 強化ガラスの製造方法であって、
請求項1乃至22の何れか一項に記載の強化ガラスの応力分布の取得方法により取得した前記第1の応力分布及び前記第2の応力分布に基づいて出荷判断を行う工程を有することを特徴とする、強化ガラスの製造方法。
Priority Applications (4)
| Application Number | Priority Date | Filing Date | Title |
|---|---|---|---|
| JP2020539330A JP7648382B2 (ja) | 2018-08-29 | 2019-08-14 | 化学強化されたアルミノシリケートガラスの応力分布の取得方法、化学強化されたアルミノシリケートガラスの製造方法 |
| KR1020217003694A KR102667994B1 (ko) | 2018-08-29 | 2019-08-14 | 강화 유리의 응력 분포의 취득 방법, 강화 유리의 제조 방법 |
| CN201980051963.5A CN112534228B (zh) | 2018-08-29 | 2019-08-14 | 强化玻璃的应力分布的取得方法及强化玻璃的制造方法 |
| JP2023069475A JP2023089250A (ja) | 2018-08-29 | 2023-04-20 | 強化ガラスの応力分布の取得方法、強化ガラスの製造方法 |
Applications Claiming Priority (2)
| Application Number | Priority Date | Filing Date | Title |
|---|---|---|---|
| JP2018-160215 | 2018-08-29 | ||
| JP2018160215 | 2018-08-29 |
Publications (1)
| Publication Number | Publication Date |
|---|---|
| WO2020045093A1 true WO2020045093A1 (ja) | 2020-03-05 |
Family
ID=69644943
Family Applications (1)
| Application Number | Title | Priority Date | Filing Date |
|---|---|---|---|
| PCT/JP2019/031953 Ceased WO2020045093A1 (ja) | 2018-08-29 | 2019-08-14 | 強化ガラスの応力分布の取得方法、強化ガラスの製造方法 |
Country Status (4)
| Country | Link |
|---|---|
| JP (2) | JP7648382B2 (ja) |
| KR (1) | KR102667994B1 (ja) |
| CN (1) | CN112534228B (ja) |
| WO (1) | WO2020045093A1 (ja) |
Cited By (2)
| Publication number | Priority date | Publication date | Assignee | Title |
|---|---|---|---|---|
| JP2022093268A (ja) * | 2020-12-11 | 2022-06-23 | 日本電気硝子株式会社 | 強化ガラスの応力特性推定方法及び応力特性推定用モデル作成方法 |
| US20220380250A1 (en) * | 2021-05-25 | 2022-12-01 | AGC Inc. | Inference method, quality control method, chemically strengthened glass, inference program, storage medium, inference device, and method of manufacturing chemically strengthened glass |
Families Citing this family (1)
| Publication number | Priority date | Publication date | Assignee | Title |
|---|---|---|---|---|
| KR20260010937A (ko) * | 2024-07-15 | 2026-01-22 | 씨제이제일제당 (주) | 결정화기 모델링 방법 및 결정화기 모델링 시스템 |
Citations (4)
| Publication number | Priority date | Publication date | Assignee | Title |
|---|---|---|---|---|
| JP2011527661A (ja) * | 2008-07-11 | 2011-11-04 | コーニング インコーポレイテッド | 民生用途のための圧縮面を有するガラス |
| US20130233020A1 (en) * | 2012-03-12 | 2013-09-12 | Douglas Clippinger Allan | Methods for producing ion-exchangeable glasses |
| JP2016142600A (ja) * | 2015-01-30 | 2016-08-08 | 有限会社折原製作所 | 表面応力測定方法、表面応力測定装置 |
| US20170082577A1 (en) * | 2015-09-17 | 2017-03-23 | Corning Incorporated | Methods of characterizing ion-exchanged chemically strengthened glasses containing lithium |
Family Cites Families (2)
| Publication number | Priority date | Publication date | Assignee | Title |
|---|---|---|---|---|
| JP2019501101A (ja) * | 2015-12-08 | 2019-01-17 | コーニング インコーポレイテッド | S字応力プロファイル及び生成方法 |
| KR102345803B1 (ko) * | 2016-09-26 | 2022-01-03 | 오리하라 인더스트리얼 컴퍼니 리미티드 | 강화 유리의 응력 측정 장치, 강화 유리의 응력 측정 방법, 강화 유리의 제조 방법, 강화 유리 |
-
2019
- 2019-08-14 CN CN201980051963.5A patent/CN112534228B/zh active Active
- 2019-08-14 JP JP2020539330A patent/JP7648382B2/ja active Active
- 2019-08-14 WO PCT/JP2019/031953 patent/WO2020045093A1/ja not_active Ceased
- 2019-08-14 KR KR1020217003694A patent/KR102667994B1/ko active Active
-
2023
- 2023-04-20 JP JP2023069475A patent/JP2023089250A/ja not_active Withdrawn
Patent Citations (4)
| Publication number | Priority date | Publication date | Assignee | Title |
|---|---|---|---|---|
| JP2011527661A (ja) * | 2008-07-11 | 2011-11-04 | コーニング インコーポレイテッド | 民生用途のための圧縮面を有するガラス |
| US20130233020A1 (en) * | 2012-03-12 | 2013-09-12 | Douglas Clippinger Allan | Methods for producing ion-exchangeable glasses |
| JP2016142600A (ja) * | 2015-01-30 | 2016-08-08 | 有限会社折原製作所 | 表面応力測定方法、表面応力測定装置 |
| US20170082577A1 (en) * | 2015-09-17 | 2017-03-23 | Corning Incorporated | Methods of characterizing ion-exchanged chemically strengthened glasses containing lithium |
Cited By (4)
| Publication number | Priority date | Publication date | Assignee | Title |
|---|---|---|---|---|
| JP2022093268A (ja) * | 2020-12-11 | 2022-06-23 | 日本電気硝子株式会社 | 強化ガラスの応力特性推定方法及び応力特性推定用モデル作成方法 |
| JP7769293B2 (ja) | 2020-12-11 | 2025-11-13 | 日本電気硝子株式会社 | 強化ガラスの応力特性推定方法及び応力特性推定用モデル作成方法 |
| US20220380250A1 (en) * | 2021-05-25 | 2022-12-01 | AGC Inc. | Inference method, quality control method, chemically strengthened glass, inference program, storage medium, inference device, and method of manufacturing chemically strengthened glass |
| US12246988B2 (en) * | 2021-05-25 | 2025-03-11 | AGC Inc. | Inference method, quality control method, chemically strengthened glass, inference program, storage medium, inference device, and method of manufacturing chemically strengthened glass |
Also Published As
| Publication number | Publication date |
|---|---|
| CN112534228B (zh) | 2022-08-16 |
| KR20210045989A (ko) | 2021-04-27 |
| JP7648382B2 (ja) | 2025-03-18 |
| KR102667994B1 (ko) | 2024-05-23 |
| JPWO2020045093A1 (ja) | 2021-08-10 |
| JP2023089250A (ja) | 2023-06-27 |
| CN112534228A (zh) | 2021-03-19 |
Similar Documents
| Publication | Publication Date | Title |
|---|---|---|
| JP7203140B2 (ja) | イオン交換により化学強化されたリチウム含有ガラスを特徴付ける方法 | |
| JP6978545B2 (ja) | イオン交換により化学強化されたリチウム含有ガラスを特徴付ける方法 | |
| JP2023089250A (ja) | 強化ガラスの応力分布の取得方法、強化ガラスの製造方法 | |
| KR102345803B1 (ko) | 강화 유리의 응력 측정 장치, 강화 유리의 응력 측정 방법, 강화 유리의 제조 방법, 강화 유리 | |
| JP2018527282A5 (ja) | ||
| JP2017197408A (ja) | 強化ガラス板 | |
| WO2017115811A1 (ja) | 表面屈折率測定方法、及び、それを利用した表面応力測定方法 | |
| JP7158017B2 (ja) | 応力測定装置、応力測定方法 | |
| CN114112131A (zh) | 强化玻璃的应力测定装置、强化玻璃的应力测定方法、强化玻璃 | |
| JP2018024554A (ja) | 強化ガラス板の製造方法 | |
| JP2022093268A (ja) | 強化ガラスの応力特性推定方法及び応力特性推定用モデル作成方法 | |
| JP6666037B2 (ja) | 校正方法、プログラム、計測装置、および物品の製造方法 |
Legal Events
| Date | Code | Title | Description |
|---|---|---|---|
| 121 | Ep: the epo has been informed by wipo that ep was designated in this application |
Ref document number: 19855985 Country of ref document: EP Kind code of ref document: A1 |
|
| ENP | Entry into the national phase |
Ref document number: 2020539330 Country of ref document: JP Kind code of ref document: A |
|
| NENP | Non-entry into the national phase |
Ref country code: DE |
|
| 122 | Ep: pct application non-entry in european phase |
Ref document number: 19855985 Country of ref document: EP Kind code of ref document: A1 |