WO2019181229A1 - Photography control device, photography control method, radiography system, and program - Google Patents
Photography control device, photography control method, radiography system, and program Download PDFInfo
- Publication number
- WO2019181229A1 WO2019181229A1 PCT/JP2019/003593 JP2019003593W WO2019181229A1 WO 2019181229 A1 WO2019181229 A1 WO 2019181229A1 JP 2019003593 W JP2019003593 W JP 2019003593W WO 2019181229 A1 WO2019181229 A1 WO 2019181229A1
- Authority
- WO
- WIPO (PCT)
- Prior art keywords
- image
- energy
- radiation
- images
- imaging control
- Prior art date
Links
Images

Classifications
-
- G—PHYSICS
- G01—MEASURING; TESTING
- G01N—INVESTIGATING OR ANALYSING MATERIALS BY DETERMINING THEIR CHEMICAL OR PHYSICAL PROPERTIES
- G01N23/00—Investigating or analysing materials by the use of wave or particle radiation, e.g. X-rays or neutrons, not covered by groups G01N3/00 – G01N17/00, G01N21/00 or G01N22/00
- G01N23/02—Investigating or analysing materials by the use of wave or particle radiation, e.g. X-rays or neutrons, not covered by groups G01N3/00 – G01N17/00, G01N21/00 or G01N22/00 by transmitting the radiation through the material
- G01N23/04—Investigating or analysing materials by the use of wave or particle radiation, e.g. X-rays or neutrons, not covered by groups G01N3/00 – G01N17/00, G01N21/00 or G01N22/00 by transmitting the radiation through the material and forming images of the material
-
- A—HUMAN NECESSITIES
- A61—MEDICAL OR VETERINARY SCIENCE; HYGIENE
- A61B—DIAGNOSIS; SURGERY; IDENTIFICATION
- A61B6/00—Apparatus for radiation diagnosis, e.g. combined with radiation therapy equipment
- A61B6/40—Apparatus for radiation diagnosis, e.g. combined with radiation therapy equipment with arrangements for generating radiation specially adapted for radiation diagnosis
- A61B6/405—Source units specially adapted to modify characteristics of the beam during the data acquisition process
-
- A—HUMAN NECESSITIES
- A61—MEDICAL OR VETERINARY SCIENCE; HYGIENE
- A61B—DIAGNOSIS; SURGERY; IDENTIFICATION
- A61B6/00—Apparatus for radiation diagnosis, e.g. combined with radiation therapy equipment
- A61B6/42—Apparatus for radiation diagnosis, e.g. combined with radiation therapy equipment with arrangements for detecting radiation specially adapted for radiation diagnosis
- A61B6/4208—Apparatus for radiation diagnosis, e.g. combined with radiation therapy equipment with arrangements for detecting radiation specially adapted for radiation diagnosis characterised by using a particular type of detector
- A61B6/4233—Apparatus for radiation diagnosis, e.g. combined with radiation therapy equipment with arrangements for detecting radiation specially adapted for radiation diagnosis characterised by using a particular type of detector using matrix detectors
-
- A—HUMAN NECESSITIES
- A61—MEDICAL OR VETERINARY SCIENCE; HYGIENE
- A61B—DIAGNOSIS; SURGERY; IDENTIFICATION
- A61B6/00—Apparatus for radiation diagnosis, e.g. combined with radiation therapy equipment
- A61B6/42—Apparatus for radiation diagnosis, e.g. combined with radiation therapy equipment with arrangements for detecting radiation specially adapted for radiation diagnosis
- A61B6/4208—Apparatus for radiation diagnosis, e.g. combined with radiation therapy equipment with arrangements for detecting radiation specially adapted for radiation diagnosis characterised by using a particular type of detector
- A61B6/4241—Apparatus for radiation diagnosis, e.g. combined with radiation therapy equipment with arrangements for detecting radiation specially adapted for radiation diagnosis characterised by using a particular type of detector using energy resolving detectors, e.g. photon counting
-
- A—HUMAN NECESSITIES
- A61—MEDICAL OR VETERINARY SCIENCE; HYGIENE
- A61B—DIAGNOSIS; SURGERY; IDENTIFICATION
- A61B6/00—Apparatus for radiation diagnosis, e.g. combined with radiation therapy equipment
- A61B6/48—Diagnostic techniques
- A61B6/481—Diagnostic techniques involving the use of contrast agents
-
- A—HUMAN NECESSITIES
- A61—MEDICAL OR VETERINARY SCIENCE; HYGIENE
- A61B—DIAGNOSIS; SURGERY; IDENTIFICATION
- A61B6/00—Apparatus for radiation diagnosis, e.g. combined with radiation therapy equipment
- A61B6/48—Diagnostic techniques
- A61B6/482—Diagnostic techniques involving multiple energy imaging
-
- A—HUMAN NECESSITIES
- A61—MEDICAL OR VETERINARY SCIENCE; HYGIENE
- A61B—DIAGNOSIS; SURGERY; IDENTIFICATION
- A61B6/00—Apparatus for radiation diagnosis, e.g. combined with radiation therapy equipment
- A61B6/50—Clinical applications
- A61B6/504—Clinical applications involving diagnosis of blood vessels, e.g. by angiography
-
- A—HUMAN NECESSITIES
- A61—MEDICAL OR VETERINARY SCIENCE; HYGIENE
- A61B—DIAGNOSIS; SURGERY; IDENTIFICATION
- A61B6/00—Apparatus for radiation diagnosis, e.g. combined with radiation therapy equipment
- A61B6/52—Devices using data or image processing specially adapted for radiation diagnosis
- A61B6/5211—Devices using data or image processing specially adapted for radiation diagnosis involving processing of medical diagnostic data
-
- A—HUMAN NECESSITIES
- A61—MEDICAL OR VETERINARY SCIENCE; HYGIENE
- A61B—DIAGNOSIS; SURGERY; IDENTIFICATION
- A61B6/00—Apparatus for radiation diagnosis, e.g. combined with radiation therapy equipment
- A61B6/54—Control of apparatus or devices for radiation diagnosis
-
- G—PHYSICS
- G01—MEASURING; TESTING
- G01T—MEASUREMENT OF NUCLEAR OR X-RADIATION
- G01T1/00—Measuring X-radiation, gamma radiation, corpuscular radiation, or cosmic radiation
- G01T1/16—Measuring radiation intensity
- G01T1/17—Circuit arrangements not adapted to a particular type of detector
-
- H—ELECTRICITY
- H04—ELECTRIC COMMUNICATION TECHNIQUE
- H04N—PICTORIAL COMMUNICATION, e.g. TELEVISION
- H04N5/00—Details of television systems
- H04N5/30—Transforming light or analogous information into electric information
- H04N5/32—Transforming X-rays
-
- H—ELECTRICITY
- H04—ELECTRIC COMMUNICATION TECHNIQUE
- H04N—PICTORIAL COMMUNICATION, e.g. TELEVISION
- H04N5/00—Details of television systems
- H04N5/30—Transforming light or analogous information into electric information
- H04N5/32—Transforming X-rays
- H04N5/3205—Transforming X-rays using subtraction imaging techniques
-
- G—PHYSICS
- G01—MEASURING; TESTING
- G01N—INVESTIGATING OR ANALYSING MATERIALS BY DETERMINING THEIR CHEMICAL OR PHYSICAL PROPERTIES
- G01N23/00—Investigating or analysing materials by the use of wave or particle radiation, e.g. X-rays or neutrons, not covered by groups G01N3/00 – G01N17/00, G01N21/00 or G01N22/00
- G01N23/02—Investigating or analysing materials by the use of wave or particle radiation, e.g. X-rays or neutrons, not covered by groups G01N3/00 – G01N17/00, G01N21/00 or G01N22/00 by transmitting the radiation through the material
- G01N23/06—Investigating or analysing materials by the use of wave or particle radiation, e.g. X-rays or neutrons, not covered by groups G01N3/00 – G01N17/00, G01N21/00 or G01N22/00 by transmitting the radiation through the material and measuring the absorption
- G01N23/083—Investigating or analysing materials by the use of wave or particle radiation, e.g. X-rays or neutrons, not covered by groups G01N3/00 – G01N17/00, G01N21/00 or G01N22/00 by transmitting the radiation through the material and measuring the absorption the radiation being X-rays
- G01N23/087—Investigating or analysing materials by the use of wave or particle radiation, e.g. X-rays or neutrons, not covered by groups G01N3/00 – G01N17/00, G01N21/00 or G01N22/00 by transmitting the radiation through the material and measuring the absorption the radiation being X-rays using polyenergetic X-rays
Definitions
- the present invention relates to a radiation imaging system, an imaging control apparatus, and a method.
- imaging apparatuses used for medical image diagnosis and non-destructive inspection using radiation radiation imaging apparatuses using a flat panel detector (hereinafter referred to as FPD) made of a semiconductor material are widely used.
- FPD flat panel detector
- a radiographic apparatus is used as a digital imaging apparatus for still image shooting such as general shooting or moving image shooting such as fluoroscopic shooting.
- DSA digital subtraction angiography
- one of the imaging methods using FPD is energy subtraction.
- energy subtraction first, a plurality of images having different energies are acquired by, for example, irradiating a plurality of radiations having different tube voltages. By calculating them, processing such as separation into a bone image and a soft tissue image can be performed.
- Patent Document 1 a method for diagnosing a moving target blood vessel by imaging only a contrast medium has been proposed.
- An imaging control apparatus has the following configuration. That is, Acquisition means for acquiring a plurality of images with different radiation energies obtained by irradiating a subject with radiation whose energy changes during one shot and detecting the radiation transmitted through the subject a plurality of times during the one shot When, First generation means for performing energy subtraction processing using a plurality of images and generating an energy subtraction image; Second generating means for generating a difference image using a plurality of energy subtraction images generated by the first generating means.
- the term “radiation” may include, for example, ⁇ rays, ⁇ rays, ⁇ ray particle beams, cosmic rays, and the like in addition to X rays.
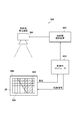
- FIG. 1A is a block diagram illustrating a configuration example of a radiation imaging system 100 according to the first embodiment.
- a radiation imaging system 100 according to the first embodiment includes a radiation generation apparatus 101, a radiation control apparatus 102, a control computer 103, and a radiation imaging apparatus 104.
- the radiation generator 101 generates radiation under the control of the radiation controller 102.
- the control computer 103 functions as an imaging control apparatus that controls the radiation control apparatus 102 to emit radiation and controls the radiation imaging apparatus 104 to acquire image information.
- the control computer 103 includes, for example, one or more processors (CPU) (not shown) and a memory, and the one or more processors execute various processes by executing programs stored in the memory.
- the radiation imaging apparatus 104 includes a phosphor 105 that converts radiation into visible light, and a two-dimensional detector 106 that detects visible light.
- the two-dimensional detector 106 is a sensor in which pixels 20 that detect radiation quanta are arranged in an array of X columns ⁇ Y rows, and outputs image information.
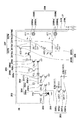
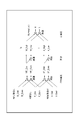
- FIG. 2 shows an equivalent circuit diagram of the pixel 20 according to the first embodiment.
- the pixel 20 includes a photoelectric conversion element 201 and an output circuit unit 202.
- the photoelectric conversion element 201 is typically a photodiode.
- the output circuit unit 202 includes an amplifier circuit unit 204, a clamp circuit unit 206, a sample hold circuit unit 207, and a selection circuit unit 208.
- the photoelectric conversion element 201 includes a charge storage unit. This charge storage section is connected to the gate of the MOS transistor 204a of the amplifier circuit section 204.
- the source of the MOS transistor 204a is connected to the current source 204c through the MOS transistor 204b.
- the MOS transistor 204a and the current source 204c constitute a source follower circuit.
- the MOS transistor 204b is an enable switch that is turned on when the enable signal EN supplied to the gate thereof becomes an active level to bring the source follower circuit into an operating state.
- the charge storage portion of the photoelectric conversion element 201 and the gate of the MOS transistor 204a constitute a common node, and this node is a charge voltage that converts the charge stored in the charge storage portion into a voltage.
- Functions as a conversion unit. That is, the voltage V ( Q / C) determined by the charge Q stored in the charge storage unit and the capacitance value C of the charge voltage conversion unit appears in the charge voltage conversion unit.
- the charge-voltage converter is connected to the reset potential Vres via the reset switch 203. When the reset signal PRES becomes active level, the reset switch 203 is turned on, and the potential of the charge-voltage converter is reset to the reset potential Vres.
- the clamp circuit unit 206 clamps the noise output from the amplifier circuit unit 204 by the clamp capacitor 206a according to the reset potential of the charge-voltage conversion unit. That is, the clamp circuit unit 206 is a circuit for canceling noise from the signal output from the source follower circuit in accordance with the electric charge generated by the photoelectric conversion in the photoelectric conversion element 201. This noise includes kTC noise at reset. Clamping is performed by setting the clamp signal PCL to the active level to turn the MOS transistor 206b on, and then setting the clamp signal PCL to the inactive level to turn the MOS transistor 206b off. The output side of the clamp capacitor 206a is connected to the gate of the MOS transistor 206c.
- MOS transistor 206c The source of the MOS transistor 206c is connected to the current source 206e via the MOS transistor 206d.
- the MOS transistor 206c and the current source 206e constitute a source follower circuit.
- MOS transistor 206d is an enable switch enable signal EN 0 applied to its gate to the source follower circuit is turned on when an active level to the operating state.
- a signal output from the clamp circuit unit 206 according to the electric charge generated by the photoelectric conversion in the photoelectric conversion element 201 is written as an optical signal into the capacitor 207Sb via the switch 207Sa when the optical signal sampling signal TS becomes an active level. It is.
- a signal output from the clamp circuit 206 when the MOS transistor 206b is turned on immediately after resetting the potential of the charge-voltage converter is a clamp voltage.
- the noise signal is written to the capacitor 207Nb via the switch 207Na when the noise sampling signal TN becomes an active level. This noise signal includes an offset component of the clamp circuit unit 206.
- the switch 207Sa and the capacitor 207Sb constitute a signal sample / hold circuit 207S
- the switch 207Na and the capacitor 207Nb constitute a noise sample / hold circuit 207N
- the sample hold circuit unit 207 includes the signal sample hold circuit 207S and the noise sample hold circuit 207N.
- the signal line 21 includes a signal line 21S and a signal line 21N.
- the drive circuit unit drives the row selection signal to the active level
- the signal (optical signal) held in the capacitor 207Sb is output to the signal line 21S via the MOS transistor 208Sa and the row selection switch 208Sb.
- a signal (noise) held in the capacitor 207Nb is output to the signal line 21N via the MOS transistor 208Na and the row selection switch 208Nb.
- the MOS transistor 208Sa constitutes a constant current source (not shown) and a source follower circuit provided on the signal line 21S.
- the MOS transistor 208Na constitutes a constant current source (not shown) provided on the signal line 21N and a source follower circuit.
- the MOS transistor 208Sa and the row selection switch 208Sb constitute a signal selection circuit unit 208S
- the MOS transistor 208Na and the row selection switch 208Nb constitute a noise selection circuit unit 208N.
- the selection circuit unit 208 includes a signal selection circuit unit 208S and a noise selection circuit unit 208N.
- the pixel 20 may include an addition switch 209 ⁇ / b> S that adds the optical signals of the plurality of adjacent pixels 20.
- the addition mode signal ADD becomes an active level, and the addition switch 209S is turned on.
- the capacitors 207Sb of the adjacent pixels 20 are connected to each other by the addition switch 209S, and the optical signals are averaged.
- the pixel 20 may include an addition switch 209N that adds noises of a plurality of adjacent pixels 20. When the addition switch 209N is turned on, the capacitors 207Nb of the adjacent pixels 20 are connected to each other by the addition switch 209N, and noise is averaged.
- the adding unit 209 includes an addition switch 209S and an addition switch 209N.
- the pixel 20 may include a sensitivity changing unit 205 for changing the sensitivity.
- the pixel 20 can include, for example, a first sensitivity change switch 205a and a second sensitivity change switch 205′a, and circuit elements associated therewith.
- the first change signal WIDE becomes active level
- the first sensitivity change switch 205a is turned on, and the capacitance value of the first additional capacitor 205b is added to the capacitance value of the charge-voltage converter. This reduces the sensitivity of the pixel 20.
- the second change signal WIDE2 becomes an active level
- the second sensitivity change switch 205′a is turned on, and the capacitance value of the second additional capacitor 205′b is added to the capacitance value of the charge-voltage converter.
- the MOS transistor 204'a may be a source follower operation in place of the MOS transistor 204a.
- the MOS transistor 204′b is an enable switch that is turned on when the enable signal EN n supplied to the gate thereof becomes an active level and puts the source follower circuit into an operating state.
- the radiation imaging apparatus 104 converts the output of the pixel circuit as described above into a digital value with an AD converter (not shown), and then transfers the image to the control computer 103 as an image.
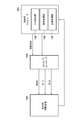
- the control computer 103 as the imaging control apparatus includes an image acquisition unit 131, an image processing unit 132, and a DSA processing unit 133. These may be realized by a processor executing a program, or a part or all of them may be realized by dedicated hardware. Details of the image acquisition unit 131, the image processing unit 132, and the DSA processing unit 133 will be clarified later.
- the timing controller 120 provides RESET, SH_S, SH_N to the radiation imaging apparatus 104 in accordance with a synchronization signal from the control computer 103.
- the RESET signal corresponds to the reset signal PRES in FIG. 2
- the SH_S signal and the SH_N signal correspond to the optical sampling signal TS and the noise sampling signal TN in FIG. 2, respectively.
- the image acquisition unit 131 of the control computer 103 is different from each other obtained by irradiating a subject with radiation whose energy changes between shots and detecting the radiation transmitted through the subject a plurality of times during the one shot. Acquire multiple images of radiation energy.
- the two-dimensional detector 106 performs sampling at least twice in a period between two consecutive resets, and the first image and the second image with different radiation energies in one frame imaging period.
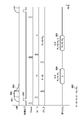
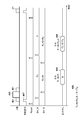
- FIG. 3 is a timing chart showing drive timing (sampling and readout timing) of the two-dimensional detector 106 when energy subtraction is performed in the radiation imaging system according to the first embodiment.
- the waveforms in the figure show the timing of radiation exposure, synchronization signal, photoelectric conversion element 201 reset, sample hold circuit 207, and image readout from the signal line 21 with the horizontal axis as time.
- Each signal (Reset, SH_S, SH_N) shown in FIG. 3 can be supplied from a timing controller 120 as shown in FIG. 1B, for example.
- the timing controller 120 may be incorporated in the control computer 103, may be incorporated in the radiation imaging apparatus 104, or may be an independent apparatus interposed between the control computer 103 and the radiation imaging apparatus 104. There may be. From the two-dimensional detector 106, the difference (S ⁇ N) between the signals held by the signal sample hold circuit 207S and the noise sample hold circuit 207N is read out.
- the tube voltage of radiation is ideally a rectangular wave, but it takes a finite time for the tube voltage to rise and fall.
- the tube voltage is no longer regarded as a rectangular wave, and has a waveform as shown in FIG. That is, the energy of the radiation differs between the rising period, the stable period, and the falling period of the radiation.
- sampling is performed by the noise sample hold circuit 207N, and further, the sampling is performed by the signal sample hold circuit 207S after the radiation 302 in the stable period is exposed. Thereafter, the difference between the signal line 21N and the signal line 21S is read as an image.
- the signal (R 1 ) of the rising radiation 301 is held in the noise sample hold circuit 207N.
- the signal sample and hold circuit 207S holds a signal (R 1 + B) that is the sum of the signal (R 1 ) of the radiation 301 in the rising period and the signal (B) of the radiation 302 in the stable period. Therefore, an image obtained by subtracting the signal (R 1 ) from the signal (R 1 + B), that is, an image 304 (B) corresponding to the signal of the radiation 302 in the stable period is read out.
- the signal sample hold circuit 207S performs sampling again.
- An image (R 1 + B + R 2 ) is acquired by this sampling.
- the photoelectric conversion element 201 is reset, the noise sample hold circuit 207N performs sampling again, and the difference between the signal line 21N and the signal line 21S is read as an image.
- the noise sample hold circuit 207N holds a signal (0) in a state where no radiation is exposed.
- the signal sample hold circuit 207S holds the sum (R 1 + B + R 2 ) of the radiation 301 signal in the rising period, the radiation 302 in the stable period, and the radiation 303 signal in the falling period.
- the image 306 (R 1 + B + R 2 ) corresponding to the signal of the radiation 301 in the rising period, the signal of the radiation 302 in the stable period, and the signal of the radiation 303 in the falling period is read out. Thereafter, by calculating the difference between the image 306 and the image 304, an image 305 (R 1 + R 2 ) corresponding to the sum of the radiation 301 in the rising period and the radiation 303 in the falling period is obtained.
- the timing controller 120 determines the timing for performing sampling and resetting of the photoelectric conversion element 201 in the sample and hold circuit 207 using a synchronization signal 307 indicating that radiation exposure has been started from the radiation generation apparatus 101.
- a method for detecting the start of radiation exposure for example, the tube current of the radiation generator 101 is measured, and it is determined whether or not the measured tube current (current value) exceeds a preset threshold value.
- a method of detecting the start of exposure can be used.
- a method of detecting the start of exposure by repeatedly reading out the pixel 20 and determining whether or not the pixel value exceeds a preset threshold value can be used. .
- a method of detecting the start of exposure by incorporating a radiation detector different from the two-dimensional detector 106 in the radiation imaging apparatus 104 and determining whether or not the measured value exceeds a preset threshold value.
- a radiation detector different from the two-dimensional detector 106 in the radiation imaging apparatus 104 can be used.
- the sampling of the signal sample hold circuit 207S, the sampling of the noise sample hold circuit 207N, and the reset of the photoelectric conversion element 201 are performed after a predetermined time has elapsed since the input of the synchronization signal 307.
- control computer 103 can obtain the image 304 corresponding to the stable period of the pulsed radiation and the image 305 corresponding to the sum of the rising period and the falling period. Since the energy of radiation exposed when these two images are formed is different, energy subtraction processing can be performed using these images.
- FIG. 4 shows another example of drive timing when energy subtraction is performed in the radiation imaging system 100 according to the first embodiment.
- the driving timing shown in FIG. 3 is different in that the tube voltage of radiation is actively switched.
- the low-energy radiation 401 is exposed. Thereafter, sampling is performed by the noise sample and hold circuit 207N, and after the tube voltage is switched and the high-energy radiation 402 is exposed, sampling is performed by the signal sample and hold circuit 207S. Thereafter, the tube voltage is switched, and the low-energy radiation 403 is exposed. Further, the difference between the signal line 21N and the signal line 21S is read as an image.
- the noise sample and hold circuit 207N holds the signal (R 1 ) of the low energy radiation 401, and the signal sample and hold circuit 207S sums the signal of the low energy radiation 401 and the signal of the high energy radiation 402 ( R 1 + B) is retained. Therefore, the image 404 (B) corresponding to the signal of the high-energy radiation 402 is read out.
- the signal sample hold circuit 207S performs sampling again. Thereafter, the photoelectric conversion element 201 is reset, the noise sample hold circuit 207N performs sampling again, and the difference between the signal line 21N and the signal line 21S is read as an image. At this time, the noise sample hold circuit 207N holds a signal (0) in a state where no radiation is exposed.
- the signal sample hold circuit 207S holds the sum (R 1 + B + R 2 ) of the low energy radiation 401 signal, the high energy radiation 402 and the low energy radiation 403 signal.
- an image 406 (R 1 + B + R 2 ) corresponding to the low energy radiation 401 signal, the high energy radiation 402 signal, and the low energy radiation 403 signal is read out. Thereafter, by calculating the difference between the image 406 and the image 404, an image 405 (R 1 + R 2 ) corresponding to the sum of the low energy radiation 401 and the low energy radiation 403 is obtained.
- the synchronization signal 407 is the same as in FIG.
- the image acquisition unit 131 and the image processing unit 132 perform energy subtraction processing using a plurality of images to generate an energy subtraction image.
- sampling is performed at least twice in one two-dimensional detector 106 during a period between two consecutive resets of the image acquisition unit 131.
- the image acquisition unit 131 acquires two images having different radiation energies during the imaging period of one frame.
- the image acquisition unit 131 further performs a correction process as shown in FIG. 5 on the two acquired images, and obtains a first image and a second image that are images of attenuation ratios.
- the image processing unit 132 of the control computer 103 performs energy subtraction processing (signal processing shown in FIG. 6A) on the first image and the second image obtained by the image acquisition unit 131 to perform energy subtraction images (hereinafter, referred to as “energy subtraction images”). Process image).
- FIG. 5 is a diagram illustrating a correction process performed by the image acquisition unit 131 in the energy subtraction process according to the first embodiment.
- imaging is performed without exposing the radiation imaging apparatus 104 to radiation, and an image is acquired by the driving shown in FIG. 3 or FIG.
- two images are read out, and the first image is F_ODD and the second image is F_EVEN.
- F_ODD and F_EVEN are images corresponding to fixed pattern noise (FPN) of the radiation imaging apparatus 104.
- FPN fixed pattern noise
- radiation is applied to the radiation imaging apparatus 104 in the absence of a subject to perform imaging, and an image is acquired by the driving shown in FIG. 3 or FIG.
- two images are read out.
- the first image is W_ODD
- the second image is W_EVEN.
- W_ODD and W_EVEN are images corresponding to the sum of the FPN and radiation signals of the radiation imaging apparatus 104.
- WF_ODD is an image corresponding to the radiation 302 in the stable period in FIG. 3
- WF_EVEN is an image corresponding to the sum of the radiation 301 in the rising period, the radiation 302 in the stable period, and the radiation 303 in the falling period. Therefore, by subtracting WF_ODD from WF_EVEN, an image corresponding to the sum of the radiation in the rising period and the falling period can be obtained.
- the energy in the rising and falling periods of radiation is lower than the energy in the stable period of radiation. Therefore, by subtracting WF_ODD from WF_EVEN, a low energy image W_Low when there is no subject is obtained. Further, a high energy image W_High when there is no subject is obtained from WF_ODD.
- imaging is performed by exposing the radiation imaging apparatus 104 to radiation while the subject is present, and an image is acquired by the driving shown in FIG. 3 or FIG.
- the first image is X_ODD and the second image is X_EVEN.
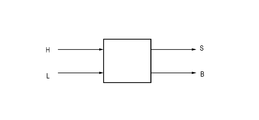
- FIG. 6A shows a block diagram of signal processing of energy subtraction processing in the image processing unit 132.
- images of bones and soft tissues are acquired as processed images from the first image and the second image that indicate attenuation rates for two types of radiation energy. That is, in the signal processing in the present embodiment, the bone thickness image B and the soft tissue image are obtained from the low energy attenuation rate image L and the high energy attenuation rate image H obtained by the correction shown in FIG.
- the thickness image S is obtained.
- the image L is also referred to as a low energy image
- the image H is also referred to as a high energy image.
- the energy of the radiation photons E, N (E) the number of photons in the energy E, B the thickness of the bone, the thickness of the soft tissue S, the linear attenuation coefficient of the energy E definitive bone mu B (E), the energy E
- the linear attenuation coefficient of soft tissue in this case is ⁇ S (E)
- the attenuation rate is I / I 0 .
- the photon number N (E) at the energy E is a spectrum of radiation.
- the spectrum of radiation is obtained by simulation or actual measurement.
- the linear attenuation coefficient ⁇ B (E) of the bone at the energy E and the linear attenuation coefficient ⁇ S (E) of the soft tissue at the energy E are obtained from a database such as NIST. That is, it is possible to calculate an arbitrary bone thickness B, soft tissue thickness S, and attenuation rate I / I 0 in a radiation spectrum N (E).
- the average energy E H in the high-energy radiation and the average energy E L in the low-energy radiation are represented by the following equations.
- the bone thickness image B and the soft tissue thickness image S are expressed by the following equations.
- the linear attenuation coefficient ⁇ (E) at energy E is a known value. Therefore, by calculating [Equation 8] for all the pixels, the bone thickness image B and the soft tissue thickness image can be obtained from the low energy attenuation image L and the high energy attenuation image H. S can be obtained. Specifically, for the logarithmic image ln (L) of the low-energy attenuation rate image L and the logarithmic image ln (H) of the high-energy attenuation rate image H, the linear attenuation coefficient ⁇ (E). Multiply by a coefficient determined by Thereby, an image B of bone thickness and an image S of soft tissue thickness are obtained.
- the coefficient in [Equation 8] is obtained from the linear attenuation coefficient in the average energies E H and E L , but the present embodiment is not limited to this.
- the user may specify the linear weakness coefficient used in [Equation 8], or may be estimated from image statistics.
- the bone thickness B and the soft tissue thickness S are calculated to simplify the description, but the present invention is not limited to such a form.
- the water thickness W and the contrast agent thickness I may be calculated.
- the signal processing in the first embodiment is processing for decomposing into the thickness of any two kinds of substances.
- the DSA processing unit 133 generates a difference image using the plurality of energy subtraction images generated by the image processing unit 132 as described above.
- digital differential angiography hereinafter referred to as DSA (digital subtraction angiography)
- DSA digital subtraction angiography
- the DSA processing unit 133 generates a difference image by DSA using the processed image obtained by the energy subtraction process.
- the first processed image (B) before and after the injection of the contrast agent is used. That is, in the first embodiment, a mask image is generated using a processed image obtained by energy subtraction processing before injection of a contrast agent. Then, a live image is generated using the processed image obtained by the energy subtraction process after the injection of the contrast agent, and a difference image (DSA image) between the mask image and the live image is generated.
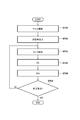
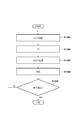
- FIG. 7 shows a flowchart according to the first embodiment.
- the image acquisition unit 131 performs imaging at the timing shown in FIG. 3 or FIG. 4 before injecting the contrast agent, by performing the correction shown in FIG. 5, a mask image H M high-energy, low acquiring a mask image L M energy (S701).
- the image acquisition unit 131 performs imaging and correction as well as during acquisition of the mask images to obtain a live image L L of the high-energy live image H L and a low energy ( S703).
- the image processing unit 132 a high energy to the mask image H M and the low energy mask image L M of the performs signal processing shown in FIG.
- the mask image S M of the bone of the mask image B M and soft tissue To separate. Further, the image processing unit 132 performs the same processing for the high-energy live image H L and the low-energy live image L L of, separating the live image S L of the live image B L and soft tissue of the bone (S704). Then, DSA processing unit 133, the bones of DSA images B DSA by subtracting the mask image B M of the bone from the live image B L of the bone, pulling the mask image S M soft tissue from the live image S L soft tissue Thus, a DSA image S DSA of the soft tissue is obtained (S705). Until the end of the process is instructed (NO in S706), a moving image combining energy subtraction and DSA can be obtained by repeatedly capturing the live image and processing the image. When the end is instructed (YES in S706), the process ends.
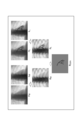
- FIG. 8 is a schematic diagram of image processing according to the first embodiment.
- FIG. 8 shows how the DSA image B DSA is generated from the bone mask image B M and the bone live image B L.
- a mask image H M high-energy, low energy mask image L M of are the images taken before injecting the contrast agent includes only information of the bone and soft tissue.
- the bone mask image B M obtained by performing energy subtraction on these mask images includes bone information
- the soft tissue mask image S M (not shown) includes soft tissue information.
- the live image L L of the high-energy live image H L and low energy are the images taken after injecting a contrast medium, containing information of the bone and soft tissue and contrast media.
- the bone live image BL includes information on bones and contrast agents
- the soft tissue live image S L (not shown) includes information on soft tissues.
- the position of the bone does not move greatly. That is, the bone information included in the bone live image B L and the bone mask image B M is substantially the same. Therefore, the bone information is canceled out in the bone DSA image B DSA , and only the contrast agent information remains. In this way, even if there is a movement due to the pulsation or breathing of the heart, only the contrast agent can be imaged to diagnose the blood vessel.
- high-energy and low-energy radiation images are acquired by using the sample-and-hold circuit.
- the present invention is not limited to such a form. Absent.
- a high-energy radiation image may be acquired by exposing a high-energy radiation to read an image and then exposing a low-energy radiation to read the image.
- the subject is used in a situation where the subject moves due to heart beat or breathing.
- a subject moves if there is a time difference between high-energy and low-energy radiographic images, there is a problem that motion artifacts occur in the image after energy subtraction. For this reason, in this embodiment, as shown in FIGS.
- high-energy and low-energy radiographic images are taken while one frame is taken (before the next reset is applied).
- imaging can be realized by using the sample hold circuit unit 207 included in the pixel 20 of the two-dimensional detector 106.
- Such photographing is referred to as time division driving.
- Time-division driving is a more desirable mode for generating a DSA image because it can reduce the time difference between radiographic images of high energy and low energy. That is, it is possible to shorten the shooting interval for obtaining images of different energies, and to obtain a DSA image with high accuracy and no artifacts.
- high energy, medium energy, and low energy radiation images may be acquired by using a sample hold circuit, and energy subtraction processing may be performed.
- a low-energy radiographic image in order to acquire radiographic images having different energies, by overlapping two FPDs, a low-energy radiographic image can be obtained with the front FPD as viewed from the radiation irradiation side, and a high-energy with the rear FPD.
- a method of acquiring a radiation image may be used. In this method, there is no time artifact between high energy and low energy radiographic images, so no motion artifacts occur.
- FPDs are stacked, radiation passes through the front FPD. There is no problem if the FPD is amorphous silicon, but in the case of crystalline silicon, there is a problem that the image quality deteriorates due to deterioration of the pixel circuit due to radiation.
- crystalline silicon FPD is more expensive than amorphous silicon. That is, stacking crystalline silicon FPDs is not desirable in terms of image quality and cost.
- an amorphous silicon FPD is more likely to cause an offset or afterimage than crystalline silicon.
- a larger offset or afterimage is generated, and an artifact is generated in the image after energy subtraction. For these reasons, it is more desirable to take high-energy and low-energy radiographic images by time-division driving according to this embodiment.
- the drive timing for acquiring the first image and the second image having different radiation energies is not limited to the drive timing shown in FIGS. Any drive timing may be used as long as the first image and the second image having different radiation energies can be acquired in the imaging period of one frame.
- images of thicknesses of two types of substances are acquired from the radiation image (H) of the attenuation rate at high energy and the radiation image (L) of the attenuation rate at low energy (for example, FIG. 6A).
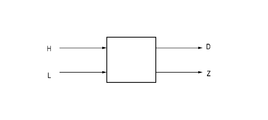
- an effective atomic number (Z) image and an area density (D) image are acquired from a high energy radiation image (H) and a low energy radiation image (L) (FIG. 6B).
- the configuration of the radiation imaging system 100 of the second embodiment and the operation of acquiring high / low energy radiation images are the same as those of the first embodiment (FIGS. 1A, 1B, 2 to 5).
- FIG. 6B is a block diagram of signal processing of energy subtraction processing by the image processing unit 132 according to the second embodiment.
- the image of the effective atomic number Z is obtained from the low-energy attenuation rate image L and the high-energy attenuation rate image H obtained by the correction processing shown in FIG.
- an image of surface density D are obtained.
- the effective atomic number Z is an equivalent atomic number of the mixture.
- the surface density D is the product of the subject density [g / cm 3 ] and the subject thickness [cm], and the dimension is [g / cm 2 ].
- the energy of radiation photons is E
- the number of photons in energy E is N (E)
- the effective atomic number is Z
- the surface density is D
- the effective atomic number Z is Z
- the mass attenuation coefficient at energy E is ⁇ (Z, E)
- the photon number N (E) at the energy E is a spectrum of radiation.
- the spectrum of radiation is obtained by simulation or actual measurement.
- the mass attenuation coefficient ⁇ (Z, E) at the effective atomic number Z and energy E can be obtained from a database such as NIST.
- [Equation 9] it is possible to calculate an arbitrary effective atomic number Z, areal density D, and attenuation rate I / I 0 in the spectrum N (E) of radiation.
- the logarithmic ratio of the attenuation rate L at low energy and the attenuation rate H at high energy is uniquely obtained from the effective atomic number. Therefore, if the inverse function is obtained, the effective atomic number Z can be obtained from the logarithm ratio of L of the attenuation rate at low energy and H of the attenuation rate at high energy.
- the surface density D can be obtained from [Equation 12].
- the image of the effective atomic number Z and the surface density D are calculated from the image L of the attenuation rate at low energy and the image H of the attenuation rate at high energy. An image can be obtained.
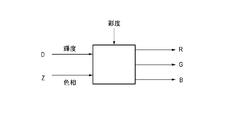
- FIG. 6C shows a block diagram of image processing of energy subtraction processing according to the second embodiment.
- a color perspective image is obtained from the image of the effective atomic number Z and the image of the surface density D obtained by the signal processing shown in FIG. 6B.
- the HLS color space is preferably used for the conversion at this time.
- the HLS color space is a color space composed of three components, hue H (Hue), saturation S (Saturation), and luminance L (Lightness).
- hue H Human
- saturation S saturation
- luminance L Lightness
- the flowchart according to the second embodiment is the same as FIG. However, the energy subtraction (S704) and the DSA processing method (S705) are different.
- the image acquisition unit 131 performs imaging at timing shown in FIG 3 or FIG 4 before injecting the contrast agent, by performing the correction shown in FIG. 5, a mask image H M high-energy, low to get the mask image L M of energy.
- the image acquisition unit 131 after which a contrast agent is injected, corrects the shooting in the same manner as described above, to obtain the live image L L of the high-energy live image H L and low energy.
- the image processing unit 132 performs signal processing shown in FIG.
- the image processing unit 132 performs the same processing for the high-energy live image H L and the low-energy live image L L of, the mask image D L of the live image Z L and the surface density of the effective atomic number To separate.
- the relationship between the images is expressed by the following [Equation 17].
- DSA processing unit 133 by using the number 18, obtaining a DSA image Z DSA of DSA images D DSA and the effective atomic number of the surface density. That is, the DSA image of the effective atomic number is acquired based on the mask image and live image (D M and D L ) of the surface density and the mask image and live image (Z M and Z L ) of the effective atomic number. It should be noted, may be obtained DSA image Z DSA of the effective atomic number by, for example, simply subtracting the mask image Z M of the effective atomic number from the live image Z L of the effective atomic number. Finally, the color DSA image C DSA is obtained by performing the image processing of FIG. 10 on the surface density DSA image D DSA and the effective atomic number DSA image Z DSA . By repeating such live image capturing and image processing, a color moving image combining energy subtraction and DSA can be obtained.
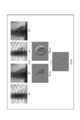
- FIG. 9 is a schematic diagram of image processing according to the second embodiment.
- the organ moves between the mask image and the live image due to the pulsation or breathing of the heart, but the bone position does not move greatly.
- the DSA image D DSA of the surface density changes with respect to the portion where the organ has moved, but the DSA image Z DSA of the effective atomic number does not change much.
- the DSA image D DSA of the surface density and the DSA image Z DSA of the effective atomic number change. Accordingly, only the information about the contrast agent remains in the DSA image Z DSA of the effective atomic number. This may be displayed as it is.
- a new DSA image may be generated by using the effective atomic number DSA image Z DSA and the surface density DSA image D DSA .
- threshold values are set for the pixel values of the DSA image Z DSA s of effective atomic number and the DSA image D DSA of surface density, respectively, and after the pixel value is clipped to 0 when below the threshold value, A process such as multiplication is preferably used.
- it may generate a color of DSA image C DSA obtained by performing image processing of FIG. 6C.
- both the change in the surface density and the change in the effective atomic number are used, only the contrast agent can be imaged more accurately. In this way, even if there is a movement due to the pulsation or breathing of the heart, only the contrast agent can be imaged to diagnose the blood vessel.
- the effective atomic number (type) of the substance inserted after acquisition of the mask image can be measured. That is, there is an advantage that the contrast agent (iodine) and the catheter or stent (iron) can be identified using the effective atomic number. Further, a portion where the position of the bone is slightly shifted due to breathing or the like can be regarded as a bone inserted after acquisition of the mask image. Therefore, it is possible to identify the contrast agent (iodine) and bone (calcium) using the effective atomic number and to image only the contrast agent.
- time-division driving in order to obtain images of attenuation rates due to two different radiation energies. It is not something that can be done.
- images of attenuation rates due to two different radiation energies may be obtained by methods other than time-division driving.
- a mask image is generated by performing imaging before injecting a contrast medium.
- a mask image is generated based on processed images of a plurality of frames past the current frame among the processed images obtained by the energy subtraction process.
- a DSA image that is a difference image from the mask image is generated using the processed image of the current frame as a live image.
- the image processing unit 132 performs energy subtraction processing using a plurality of images with different radiation energies to generate an energy subtraction image.
- the DSA processing unit 133 generates a difference image between a mask image based on a plurality of energy subtraction images generated in the past and a live image based on the current energy subtraction image.
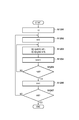
- FIG. 10 shows a flowchart according to the third embodiment.
- the mask image is not taken, and it does not matter whether or not a contrast medium is injected.
- the image acquisition unit 131 acquires a live image L L of the high-energy live image H L and a low energy (S1001).
- the image processing unit 132 high energy performs signal processing shown in FIG. 6A against live image H L and the low-energy live image L L of the live image S L of the live image B L and soft tissue of the bone (S1002).
- a moving image is obtained by repeatedly performing such live image capturing and energy subtraction processing.
- the live image of the bone of the current frame is B L [0]
- the live image of the bone n frames before is B L [ ⁇ n].
- n is an integer of 2 or more.
- the DSA processing unit 133 uses the n images from the live image B L [ ⁇ n] of the bone before n frames to the live image B L [ ⁇ 1] of the bone before one frame to use the bone mask image B M is generated (S1003).
- DSA processing unit 133 live bone of the current frame image B L [0] as a live image B L of the bone, from the live image B L of the bone of the bone by subtracting the mask image B M of the bone DSA image B DSA is obtained (S1004).
- FIG. 11 is a schematic diagram of image processing according to the third embodiment.
- a live image is taken while injecting a contrast medium into the coronary artery of the heart.
- the high-energy live image H L and the low-energy live image L L include information on bone, soft tissue, and contrast medium.
- information on the contrast agent which is the third type of substance, appears in the live bone image BL . That is, the bone live image BL may include information on bones and contrast media.
- the contrast agent since the blood vessel moves with the pulsation of the heart, the contrast agent also moves together with the blood vessel.
- bones do not move with the heartbeat. That is, when attention is paid to the time series of a certain pixel of the bone live image BL , there are a frame including only bone information and a frame including bone and contrast medium information. Specifically, when a blood vessel into which a contrast medium has been injected crosses a certain pixel, the pixel value of the bone live image BL increases by the amount of the contrast medium. Therefore, in the n images from the live image B L [ ⁇ n] of the bone n frames before to the live image B L [ ⁇ 1] of the bone 1 frame before, the moving contrast is obtained when the minimum value is taken for each pixel.
- the drug information is removed, leaving only the bone information that does not move.
- a bone DSA image B DSA is obtained.
- Bone DSA image B In the DSA the bone information is canceled and only the contrast agent information remains. In this way, even when there is movement due to the pulsation of the heart, only the contrast medium can be imaged and blood vessels can be diagnosed.
- FIG. 11 of the third embodiment it is assumed that a live image is taken while injecting a contrast medium into the coronary artery of the heart, but the present embodiment is not limited to such a case.
- a case where the image is taken while inserting a guide wire or a stent into the coronary artery of the heart can be considered.
- the blood vessel moves with the pulsation of the heart, so that the guide wire and the stent inserted through the blood vessel also move. Therefore, when energy subtraction is performed on a live image obtained by imaging, information on a guide wire and a stent (iron), which are the third type of substance, appears in the live bone image BL .
- the moving guide is obtained by taking the minimum value for each pixel.
- Wire and stent information is removed, leaving only bone information that does not move. Accordingly, in the bone DSA image B DSA , the bone information is canceled and only the information of the guide wire and the stent remains. That is, a guide wire or a stent can be selectively imaged.
- the stent when the endovascular surgery is completed and the stent is placed in the coronary artery, the stent is selectively imaged, or when calcification (calcium) is deposited in the coronary artery of the heart
- a form in which calcification is selectively imaged is preferably used.
- the coronary artery of the heart is imaged.
- the present invention is not limited to such a form.
- the diaphragm and the intestine move by applying to such a situation, it is possible to selectively image a contrast agent, a stent, and calcification.
- a bone mask image BM is generated by taking a minimum value for each pixel in a plurality of past frames.
- the present embodiment is not limited to such a form.
- a bone mask image B M may be generated by calculating a statistic such as a maximum value, an average value, or a median value for each pixel. . Further, the bone mask image B M may be generated by removing abnormal values for each pixel.
- a bone mask image B M may be generated by applying a recursive filter to the live bone image B L. As described above, the bone mask image B M may be generated by an arbitrary method from the live images B L of a plurality of past frames.
- the mask image S M soft tissue may be generated from the live image S L soft tissue of the past several frames.
- the third embodiment even when separated from the live image L L of the high-energy live image H L and a low energy to the image D in the image Z and the surface density of the effective atomic number, the third embodiment The above processing can be applied.
- the mask image Z M of the effective atomic number from the live image Z L of the effective atomic number of a plurality of past frames generates a mask image D M of surface density from the live image D L of the surface density of a plurality of past frames You just have to do it.
- an image obtained by energy subtraction from a plurality of radiation images having different energy is used as a live image after energy subtraction.
- a mask image after energy subtraction is generated from a live image after energy subtraction of a plurality of past frames.
- a DSA image after energy subtraction is generated by subtracting the mask image after energy subtraction generated as described above from the live image after energy subtraction of the current frame. Therefore, even if a moving object other than soft tissue such as a stent or calcification exists in the mask image, the occurrence of artifacts in the DSA image can be reduced.
- the first substance is obtained from the high energy image and the low energy image in consideration of the change in attenuation rate caused by the change in the thickness of the bone that is the first substance and the soft tissue that is the second substance. And obtaining the thickness of the second substance. That is, the bone thickness B and the soft tissue thickness S are obtained by solving the nonlinear simultaneous equations of [Equation 4] as described below.
- the configuration and operation of the radiation imaging system 100 of the fourth embodiment are the same as those of the first to third embodiments.
- the Newton-Raphson method is used as a typical method for solving the nonlinear simultaneous equations.
- the number of iterations of the Newton-Raphson method is m
- the bone thickness after the m-th iteration is B m
- the soft tissue thickness after the m-th iteration is S m
- the high energy after the m-th iteration is The attenuation rate H m and the low energy attenuation rate L m after the m-th iteration are expressed by the following equations.
- the bone thickness B m + 1 and the soft tissue thickness S m + 1 after the m + 1th iteration are expressed by the following equations using the high energy attenuation rate H and the low energy attenuation rate L.
- the inverse matrix of the 2 ⁇ 2 matrix is expressed by the following expression from the Kramer formula, where det is the determinant.
- the effective atomic number after the m-th iteration is Z m
- the surface density after the m-th iteration is D m
- the low energy attenuation rate L m after the m-th iteration is expressed by the following equation.
- the change rate of the attenuation rate when the effective atomic number and the surface density are slightly changed is expressed by the following formula.
- the bone thickness B m + 1 and the soft tissue thickness S m + 1 after the m + 1th iteration are expressed by the following equations using the high energy attenuation rate H and the low energy attenuation rate L.
- the inverse matrix of the 2 ⁇ 2 matrix is expressed by the following expression from the Kramer formula, where det is the determinant.
- the present invention is not limited to such a form.
- an iterative solution such as a least square method or a bisection method may be used.
- the initial values of the bone thickness B 0 and the soft tissue thickness S 0 after the 0th iteration that is, the bone thickness and the soft tissue thickness are required.
- An arbitrary constant may be given as the initial value.
- a configuration in which the bone thickness and the soft tissue thickness are obtained using [Equation 8] obtained by approximating the spectrum of radiation with monochromatic radiation, and these values are used as initial values is preferably used.
- the effective atomic number and the surface density D shown in the second embodiment are obtained using [Equation 14] that approximates the spectrum of the radiation with monochromatic radiation, and these are the initial values.
- a configuration with values is preferably used.
- a table is generated by previously obtaining the bone thickness B and the soft tissue thickness S for various combinations of the high energy attenuation rate H and the low energy attenuation rate L, and referring to this table, The thickness B and the soft tissue thickness S may be obtained at high speed.
- FIG. 12 shows a flowchart of table generation in the fourth embodiment.
- the number of table divisions is M
- the low energy coordinates of the table are l
- the high energy coordinates of the table are h.
- the table coordinates l and h are integers.
- control computer 103 obtains the low energy attenuation rate L [l] at the coordinate l and the high energy attenuation rate H [h] at the coordinate h by the following equations.
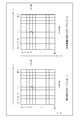
- FIG. 13 shows a schematic diagram of table reference in the fourth embodiment.
- This table is a two-dimensional table in which the bone and soft tissue thicknesses are registered according to the combination of the attenuation rate indicated by the high energy image and the attenuation rate indicated by the low energy image. Assume that the low energy attenuation rate is L and the high energy attenuation rate is H in a certain pixel. At this time, the attenuation rate is converted into table coordinates l ′ and h ′ by the following equation.
- the bone thickness B can be obtained by referring to the table B [l, h] for the bone thickness B using the coordinates.
- the coordinates 1 ′ and h ′ of the table are decimal numbers, but since the table is stored in the array, it can be referred to only if it is an integer. Therefore, a configuration in which the coordinates l ′ and h ′ are converted into integers and then the bone thickness B and the soft tissue thickness S are obtained by interpolation is preferably used.
- a value obtained by rounding down the decimal point of the coordinate l ′ into an integer is l
- a value obtained by rounding down the decimal point of the coordinate h ′ and converting into an integer is h
- the bone thickness B and the soft tissue thickness S are obtained by bilinear interpolation.
- the following formula is used.
- the bone thickness B and the soft tissue thickness S can be obtained with a much smaller amount of calculation than when the nonlinear simultaneous equations are solved.
- Such a table is effective as long as the spectrum N (E) of radiation does not change.
- the radiation spectrum N (E) does not change during moving image shooting, it is sufficient to generate a table once before shooting.
- the generation and reference of the tables shown in FIGS. 12 and 13 can be similarly used for the calculation for obtaining the thicknesses of two arbitrary substances.
- the low energy attenuation rate L [l] at the coordinate l and the high energy attenuation rate H [h] at the coordinate h are obtained using the equation (29).
- the vertical axis coordinate is the high energy attenuation rate H and the horizontal coordinate is the low energy attenuation rate L, but the table has an attenuation rate between 0 and 1 at equal intervals.
- the attenuation rate with respect to the composition and thickness of the human body is often a value near zero. For this reason, if the table division number M is small, there is a disadvantage that an error between a value obtained by referring to the table and interpolation and a value obtained by solving the nonlinear simultaneous equations becomes large. Therefore, when the constant for determining the coordinate range is k (0 ⁇ k), a configuration for obtaining the attenuation rate using the following formula is preferably used.
- [Table 31] is used for table reference and interpolation.
- the coordinate on the vertical axis is ⁇ ln (H)
- the coordinate on the horizontal axis is ⁇ ln (L). Therefore, even when the attenuation rate value is close to 0, the error between the value obtained by referring to the table and interpolation and the value obtained by solving the nonlinear simultaneous equations can be reduced.
- a combination of a high energy attenuation rate H and a low energy attenuation rate L without a solution may occur.
- the high energy attenuation rate H is usually greater than the low energy attenuation rate L. Therefore, in the table generated using [Equation 29] and [Equation 32], the solution of the region where H ⁇ L cannot be obtained.
- coordinates may be selected so as to reduce the area where no solution is obtained on the table.
- the vertical axis coordinate may be ln (L) / ln (H)
- the horizontal axis coordinate may be -ln (H).
- a coordinate of the vertical axis a value solved by approximating with monochromatic radiation such as [Equation 8] or [Equation 14] may be used.
- a table in the fourth embodiment there is a possibility that coordinates outside the range of the table are designated, or an area where no solution is obtained may be referred to. In such a case, a configuration using the value of the area around the designated coordinates where the solution exists is preferably used.
- image processing is performed in the order in which DSA is performed after performing energy subtraction as shown in FIG.
- the energy subtraction may be performed after the DSA is performed.
- the thickness B and the soft tissue thickness S are expressed by the following equations.
- the result of performing the DSA by subtracting the mask image from the live image after performing the energy subtraction matches the result of performing the energy subtraction after performing the DSA by dividing the live image by the mask image.
- the nonlinear simultaneous equations are solved for each pixel as in the fourth embodiment, or in the configuration in which the table is generated after being solved in advance, such an unordered operation is not guaranteed. That is, when energy subtraction is performed after performing DSA, there is a problem that an error increases.
- the non-linear equation is solved for each pixel and the DSA is performed after performing the energy subtraction, there is a problem that the calculation amount increases although the error is reduced.
- a table indicating the correspondence between the pixel values at different energies and the pixel values after energy subtraction is generated. It is desirable to put.
- the image processing unit 132 refers to the table thus generated to generate an image after energy subtraction, and the DSA processing unit 133 performs DSA using the image after energy subtraction.
- the radiation imaging apparatus 104 is an indirect radiation sensor using a phosphor, but is not limited to such a form.
- a direct radiation sensor using a direct conversion material such as CdTe may be used.
- the passive tube voltage change of the radiation generating apparatus 101 is used or the tube voltage is actively switched.
- the present invention is not limited to such a form.
- the energy of the radiation exposed to the radiation imaging apparatus 104 may be changed by switching the filter of the radiation generating apparatus 101 with time.
- energy subtraction is performed by changing the energy of radiation exposed to the radiation imaging apparatus 104.
- the present invention is not limited to such a form.
- a method of changing the spectrum of radiation detected by the front sensor and the rear sensor by stacking two sensors may be used.
- a plurality of images having different energies may be acquired by using a photon counting type sensor that counts the number of radiation quanta by energy.
- the energy subtraction process is performed using the control computer 103 of the radiation imaging system, but the present invention is not limited to such a form.
- An image acquired by the control computer 103 may be transferred to another computer to perform energy subtraction processing.
- a configuration in which an acquired image is transferred to another personal computer via a medical PACS and displayed after performing energy subtraction processing is preferably used. That is, in each of the above embodiments, it is only necessary to provide radiation images having different energies to the energy subtraction process, and a method for acquiring radiographic images having different energies is not limited to the above embodiment.
- the present invention supplies a program that realizes one or more functions of the above-described embodiments to a system or apparatus via a network or a storage medium, and one or more processors in a computer of the system or apparatus read and execute the program
- This process can be realized. It can also be realized by a circuit (for example, ASIC) that realizes one or more functions.
Abstract
A photography control device that: acquires a plurality of images that are products of different radiation energies and have been obtained as a result of a subject being irradiated with radiation of variable energy during one shot and radiation that has passed through the subject during the one shot being detected multiple times; uses the plurality of acquired images to perform energy subtraction processing and generate a plurality of energy subtraction images; and uses the generated energy subtraction images to a generate a difference image.
Description
本発明は、放射線撮影システム、撮影制御装置及び方法に関する。
The present invention relates to a radiation imaging system, an imaging control apparatus, and a method.
現在、放射線による医療画像診断や非破壊検査に用いる撮影装置として、半導体材料によって形成された平面検出器(Flat Panel Detector、以下FPDと略す)を用いた放射線撮影装置が普及している。このような放射線撮影装置は、例えば医療画像診断においては、一般撮影のような静止画撮影や、透視撮影のような動画撮影のデジタル撮影装置として用いられている。
At present, as imaging apparatuses used for medical image diagnosis and non-destructive inspection using radiation, radiation imaging apparatuses using a flat panel detector (hereinafter referred to as FPD) made of a semiconductor material are widely used. For example, in medical image diagnosis, such a radiographic apparatus is used as a digital imaging apparatus for still image shooting such as general shooting or moving image shooting such as fluoroscopic shooting.
FPDを用いた動画撮影として、造影剤を注入しながら撮影を行う血管造影や、カテーテルやステント等の医療デバイスを用いた血管内治療が盛んに行われている。この造影の方法の一つに、デジタル差分造影法(以下、DSA(digital subtraction angiography))がある。DSAでは、造影剤の注入前に撮影を行ってマスク画像を取得した後、造影剤の注入後に撮影を行ってライブ画像を取得する。マスク画像とライブ画像を用いた演算により、造影剤のみを画像化して血管の診断を行うことができる。
As a moving image photographing using FPD, angiography for photographing while injecting a contrast agent and endovascular treatment using a medical device such as a catheter or a stent are actively performed. As one of the contrast methods, there is a digital difference contrast method (hereinafter referred to as DSA (digital subtraction angiography)). In DSA, a mask image is obtained by imaging before injection of a contrast agent, and then a live image is obtained by imaging after injection of the contrast agent. By calculation using a mask image and a live image, only a contrast medium can be imaged to diagnose a blood vessel.
一方、FPDを用いた撮影方法のひとつに、エネルギーサブトラクションがある。エネルギーサブトラクションでは、まず、管電圧の異なる放射線を複数回照射するなどして、エネルギーの異なる画像を複数枚取得する。それらを演算することで、骨画像と軟部組織画像に分離するなどの処理を行うことができる。これにより造影剤のみを画像化することで、動く対象の血管を診断する方法が提案されている(特許文献1)。
On the other hand, one of the imaging methods using FPD is energy subtraction. In energy subtraction, first, a plurality of images having different energies are acquired by, for example, irradiating a plurality of radiations having different tube voltages. By calculating them, processing such as separation into a bone image and a soft tissue image can be performed. Thus, a method for diagnosing a moving target blood vessel by imaging only a contrast medium has been proposed (Patent Document 1).
特許文献1で生成された画像を用いてDSAを適用すると、マスク画像に動く物体(ステント、石灰化など)がある場合、ライブ画像とマスク画像の差分を取った際にアーチファクトが生じてしまう。
When DSA is applied using an image generated in Patent Document 1, if there is a moving object (stent, calcification, etc.) in the mask image, an artifact will occur when the difference between the live image and the mask image is taken.
本発明の一態様による撮影制御装置は以下の構成を備える。すなわち、
1ショット間にエネルギーが変化する放射線が被写体に照射され、当該1ショット間に前記被写体を透過した前記放射線を複数回検出して得られた、互いに異なる放射線エネルギーによる複数の画像を取得する取得手段と、
複数の画像を用いてエネルギーサブトラクション処理を行い、エネルギーサブトラクション画像を生成する第1の生成手段と、
前記第1の生成手段で生成された複数のエネルギーサブトラクション画像を用いて差分画像を生成する第2の生成手段と、を備える。 An imaging control apparatus according to an aspect of the present invention has the following configuration. That is,
Acquisition means for acquiring a plurality of images with different radiation energies obtained by irradiating a subject with radiation whose energy changes during one shot and detecting the radiation transmitted through the subject a plurality of times during the one shot When,
First generation means for performing energy subtraction processing using a plurality of images and generating an energy subtraction image;
Second generating means for generating a difference image using a plurality of energy subtraction images generated by the first generating means.
本発明によれば、差分による画像生成においてアーチファクトの発生をより低減することができる。
According to the present invention, it is possible to further reduce the occurrence of artifacts in image generation based on differences.
本発明のその他の特徴及び利点は、添付図面を参照とした以下の説明により明らかになるであろう。なお、添付図面においては、同じ若しくは同様の構成には、同じ参照番号を付す。
Other features and advantages of the present invention will become apparent from the following description with reference to the accompanying drawings. In the accompanying drawings, the same or similar components are denoted by the same reference numerals.
以下、本発明の実施形態について図面を参照しながら詳細に説明する。なお、以下の実施形態において、放射線という用語は、X線の他、例えば、α線、β線、γ線粒子線、宇宙線などを含み得る。
Hereinafter, embodiments of the present invention will be described in detail with reference to the drawings. In the following embodiments, the term “radiation” may include, for example, α rays, β rays, γ ray particle beams, cosmic rays, and the like in addition to X rays.
<第1実施形態>
図1Aは、第1実施形態に係る放射線撮影システム100の構成例を示すブロック図である。第1実施形態の放射線撮影システム100は、放射線発生装置101、放射線制御装置102、制御用コンピュータ103、放射線撮影装置104を備える。 <First Embodiment>
FIG. 1A is a block diagram illustrating a configuration example of aradiation imaging system 100 according to the first embodiment. A radiation imaging system 100 according to the first embodiment includes a radiation generation apparatus 101, a radiation control apparatus 102, a control computer 103, and a radiation imaging apparatus 104.
図1Aは、第1実施形態に係る放射線撮影システム100の構成例を示すブロック図である。第1実施形態の放射線撮影システム100は、放射線発生装置101、放射線制御装置102、制御用コンピュータ103、放射線撮影装置104を備える。 <First Embodiment>
FIG. 1A is a block diagram illustrating a configuration example of a
放射線発生装置101は放射線制御装置102の制御下で放射線を発生する。制御用コンピュータ103は、放射線制御装置102を制御して放射線を曝射させるとともに、放射線撮影装置104を制御して画像情報を取得する撮影制御装置として機能する。制御用コンピュータ103は、例えば、不図示の1つまたは複数のプロセッサ(CPU)、メモリを有し、1つまたは複数のプロセッサがメモリに格納されたプログラムを実行することで各種処理を実行する。放射線撮影装置104は、放射線を可視光に変換する蛍光体105と、可視光を検出する二次元検出器106を備えている。二次元検出器106は、放射線量子を検出する画素20をX列×Y行のアレイ状に配置したセンサであり、画像情報を出力する。
The radiation generator 101 generates radiation under the control of the radiation controller 102. The control computer 103 functions as an imaging control apparatus that controls the radiation control apparatus 102 to emit radiation and controls the radiation imaging apparatus 104 to acquire image information. The control computer 103 includes, for example, one or more processors (CPU) (not shown) and a memory, and the one or more processors execute various processes by executing programs stored in the memory. The radiation imaging apparatus 104 includes a phosphor 105 that converts radiation into visible light, and a two-dimensional detector 106 that detects visible light. The two-dimensional detector 106 is a sensor in which pixels 20 that detect radiation quanta are arranged in an array of X columns × Y rows, and outputs image information.
図2に、第1実施形態に係る画素20の等価回路図を示す。画素20は、光電変換素子201と、出力回路部202とを含む。光電変換素子201は、典型的にはフォトダイオードである。出力回路部202は、増幅回路部204、クランプ回路部206、サンプルホールド回路部207、選択回路部208を含む。
FIG. 2 shows an equivalent circuit diagram of the pixel 20 according to the first embodiment. The pixel 20 includes a photoelectric conversion element 201 and an output circuit unit 202. The photoelectric conversion element 201 is typically a photodiode. The output circuit unit 202 includes an amplifier circuit unit 204, a clamp circuit unit 206, a sample hold circuit unit 207, and a selection circuit unit 208.
光電変換素子201は、電荷蓄積部を含む。この電荷蓄積部は、増幅回路部204のMOSトランジスタ204aのゲートに接続されている。MOSトランジスタ204aのソースは、MOSトランジスタ204bを介して電流源204cに接続されている。MOSトランジスタ204aと電流源204cとによってソースフォロア回路が構成されている。MOSトランジスタ204bは、そのゲートに供給されるイネーブル信号ENがアクティブレベルになるとオンしてソースフォロア回路を動作状態にするイネーブルスイッチである。
The photoelectric conversion element 201 includes a charge storage unit. This charge storage section is connected to the gate of the MOS transistor 204a of the amplifier circuit section 204. The source of the MOS transistor 204a is connected to the current source 204c through the MOS transistor 204b. The MOS transistor 204a and the current source 204c constitute a source follower circuit. The MOS transistor 204b is an enable switch that is turned on when the enable signal EN supplied to the gate thereof becomes an active level to bring the source follower circuit into an operating state.
図2に示す例では、光電変換素子201の電荷蓄積部およびMOSトランジスタ204aのゲートが共通のノードを構成していて、このノードは、電荷蓄積部に蓄積された電荷を電圧に変換する電荷電圧変換部として機能する。即ち、電荷電圧変換部には、電荷蓄積部に蓄積された電荷Qと電荷電圧変換部が有する容量値Cとによって定まる電圧V(=Q/C)が現れる。電荷電圧変換部は、リセットスイッチ203を介してリセット電位Vresに接続されている。リセット信号PRESがアクティブレベルになると、リセットスイッチ203がオンして、電荷電圧変換部の電位がリセット電位Vresにリセットされる。
In the example shown in FIG. 2, the charge storage portion of the photoelectric conversion element 201 and the gate of the MOS transistor 204a constitute a common node, and this node is a charge voltage that converts the charge stored in the charge storage portion into a voltage. Functions as a conversion unit. That is, the voltage V (= Q / C) determined by the charge Q stored in the charge storage unit and the capacitance value C of the charge voltage conversion unit appears in the charge voltage conversion unit. The charge-voltage converter is connected to the reset potential Vres via the reset switch 203. When the reset signal PRES becomes active level, the reset switch 203 is turned on, and the potential of the charge-voltage converter is reset to the reset potential Vres.
クランプ回路部206は、リセットした電荷電圧変換部の電位に応じて増幅回路部204によって出力されるノイズをクランプ容量206aによってクランプする。つまり、クランプ回路部206は、光電変換素子201で光電変換により発生した電荷に応じてソースフォロア回路から出力された信号から、ノイズをキャンセルするための回路である。このノイズはリセット時のkTCノイズを含む。クランプは、クランプ信号PCLをアクティブレベルにしてMOSトランジスタ206bをオン状態にした後に、クランプ信号PCLを非アクティブレベルにしてMOSトランジスタ206bをオフ状態にすることによってなされる。クランプ容量206aの出力側は、MOSトランジスタ206cのゲートに接続されている。MOSトランジスタ206cのソースは、MOSトランジスタ206dを介して電流源206eに接続されている。MOSトランジスタ206cと電流源206eとによってソースフォロア回路が構成されている。MOSトランジスタ206dは、そのゲートに供給されるイネーブル信号EN0がアクティブレベルになるとオンしてソースフォロア回路を動作状態にするイネーブルスイッチである。
The clamp circuit unit 206 clamps the noise output from the amplifier circuit unit 204 by the clamp capacitor 206a according to the reset potential of the charge-voltage conversion unit. That is, the clamp circuit unit 206 is a circuit for canceling noise from the signal output from the source follower circuit in accordance with the electric charge generated by the photoelectric conversion in the photoelectric conversion element 201. This noise includes kTC noise at reset. Clamping is performed by setting the clamp signal PCL to the active level to turn the MOS transistor 206b on, and then setting the clamp signal PCL to the inactive level to turn the MOS transistor 206b off. The output side of the clamp capacitor 206a is connected to the gate of the MOS transistor 206c. The source of the MOS transistor 206c is connected to the current source 206e via the MOS transistor 206d. The MOS transistor 206c and the current source 206e constitute a source follower circuit. MOS transistor 206d is an enable switch enable signal EN 0 applied to its gate to the source follower circuit is turned on when an active level to the operating state.
光電変換素子201で光電変換により発生した電荷に応じてクランプ回路部206から出力される信号は、光信号として、光信号サンプリング信号TSがアクティブレベルになることによってスイッチ207Saを介して容量207Sbに書き込まれる。電荷電圧変換部の電位をリセットした直後にMOSトランジスタ206bをオン状態とした際にクランプ回路部206から出力される信号は、クランプ電圧である。ノイズ信号は、ノイズサンプリング信号TNがアクティブレベルになることによってスイッチ207Naを介して容量207Nbに書き込まれる。このノイズ信号には、クランプ回路部206のオフセット成分が含まれる。スイッチ207Saと容量207Sbによって信号サンプルホールド回路207Sが構成され、スイッチ207Naと容量207Nbによってノイズサンプルホールド回路207Nが構成される。以上のように、サンプルホールド回路部207は、信号サンプルホールド回路207Sとノイズサンプルホールド回路207Nとを含む。
A signal output from the clamp circuit unit 206 according to the electric charge generated by the photoelectric conversion in the photoelectric conversion element 201 is written as an optical signal into the capacitor 207Sb via the switch 207Sa when the optical signal sampling signal TS becomes an active level. It is. A signal output from the clamp circuit 206 when the MOS transistor 206b is turned on immediately after resetting the potential of the charge-voltage converter is a clamp voltage. The noise signal is written to the capacitor 207Nb via the switch 207Na when the noise sampling signal TN becomes an active level. This noise signal includes an offset component of the clamp circuit unit 206. The switch 207Sa and the capacitor 207Sb constitute a signal sample / hold circuit 207S, and the switch 207Na and the capacitor 207Nb constitute a noise sample / hold circuit 207N. As described above, the sample hold circuit unit 207 includes the signal sample hold circuit 207S and the noise sample hold circuit 207N.
信号線21は、信号線21Sと信号線21Nを含む。駆動回路部が行選択信号をアクティブレベルに駆動すると、容量207Sbに保持された信号(光信号)がMOSトランジスタ208Saおよび行選択スイッチ208Sbを介して信号線21Sに出力される。また、同時に、容量207Nbに保持された信号(ノイズ)がMOSトランジスタ208Naおよび行選択スイッチ208Nbを介して信号線21Nに出力される。MOSトランジスタ208Saは、信号線21Sに設けられた不図示の定電流源とソースフォロア回路を構成する。同様に、MOSトランジスタ208Naは、信号線21Nに設けられた不図示の定電流源とソースフォロア回路を構成する。MOSトランジスタ208Saと行選択スイッチ208Sbによって信号用選択回路部208Sが構成され、MOSトランジスタ208Naと行選択スイッチ208Nbによってノイズ用選択回路部208Nが構成される。選択回路部208は、信号用選択回路部208Sとノイズ用選択回路部208Nとを含む。
The signal line 21 includes a signal line 21S and a signal line 21N. When the drive circuit unit drives the row selection signal to the active level, the signal (optical signal) held in the capacitor 207Sb is output to the signal line 21S via the MOS transistor 208Sa and the row selection switch 208Sb. At the same time, a signal (noise) held in the capacitor 207Nb is output to the signal line 21N via the MOS transistor 208Na and the row selection switch 208Nb. The MOS transistor 208Sa constitutes a constant current source (not shown) and a source follower circuit provided on the signal line 21S. Similarly, the MOS transistor 208Na constitutes a constant current source (not shown) provided on the signal line 21N and a source follower circuit. The MOS transistor 208Sa and the row selection switch 208Sb constitute a signal selection circuit unit 208S, and the MOS transistor 208Na and the row selection switch 208Nb constitute a noise selection circuit unit 208N. The selection circuit unit 208 includes a signal selection circuit unit 208S and a noise selection circuit unit 208N.
画素20は、隣接する複数の画素20の光信号を加算する加算スイッチ209Sを有してもよい。加算モード時には、加算モード信号ADDがアクティブレベルになり、加算スイッチ209Sがオン状態になる。これにより、隣接する画素20の容量207Sbが加算スイッチ209Sによって相互に接続されて、光信号が平均化される。同様に、画素20は、隣接する複数の画素20のノイズを加算する加算スイッチ209Nを有してもよい。加算スイッチ209Nがオン状態になると、隣接する画素20の容量207Nbが加算スイッチ209Nによって相互に接続されて、ノイズが平均化される。加算部209は、加算スイッチ209Sと加算スイッチ209Nを含む。
The pixel 20 may include an addition switch 209 </ b> S that adds the optical signals of the plurality of adjacent pixels 20. In the addition mode, the addition mode signal ADD becomes an active level, and the addition switch 209S is turned on. Thereby, the capacitors 207Sb of the adjacent pixels 20 are connected to each other by the addition switch 209S, and the optical signals are averaged. Similarly, the pixel 20 may include an addition switch 209N that adds noises of a plurality of adjacent pixels 20. When the addition switch 209N is turned on, the capacitors 207Nb of the adjacent pixels 20 are connected to each other by the addition switch 209N, and noise is averaged. The adding unit 209 includes an addition switch 209S and an addition switch 209N.
画素20は、感度を変更するための感度変更部205を有してもよい。画素20は、例えば、第1感度変更スイッチ205aおよび第2感度変更スイッチ205'a、並びにそれらに付随する回路素子を含みうる。第1変更信号WIDEがアクティブレベルになると、第1感度変更スイッチ205aがオンして、電荷電圧変換部の容量値に第1付加容量205bの容量値が追加される。これによって画素20の感度が低下する。第2変更信号WIDE2がアクティブレベルになると、第2感度変更スイッチ205'aがオンして、電荷電圧変換部の容量値に第2付加容量205'bの容量値が追加される。これによって画素20の感度が更に低下する。このように画素20の感度を低下させる機能を追加することによって、より大きな光量を受光することが可能となり、ダイナミックレンジを広げることができる。第1変更信号WIDEがアクティブレベルになる場合には、イネーブル信号ENnをアクティブレベルにして、MOSトランジスタ204aに変えてMOSトランジスタ204'aをソースフォロア動作させてもよい。MOSトランジスタ204'bは、そのゲートに供給されるイネーブル信号ENnがアクティブレベルになるとオンしてソースフォロア回路を動作状態にするイネーブルスイッチである。
The pixel 20 may include a sensitivity changing unit 205 for changing the sensitivity. The pixel 20 can include, for example, a first sensitivity change switch 205a and a second sensitivity change switch 205′a, and circuit elements associated therewith. When the first change signal WIDE becomes active level, the first sensitivity change switch 205a is turned on, and the capacitance value of the first additional capacitor 205b is added to the capacitance value of the charge-voltage converter. This reduces the sensitivity of the pixel 20. When the second change signal WIDE2 becomes an active level, the second sensitivity change switch 205′a is turned on, and the capacitance value of the second additional capacitor 205′b is added to the capacitance value of the charge-voltage converter. This further decreases the sensitivity of the pixel 20. By adding a function for reducing the sensitivity of the pixel 20 in this way, it becomes possible to receive a larger amount of light and to expand the dynamic range. If the first change signal WIDE becomes active level, and the enable signal EN n to the active level, the MOS transistor 204'a may be a source follower operation in place of the MOS transistor 204a. The MOS transistor 204′b is an enable switch that is turned on when the enable signal EN n supplied to the gate thereof becomes an active level and puts the source follower circuit into an operating state.
放射線撮影装置104は、以上のような画素回路の出力を、不図示のAD変換器でデジタル値に変換した後、制御用コンピュータ103に画像として転送する。撮影制御装置としての制御用コンピュータ103は、図1Bに示されるように、画像取得部131、画像処理部132、DSA処理部133を有する。これらは、プロセッサがプログラムを実行することで実現されてもよいし、1部または全部が専用のハードウエアにより実現されてもよい。画像取得部131、画像処理部132、DSA処理部133の詳細については、のちの説明により明らかになる。タイミングコントローラ120は、制御用コンピュータ103からの同期信号に従って、RESET、SH_S、SH_Nを放射線撮影装置104に提供する。なお、RESET信号は図2のリセット信号PRESに対応し、SH_S信号とSH_N信号はそれぞれ図2の光サンプリング信号TSとノイズサンプリング信号TNに対応する。
The radiation imaging apparatus 104 converts the output of the pixel circuit as described above into a digital value with an AD converter (not shown), and then transfers the image to the control computer 103 as an image. As shown in FIG. 1B, the control computer 103 as the imaging control apparatus includes an image acquisition unit 131, an image processing unit 132, and a DSA processing unit 133. These may be realized by a processor executing a program, or a part or all of them may be realized by dedicated hardware. Details of the image acquisition unit 131, the image processing unit 132, and the DSA processing unit 133 will be clarified later. The timing controller 120 provides RESET, SH_S, SH_N to the radiation imaging apparatus 104 in accordance with a synchronization signal from the control computer 103. The RESET signal corresponds to the reset signal PRES in FIG. 2, and the SH_S signal and the SH_N signal correspond to the optical sampling signal TS and the noise sampling signal TN in FIG. 2, respectively.
次に第1実施形態による放射線撮影システム100の駆動について説明する。制御用コンピュータ103の画像取得部131は、1ショット間にエネルギーが変化する放射線が被写体に照射され、当該1ショット間に前記被写体を透過した前記放射線を複数回検出して得られた、互いに異なる放射線エネルギーによる複数の画像を取得する。本実施形態では、連続する2つのリセットに挟まれた期間において二次元検出器106で少なくとも2回のサンプリングを行い、1フレームの撮影期間において互いに異なる放射線エネルギーによる第1の画像と第2の画像を取得する。図3は、第1実施形態に係る放射線撮影システムにおいてエネルギーサブトラクションを行う場合の二次元検出器106の駆動タイミング(サンプリングと読出しのタイミング)を示すタイミングチャートである。図中の波形は横軸を時間として、放射線の曝射、同期信号、光電変換素子201のリセット、サンプルホールド回路207、信号線21からの画像の読み出しのタイミングを示している。図3に示される各信号(Reset、SH_S、SH_N)は例えば、図1Bに示されるようなタイミングコントローラ120から供給され得る。なお、タイミングコントローラ120は、制御用コンピュータ103に組み込まれていてもいし、放射線撮影装置104に組み込まれていてもよいし、制御用コンピュータ103と放射線撮影装置104の間に介在する独立した装置であってもよい。二次元検出器106からは、信号サンプルホールド回路207Sとノイズサンプルホールド回路207Nでホールドされた信号の差分(S-N)が読み出される。
Next, driving of the radiation imaging system 100 according to the first embodiment will be described. The image acquisition unit 131 of the control computer 103 is different from each other obtained by irradiating a subject with radiation whose energy changes between shots and detecting the radiation transmitted through the subject a plurality of times during the one shot. Acquire multiple images of radiation energy. In the present embodiment, the two-dimensional detector 106 performs sampling at least twice in a period between two consecutive resets, and the first image and the second image with different radiation energies in one frame imaging period. To get. FIG. 3 is a timing chart showing drive timing (sampling and readout timing) of the two-dimensional detector 106 when energy subtraction is performed in the radiation imaging system according to the first embodiment. The waveforms in the figure show the timing of radiation exposure, synchronization signal, photoelectric conversion element 201 reset, sample hold circuit 207, and image readout from the signal line 21 with the horizontal axis as time. Each signal (Reset, SH_S, SH_N) shown in FIG. 3 can be supplied from a timing controller 120 as shown in FIG. 1B, for example. The timing controller 120 may be incorporated in the control computer 103, may be incorporated in the radiation imaging apparatus 104, or may be an independent apparatus interposed between the control computer 103 and the radiation imaging apparatus 104. There may be. From the two-dimensional detector 106, the difference (S−N) between the signals held by the signal sample hold circuit 207S and the noise sample hold circuit 207N is read out.
まず、光電変換素子201のリセットを行ってから、放射線を曝射する。放射線の管電圧は理想的には矩形波であるが、管電圧の立ち上がりと立下りには有限の時間がかかる。特に、パルス放射線で曝射時間が短い場合は、管電圧はもはや矩形波とはみなせず、図3に示すような波形となる。すなわち、放射線の立ち上がり期、安定期、立下り期で放射線のエネルギーが異なる。
First, after resetting the photoelectric conversion element 201, radiation is applied. The tube voltage of radiation is ideally a rectangular wave, but it takes a finite time for the tube voltage to rise and fall. In particular, when the exposure time is short with pulsed radiation, the tube voltage is no longer regarded as a rectangular wave, and has a waveform as shown in FIG. That is, the energy of the radiation differs between the rising period, the stable period, and the falling period of the radiation.
そこで、立ち上がり期の放射線301が曝射された後に、ノイズサンプルホールド回路207Nでサンプリングを行い、さらに安定期の放射線302が曝射された後に信号サンプルホールド回路207Sでサンプリングを行う。その後、信号線21Nと信号線21Sの差分を画像として読み出す。このとき、ノイズサンプルホールド回路207Nには立ち上がり期の放射線301の信号(R1)が保持されている。また、信号サンプルホールド回路207Sには立ち上がり期の放射線301の信号(R1)と安定期の放射線302の信号(B)の和となる信号(R1+B)が保持されている。従って、信号(R1+B)から信号(R1)が差し引かれた画像、すなわち安定期の放射線302の信号に対応した画像304(B)が読み出される。
Therefore, after the radiation 301 in the rising period is exposed, sampling is performed by the noise sample hold circuit 207N, and further, the sampling is performed by the signal sample hold circuit 207S after the radiation 302 in the stable period is exposed. Thereafter, the difference between the signal line 21N and the signal line 21S is read as an image. At this time, the signal (R 1 ) of the rising radiation 301 is held in the noise sample hold circuit 207N. The signal sample and hold circuit 207S holds a signal (R 1 + B) that is the sum of the signal (R 1 ) of the radiation 301 in the rising period and the signal (B) of the radiation 302 in the stable period. Therefore, an image obtained by subtracting the signal (R 1 ) from the signal (R 1 + B), that is, an image 304 (B) corresponding to the signal of the radiation 302 in the stable period is read out.
次に、立下り期の放射線303の曝射と、画像304の読み出しとが完了してから、再び信号サンプルホールド回路207Sでサンプリングを行う。このサンプリングにより画像(R1+B+R2)が取得される。その後、光電変換素子201のリセットを行い、再びノイズサンプルホールド回路207Nでサンプリングを行い、信号線21Nと信号線21Sの差分を画像として読み出す。このとき、ノイズサンプルホールド回路207Nには放射線が曝射されていない状態の信号(0)が保持される。また、信号サンプルホールド回路207Sには立ち上がり期の放射線301の信号と安定期の放射線302と立下り期の放射線303の信号の和(R1+B+R2)が保持されている。従って、立ち上がり期の放射線301の信号と安定期の放射線302の信号と立下り期の放射線303の信号に対応した画像306(R1+B+R2)が読み出される。その後、画像306と画像304の差分を計算することで、立ち上がり期の放射線301と立下り期の放射線303の和に対応した画像305(R1+R2)が得られる。
Next, after the exposure of the radiation 303 in the falling period and the reading of the image 304 are completed, the signal sample hold circuit 207S performs sampling again. An image (R 1 + B + R 2 ) is acquired by this sampling. Thereafter, the photoelectric conversion element 201 is reset, the noise sample hold circuit 207N performs sampling again, and the difference between the signal line 21N and the signal line 21S is read as an image. At this time, the noise sample hold circuit 207N holds a signal (0) in a state where no radiation is exposed. The signal sample hold circuit 207S holds the sum (R 1 + B + R 2 ) of the radiation 301 signal in the rising period, the radiation 302 in the stable period, and the radiation 303 signal in the falling period. Accordingly, the image 306 (R 1 + B + R 2 ) corresponding to the signal of the radiation 301 in the rising period, the signal of the radiation 302 in the stable period, and the signal of the radiation 303 in the falling period is read out. Thereafter, by calculating the difference between the image 306 and the image 304, an image 305 (R 1 + R 2 ) corresponding to the sum of the radiation 301 in the rising period and the radiation 303 in the falling period is obtained.
タイミングコントローラ120は、サンプルホールド回路207におけるサンプリング及び光電変換素子201のリセットを行うタイミングを、放射線発生装置101から放射線の曝射が開始されたことを示す同期信号307を用いて決定する。放射線の曝射開始を検出する方法としては、例えば、放射線発生装置101の管電流を測定し、測定された管電流(電流値)が予め設定された閾値を上回るか否かを判定することにより曝射開始を検出する方法を用いることができる。或いは、光電変換素子201のリセットが完了した後、画素20を繰り返して読み出し、画素値が予め設定された閾値を上回るか否かを判定することにより曝射開始を検出する方法を用いることもできる。さらには、放射線撮影装置104に二次元検出器106とは異なる放射線検出器を内蔵し、その測定値が予め設定された閾値を上回るか否かを判定することにより曝射開始を検出する方法も用いられ得る。いずれの方式の場合も、同期信号307の入力から予め指定した時間が経過した後に、信号サンプルホールド回路207Sのサンプリング、ノイズサンプルホールド回路207Nのサンプリング、光電変換素子201のリセットが行われる。
The timing controller 120 determines the timing for performing sampling and resetting of the photoelectric conversion element 201 in the sample and hold circuit 207 using a synchronization signal 307 indicating that radiation exposure has been started from the radiation generation apparatus 101. As a method for detecting the start of radiation exposure, for example, the tube current of the radiation generator 101 is measured, and it is determined whether or not the measured tube current (current value) exceeds a preset threshold value. A method of detecting the start of exposure can be used. Alternatively, after the reset of the photoelectric conversion element 201 is completed, a method of detecting the start of exposure by repeatedly reading out the pixel 20 and determining whether or not the pixel value exceeds a preset threshold value can be used. . Further, there is a method of detecting the start of exposure by incorporating a radiation detector different from the two-dimensional detector 106 in the radiation imaging apparatus 104 and determining whether or not the measured value exceeds a preset threshold value. Can be used. In any case, the sampling of the signal sample hold circuit 207S, the sampling of the noise sample hold circuit 207N, and the reset of the photoelectric conversion element 201 are performed after a predetermined time has elapsed since the input of the synchronization signal 307.
以上のようにして、パルス放射線の安定期に対応した画像304と、立ち上がり期と立下り期の和に対応した画像305とが制御用コンピュータ103により得られる。これら2枚の画像を形成する際に曝射された放射線のエネルギーが異なるため、これらの画像を用いてエネルギーサブトラクション処理を行うことができる。
As described above, the control computer 103 can obtain the image 304 corresponding to the stable period of the pulsed radiation and the image 305 corresponding to the sum of the rising period and the falling period. Since the energy of radiation exposed when these two images are formed is different, energy subtraction processing can be performed using these images.
図4に、第1実施形態に係る放射線撮影システム100においてエネルギーサブトラクションを行う場合の駆動タイミングの他の例を示す。図3に示される駆動タイミングとは、放射線の管電圧を能動的に切り替えている点で異なる。
FIG. 4 shows another example of drive timing when energy subtraction is performed in the radiation imaging system 100 according to the first embodiment. The driving timing shown in FIG. 3 is different in that the tube voltage of radiation is actively switched.
まず、光電変換素子201のリセットを行ってから、低エネルギーの放射線401を曝射する。その後、ノイズサンプルホールド回路207Nでサンプリングを行ってから、管電圧を切り替えて高エネルギーの放射線402が曝射された後に、信号サンプルホールド回路207Sでサンプリングを行う。その後、管電圧を切り替えて低エネルギーの放射線403の曝射を行う。さらに、信号線21Nと信号線21Sの差分を画像として読み出す。このとき、ノイズサンプルホールド回路207Nには低エネルギーの放射線401の信号(R1)が保持され、信号サンプルホールド回路207Sには低エネルギーの放射線401の信号と高エネルギーの放射線402の信号の和(R1+B)が保持されている。従って、高エネルギーの放射線402の信号に対応した画像404(B)が読み出される。
First, after resetting the photoelectric conversion element 201, the low-energy radiation 401 is exposed. Thereafter, sampling is performed by the noise sample and hold circuit 207N, and after the tube voltage is switched and the high-energy radiation 402 is exposed, sampling is performed by the signal sample and hold circuit 207S. Thereafter, the tube voltage is switched, and the low-energy radiation 403 is exposed. Further, the difference between the signal line 21N and the signal line 21S is read as an image. At this time, the noise sample and hold circuit 207N holds the signal (R 1 ) of the low energy radiation 401, and the signal sample and hold circuit 207S sums the signal of the low energy radiation 401 and the signal of the high energy radiation 402 ( R 1 + B) is retained. Therefore, the image 404 (B) corresponding to the signal of the high-energy radiation 402 is read out.
次に、低エネルギーの放射線403の曝射と、画像404の読み出しとが完了してから、再び信号サンプルホールド回路207Sでサンプリングを行う。その後、光電変換素子201のリセットを行い、再びノイズサンプルホールド回路207Nでサンプリングを行い、信号線21Nと信号線21Sの差分を画像として読み出す。このとき、ノイズサンプルホールド回路207Nには放射線が曝射されていない状態の信号(0)が保持されている。また、信号サンプルホールド回路207Sには低エネルギーの放射線401の信号と高エネルギーの放射線402と低エネルギーの放射線403の信号の和(R1+B+R2)が保持されている。従って、低エネルギーの放射線401の信号と高エネルギーの放射線402の信号と低エネルギーの放射線403の信号に対応した画像406(R1+B+R2)が読み出される。その後、画像406と画像404の差分を計算することで、低エネルギーの放射線401と低エネルギーの放射線403の和に対応した画像405(R1+R2)が得られる。同期信号407については、図3と同様である。このように、管電圧を能動的に切り替えながら画像を取得することで、図3の方法に比べて低エネルギーと高エネルギーの画像の間のエネルギー差をより大きくすることが出来る。
Next, after the exposure of the low energy radiation 403 and the reading of the image 404 are completed, the signal sample hold circuit 207S performs sampling again. Thereafter, the photoelectric conversion element 201 is reset, the noise sample hold circuit 207N performs sampling again, and the difference between the signal line 21N and the signal line 21S is read as an image. At this time, the noise sample hold circuit 207N holds a signal (0) in a state where no radiation is exposed. The signal sample hold circuit 207S holds the sum (R 1 + B + R 2 ) of the low energy radiation 401 signal, the high energy radiation 402 and the low energy radiation 403 signal. Accordingly, an image 406 (R 1 + B + R 2 ) corresponding to the low energy radiation 401 signal, the high energy radiation 402 signal, and the low energy radiation 403 signal is read out. Thereafter, by calculating the difference between the image 406 and the image 404, an image 405 (R 1 + R 2 ) corresponding to the sum of the low energy radiation 401 and the low energy radiation 403 is obtained. The synchronization signal 407 is the same as in FIG. Thus, by acquiring an image while actively switching the tube voltage, the energy difference between a low energy image and a high energy image can be made larger than in the method of FIG.
次に、エネルギーサブトラクション処理について説明する。以下に説明するように、画像取得部131と画像処理部132は、複数の画像を用いてエネルギーサブトラクション処理を行い、エネルギーサブトラクション画像を生成する。本実施形態では、画像取得部131が、連続する2つのリセットに挟まれた期間に、1つの二次元検出器106において少なくとも2回のサンプリングが行われる。これにより、画像取得部131は、互いに異なる放射線エネルギーの2つの画像を1フレームの撮影期間において取得する。画像取得部131は、さらに、取得した2つの画像について図5に示すような補正処理を施し、減弱率の画像である第1の画像と第2の画像を得る。制御用コンピュータ103の画像処理部132は、画像取得部131により得られた第1の画像と第2の画像についてエネルギーサブトラクション処理(図6Aに示される信号処理)を行ってエネルギーサブトラクション画像(以下、処理画像)を得る。
Next, energy subtraction processing will be described. As will be described below, the image acquisition unit 131 and the image processing unit 132 perform energy subtraction processing using a plurality of images to generate an energy subtraction image. In the present embodiment, sampling is performed at least twice in one two-dimensional detector 106 during a period between two consecutive resets of the image acquisition unit 131. As a result, the image acquisition unit 131 acquires two images having different radiation energies during the imaging period of one frame. The image acquisition unit 131 further performs a correction process as shown in FIG. 5 on the two acquired images, and obtains a first image and a second image that are images of attenuation ratios. The image processing unit 132 of the control computer 103 performs energy subtraction processing (signal processing shown in FIG. 6A) on the first image and the second image obtained by the image acquisition unit 131 to perform energy subtraction images (hereinafter, referred to as “energy subtraction images”). Process image).
図5は、第1実施形態によるエネルギーサブトラクション処理において、画像取得部131が行う補正処理を説明する図である。まず、放射線撮影装置104に放射線を曝射せずに撮影を行い、図3または図4に示した駆動で画像を取得する。このとき2枚の画像が読み出されるが、1枚目の画像をF_ODD、2枚目の画像をF_EVENとする。F_ODDとF_EVENは、放射線撮影装置104の固定パターンノイズ(FPN)に対応する画像である。次に、被写体がない状態で放射線撮影装置104に放射線を曝射して撮影を行い、図3または図4に示した駆動で画像を取得する。このとき2枚の画像が読み出されるが、1枚目の画像をW_ODD、2枚目の画像をW_EVENとする。W_ODDとW_EVENは、放射線撮影装置104のFPNと放射線による信号の和に対応する画像である。
FIG. 5 is a diagram illustrating a correction process performed by the image acquisition unit 131 in the energy subtraction process according to the first embodiment. First, imaging is performed without exposing the radiation imaging apparatus 104 to radiation, and an image is acquired by the driving shown in FIG. 3 or FIG. At this time, two images are read out, and the first image is F_ODD and the second image is F_EVEN. F_ODD and F_EVEN are images corresponding to fixed pattern noise (FPN) of the radiation imaging apparatus 104. Next, radiation is applied to the radiation imaging apparatus 104 in the absence of a subject to perform imaging, and an image is acquired by the driving shown in FIG. 3 or FIG. At this time, two images are read out. The first image is W_ODD, and the second image is W_EVEN. W_ODD and W_EVEN are images corresponding to the sum of the FPN and radiation signals of the radiation imaging apparatus 104.
従って、W_ODDからF_ODDを、W_EVENからF_EVENを減算することで、放射線撮影装置104のFPNが除去された画像WF_ODDとWF_EVENが得られる。WF_ODDは、例えば図3における安定期の放射線302に対応する画像であり、WF_EVENは立ち上がり期の放射線301と安定期の放射線302と立下り期の放射線303との和に対応する画像である。従って、WF_EVENからWF_ODDを減算することで、立ち上がり期と立下り期の放射線の和に対応する画像が得られる。放射線の立ち上がり期と立下り期のエネルギーは、放射線の安定期のエネルギーに比べて低い。従って、WF_EVENからWF_ODDを減算することで、被写体がない場合の低エネルギー画像W_Lowが得られる。また、WF_ODDから、被写体がない場合の高エネルギー画像W_Highが得られる。
Therefore, by subtracting F_ODD from W_ODD and F_EVEN from W_EVEN, images WF_ODD and WF_EVEN from which the FPN of the radiation imaging apparatus 104 is removed are obtained. For example, WF_ODD is an image corresponding to the radiation 302 in the stable period in FIG. 3, and WF_EVEN is an image corresponding to the sum of the radiation 301 in the rising period, the radiation 302 in the stable period, and the radiation 303 in the falling period. Therefore, by subtracting WF_ODD from WF_EVEN, an image corresponding to the sum of the radiation in the rising period and the falling period can be obtained. The energy in the rising and falling periods of radiation is lower than the energy in the stable period of radiation. Therefore, by subtracting WF_ODD from WF_EVEN, a low energy image W_Low when there is no subject is obtained. Further, a high energy image W_High when there is no subject is obtained from WF_ODD.
次に、被写体がある状態で放射線撮影装置104に放射線を曝射して撮影を行い、図3、または図4に示した駆動で画像を取得する。このとき1回の曝射に対して2枚の画像が読み出されるが、1枚目の画像をX_ODD、2枚目の画像をX_EVENとする。被写体がない場合と同様の減算を行うことで、被写体がある場合の低エネルギー画像X_Lowと、被写体がある場合の高エネルギー画像X_Highが得られる。
Next, imaging is performed by exposing the radiation imaging apparatus 104 to radiation while the subject is present, and an image is acquired by the driving shown in FIG. 3 or FIG. At this time, two images are read for one exposure, but the first image is X_ODD and the second image is X_EVEN. By performing the same subtraction as when there is no subject, a low energy image X_Low when there is a subject and a high energy image X_High when there is a subject are obtained.
ここで、被写体の厚みをd、被写体の線減弱係数をμ、被写体がない場合の画素20の出力をI0、被写体がある場合の画素20の出力をIとすると、以下の式が成り立つ。

[数1]を変形すると、以下の式が得られる。

[数2]の右辺は被写体の減弱率を示す。すなわち、I/I0は、減弱率の画像である。なお、被写体の減弱率は0~1の間の実数である。
Here, if the thickness of the subject is d, the linear attenuation coefficient of the subject is μ, the output of the pixel 20 when there is no subject is I 0 , and the output of the pixel 20 when there is a subject is I, the following equation is established.
By transforming [Equation 1], the following equation is obtained.
The right side of [Formula 2] indicates the attenuation rate of the subject. That is, I / I 0 is an attenuation rate image. The attenuation rate of the subject is a real number between 0 and 1.
従って、被写体がある場合の低エネルギー画像X_Lowを、被写体がない場合の低エネルギー画像W_Lowで除算することで、低エネルギーにおける減弱率の画像Lが得られる。同様に、被写体がある場合の高エネルギー画像X_Highを、被写体がない場合の高エネルギー画像W_Highで除算することで、高エネルギーにおける減弱率の画像Hが得られる。
Therefore, by dividing the low energy image X_Low when there is a subject by the low energy image W_Low when there is no subject, an image L with an attenuation rate at low energy is obtained. Similarly, by dividing the high energy image X_High when there is a subject by the high energy image W_High when there is no subject, an image H having an attenuation rate at high energy is obtained.
図6Aに、画像処理部132におけるエネルギーサブトラクション処理の信号処理のブロック図を示す。本実施形態のエネルギーサブトラクション処理では、2種類の放射線エネルギーに対する減弱率を示す第1の画像と第2の画像から骨と軟部組織の画像を処理画像として取得する。すなわち、本実施形態における信号処理では、図5に示した補正によって得られた低エネルギーにおける減弱率の画像Lと高エネルギーにおける減弱率の画像Hから、骨の厚さの画像Bと軟部組織の厚さの画像Sを求める。なお、以下では、画像Lを低エネルギーの画像、画像Hを高エネルギーの画像ともいう。
FIG. 6A shows a block diagram of signal processing of energy subtraction processing in the image processing unit 132. In the energy subtraction process of the present embodiment, images of bones and soft tissues are acquired as processed images from the first image and the second image that indicate attenuation rates for two types of radiation energy. That is, in the signal processing in the present embodiment, the bone thickness image B and the soft tissue image are obtained from the low energy attenuation rate image L and the high energy attenuation rate image H obtained by the correction shown in FIG. The thickness image S is obtained. Hereinafter, the image L is also referred to as a low energy image, and the image H is also referred to as a high energy image.
放射線フォトンのエネルギーをE、エネルギーEにおけるフォトン数をN(E)、骨の厚さをB、軟部組織の厚さをS、エネルギーEおける骨の線減弱係数をμB(E)、エネルギーEおける軟部組織の線減弱係数をμS(E)、減弱率をI/I0とする。すると、以下の式が成り立つ。

The energy of the radiation photons E, N (E) the number of photons in the energy E, B the thickness of the bone, the thickness of the soft tissue S, the linear attenuation coefficient of the energy E definitive bone mu B (E), the energy E The linear attenuation coefficient of soft tissue in this case is μ S (E), and the attenuation rate is I / I 0 . Then, the following formula is established.
エネルギーEにおけるフォトン数N(E)は、放射線のスペクトルである。放射線のスペクトルは、シミュレーション又は実測により得られる。また、エネルギーEおける骨の線減弱係数μB(E)とエネルギーEおける軟部組織の線減弱係数μS(E)は、NISTなどのデータベースから得られる。すなわち、任意の骨の厚さB、軟部組織の厚さS、放射線のスペクトルN(E)における減弱率I/I0を計算することが可能である。
The photon number N (E) at the energy E is a spectrum of radiation. The spectrum of radiation is obtained by simulation or actual measurement. Further, the linear attenuation coefficient μ B (E) of the bone at the energy E and the linear attenuation coefficient μ S (E) of the soft tissue at the energy E are obtained from a database such as NIST. That is, it is possible to calculate an arbitrary bone thickness B, soft tissue thickness S, and attenuation rate I / I 0 in a radiation spectrum N (E).
ここで、低エネルギーの放射線におけるスペクトルをNL(E)、高エネルギーの放射線におけるスペクトルをNH(E)とすると、以下の式が成り立つ。

Here, if the spectrum of low-energy radiation is N L (E) and the spectrum of high-energy radiation is N H (E), the following equation holds.
また、高エネルギーの放射線における平均エネルギーEHと低エネルギーの放射線における平均エネルギーELを、以下の式で表すものとする。

Moreover, the average energy E H in the high-energy radiation and the average energy E L in the low-energy radiation are represented by the following equations.
ここで、放射線のスペクトルN(E)を、平均エネルギーにおいてピークを持つ単色放射線として近似すると、[数4]は以下のように近似できる。

Here, when the radiation spectrum N (E) is approximated as monochromatic radiation having a peak in average energy, [Equation 4] can be approximated as follows.
[数6]の両辺の対数をとると、[数7]となる。

Taking the logarithm of both sides of [Formula 6], [Formula 7] is obtained.
[数7]の係数を行列としたときの行列式をdetとすると、骨の厚さの画像B、軟部組織の厚さの画像Sは以下の式で表される。

When the determinant when the coefficient of [Equation 7] is a matrix is det, the bone thickness image B and the soft tissue thickness image S are expressed by the following equations.
エネルギーEにおける線減弱係数μ(E)は既知の値である。従って、全ての画素について[数8]を計算することで、低エネルギーにおける減弱率の画像Lと高エネルギーにおける減弱率の画像Hから、骨の厚さの画像B、軟部組織の厚さの画像Sを得ることができる。具体的には、低エネルギーにおける減弱率の画像Lの対数の画像ln(L)と、高エネルギーにおける減弱率の画像Hの対数の画像ln(H)に対して、線減弱係数μ(E)によって決まる係数を掛けてから差分する。これにより、骨の厚さの画像Bと軟部組織の厚さの画像Sが求められる。
The linear attenuation coefficient μ (E) at energy E is a known value. Therefore, by calculating [Equation 8] for all the pixels, the bone thickness image B and the soft tissue thickness image can be obtained from the low energy attenuation image L and the high energy attenuation image H. S can be obtained. Specifically, for the logarithmic image ln (L) of the low-energy attenuation rate image L and the logarithmic image ln (H) of the high-energy attenuation rate image H, the linear attenuation coefficient μ (E). Multiply by a coefficient determined by Thereby, an image B of bone thickness and an image S of soft tissue thickness are obtained.
なお、本実施形態では[数8]における係数を平均エネルギーEHとELにおける線減弱係数から求めたが、本実施形態はこれに限定されない。例えば、平均エネルギー以外のエネルギーにおける線減弱係数から[数8]の係数を求めてもよい。また、[数8]において使用する線弱係数をユーザーが指定してもよいし、画像の統計量から推定するなどしてもよい。また、第1実施形態では説明を簡略化するために、骨の厚さBと軟部組織の厚さSを算出していたが、このような形態に限定されるものではない。例えば、水の厚さWと造影剤の厚さIを算出してもよい。要するに第1実施形態における信号処理とは、任意の二種類の物質の厚さに分解する処理であると言える。
In the present embodiment, the coefficient in [Equation 8] is obtained from the linear attenuation coefficient in the average energies E H and E L , but the present embodiment is not limited to this. For example, you may obtain | require the coefficient of [Equation 8] from the linear attenuation coefficient in energy other than average energy. In addition, the user may specify the linear weakness coefficient used in [Equation 8], or may be estimated from image statistics. In the first embodiment, the bone thickness B and the soft tissue thickness S are calculated to simplify the description, but the present invention is not limited to such a form. For example, the water thickness W and the contrast agent thickness I may be calculated. In short, it can be said that the signal processing in the first embodiment is processing for decomposing into the thickness of any two kinds of substances.
以上のように、第1の画像(H)と第2の画像(L)についてエネルギーサブトラクションを行って、第1の物質(骨)の厚さに関わる第1の処理画像(B)と第1の物質とは異なる第2の物質(軟部組織)の厚さに関わる第2の処理画像(S)が取得される。より具体的には、第1の放射線エネルギーにおける第1の物質と第2の物質のそれぞれの線減弱係数と、第2の放射線エネルギーにおける第1の物質と第2の物質のそれぞれの線減弱係数とに基づいて第1の処理画像と第2の処理画像が取得される。
As described above, energy subtraction is performed on the first image (H) and the second image (L), and the first processed image (B) and the first image relating to the thickness of the first substance (bone) are processed. A second processed image (S) related to the thickness of the second substance (soft tissue) different from the substance is obtained. More specifically, each linear attenuation coefficient of the first substance and the second substance at the first radiation energy, and each linear attenuation coefficient of the first substance and the second substance at the second radiation energy. Based on the above, the first processed image and the second processed image are acquired.
DSA処理部133は、以上のようにして画像処理部132で生成された複数のエネルギーサブトラクション画像を用いて差分画像を生成する。本実施形態では、差分画像の生成の一例としてデジタル差分血管造影法(以下、DSA(digital subtraction angiography))が用いられる。DSA処理部133は、エネルギーサブトラクション処理により得られた処理画像を用いてDSAによる差分画像を生成する。DSA画像の生成では、造影剤の注入前後の第1の処理画像(B)が用いられる。すなわち、第1実施形態では、造影剤の注入前にエネルギーサブトラクション処理により得られる処理画像を用いてマスク画像を生成する。そして、造影剤の注入後にエネルギーサブトラクション処理により得られる処理画像を用いてライブ画像を生成し、マスク画像とライブ画像の差分画像(DSA画像)を生成する。
The DSA processing unit 133 generates a difference image using the plurality of energy subtraction images generated by the image processing unit 132 as described above. In the present embodiment, digital differential angiography (hereinafter referred to as DSA (digital subtraction angiography)) is used as an example of generating a difference image. The DSA processing unit 133 generates a difference image by DSA using the processed image obtained by the energy subtraction process. In the generation of the DSA image, the first processed image (B) before and after the injection of the contrast agent is used. That is, in the first embodiment, a mask image is generated using a processed image obtained by energy subtraction processing before injection of a contrast agent. Then, a live image is generated using the processed image obtained by the energy subtraction process after the injection of the contrast agent, and a difference image (DSA image) between the mask image and the live image is generated.
図7に、第1実施形態に係るフローチャートを示す。まず、画像取得部131は、造影剤を注入する前に図3又は図4に示したタイミングで撮影を行い、図5に示した補正を行うことで、高エネルギーのマスク画像HMと、低エネルギーのマスク画像LMを取得する(S701)。造影剤が注入された後(S702)、画像取得部131は、マスク画像の取得時と同様に撮影と補正を行い、高エネルギーのライブ画像HLと低エネルギーのライブ画像LLを取得する(S703)。その後、画像処理部132は、高エネルギーのマスク画像HMと低エネルギーのマスク画像LMに対して図6Aに示した信号処理を行い、骨のマスク画像BMと軟部組織のマスク画像SMに分離する。さらに、画像処理部132は、高エネルギーのライブ画像HLと低エネルギーのライブ画像LLに対しても同様の処理を行い、骨のライブ画像BLと軟部組織のライブ画像SLに分離する(S704)。そして、DSA処理部133は、骨のライブ画像BLから骨のマスク画像BMを引くことで骨のDSA画像BDSAを、軟部組織のライブ画像SLから軟部組織のマスク画像SMを引くことで軟部組織のDSA画像SDSAを得る(S705)。処理の終了が指示されるまでの間(S706でNO)、上述したライブ画像の撮影と画像処理を繰り返し行うことで、エネルギーサブトラクションとDSAを組み合わせた動画像を得ることができる。終了が指示されると(S706でYES)、本処理は終了する。
FIG. 7 shows a flowchart according to the first embodiment. First, the image acquisition unit 131 performs imaging at the timing shown in FIG. 3 or FIG. 4 before injecting the contrast agent, by performing the correction shown in FIG. 5, a mask image H M high-energy, low acquiring a mask image L M energy (S701). After the contrast agent is injected (S702), the image acquisition unit 131 performs imaging and correction as well as during acquisition of the mask images to obtain a live image L L of the high-energy live image H L and a low energy ( S703). Thereafter, the image processing unit 132, a high energy to the mask image H M and the low energy mask image L M of the performs signal processing shown in FIG. 6A, the mask image S M of the bone of the mask image B M and soft tissue To separate. Further, the image processing unit 132 performs the same processing for the high-energy live image H L and the low-energy live image L L of, separating the live image S L of the live image B L and soft tissue of the bone (S704). Then, DSA processing unit 133, the bones of DSA images B DSA by subtracting the mask image B M of the bone from the live image B L of the bone, pulling the mask image S M soft tissue from the live image S L soft tissue Thus, a DSA image S DSA of the soft tissue is obtained (S705). Until the end of the process is instructed (NO in S706), a moving image combining energy subtraction and DSA can be obtained by repeatedly capturing the live image and processing the image. When the end is instructed (YES in S706), the process ends.
図8に、第1実施形態に係る画像処理の模式図を示す。図8では、骨のマスク画像BMと骨のライブ画像BLとからDSA画像BDSAが生成される様子が示されている。高エネルギーのマスク画像HMと、低エネルギーのマスク画像LMは、造影剤を注入する前に撮影した画像であるため、骨と軟部組織の情報のみを含んでいる。これらのマスク画像に対してエネルギーサブトラクションを行って得た骨のマスク画像BMには骨の情報が、軟部組織のマスク画像SM(不図示)には軟部組織の情報が含まれる。一方、高エネルギーのライブ画像HLと低エネルギーのライブ画像LLは、造影剤を注入した後に撮影した画像であるため、骨と軟部組織と造影剤の情報を含んでいる。これらのライブ画像に対してエネルギーサブトラクションを行うと、三種類目の物質である造影剤の情報が骨のライブ画像BLに現れる。骨の線弱係数と造影剤の線弱係数が近いかためである。すなわち、骨のライブ画像BLには骨と造影剤の情報が、軟部組織のライブ画像SL(不図示)には軟部組織の情報が含まれる。
FIG. 8 is a schematic diagram of image processing according to the first embodiment. FIG. 8 shows how the DSA image B DSA is generated from the bone mask image B M and the bone live image B L. A mask image H M high-energy, low energy mask image L M of are the images taken before injecting the contrast agent includes only information of the bone and soft tissue. The bone mask image B M obtained by performing energy subtraction on these mask images includes bone information, and the soft tissue mask image S M (not shown) includes soft tissue information. Meanwhile, the live image L L of the high-energy live image H L and low energy are the images taken after injecting a contrast medium, containing information of the bone and soft tissue and contrast media. When energy subtraction is performed on these live images, information on the contrast agent, which is the third type of substance, appears in the live bone image BL . This is because the bone weakness coefficient of the bone is close to that of the contrast medium. That is, the bone live image BL includes information on bones and contrast agents, and the soft tissue live image S L (not shown) includes information on soft tissues.
マスク画像とライブ画像の間で、心臓の拍動や呼吸などによって臓器が動くと、軟部組織の画像には大きな変化が現れる。しかし骨の位置は大きく動かない。すなわち、骨のライブ画像BLと骨のマスク画像BMに含まれる骨の情報はほぼ同じである。従って、骨のDSA画像BDSAでは骨の情報が相殺され、ほぼ造影剤の情報のみが残る。このようにして、心臓の拍動や呼吸などによる動きがあっても、造影剤のみを画像化して、血管の診断を行うことができる。
When the organ moves between the mask image and the live image due to the heartbeat or respiration, a large change appears in the soft tissue image. However, the position of the bone does not move greatly. That is, the bone information included in the bone live image B L and the bone mask image B M is substantially the same. Therefore, the bone information is canceled out in the bone DSA image B DSA , and only the contrast agent information remains. In this way, even if there is a movement due to the pulsation or breathing of the heart, only the contrast agent can be imaged to diagnose the blood vessel.
また、第1実施形態では図3や図4で示したように、サンプルホールド回路を用いることで高エネルギーと低エネルギーの放射線画像を取得していたが、このような形態に限定されるものではない。例えば、高エネルギーの放射線を曝射して画像の読み出しを行ってから、低エネルギーの放射線を曝射して画像の読み出しを行い、高エネルギーと低エネルギーの放射線画像を取得してもよい。しかしながら、本実施形態では心臓の拍動や呼吸などにより被写体が動く状況下で用いることを想定している。被写体が動いた場合、高エネルギーと低エネルギーの放射線画像の間で時間差があると、エネルギーサブトラクション後の画像にモーションアーチファクトを生じるという課題がある。このような理由から、本実施形態では図3や図4で示したように、1つのフレームを撮影する間に(次のリセットがかかる前に)高エネルギーと低エネルギーの放射線画像を撮影する。このような撮影は、二次元検出器106の画素20が有するサンプルホールド回路部207を用いることで実現され得る。このような撮影を時分割駆動と称する。時分割駆動は、高エネルギーと低エネルギーの放射線画像の撮影の時間差を短縮することができるため、DSA画像の生成にとってより望ましい形態である。すなわち、異なるエネルギーの画像を得るための撮影の間隔を短くすることができ、高精度でアーチファクトのないDSA画像を得ることができる。また、サンプルホールド回路を用いることで高エネルギーと中エネルギーと低エネルギーの放射線画像(3以上の放射線画像)を取得し、エネルギーサブトラクション処理を行ってもよい。
In the first embodiment, as shown in FIGS. 3 and 4, high-energy and low-energy radiation images are acquired by using the sample-and-hold circuit. However, the present invention is not limited to such a form. Absent. For example, a high-energy radiation image may be acquired by exposing a high-energy radiation to read an image and then exposing a low-energy radiation to read the image. However, in the present embodiment, it is assumed that the subject is used in a situation where the subject moves due to heart beat or breathing. When a subject moves, if there is a time difference between high-energy and low-energy radiographic images, there is a problem that motion artifacts occur in the image after energy subtraction. For this reason, in this embodiment, as shown in FIGS. 3 and 4, high-energy and low-energy radiographic images are taken while one frame is taken (before the next reset is applied). Such imaging can be realized by using the sample hold circuit unit 207 included in the pixel 20 of the two-dimensional detector 106. Such photographing is referred to as time division driving. Time-division driving is a more desirable mode for generating a DSA image because it can reduce the time difference between radiographic images of high energy and low energy. That is, it is possible to shorten the shooting interval for obtaining images of different energies, and to obtain a DSA image with high accuracy and no artifacts. Alternatively, high energy, medium energy, and low energy radiation images (three or more radiation images) may be acquired by using a sample hold circuit, and energy subtraction processing may be performed.
本実施形態においては、互いにエネルギーの異なる放射線画像を取得するために、FPDを2枚重ねることで、放射線照射側から見て前面のFPDで低エネルギーの放射線画像を、背面のFPDで高エネルギーの放射線画像を取得する方法を用いてもよい。この方法では、高エネルギーと低エネルギーの放射線画像の間で時間差が生じないため、モーションアーチファクトが生じない。しかしながらFPDを積層した場合、前面のFPDを放射線が透過することになる。このFPDがアモルファスシリコンであれば問題ないが、結晶シリコンの場合、放射線によって画素回路の劣化が進んで、画質が悪化するという問題がある。血管造影や血管内治療では、長時間にわたって放射線を照射し続けるため、画素回路の劣化が進行しやすい。また、結晶シリコンのFPDはアモルファスシリコンと比較して高価である。すなわち、結晶シリコンのFPDを積層することは、画質やコストの点から望ましくない。一方、アモルファスシリコンのFPDは、結晶シリコンと比較してオフセットや残像が生じやすい。特に動画の場合は、より大きなオフセットや残像が発生し、エネルギーサブトラクション後の画像にアーチファクトを生じるという課題がある。このような理由からも、本実施形態の時分割駆動による高エネルギーと低エネルギーの放射線画像の撮影は、より望ましい形態である。
In the present embodiment, in order to acquire radiographic images having different energies, by overlapping two FPDs, a low-energy radiographic image can be obtained with the front FPD as viewed from the radiation irradiation side, and a high-energy with the rear FPD. A method of acquiring a radiation image may be used. In this method, there is no time artifact between high energy and low energy radiographic images, so no motion artifacts occur. However, when FPDs are stacked, radiation passes through the front FPD. There is no problem if the FPD is amorphous silicon, but in the case of crystalline silicon, there is a problem that the image quality deteriorates due to deterioration of the pixel circuit due to radiation. In angiography and endovascular treatment, since radiation is continuously applied for a long time, the pixel circuit is likely to deteriorate. In addition, crystalline silicon FPD is more expensive than amorphous silicon. That is, stacking crystalline silicon FPDs is not desirable in terms of image quality and cost. On the other hand, an amorphous silicon FPD is more likely to cause an offset or afterimage than crystalline silicon. In particular, in the case of a moving image, there is a problem that a larger offset or afterimage is generated, and an artifact is generated in the image after energy subtraction. For these reasons, it is more desirable to take high-energy and low-energy radiographic images by time-division driving according to this embodiment.
また、互いに異なる放射線エネルギーの第1の画像と第2の画像を取得するための駆動タイミングは図3、図4に示した駆動タイミングに限られない。互いに異なる放射線エネルギーの第1の画像と第2の画像を1フレームの撮影期間におい取得できる駆動タイミングであればよい。
Further, the drive timing for acquiring the first image and the second image having different radiation energies is not limited to the drive timing shown in FIGS. Any drive timing may be used as long as the first image and the second image having different radiation energies can be acquired in the imaging period of one frame.
<第2実施形態>
第1実施形態では、高エネルギーにおける減弱率の放射線画像(H)と低エネルギーにおける減弱率の放射線画像(L)とから、二種類の物質の厚さの画像を取得した(例えば、図6Aの軟部組織(S)と骨(B)の画像)。第2実施形態では、高エネルギーの放射線画像(H)と低エネルギーの放射線画像(L)とから、実効原子番号(Z)の画像と面密度(D)の画像を取得する(図6B)。なお、第2実施形態の放射線撮影システム100の構成及び高/低エネルギーの放射線画像を取得する動作は、第1実施形態(図1A、1B、2~5)と同様である。 Second Embodiment
In the first embodiment, images of thicknesses of two types of substances are acquired from the radiation image (H) of the attenuation rate at high energy and the radiation image (L) of the attenuation rate at low energy (for example, FIG. 6A). Soft tissue (S) and bone (B) images). In the second embodiment, an effective atomic number (Z) image and an area density (D) image are acquired from a high energy radiation image (H) and a low energy radiation image (L) (FIG. 6B). Note that the configuration of theradiation imaging system 100 of the second embodiment and the operation of acquiring high / low energy radiation images are the same as those of the first embodiment (FIGS. 1A, 1B, 2 to 5).
第1実施形態では、高エネルギーにおける減弱率の放射線画像(H)と低エネルギーにおける減弱率の放射線画像(L)とから、二種類の物質の厚さの画像を取得した(例えば、図6Aの軟部組織(S)と骨(B)の画像)。第2実施形態では、高エネルギーの放射線画像(H)と低エネルギーの放射線画像(L)とから、実効原子番号(Z)の画像と面密度(D)の画像を取得する(図6B)。なお、第2実施形態の放射線撮影システム100の構成及び高/低エネルギーの放射線画像を取得する動作は、第1実施形態(図1A、1B、2~5)と同様である。 Second Embodiment
In the first embodiment, images of thicknesses of two types of substances are acquired from the radiation image (H) of the attenuation rate at high energy and the radiation image (L) of the attenuation rate at low energy (for example, FIG. 6A). Soft tissue (S) and bone (B) images). In the second embodiment, an effective atomic number (Z) image and an area density (D) image are acquired from a high energy radiation image (H) and a low energy radiation image (L) (FIG. 6B). Note that the configuration of the
図6Bは、第2実施形態の画像処理部132によるエネルギーサブトラクション処理の信号処理のブロック図である。上述したように、第2実施形態における信号処理では、図5に示した補正処理によって得られた低エネルギーにおける減弱率の画像Lと高エネルギーにおける減弱率の画像Hから、実効原子番号Zの画像と面密度Dの画像を求める。なお、実効原子番号Zとは混合物の等価的な原子番号のことである。また、面密度Dとは、被写体の密度[g/cm3]と被写体の厚み[cm]の積であり、次元は[g/cm2]となる。
FIG. 6B is a block diagram of signal processing of energy subtraction processing by the image processing unit 132 according to the second embodiment. As described above, in the signal processing in the second embodiment, the image of the effective atomic number Z is obtained from the low-energy attenuation rate image L and the high-energy attenuation rate image H obtained by the correction processing shown in FIG. And an image of surface density D are obtained. The effective atomic number Z is an equivalent atomic number of the mixture. The surface density D is the product of the subject density [g / cm 3 ] and the subject thickness [cm], and the dimension is [g / cm 2 ].
まず、放射線フォトンのエネルギーをE、エネルギーEにおけるフォトン数をN(E)、実効原子番号をZ、面密度をD、実効原子番号ZかつエネルギーEおける質量減弱係数をμ(Z,E)、減弱率をI/I0とすると、以下の式が成り立つ。

First, the energy of radiation photons is E, the number of photons in energy E is N (E), the effective atomic number is Z, the surface density is D, the effective atomic number Z and the mass attenuation coefficient at energy E is μ (Z, E), When the attenuation rate is I / I 0 , the following equation is established.
エネルギーEにおけるフォトン数N(E)は、放射線のスペクトルである。放射線のスペクトルは、シミュレーション又は実測により得られる。また、実効原子番号ZかつエネルギーEおける質量減弱係数μ(Z,E)は、NISTなどのデータベースから得られる。すなわち、[数9]により、任意の実効原子番号Z、面密度D、放射線のスペクトルN(E)における減弱率I/I0を計算することが可能である。
The photon number N (E) at the energy E is a spectrum of radiation. The spectrum of radiation is obtained by simulation or actual measurement. Further, the mass attenuation coefficient μ (Z, E) at the effective atomic number Z and energy E can be obtained from a database such as NIST. In other words, from [Equation 9], it is possible to calculate an arbitrary effective atomic number Z, areal density D, and attenuation rate I / I 0 in the spectrum N (E) of radiation.
ここで、低エネルギーの放射線のスペクトルをNL(E)、高エネルギーの放射線のスペクトルをNH(E)とすると、以下の式が成り立つ。

Here, when the spectrum of low-energy radiation is N L (E) and the spectrum of high-energy radiation is N H (E), the following equation holds.
ここで第1実施形態と同様に、放射線のスペクトルN(E)を、平均エネルギーにおいてピークを持つ単色放射線として近似すると、[数10]は以下のように近似できる。

Similar to the first embodiment, when the radiation spectrum N (E) is approximated as monochromatic radiation having a peak in average energy, [Equation 10] can be approximated as follows.
[数11]の両辺の対数をとると、[数12]となる。

さらに、[数12]の比をとることで面密度の項を相殺すると、以下の式が得られる。

Taking the logarithm of both sides of [Equation 11], [Equation 12] is obtained.
Further, when the area density term is canceled by taking the ratio of [Equation 12], the following equation is obtained.
すなわち、低エネルギーにおける減弱率Lと高エネルギーにおける減弱率Hの対数の比は、実効原子番号から一意に求められる。従って逆関数を求めれば、低エネルギーにおける減弱率のLと高エネルギーにおける減弱率のHの対数の比から実効原子番号Zを求めることができる。また、実行原子番号Zが求まると、[数12]から面密度Dを求めることができる。

That is, the logarithmic ratio of the attenuation rate L at low energy and the attenuation rate H at high energy is uniquely obtained from the effective atomic number. Therefore, if the inverse function is obtained, the effective atomic number Z can be obtained from the logarithm ratio of L of the attenuation rate at low energy and H of the attenuation rate at high energy. When the effective atomic number Z is obtained, the surface density D can be obtained from [Equation 12].
以上のようにして、全ての画素について[数14]を計算することで、低エネルギーにおける減弱率の画像Lと高エネルギーにおける減弱率の画像Hから、実効原子番号Zの画像と面密度Dの画像を得ることができる。
As described above, by calculating [Equation 14] for all the pixels, the image of the effective atomic number Z and the surface density D are calculated from the image L of the attenuation rate at low energy and the image H of the attenuation rate at high energy. An image can be obtained.
図6Cに第2実施形態に係るエネルギーサブトラクション処理の画像処理のブロック図を示す。第2実施形態における画像処理では、図6Bに示した信号処理によって得られた実効原子番号Zの画像と面密度Dの画像から、カラーの透視画像を得る。このときの変換には、HLS色空間が好適に用いられる。HLS色空間とは、色相H(Hue)、彩度S(Saturation)、輝度L(Lightness)の3つ成分からなる色空間である。HLS色空間を利用する方法としては、実効原子番号Zにより色相Hを決定し、面密度Dによって輝度Lを決定する構成が用いられ得る。このような画像処理によって生成されたカラーの放射線画像は、空港における手荷物検査などでも利用されている。なお、彩度Sについては、ユーザーが指定できるようにしてもよいし、固定値が用いられてもよい。
FIG. 6C shows a block diagram of image processing of energy subtraction processing according to the second embodiment. In the image processing in the second embodiment, a color perspective image is obtained from the image of the effective atomic number Z and the image of the surface density D obtained by the signal processing shown in FIG. 6B. The HLS color space is preferably used for the conversion at this time. The HLS color space is a color space composed of three components, hue H (Hue), saturation S (Saturation), and luminance L (Lightness). As a method of using the HLS color space, a configuration in which the hue H is determined by the effective atomic number Z and the luminance L is determined by the surface density D can be used. Color radiographic images generated by such image processing are also used for baggage inspection at airports. Note that the saturation S may be specified by the user, or a fixed value may be used.
HLS色空間の色相H、彩度S、輝度LからRGB値に変換してカラー画像を生成する方法として、円柱モデルや円錐モデルを用いる方法がある。例えば円錐モデルにおいては、以下の式を用いる。


As a method of generating a color image by converting the hue H, saturation S, and luminance L of the HLS color space into RGB values, there is a method using a cylindrical model or a cone model. For example, in the conical model, the following formula is used.
彩度Sは0~1の間の実数である。例えば彩度S=0の場合はMax=L,Min=Lとなることから、色相Hがどのような値であっても、RGB値は(L,L,L)となる。すなわち、輝度Lのみが反映されたモノクロの画像となる。これに対して彩度Sが1に近づくほど色相Hの情報が強く反映されるため、被写体を構成する材料を色によって識別しやすくなる。このため、彩度Sを手動で調整する形態が好ましい。
Saturation S is a real number between 0 and 1. For example, when saturation S = 0, Max = L and Min = L, and therefore the RGB value is (L, L, L) regardless of the hue H. That is, it becomes a monochrome image in which only the luminance L is reflected. On the other hand, as the saturation S approaches 1, the hue H information is more strongly reflected, so that the material constituting the subject can be easily identified by color. For this reason, the form which adjusts the saturation S manually is preferable.
第2実施形態に係るフローチャートは、図7と同様である。ただし、エネルギーサブトラクション(S704)とDSAの処理方法(S705)が異なる。まず、画像取得部131は、造影剤を注入する前に図3又は図4に示したタイミングで撮影を行い、図5に示した補正を行うことで、高エネルギーのマスク画像HMと、低エネルギーのマスク画像LMを取得する。次に、画像取得部131は、造影剤が注入された後、上記と同様に撮影と補正を行い、高エネルギーのライブ画像HLと低エネルギーのライブ画像LLを取得する。その後、画像処理部132は、高エネルギーのマスク画像HMと低エネルギーのマスク画像LMに対して図6Bに示した信号処理を行い、実効原子番号のマスク画像ZMと面密度のマスク画像DMに分離する。さらに、画像処理部132は、高エネルギーのライブ画像HLと低エネルギーのライブ画像LLに対しても同様の処理を行い、実効原子番号のライブ画像ZLと面密度のマスク画像DLに分離する。このとき、各画像の関係は以下の[数17]で表される。
The flowchart according to the second embodiment is the same as FIG. However, the energy subtraction (S704) and the DSA processing method (S705) are different. First, the image acquisition unit 131 performs imaging at timing shown in FIG 3 or FIG 4 before injecting the contrast agent, by performing the correction shown in FIG. 5, a mask image H M high-energy, low to get the mask image L M of energy. Next, the image acquisition unit 131, after which a contrast agent is injected, corrects the shooting in the same manner as described above, to obtain the live image L L of the high-energy live image H L and low energy. Thereafter, the image processing unit 132 performs signal processing shown in FIG. 6B for high energy mask image H M and the low energy mask image L M, the mask image of the effective atomic number Z M and the surface density of the mask image to separate the D M. Further, the image processing unit 132 performs the same processing for the high-energy live image H L and the low-energy live image L L of, the mask image D L of the live image Z L and the surface density of the effective atomic number To separate. At this time, the relationship between the images is expressed by the following [Equation 17].


DSA処理部133は、[数18]を用いて、面密度のDSA画像DDSAと実効原子番号のDSA画像ZDSAを求める。すなわち、実行原子番号のDSA画像は、面密度のマスク画像およびライブ画像(DMおよびDL)と実行原子番号のマスク画像およびライブ画像(ZMおよびZL)に基づいて取得される。なお、実効原子番号のライブ画像ZLから実効原子番号のマスク画像ZMを単純に差分するなどして実効原子番号のDSA画像ZDSAを求めてもよい。最後に、面密度のDSA画像DDSAと実効原子番号のDSA画像ZDSAに対して図10の画像処理を行うことで、カラーのDSA画像CDSAを得る。このようなライブ画像の撮影と画像処理を繰り返し行うことで、エネルギーサブトラクションとDSAを組み合わせたカラーの動画像を得ることができる。
DSA processing unit 133, by using the number 18, obtaining a DSA image Z DSA of DSA images D DSA and the effective atomic number of the surface density. That is, the DSA image of the effective atomic number is acquired based on the mask image and live image (D M and D L ) of the surface density and the mask image and live image (Z M and Z L ) of the effective atomic number. It should be noted, may be obtained DSA image Z DSA of the effective atomic number by, for example, simply subtracting the mask image Z M of the effective atomic number from the live image Z L of the effective atomic number. Finally, the color DSA image C DSA is obtained by performing the image processing of FIG. 10 on the surface density DSA image D DSA and the effective atomic number DSA image Z DSA . By repeating such live image capturing and image processing, a color moving image combining energy subtraction and DSA can be obtained.
図9に、第2実施形態に係る画像処理の模式図を示す。図8と同様、マスク画像とライブ画像の間で、心臓の拍動や呼吸などによって臓器は動くが、骨の位置は大きく動かない。従って、臓器が動いた部分に関して、面密度のDSA画像DDSAは変化するが、実効原子番号のDSA画像ZDSAはあまり変化しない。一方、造影剤が注入された部分は、面密度のDSA画像DDSAと実効原子番号のDSA画像ZDSAが変化する。従って、実効原子番号のDSA画像ZDSAには造影剤の情報のみが残る。これをそのまま表示してもよい。
FIG. 9 is a schematic diagram of image processing according to the second embodiment. As in FIG. 8, the organ moves between the mask image and the live image due to the pulsation or breathing of the heart, but the bone position does not move greatly. Accordingly, the DSA image D DSA of the surface density changes with respect to the portion where the organ has moved, but the DSA image Z DSA of the effective atomic number does not change much. On the other hand, in the portion where the contrast agent is injected, the DSA image D DSA of the surface density and the DSA image Z DSA of the effective atomic number change. Accordingly, only the information about the contrast agent remains in the DSA image Z DSA of the effective atomic number. This may be displayed as it is.
或いは、実効原子番号のDSA画像ZDSAと面密度のDSA画像DDSAとを用いて、新たなDSA画像を生成してもよい。この場合、例えば、実効原子番号のDSA画像ZDSAsと面密度のDSA画像DDSAの画素値に対してそれぞれ閾値を設定し、閾値を下回る場合に画素値を0にクリップした後で両者を乗算するなどの処理が好適に用いられる。さらに、図6Cの画像処理を行って得たカラーのDSA画像CDSAを生成してもよい。いずれの場合も、面密度の変化と実効原子番号の変化を両方用いるため、より正確に造影剤のみを画像化することができる。このようにして、心臓の拍動や呼吸などによる動きがあっても、造影剤のみを画像化して、血管の診断を行うことができる。
Alternatively, a new DSA image may be generated by using the effective atomic number DSA image Z DSA and the surface density DSA image D DSA . In this case, for example, threshold values are set for the pixel values of the DSA image Z DSA s of effective atomic number and the DSA image D DSA of surface density, respectively, and after the pixel value is clipped to 0 when below the threshold value, A process such as multiplication is preferably used. Furthermore, it may generate a color of DSA image C DSA obtained by performing image processing of FIG. 6C. In either case, since both the change in the surface density and the change in the effective atomic number are used, only the contrast agent can be imaged more accurately. In this way, even if there is a movement due to the pulsation or breathing of the heart, only the contrast agent can be imaged to diagnose the blood vessel.
また、第2実施形態における実効原子番号のDSA画像ZDSAでは、マスク画像を引くことで軟部組織や骨によりもたらされる実効原子番号の変化が除去されている。従って、マスク画像の取得後に挿入された物質の実効原子番号(種類)を測定することができる。すなわち、実効原子番号を用いて、造影剤(ヨウ素)とカテーテルやステント(鉄)を識別することができるという利点がある。また、呼吸などによって骨の位置が多少ずれてしまった部分は、マスク画像の取得後に骨が挿入されたものとみなせる。従って、実効原子番号を用いて造影剤(ヨウ素)と骨(カルシウム)を識別し、造影剤のみを画像化するなどの処理も可能となる。
In the DSA image Z DSA of effective atomic numbers in the second embodiment, changes in effective atomic numbers caused by soft tissues and bones are removed by drawing a mask image. Therefore, the effective atomic number (type) of the substance inserted after acquisition of the mask image can be measured. That is, there is an advantage that the contrast agent (iodine) and the catheter or stent (iron) can be identified using the effective atomic number. Further, a portion where the position of the bone is slightly shifted due to breathing or the like can be regarded as a bone inserted after acquisition of the mask image. Therefore, it is possible to identify the contrast agent (iodine) and bone (calcium) using the effective atomic number and to image only the contrast agent.
なお、実効原子番号と面密度の画像を用いたDSA画像の生成において、2つの異なる放射線エネルギーによる減弱率の画像を得るために時分割駆動を用いることは好ましい実施形態であるが、これに限られるものではない。例えば、第1実施形態で上述したように、時分割駆動以外の方法で2つの異なる放射線エネルギーによる減弱率の画像が得られてもよい。
In the generation of a DSA image using images of effective atomic numbers and areal densities, it is a preferred embodiment to use time-division driving in order to obtain images of attenuation rates due to two different radiation energies. It is not something that can be done. For example, as described above in the first embodiment, images of attenuation rates due to two different radiation energies may be obtained by methods other than time-division driving.
<第3実施形態>
第1、第2実施形態では、造影剤の注入前に撮影を行ってマスク画像を生成した。第3実施形態では、エネルギーサブトラクション処理により得られる処理画像のうち、現在のフレームよりも過去の複数のフレームの処理画像に基づいてマスク画像を生成する。そして、現在のフレームの処理画像をライブ画像として用いてマスク画像との差分画像であるDSA画像を生成する。より具体的には、画像処理部132が、異なる放射線エネルギーによる複数の画像を用いてエネルギーサブトラクション処理を行い、エネルギーサブトラクション画像を生成する。DSA処理部133は、過去に生成された複数のエネルギーサブトラクション画像に基づくマスク画像と現在のエネルギーサブトラクション画像に基づくライブ画像との差分画像を生成する。なお、第3実施形態の放射線撮影システム100の構成及び動作は、第1実施形態~第2実施形態と同様である。以下、第3実施系他について詳細に説明する。 <Third Embodiment>
In the first and second embodiments, a mask image is generated by performing imaging before injecting a contrast medium. In the third embodiment, a mask image is generated based on processed images of a plurality of frames past the current frame among the processed images obtained by the energy subtraction process. Then, a DSA image that is a difference image from the mask image is generated using the processed image of the current frame as a live image. More specifically, theimage processing unit 132 performs energy subtraction processing using a plurality of images with different radiation energies to generate an energy subtraction image. The DSA processing unit 133 generates a difference image between a mask image based on a plurality of energy subtraction images generated in the past and a live image based on the current energy subtraction image. Note that the configuration and operation of the radiation imaging system 100 of the third embodiment are the same as those of the first and second embodiments. Hereinafter, the third embodiment and others will be described in detail.
第1、第2実施形態では、造影剤の注入前に撮影を行ってマスク画像を生成した。第3実施形態では、エネルギーサブトラクション処理により得られる処理画像のうち、現在のフレームよりも過去の複数のフレームの処理画像に基づいてマスク画像を生成する。そして、現在のフレームの処理画像をライブ画像として用いてマスク画像との差分画像であるDSA画像を生成する。より具体的には、画像処理部132が、異なる放射線エネルギーによる複数の画像を用いてエネルギーサブトラクション処理を行い、エネルギーサブトラクション画像を生成する。DSA処理部133は、過去に生成された複数のエネルギーサブトラクション画像に基づくマスク画像と現在のエネルギーサブトラクション画像に基づくライブ画像との差分画像を生成する。なお、第3実施形態の放射線撮影システム100の構成及び動作は、第1実施形態~第2実施形態と同様である。以下、第3実施系他について詳細に説明する。 <Third Embodiment>
In the first and second embodiments, a mask image is generated by performing imaging before injecting a contrast medium. In the third embodiment, a mask image is generated based on processed images of a plurality of frames past the current frame among the processed images obtained by the energy subtraction process. Then, a DSA image that is a difference image from the mask image is generated using the processed image of the current frame as a live image. More specifically, the
図10に、第3実施形態に係るフローチャートを示す。第1実施形態とは異なり、マスク画像の撮影は行わず、造影剤の注入の有無は問わない。まず、画像取得部131は、高エネルギーのライブ画像HLと低エネルギーのライブ画像LLを取得する(S1001)。その後、画像処理部132は、高エネルギーのライブ画像HLと低エネルギーのライブ画像LLに対して図6Aに示した信号処理を行い、骨のライブ画像BLと軟部組織のライブ画像SLに分離する(S1002)。このようなライブ画像の撮影とエネルギーサブトラクション処理を繰り返して行うことで動画像が得られる。
FIG. 10 shows a flowchart according to the third embodiment. Unlike the first embodiment, the mask image is not taken, and it does not matter whether or not a contrast medium is injected. First, the image acquisition unit 131 acquires a live image L L of the high-energy live image H L and a low energy (S1001). Thereafter, the image processing unit 132, high energy performs signal processing shown in FIG. 6A against live image H L and the low-energy live image L L of the live image S L of the live image B L and soft tissue of the bone (S1002). A moving image is obtained by repeatedly performing such live image capturing and energy subtraction processing.
ここで、現在のフレームの骨のライブ画像をBL[0]、nフレーム前の骨のライブ画像をBL[-n]とする。なお、nは2以上の整数である。DSA処理部133は、nフレーム前の骨のライブ画像BL[-n]から1フレーム前の骨のライブ画像BL[-1]までのn枚の画像を用いて、骨のマスク画像BMを生成する(S1003)。最後に、DSA処理部133は、現在のフレームの骨のライブ画像BL[0]を骨のライブ画像BLとして、骨のライブ画像BLから骨のマスク画像BMを引くことで骨のDSA画像BDSAを得る(S1004)。軟部組織についても同様にして、軟部組織のライブ画像SLから軟部組織のマスク画像SMを引くことで軟部組織のDSA画像SDSAを得ることができる。このようなライブ画像の撮影と画像処理を繰り返し行うことで、エネルギーサブトラクションとDSAを組み合わせた動画像を得る。
Here, it is assumed that the live image of the bone of the current frame is B L [0], and the live image of the bone n frames before is B L [−n]. Note that n is an integer of 2 or more. The DSA processing unit 133 uses the n images from the live image B L [−n] of the bone before n frames to the live image B L [−1] of the bone before one frame to use the bone mask image B M is generated (S1003). Finally, DSA processing unit 133, live bone of the current frame image B L [0] as a live image B L of the bone, from the live image B L of the bone of the bone by subtracting the mask image B M of the bone DSA image B DSA is obtained (S1004). In the same manner for the soft tissue, it is possible to obtain a DSA image S DSA soft tissue by subtracting the mask image S M soft tissue from the live image S L soft tissue. By repeatedly performing such live image capturing and image processing, a moving image combining energy subtraction and DSA is obtained.
図11に、第3実施形態に係る画像処理の模式図を示す。説明を単純にするため、心臓の冠動脈に造影剤を注入しながらライブ画像を撮影した場合を想定する。高エネルギーのライブ画像HLと低エネルギーのライブ画像LLは、骨と軟部組織と造影剤の情報を含んでいる。これらのライブ画像に対してエネルギーサブトラクションを行うと、三種類目の物質である造影剤の情報が骨のライブ画像BLに現れる。すなわち、骨のライブ画像BLには骨と造影剤の情報が含まれ得る。
FIG. 11 is a schematic diagram of image processing according to the third embodiment. In order to simplify the explanation, it is assumed that a live image is taken while injecting a contrast medium into the coronary artery of the heart. The high-energy live image H L and the low-energy live image L L include information on bone, soft tissue, and contrast medium. When energy subtraction is performed on these live images, information on the contrast agent, which is the third type of substance, appears in the live bone image BL . That is, the bone live image BL may include information on bones and contrast media.
このとき、心臓の拍動に伴って血管が動くため、造影剤も血管と一緒に移動する。一方で、骨は心臓の拍動によっては移動しない。すなわち、骨のライブ画像BLのある画素の時系列に注目すると、骨の情報のみを含むフレームと、骨と造影剤の情報を含むフレームが存在する。具体的には、造影剤が注入された血管がある画素を横切ったとき、造影剤の分だけ骨のライブ画像BLの画素値が上昇する。従って、nフレーム前の骨のライブ画像BL[-n]から1フレーム前の骨のライブ画像BL[-1]までのn枚の画像において、画素ごとに最小値をとると、動く造影剤の情報が除去されて、動かない骨の情報のみが残る。これを骨のマスク画像BMとして、現在のフレームの骨のライブ画像BLから引くと、骨のDSA画像BDSAが得られる。骨のDSA画像BDSAでは骨の情報が相殺されて、造影剤の情報のみが残る。このようにして、心臓の拍動による動きがあっても、造影剤のみを画像化して、血管の診断を行うことができる。
At this time, since the blood vessel moves with the pulsation of the heart, the contrast agent also moves together with the blood vessel. On the other hand, bones do not move with the heartbeat. That is, when attention is paid to the time series of a certain pixel of the bone live image BL , there are a frame including only bone information and a frame including bone and contrast medium information. Specifically, when a blood vessel into which a contrast medium has been injected crosses a certain pixel, the pixel value of the bone live image BL increases by the amount of the contrast medium. Therefore, in the n images from the live image B L [−n] of the bone n frames before to the live image B L [−1] of the bone 1 frame before, the moving contrast is obtained when the minimum value is taken for each pixel. The drug information is removed, leaving only the bone information that does not move. When this is subtracted from the live bone image BL of the current frame as a bone mask image B M , a bone DSA image B DSA is obtained. Bone DSA image B In the DSA , the bone information is canceled and only the contrast agent information remains. In this way, even when there is movement due to the pulsation of the heart, only the contrast medium can be imaged and blood vessels can be diagnosed.
なお、第3実施形態の図11の説明においては、心臓の冠動脈に造影剤を注入しながらライブ画像を撮影した場合を想定したが、本実施形態はそのような場合に限定されない。例えば、心臓の冠動脈にガイドワイヤやステント等を挿入しながら撮影した場合が考えられる。このとき、造影剤の場合と同様、心臓の拍動に伴って血管が動くため、血管内を通って挿入されたガイドワイヤやステントも移動する。従って、撮影により得られたライブ画像に対してエネルギーサブトラクションを行うと、三種類目の物質であるガイドワイヤやステント(鉄)の情報が骨のライブ画像BLに現れる。この場合も図11の説明と同様、ガイドワイヤやステントが挿入された血管がある画素を横切ったとき、ガイドワイヤやステントの分だけ骨のライブ画像BLの画素値が上昇する。従って、nフレーム前の骨のライブ画像BL[-n]から1フレーム前の骨のライブ画像BL[-1]までのn枚の画像において、画素ごとに最小値をとると、動くガイドワイヤやステントの情報が除去されて、動かない骨の情報のみが残る。従って骨のDSA画像BDSAでは、骨の情報が相殺されて、ガイドワイヤやステントの情報のみが残る。すなわち、ガイドワイヤやステントを選択的に画像化することができる。同様の処理によって、血管内手術が完了して冠動脈内にステントが留置された状態でステントを選択的に画像化する形態や、心臓の冠動脈内に石灰化(カルシウム)が沈着しているときに、石灰化を選択的に画像化する形態が好適に用いられる。また、第3実施形態では、心臓の冠動脈を撮影する例を示したが、このような形態に限定されない。例えば、腹部大動脈や腎臓等の造影を行う際に、呼吸に伴う横隔膜の上下や、腸の蠕動などによって、DSA画像にアーチファクトが生じるという課題がある。本実施形態によれば、そのような状況に適用することで横隔膜や腸が動いても、造影剤やステントや石灰化を選択的に画像化することができる。
In the description of FIG. 11 of the third embodiment, it is assumed that a live image is taken while injecting a contrast medium into the coronary artery of the heart, but the present embodiment is not limited to such a case. For example, a case where the image is taken while inserting a guide wire or a stent into the coronary artery of the heart can be considered. At this time, as in the case of the contrast agent, the blood vessel moves with the pulsation of the heart, so that the guide wire and the stent inserted through the blood vessel also move. Therefore, when energy subtraction is performed on a live image obtained by imaging, information on a guide wire and a stent (iron), which are the third type of substance, appears in the live bone image BL . Again similar to the description of FIG. 11, when crossing a pixel having a vessel guidewire and the stent is inserted, the pixel value of the amount corresponding bone of the live image B L of the guide wire and the stent is increased. Therefore, in the n images from the live image B L [−n] of the bone before n frames to the live image B L [−1] of the bone before one frame, the moving guide is obtained by taking the minimum value for each pixel. Wire and stent information is removed, leaving only bone information that does not move. Accordingly, in the bone DSA image B DSA , the bone information is canceled and only the information of the guide wire and the stent remains. That is, a guide wire or a stent can be selectively imaged. In the same way, when the endovascular surgery is completed and the stent is placed in the coronary artery, the stent is selectively imaged, or when calcification (calcium) is deposited in the coronary artery of the heart A form in which calcification is selectively imaged is preferably used. In the third embodiment, an example is shown in which the coronary artery of the heart is imaged. However, the present invention is not limited to such a form. For example, when imaging the abdominal aorta or kidney, there is a problem that artifacts occur in the DSA image due to ups and downs of the diaphragm accompanying breathing, peristalsis of the intestines, and the like. According to this embodiment, even if the diaphragm and the intestine move by applying to such a situation, it is possible to selectively image a contrast agent, a stent, and calcification.
第3実施形態の図11では、nフレーム前の骨のライブ画像BL[-n]から1フレーム前の骨のライブ画像BL[-1]までのn枚の画像(n≧2)、すなわち過去の複数フレームの画像において、画素ごとに最小値をとることで、骨のマスク画像BMを生成した。しかしながら本実施形態はこのような形態に限定されない。例えば、過去の複数フレームの骨のライブ画像BLがあるとき、画素ごとに最大値や平均値、中央値などの統計量を計算することで、骨のマスク画像BMを生成してもよい。また、画素ごとに異常値を除去することで、骨のマスク画像BMを生成してもよい。例えば、骨のライブ画像BLでは、骨の画像にはほとんど移動がないものの造影剤が通過する血管が移動するため、造影剤による画素値の変動を異常値として判定することで、骨の画像を残すことができる。さらには、骨のライブ画像BLに対してリカーシブフィルタを適用することで、骨のマスク画像BMを生成してもよい。以上のように、過去の複数フレームの骨のライブ画像BLから、任意の方法で骨のマスク画像BMを生成してよい。
In Figure 11 the third embodiments, n frames before the bone of the live image B L [-n] from the previous frame to the live image B L [-1] bone n images (n ≧ 2), That is, a bone mask image BM is generated by taking a minimum value for each pixel in a plurality of past frames. However, the present embodiment is not limited to such a form. For example, when there is a bone live image BL of a plurality of past frames, a bone mask image B M may be generated by calculating a statistic such as a maximum value, an average value, or a median value for each pixel. . Further, the bone mask image B M may be generated by removing abnormal values for each pixel. For example, in the live bone image BL , since a blood vessel through which a contrast medium passes although there is almost no movement in the bone image, a change in pixel value due to the contrast medium is determined as an abnormal value. Can leave. Furthermore, a bone mask image B M may be generated by applying a recursive filter to the live bone image B L. As described above, the bone mask image B M may be generated by an arbitrary method from the live images B L of a plurality of past frames.
また、上記の説明では骨のライブ画像BLについて説明したが、本実施形態はこのような形態に限定されない。軟部組織のマスク画像SMを、過去の複数フレームの軟部組織のライブ画像SLから生成してもよい。
In the above description, the bone live image BL has been described. However, the present embodiment is not limited to such a form. The mask image S M soft tissue may be generated from the live image S L soft tissue of the past several frames.
また、第2実施形態のように、高エネルギーのライブ画像HLと低エネルギーのライブ画像LLとから実効原子番号の画像Zと面密度の画像Dに分離する場合にも、第3実施形態の上記処理を適用することができる。この場合は、過去の複数フレームの実効原子番号のライブ画像ZLから実効原子番号のマスク画像ZMを、過去の複数フレームの面密度のライブ画像DLから面密度のマスク画像DMを生成するようにすればよい。
Also, as in the second embodiment, even when separated from the live image L L of the high-energy live image H L and a low energy to the image D in the image Z and the surface density of the effective atomic number, the third embodiment The above processing can be applied. In this case, the mask image Z M of the effective atomic number from the live image Z L of the effective atomic number of a plurality of past frames, generates a mask image D M of surface density from the live image D L of the surface density of a plurality of past frames You just have to do it.
以上のように、第3実施形態は、互いにエネルギーが異なる複数の放射線画像からエネルギーサブトラクションによって得た画像をエネルギーサブトラクション後のライブ画像とする。そして、過去の複数フレームのエネルギーサブトラクション後のライブ画像から、エネルギーサブトラクション後のマスク画像を生成する。そして、現在のフレームのエネルギーサブトラクション後のライブ画像から、上記のようにして生成されたエネルギーサブトラクション後のマスク画像を引くことで、エネルギーサブトラクション後のDSA画像を生成する。したがって、例えば、ステントや石灰化などの、軟部組織以外の動く物体がマスク画像に存在しても、DSA画像におけるアーチファクトの発生を低減することができる。
As described above, in the third embodiment, an image obtained by energy subtraction from a plurality of radiation images having different energy is used as a live image after energy subtraction. Then, a mask image after energy subtraction is generated from a live image after energy subtraction of a plurality of past frames. Then, a DSA image after energy subtraction is generated by subtracting the mask image after energy subtraction generated as described above from the live image after energy subtraction of the current frame. Therefore, even if a moving object other than soft tissue such as a stent or calcification exists in the mask image, the occurrence of artifacts in the DSA image can be reduced.
<第4実施形態>
次に、第4実施形態を説明する。第1実施形態においては、図6Aで示した信号処理における[数4]を、単色放射線で近似することで解いていた。しかしながら、一般に、放射線が物質を通過するとき、低エネルギーの方がより多く吸収されるため、結果的にエネルギーピークが高い側にシフトする、ビームハードニングという現象が発生する。したがって、被写体の厚みが増すと、このビームハードニングにより、放射線の平均エネルギーがより高エネルギー側にシフトする。これによって、骨の厚みBと軟部組織の厚みSに誤差が生じる可能性がある。そこで第4実施形態では、第1の物質である骨と第2の物質である軟部組織の厚みの変化により生じる減弱率の変化を考慮して、高エネルギー画像と低エネルギー画像から第1の物質と第2の物質の厚みを得るようにする。すなわち、以下で説明するようにして[数4]の非線形連立方程式を解くことで、骨の厚みBと軟部組織の厚みSを求める。第4実施形態の放射線撮影システム100の構成及び動作は、第1実施形態~第3実施形態と同様である。 <Fourth embodiment>
Next, a fourth embodiment will be described. In the first embodiment, [Equation 4] in the signal processing shown in FIG. 6A is solved by approximating with monochromatic radiation. However, generally, when radiation passes through a substance, the lower energy is absorbed more, and as a result, a phenomenon called beam hardening occurs in which the energy peak shifts to the higher side. Therefore, when the thickness of the subject increases, the average energy of radiation shifts to a higher energy side by this beam hardening. This may cause errors in the bone thickness B and the soft tissue thickness S. Therefore, in the fourth embodiment, the first substance is obtained from the high energy image and the low energy image in consideration of the change in attenuation rate caused by the change in the thickness of the bone that is the first substance and the soft tissue that is the second substance. And obtaining the thickness of the second substance. That is, the bone thickness B and the soft tissue thickness S are obtained by solving the nonlinear simultaneous equations of [Equation 4] as described below. The configuration and operation of theradiation imaging system 100 of the fourth embodiment are the same as those of the first to third embodiments.
次に、第4実施形態を説明する。第1実施形態においては、図6Aで示した信号処理における[数4]を、単色放射線で近似することで解いていた。しかしながら、一般に、放射線が物質を通過するとき、低エネルギーの方がより多く吸収されるため、結果的にエネルギーピークが高い側にシフトする、ビームハードニングという現象が発生する。したがって、被写体の厚みが増すと、このビームハードニングにより、放射線の平均エネルギーがより高エネルギー側にシフトする。これによって、骨の厚みBと軟部組織の厚みSに誤差が生じる可能性がある。そこで第4実施形態では、第1の物質である骨と第2の物質である軟部組織の厚みの変化により生じる減弱率の変化を考慮して、高エネルギー画像と低エネルギー画像から第1の物質と第2の物質の厚みを得るようにする。すなわち、以下で説明するようにして[数4]の非線形連立方程式を解くことで、骨の厚みBと軟部組織の厚みSを求める。第4実施形態の放射線撮影システム100の構成及び動作は、第1実施形態~第3実施形態と同様である。 <Fourth embodiment>
Next, a fourth embodiment will be described. In the first embodiment, [Equation 4] in the signal processing shown in FIG. 6A is solved by approximating with monochromatic radiation. However, generally, when radiation passes through a substance, the lower energy is absorbed more, and as a result, a phenomenon called beam hardening occurs in which the energy peak shifts to the higher side. Therefore, when the thickness of the subject increases, the average energy of radiation shifts to a higher energy side by this beam hardening. This may cause errors in the bone thickness B and the soft tissue thickness S. Therefore, in the fourth embodiment, the first substance is obtained from the high energy image and the low energy image in consideration of the change in attenuation rate caused by the change in the thickness of the bone that is the first substance and the soft tissue that is the second substance. And obtaining the thickness of the second substance. That is, the bone thickness B and the soft tissue thickness S are obtained by solving the nonlinear simultaneous equations of [Equation 4] as described below. The configuration and operation of the
非線形連立方程式を解く代表的な方法として、ニュートンラフソン法を用いた場合について説明する。まず、ニュートンラフソン法の反復回数をm、m回目の反復後の骨の厚みをBm、m回目の反復後の軟部組織の厚みをSmとしたとき、m回目の反復後の高エネルギーの減弱率Hm、および、m回目の反復後の低エネルギーの減弱率Lmを、以下の式で表す。

A case where the Newton-Raphson method is used as a typical method for solving the nonlinear simultaneous equations will be described. First, when the number of iterations of the Newton-Raphson method is m, the bone thickness after the m-th iteration is B m , and the soft tissue thickness after the m-th iteration is S m , the high energy after the m-th iteration is The attenuation rate H m and the low energy attenuation rate L m after the m-th iteration are expressed by the following equations.
また、厚みが微小に変化したときの減弱率の変化率を、以下の式で表す。

Further, the change rate of the attenuation rate when the thickness is changed minutely is expressed by the following formula.
このとき、m+1回目の反復後の骨の厚みBm+1と軟部組織の厚みSm+1を、高エネルギーの減弱率Hと低エネルギーの減弱率Lを用いて、以下の式で表す。

At this time, the bone thickness B m + 1 and the soft tissue thickness S m + 1 after the m + 1th iteration are expressed by the following equations using the high energy attenuation rate H and the low energy attenuation rate L.
2x2の行列の逆行列は、行列式をdetとすると、クラメルの公式より以下の式で表される。

The inverse matrix of the 2 × 2 matrix is expressed by the following expression from the Kramer formula, where det is the determinant.
従って、[数21]に[数22]を代入すると、以下の式が求まる。

Therefore, substituting [Equation 22] into [Equation 21] gives the following equation.
このような計算を繰り返すことで、m回目の反復後の高エネルギーの減弱率Hmと実測した高エネルギーの減弱率Hの差分が限りなく0に近づいていく。低エネルギーの減弱率Lについても同様である。これによって、m回目の反復後の骨の厚みBmが骨の厚みBに収束し、m回目の軟部組織の厚みSmが軟部組織の厚みSに収束する。このようにして、[数4]に示した非線形連立方程式を解くことができる。
By repeating such calculation, the difference between the high energy attenuation rate H m after the m-th iteration and the actually measured high energy attenuation rate H approaches zero as much as possible. The same applies to the low energy attenuation rate L. Thereby, the bone thickness B m after the m-th iteration converges on the bone thickness B, and the m-th soft tissue thickness S m converges on the soft tissue thickness S. In this way, the nonlinear simultaneous equations shown in [Equation 4] can be solved.
また、第2実施形態で示したような実効原子番号Zと面密度Dを求める計算についても、同様の解法が成り立つ。すなわち、実効原子番号と面密度の変化により生じる減弱率の変化を考慮して、高エネルギー画像と低エネルギー画像から実効原子番号の画像と面密度の画像を得ることができる。例えば、[数10]の非線形連立方程式をニュートンラフソン法により解いた場合について説明する。まず、ニュートンラフソン法の反復回数をm、m回目の反復後の実効原子番号をZm、m回目の反復後の面密度をDmとしたとき、m回目の反復後の高エネルギーの減弱率をHm、m回目の反復後の低エネルギーの減弱率Lmを、以下の式で表す。

The same solution is also established for the calculation for obtaining the effective atomic number Z and the surface density D as shown in the second embodiment. That is, in consideration of the change in attenuation rate caused by the change in effective atomic number and surface density, an image of effective atomic number and an image of surface density can be obtained from a high energy image and a low energy image. For example, the case where the nonlinear simultaneous equations of [Equation 10] are solved by the Newton-Raphson method will be described. First, when the number of iterations of the Newton-Raphson method is m, the effective atomic number after the m-th iteration is Z m , and the surface density after the m-th iteration is D m , the high energy attenuation rate after the m-th iteration H m , and the low energy attenuation rate L m after the m-th iteration is expressed by the following equation.
また、実効原子番号と面密度が微小に変化したときの減弱率の変化率を、以下の式で表す。

Moreover, the change rate of the attenuation rate when the effective atomic number and the surface density are slightly changed is expressed by the following formula.
このとき、m+1回目の反復後の骨の厚みBm+1と軟部組織の厚みSm+1を、高エネルギーの減弱率Hと低エネルギーの減弱率Lを用いて、以下の式で表す。

At this time, the bone thickness B m + 1 and the soft tissue thickness S m + 1 after the m + 1th iteration are expressed by the following equations using the high energy attenuation rate H and the low energy attenuation rate L.
2x2の行列の逆行列は、行列式をdetとすると、クラメルの公式より以下の式で表される。

The inverse matrix of the 2 × 2 matrix is expressed by the following expression from the Kramer formula, where det is the determinant.
従って、[数26]に[数27]を代入すると、以下の式が求まる。

Therefore, substituting [Equation 27] into [Equation 26] gives the following equation.
このような計算を繰り返すことで、m回目の反復後の高エネルギーの減弱率Hmと実測した高エネルギーの減弱率Hの差分が限りなく0に近づいていく。低エネルギーの減弱率Lについても同様である。これによって、m回目の反復後の実効原子番号Zmが実効原子番号Zに収束し、m回目の反復後の面密度Dmが面密度Dに収束する。以上のようにして、[数10]に示した非線形連立方程式を解くことができる。
By repeating such calculation, the difference between the high energy attenuation rate H m after the m-th iteration and the actually measured high energy attenuation rate H approaches zero as much as possible. The same applies to the low energy attenuation rate L. As a result, the effective atomic number Z m after the m-th iteration converges to the effective atomic number Z, and the surface density D m after the m-th iteration converges to the surface density D. As described above, the nonlinear simultaneous equations shown in [Equation 10] can be solved.
なお、第4実施形態においては、ニュートンラフソン法を用いて非線形連立方程式を解くことを説明したが、このような形態に限定されない。例えば、最小二乗法や二分法などの反復解法を用いてもよい。また、反復解法を用いるとき、0回目の反復後の骨の厚みB0と軟部組織の厚みS0、すなわち骨の厚みと軟部組織の厚みの初期値が必要となる。初期値としては任意の定数を与えてもよい。また、第1実施形態で説明したように、放射線のスペクトルを単色放射線で近似した[数8]を用いて骨の厚みと軟部組織の厚みを求め、これらを初期値とする構成が好適に用いられる。第2実施形態で示した実効原子番号Zと面密度Dの場合についても同様に、放射線のスペクトルを単色放射線で近似した[数14]を用いて実効原子番号と面密度を求め、これらを初期値とする構成が好適に用いられる。以上のような計算により、骨の厚みBや軟部組織の厚みS、実効原子番号Zや面密度Dを高精度に求めることができる。
In the fourth embodiment, it has been described that the nonlinear simultaneous equations are solved using the Newton-Raphson method, but the present invention is not limited to such a form. For example, an iterative solution such as a least square method or a bisection method may be used. Further, when the iterative solution is used, the initial values of the bone thickness B 0 and the soft tissue thickness S 0 after the 0th iteration, that is, the bone thickness and the soft tissue thickness are required. An arbitrary constant may be given as the initial value. Further, as described in the first embodiment, a configuration in which the bone thickness and the soft tissue thickness are obtained using [Equation 8] obtained by approximating the spectrum of radiation with monochromatic radiation, and these values are used as initial values is preferably used. It is done. Similarly, in the case of the effective atomic number Z and the surface density D shown in the second embodiment, the effective atomic number and the surface density are obtained using [Equation 14] that approximates the spectrum of the radiation with monochromatic radiation, and these are the initial values. A configuration with values is preferably used. By the calculation as described above, the bone thickness B, the soft tissue thickness S, the effective atomic number Z, and the surface density D can be obtained with high accuracy.
また、上記では、[数4]や[数10]で示した非線形連立方程式を反復解法で解いていた。しかしながら、この過程で[数19]、[数20]、[数24]、[数25]を計算するとき、数値積分が必要となる。しかも、m回の反復計算を行うたびに再計算が必要である。さらには、全ての画素においてこのような演算を行うことになる。従って、図6Aや図6Bで示したエネルギーサブトラクションの信号処理に、時間がかかるという課題がある。特に本実施形態では動画撮影を想定しているため、信号処理に許容される時間は1フレーム以下となる。例えばフレームレートが20fpsの場合、50ms以下で信号処理と画像処理を行わなければ、処理が追い付かなくなる。そこで様々な組み合わせの高エネルギーの減弱率Hと低エネルギーの減弱率Lに対する骨の厚みBや軟部組織の厚みSを事前に求めてテーブルを生成しておき、このテーブルを参照することで骨の厚みBや軟部組織の厚みSを高速に求めるようにしてもよい。
In the above, the nonlinear simultaneous equations shown in [Equation 4] and [Equation 10] are solved by an iterative method. However, when [Equation 19], [Equation 20], [Equation 24], and [Equation 25] are calculated in this process, numerical integration is required. Moreover, recalculation is required every m iterations. Furthermore, such calculation is performed for all pixels. Therefore, there is a problem that it takes time for the signal processing of the energy subtraction shown in FIGS. 6A and 6B. In particular, in this embodiment, since moving image shooting is assumed, the time allowed for signal processing is one frame or less. For example, when the frame rate is 20 fps, processing cannot catch up unless signal processing and image processing are performed in 50 ms or less. Therefore, a table is generated by previously obtaining the bone thickness B and the soft tissue thickness S for various combinations of the high energy attenuation rate H and the low energy attenuation rate L, and referring to this table, The thickness B and the soft tissue thickness S may be obtained at high speed.
図12に、第4実施形態におけるテーブル生成のフローチャートを示す。テーブルの分割数をM、テーブルの低エネルギーの座標をl、テーブルの高エネルギーの座標をhとする。なお、テーブルの座標l及びhは整数である。まず、制御用コンピュータ103は、低エネルギーの座標をl=0として初期化してから(S1201)、高エネルギーの座標をh=0として初期化する(S1202)。
FIG. 12 shows a flowchart of table generation in the fourth embodiment. The number of table divisions is M, the low energy coordinates of the table are l, and the high energy coordinates of the table are h. The table coordinates l and h are integers. First, the control computer 103 initializes low energy coordinates as l = 0 (S1201), and then initializes high energy coordinates as h = 0 (S1202).
次に、制御用コンピュータ103は、座標lにおける低エネルギーの減弱率L[l]と座標hにおける高エネルギーの減弱率H[h]を以下の式により求める。

Next, the control computer 103 obtains the low energy attenuation rate L [l] at the coordinate l and the high energy attenuation rate H [h] at the coordinate h by the following equations.
このようにして求めた低エネルギーの減弱率L[l]と高エネルギーの減弱率をH[h]に対して、[数4]で示した非線形連立方程式を解き、骨の厚みBと軟部組織の厚みSを求める。この結果を、骨の厚みBに対するテーブルB[l,h]及び軟部組織の厚みSに対するテーブルS[l,h]に格納する(S1203)。その後、制御用コンピュータ103は、h=h+1とする(S1204)。高エネルギーの座標hがテーブルの分割数Mを越えていない場合(S1205でNO)は、制御用コンピュータ103は、S1203からの処理を繰り返す。高エネルギーの座標hがテーブルの分割数Mを越えた場合(S1205YES)は、制御用コンピュータ103は、l=l+1とする(S1206)。そして、低エネルギーの座標lがテーブルの分割数Mを越えていない場合(S1207でNO)は、制御用コンピュータ103は、h=0として(S1202)、S1203~S1205の処理を繰り返す。低エネルギーの座標lがテーブルの分割数Mを越えた場合(S1207でYES)は、テーブルの生成が終了する。以上のようにして、あらゆるlとhの組み合わせについて骨の厚みBと軟部組織の厚みSを求めて、テーブルに格納することができる。
For the low energy attenuation rate L [l] and the high energy attenuation rate H [h] obtained in this way, the nonlinear simultaneous equations shown in [Equation 4] are solved, and the bone thickness B and soft tissue are solved. The thickness S is determined. The results are stored in a table B [l, h] for the bone thickness B and a table S [l, h] for the soft tissue thickness S (S1203). Thereafter, the control computer 103 sets h = h + 1 (S1204). If the high-energy coordinate h does not exceed the table division number M (NO in S1205), the control computer 103 repeats the processing from S1203. If the high energy coordinate h exceeds the table division number M (YES in S1205), the control computer 103 sets l = 1 + 1 (S1206). If the low energy coordinate 1 does not exceed the table division number M (NO in S1207), the control computer 103 sets h = 0 (S1202) and repeats the processing of S1203 to S1205. When the low-energy coordinate 1 exceeds the table division number M (YES in S1207), the table generation ends. As described above, the bone thickness B and the soft tissue thickness S can be obtained for any combination of l and h and stored in the table.
図13に、第4実施形態におけるテーブル参照の模式図を示す。このテーブルは、高エネルギー画像が示す減弱率と低エネルギー画像が示す減弱率の組合せに応じて骨と軟部組織の厚みが登録された2次元のテーブルである。ある画素において低エネルギーの減弱率がL、高エネルギーの減弱率がHであるとする。このとき、以下の式によって減弱率をテーブルの座標l'及びh'に変換する。

FIG. 13 shows a schematic diagram of table reference in the fourth embodiment. This table is a two-dimensional table in which the bone and soft tissue thicknesses are registered according to the combination of the attenuation rate indicated by the high energy image and the attenuation rate indicated by the low energy image. Assume that the low energy attenuation rate is L and the high energy attenuation rate is H in a certain pixel. At this time, the attenuation rate is converted into table coordinates l ′ and h ′ by the following equation.
この座標を用いて、骨の厚みBに対するテーブルB[l,h]を参照することで、骨の厚みBを求めることができる。軟部組織の厚みについても同様である。ただし、テーブルの座標l'及びh'は小数となるが、テーブルは配列に格納されているため、整数でなければ参照できない。従って、座標l'及びh'を整数に変換してから、補間によって骨の厚みB及び軟部組織の厚みSを求める構成が好適に用いられる。例えば、座標l'の小数点を切り捨てて整数に変換した値をl、座標h'の小数点を切り捨てて整数に変換した値をhとし、バイリニア補間で骨の厚みBと軟部組織の厚みSを求める場合は、以下の式を用いる。

The bone thickness B can be obtained by referring to the table B [l, h] for the bone thickness B using the coordinates. The same applies to the thickness of the soft tissue. However, the coordinates 1 ′ and h ′ of the table are decimal numbers, but since the table is stored in the array, it can be referred to only if it is an integer. Therefore, a configuration in which the coordinates l ′ and h ′ are converted into integers and then the bone thickness B and the soft tissue thickness S are obtained by interpolation is preferably used. For example, a value obtained by rounding down the decimal point of the coordinate l ′ into an integer is l, a value obtained by rounding down the decimal point of the coordinate h ′ and converting into an integer is h, and the bone thickness B and the soft tissue thickness S are obtained by bilinear interpolation. In this case, the following formula is used.
従って、事前にテーブルを生成しておけば、非線形連立方程式を解くのに比べて格段に少ない計算量で、骨の厚みBと軟部組織の厚みSを求めることができる。このようなテーブルは、放射線のスペクトルN(E)が変化しない限り有効である。一般的に、動画撮影中に放射線のスペクトルN(E)が変化することはないため、撮影前に一回テーブルを生成すれば十分である。当然のことながら、図12と図13で示したテーブルの生成と参照は、任意の二物質の厚みを求める計算についても同様に用いることができる。また、実効原子番号Zと面密度Dを求める計算に対しても、同様に用いることができる。この場合、高エネルギー画像が示す減弱率と低エネルギー画像が示す減弱率の組合せに応じて実効原子番号と面密度が登録された2次元のテーブルが用いられることになる。このようにして、図6Aや図6Bで示したエネルギーサブトラクションの信号処理を高精度かつ高速に行うことができる。
Therefore, if a table is generated in advance, the bone thickness B and the soft tissue thickness S can be obtained with a much smaller amount of calculation than when the nonlinear simultaneous equations are solved. Such a table is effective as long as the spectrum N (E) of radiation does not change. Generally, since the radiation spectrum N (E) does not change during moving image shooting, it is sufficient to generate a table once before shooting. As a matter of course, the generation and reference of the tables shown in FIGS. 12 and 13 can be similarly used for the calculation for obtaining the thicknesses of two arbitrary substances. Moreover, it can use similarly also for the calculation which calculates | requires the effective atomic number Z and the surface density D. FIG. In this case, a two-dimensional table in which the effective atomic number and the surface density are registered according to the combination of the attenuation rate indicated by the high energy image and the attenuation rate indicated by the low energy image is used. In this manner, the energy subtraction signal processing shown in FIGS. 6A and 6B can be performed with high accuracy and at high speed.
なお、第4実施形態では、式(29)を用いて、座標lにおける低エネルギーの減弱率L[l]と座標hにおける高エネルギーの減弱率H[h]を求めていた。このようにして生成されたテーブルは、縦軸の座標が高エネルギーの減弱率H、横軸の座標が低エネルギーの減弱率Lとなるが、テーブルは0~1の間の減弱率を等間隔に分割したものになる。しかしながら、人体の組成と厚みに対する減弱率は0付近の値となることが多い。このため、テーブルの分割数Mが小さいと、テーブルの参照と補間によって得た値と、非線形連立方程式を解いて得た値との誤差が大きくなるという欠点がある。そこで、座標の範囲を決定する定数をk(0<k)としたとき、以下の式を用いて減弱率を求める構成が好適に用いられる。

In the fourth embodiment, the low energy attenuation rate L [l] at the coordinate l and the high energy attenuation rate H [h] at the coordinate h are obtained using the equation (29). In the table generated in this way, the vertical axis coordinate is the high energy attenuation rate H and the horizontal coordinate is the low energy attenuation rate L, but the table has an attenuation rate between 0 and 1 at equal intervals. Will be divided into However, the attenuation rate with respect to the composition and thickness of the human body is often a value near zero. For this reason, if the table division number M is small, there is a disadvantage that an error between a value obtained by referring to the table and interpolation and a value obtained by solving the nonlinear simultaneous equations becomes large. Therefore, when the constant for determining the coordinate range is k (0 <k), a configuration for obtaining the attenuation rate using the following formula is preferably used.
[数32]によって座標から減弱率を求めた場合は、以下の式を用いて座標を求める。

When the attenuation rate is obtained from the coordinates according to [Equation 32], the coordinates are obtained using the following formula.
テーブルの参照と補間については、[数31]を用いる。このようにして生成されたテーブルは、縦軸の座標が-ln(H)、横軸の座標が-ln(L)となっている。従って、減弱率の値が0付近になっても、テーブルの参照と補間によって得た値と、非線形連立方程式を解いて得た値との誤差を小さくできる。
[Table 31] is used for table reference and interpolation. In the table generated in this way, the coordinate on the vertical axis is −ln (H), and the coordinate on the horizontal axis is −ln (L). Therefore, even when the attenuation rate value is close to 0, the error between the value obtained by referring to the table and interpolation and the value obtained by solving the nonlinear simultaneous equations can be reduced.
また、第4実施形態において、テーブルの生成と参照を行うとき、解が存在しない高エネルギーの減弱率Hと低エネルギーの減弱率Lの組み合わせが生じうる。例えば、高エネルギーの減弱率Hは、通常、低エネルギーの減弱率Lよりも大きくなる。従って、[数29]や[数32]を用いて生成されたテーブルでは、H<Lとなる領域の解が求められない。本実施形態においては、テーブル上で解が求められない領域を減らすように、座標を選択してもよい。例えば、縦軸の座標をln(L)/ln(H)、横軸の座標を-ln(H)などにしてもよい。あるいは、縦軸の座標として、[数8]や[数14]のように、単色放射線で近似して解いた値を用いるなどしてもよい。また、第4実施形態においてテーブルの参照を行う際に、テーブルの範囲外の座標が指定される可能性や、解が求められない領域が参照される可能性がある。このような場合は、指定された座標の周囲にある、解が存在する領域の値を用いる構成が好適に用いられる。
Also, in the fourth embodiment, when generating and referring to a table, a combination of a high energy attenuation rate H and a low energy attenuation rate L without a solution may occur. For example, the high energy attenuation rate H is usually greater than the low energy attenuation rate L. Therefore, in the table generated using [Equation 29] and [Equation 32], the solution of the region where H <L cannot be obtained. In the present embodiment, coordinates may be selected so as to reduce the area where no solution is obtained on the table. For example, the vertical axis coordinate may be ln (L) / ln (H), and the horizontal axis coordinate may be -ln (H). Alternatively, as a coordinate of the vertical axis, a value solved by approximating with monochromatic radiation such as [Equation 8] or [Equation 14] may be used. Further, when referring to a table in the fourth embodiment, there is a possibility that coordinates outside the range of the table are designated, or an area where no solution is obtained may be referred to. In such a case, a configuration using the value of the area around the designated coordinates where the solution exists is preferably used.
なお、第1実施形態では、図7のようにエネルギーサブトラクションを行ってからDSAを行う順序で画像処理を行っていた。しかしながら、[数8]のように、放射線のスペクトルN(E)を単色放射線で近似した場合は、DSAを行ってからエネルギーサブトラクションを行う構成としてもよい。例えば、[数8]をマスク画像とライブ画像の両方に適用すると、厚みBと軟部組織の厚みSは、以下の式で表される。
In the first embodiment, image processing is performed in the order in which DSA is performed after performing energy subtraction as shown in FIG. However, as shown in [Equation 8], when the radiation spectrum N (E) is approximated by monochromatic radiation, the energy subtraction may be performed after the DSA is performed. For example, when [Equation 8] is applied to both the mask image and the live image, the thickness B and the soft tissue thickness S are expressed by the following equations.

[数34]より、DSA画像は以下の式で表される。

From [Expression 34], the DSA image is expressed by the following equation.
すなわち、エネルギーサブトラクションを行った後にライブ画像からマスク画像を減算してDSAを行った結果と、ライブ画像をマスク画像で除算することでDSAを行った後にエネルギーサブトラクションを行った結果が一致する。しかしながら、第4実施形態のように、非線形連立方程式を画素ごと解く構成、又は事前に解いてテーブルを生成してから参照する構成では、このような演算の順不同性は保証されない。すなわち、DSAを行ってからエネルギーサブトラクションを行うと、誤差が大きくなるという課題がある。一方で、非線形方程式を画素ごとに解いてエネルギーサブトラクション行った後にDSAを行う構成にすると、誤差は小さくなるが計算量が多くなるという課題がある。このような理由から、第4実施形態で示したように、非線形連立方程式を解くことで、互いに異なる複数のエネルギーにおける画素値とエネルギーサブトラクション後の画素値との対応関係を示すテーブルを生成して置くことが望ましい。画像処理部132は、こうして生成されたテーブルを参照することでエネルギーサブトラクション後の画像を生成し、DSA処理部133は、エネルギーサブトラクション後の画像を用いてDSAを行う。
That is, the result of performing the DSA by subtracting the mask image from the live image after performing the energy subtraction matches the result of performing the energy subtraction after performing the DSA by dividing the live image by the mask image. However, in the configuration in which the nonlinear simultaneous equations are solved for each pixel as in the fourth embodiment, or in the configuration in which the table is generated after being solved in advance, such an unordered operation is not guaranteed. That is, when energy subtraction is performed after performing DSA, there is a problem that an error increases. On the other hand, when the non-linear equation is solved for each pixel and the DSA is performed after performing the energy subtraction, there is a problem that the calculation amount increases although the error is reduced. For this reason, as shown in the fourth embodiment, by solving the nonlinear simultaneous equations, a table indicating the correspondence between the pixel values at different energies and the pixel values after energy subtraction is generated. It is desirable to put. The image processing unit 132 refers to the table thus generated to generate an image after energy subtraction, and the DSA processing unit 133 performs DSA using the image after energy subtraction.
なお、第1~第4実施形態では、放射線撮影装置104は蛍光体を用いた間接型の放射線センサとしたが、このような形態に限定されない。例えばCdTe等の直接変換材料を用いた直接型の放射線センサを用いてもよい。また、第1~第4実施形態では放射線発生装置101の受動的な管電圧変化を利用するか、能動的に管電圧を切り替えるなどしていたが、このような形態に限定されない。放射線発生装置101のフィルタを時間的に切り替えるなどして、放射線撮影装置104に曝射される放射線のエネルギーを変化させてもよい。
In the first to fourth embodiments, the radiation imaging apparatus 104 is an indirect radiation sensor using a phosphor, but is not limited to such a form. For example, a direct radiation sensor using a direct conversion material such as CdTe may be used. In the first to fourth embodiments, the passive tube voltage change of the radiation generating apparatus 101 is used or the tube voltage is actively switched. However, the present invention is not limited to such a form. The energy of the radiation exposed to the radiation imaging apparatus 104 may be changed by switching the filter of the radiation generating apparatus 101 with time.
さらに、第1~第4実施形態では放射線撮影装置104に曝射される放射線のエネルギーを変化させることで、エネルギーサブトラクションを行っていたがこのような形態に限定されない。例えば、第1実施形態でも述べたが、センサを2枚積層することで、前面のセンサと背面のセンサで検出する放射線のスペクトルを変化させる方式が用いられてもよい。また、放射線量子の個数をエネルギー別にカウントする、フォトンカウンティング方式のセンサを用いることで、互いにエネルギーが異なる複数の画像を取得するなどしてもよい。
Furthermore, in the first to fourth embodiments, energy subtraction is performed by changing the energy of radiation exposed to the radiation imaging apparatus 104. However, the present invention is not limited to such a form. For example, as described in the first embodiment, a method of changing the spectrum of radiation detected by the front sensor and the rear sensor by stacking two sensors may be used. Further, a plurality of images having different energies may be acquired by using a photon counting type sensor that counts the number of radiation quanta by energy.
また、第1と第2実施形態では、放射線撮影システムの制御用コンピュータ103を用いてエネルギーサブトラクション処理を行っていたが、このような形態に限定されない。制御用コンピュータ103で取得した画像を別のコンピュータに転送して、エネルギーサブトラクション処理を行ってもよい。例えば、取得した画像を医療用のPACSを介して別のパソコンに転送し、エネルギーサブトラクション処理を行ってから表示する構成が好適に用いられる。すなわち、上記各実施形態では、互いにエネルギーが異なる放射線画像をエネルギーサブトラクション処理に提供できればよく、互いにエネルギーが異なる放射線画像を取得するための方法は、上記実施形態に限定されるものではない。
In the first and second embodiments, the energy subtraction process is performed using the control computer 103 of the radiation imaging system, but the present invention is not limited to such a form. An image acquired by the control computer 103 may be transferred to another computer to perform energy subtraction processing. For example, a configuration in which an acquired image is transferred to another personal computer via a medical PACS and displayed after performing energy subtraction processing is preferably used. That is, in each of the above embodiments, it is only necessary to provide radiation images having different energies to the energy subtraction process, and a method for acquiring radiographic images having different energies is not limited to the above embodiment.
本発明は、上述の実施形態の1以上の機能を実現するプログラムを、ネットワーク又は記憶媒体を介してシステム又は装置に供給し、そのシステム又は装置のコンピュータにおける1つ以上のプロセッサーがプログラムを読出し実行する処理でも実現可能である。また、1以上の機能を実現する回路(例えば、ASIC)によっても実現可能である。
The present invention supplies a program that realizes one or more functions of the above-described embodiments to a system or apparatus via a network or a storage medium, and one or more processors in a computer of the system or apparatus read and execute the program This process can be realized. It can also be realized by a circuit (for example, ASIC) that realizes one or more functions.
本発明は上記実施の形態に制限されるものではなく、本発明の精神及び範囲から離脱することなく、様々な変更及び変形が可能である。従って、本発明の範囲を公にするために、以下の請求項を添付する。
The present invention is not limited to the above embodiment, and various changes and modifications can be made without departing from the spirit and scope of the present invention. Therefore, in order to make the scope of the present invention public, the following claims are attached.
本願は、2018年3月20日提出の日本国特許出願特願2018-052916を基礎として優先権を主張するものであり、その記載内容の全てを、ここに援用する。
This application claims priority on the basis of Japanese Patent Application No. 2018-052916 filed on Mar. 20, 2018, the entire contents of which are incorporated herein by reference.
Claims (21)
- 1ショット間にエネルギーが変化する放射線が被写体に照射され、当該1ショット間に前記被写体を透過した前記放射線を複数回検出して得られた、互いに異なる放射線エネルギーによる複数の画像を取得する取得手段と、
複数の画像を用いてエネルギーサブトラクション処理を行い、エネルギーサブトラクション画像を生成する第1の生成手段と、
前記第1の生成手段で生成された複数のエネルギーサブトラクション画像を用いて差分画像を生成する第2の生成手段と、を備えることを特徴とする撮影制御装置。 Acquisition means for acquiring a plurality of images with different radiation energies obtained by irradiating a subject with radiation whose energy changes during one shot and detecting the radiation transmitted through the subject a plurality of times during the one shot When,
First generation means for performing energy subtraction processing using a plurality of images and generating an energy subtraction image;
And a second generation unit configured to generate a difference image using a plurality of energy subtraction images generated by the first generation unit. - 前記第2の生成手段は、造影剤の注入前に前記第1の生成手段により得られるエネルギーサブトラクション画像を用いてマスク画像を生成し、造影剤の注入後に前記第1の生成手段により得られるエネルギーサブトラクション画像を用いてライブ画像を生成して前記マスク画像との差分画像を生成することを特徴とする請求項1に記載の撮影制御装置。 The second generation means generates a mask image using an energy subtraction image obtained by the first generation means before injection of the contrast agent, and energy obtained by the first generation means after injection of the contrast agent. The imaging control apparatus according to claim 1, wherein a live image is generated using a subtraction image and a difference image from the mask image is generated.
- 前記第2の生成手段は、前記第1の生成手段により得られるエネルギーサブトラクション画像のうち、現在のフレームよりも過去の複数のフレームの処理画像に基づいてマスク画像を生成し、現在のフレームのエネルギーサブトラクション画像をライブ画像として用いて前記マスク画像との差分画像を生成することを特徴とする請求項1に記載の撮影制御装置。 The second generation unit generates a mask image based on the processed images of a plurality of frames past the current frame among the energy subtraction images obtained by the first generation unit, and generates energy of the current frame. The imaging control apparatus according to claim 1, wherein a difference image from the mask image is generated using a subtraction image as a live image.
- 前記第1の生成手段は、第1の放射線エネルギーにより得られる第1の画像と、前記第1の放射線エネルギーとは異なる第2の放射線エネルギーにより得られる第2の画像を用いてエネルギーサブトラクション処理を行って、第1の物質の厚さに関わる第1のエネルギーサブトラクション画像と、前記第1の物質とは異なる第2の物質の厚さに関わる第2のエネルギーサブトラクション画像を生成し、
前記第2の生成手段は、前記第1のエネルギーサブトラクション画像を用いてデジタル差分血管造影法による差分画像を生成することを特徴とする請求項1乃至3のいずれか1項に記載の撮影制御装置。 The first generation means performs an energy subtraction process using a first image obtained by the first radiation energy and a second image obtained by a second radiation energy different from the first radiation energy. And generating a first energy subtraction image relating to the thickness of the first substance and a second energy subtraction image relating to the thickness of the second substance different from the first substance,
The imaging control apparatus according to claim 1, wherein the second generation unit generates a difference image by digital difference angiography using the first energy subtraction image. . - 前記第1の生成手段は、前記第1の放射線エネルギーにおける前記第1の物質と前記第2の物質のそれぞれの線減弱係数と、前記第2の放射線エネルギーにおける前記第1の物質と前記第2の物質のそれぞれの線減弱係数とに基づいて、前記第1のエネルギーサブトラクション画像と前記第2のエネルギーサブトラクション画像を生成することを特徴とする請求項4に記載の撮影制御装置。 The first generation means includes linear attenuation coefficients of the first substance and the second substance at the first radiation energy, the first substance and the second at the second radiation energy, respectively. The imaging control device according to claim 4, wherein the first energy subtraction image and the second energy subtraction image are generated based on the respective linear attenuation coefficients of the substance.
- 前記第1の物質は骨であり、前記第2の物質は軟部組織であることを特徴とする請求項4または5に記載の撮影制御装置。 6. The imaging control apparatus according to claim 4, wherein the first substance is a bone and the second substance is a soft tissue.
- 前記第1の生成手段は、前記第1の物質と前記第2の物質の厚みの変化により生じる減弱率の変化を考慮して、前記第1の画像と前記第2の画像から前記第1の物質の厚さに関わる前記第1のエネルギーサブトラクション画像と前記第2の物質の厚さに関わる前記第2のエネルギーサブトラクション画像を得ることを特徴とする請求項4乃至6のいずれか1項に記載の撮影制御装置。 The first generation means takes into account the first image and the second image from the first image in consideration of a change in attenuation rate caused by a change in thickness of the first material and the second material. The first energy subtraction image related to the thickness of the substance and the second energy subtraction image related to the thickness of the second substance are obtained. Shooting control device.
- 前記第1の生成手段は、前記第1の画像が示す減弱率と前記第2の画像が示す減弱率の組合せに応じて第1の物質と第2の物質の厚みが登録された2次元のテーブルを参照することを特徴とする請求項7に記載の撮影制御装置。 The first generation means is a two-dimensional registration in which the thicknesses of the first material and the second material are registered according to a combination of the attenuation rate indicated by the first image and the attenuation rate indicated by the second image. The imaging control apparatus according to claim 7, wherein a table is referred to.
- 前記第1の生成手段は、第1の放射線エネルギーにより得られる第1の画像と、前記第1の放射線エネルギーとは異なる第2の放射線エネルギーにより得られる第2の画像を用いてエネルギーサブトラクション処理を行って、実効原子番号の画像と面密度の画像を前記エネルギーサブトラクション画像として取得することを特徴とする請求項1乃至3のいずれか1項に記載の撮影制御装置。 The first generation means performs an energy subtraction process using a first image obtained by the first radiation energy and a second image obtained by a second radiation energy different from the first radiation energy. 4. The imaging control apparatus according to claim 1, wherein an imaging of an effective atomic number and an image of an area density are acquired as the energy subtraction image. 5.
- 前記第2の生成手段は、造影剤の注入前と注入後で前記第1の生成手段により得られる前記実効原子番号の画像を用いてデジタル差分血管造影法による差分画像を生成することを特徴とする請求項9に記載の撮影制御装置。 The second generation means generates a difference image by digital difference angiography using an image of the effective atomic number obtained by the first generation means before and after injection of a contrast agent. The imaging control device according to claim 9.
- 前記第2の生成手段は、造影剤の注入前と注入後で前記第1の生成手段により得られる前記実効原子番号と前記面密度の画像を用いてデジタル差分血管造影法による差分画像を生成することを特徴とする請求項9に記載の撮影制御装置。 The second generation unit generates a differential image by digital differential angiography using the effective atomic number and the surface density image obtained by the first generation unit before and after injection of the contrast agent. The imaging control apparatus according to claim 9.
- 前記第2の生成手段は、前記実効原子番号の画像と前記面密度の画像に基づいて生成されたマスク画像をそれぞれZM、DMとし、前記実効原子番号の画像と前記面密度の画像に基づいて生成されたライブ画像をそれぞれZL、DLとした場合に、面密度の差分画像であるDDSAと実行原子番号の差分画像であるZDSAを、
(ただし、nは2.5以上、3以下の実数)
により生成することを特徴とする請求項11に記載の撮影制御装置。 The second generation means sets Z M and D M as mask images generated based on the effective atomic number image and the areal density image, respectively, and converts the effective atomic number image and the areal density image into the images. When the live images generated on the basis of Z L and D L are respectively the D DSA that is the difference image of the surface density and the Z DSA that is the difference image of the effective atomic number,
(Where n is a real number of 2.5 or more and 3 or less)
The imaging control apparatus according to claim 11, wherein the imaging control apparatus generates the imaging control apparatus. - 前記第2の生成手段は、実効原子番号の差分画像に基づいてHLS色空間の色相Hを決定し、面密度の差分画像に基づいてHLS色空間の輝度Lを決定することにより、カラー画像を生成することを特徴とする請求項11または12に記載の撮影制御装置。 The second generation means determines the hue H of the HLS color space based on the difference image of the effective atomic number, and determines the luminance L of the HLS color space based on the difference image of the surface density. The imaging control apparatus according to claim 11, wherein the imaging control apparatus generates the imaging control apparatus.
- 前記第1の生成手段は、実効原子番号と面密度の変化により生じる減弱率の変化を考慮して、前記第1の画像と前記第2の画像から実効原子番号の画像と面密度の画像を得ることを特徴とする請求項9乃至13のいずれか1項に記載の撮影制御装置。 The first generation means takes into account the change in attenuation rate caused by the change in effective atomic number and surface density, and obtains an image of effective atomic number and an image of surface density from the first image and the second image. The imaging control device according to claim 9, wherein the imaging control device is obtained.
- 前記第1の生成手段は、前記第1の画像が示す減弱率と前記第2の画像が示す減弱率の組合せに応じて実効原子番号と面密度が登録された2次元のテーブルを参照することを特徴とする請求項14に記載の撮影制御装置。 The first generation means refers to a two-dimensional table in which effective atomic numbers and areal densities are registered according to the combination of the attenuation rate indicated by the first image and the attenuation rate indicated by the second image. The imaging control apparatus according to claim 14.
- 前記第2の生成手段は、1フレームの撮影期間ごとに前記差分画像を生成することを特徴とする請求項1乃至15のいずれか1項に記載の撮影制御装置。 16. The imaging control apparatus according to claim 1, wherein the second generation unit generates the difference image every imaging period of one frame.
- 連続する2つのリセットに挟まれた期間に、二次元検出器において少なくとも2回のサンプリングを行うことにより、互いに異なる放射線エネルギーの第1の画像と第2の画像を1フレームの撮影期間において取得する取得手段と、
前記第1の画像と前記第2の画像についてエネルギーサブトラクション処理を行い、エネルギーサブトラクション画像を生成する第1の生成手段と、
複数のエネルギーサブトラクション画像を用いて差分画像を生成する第2の生成手段と、を備えることを特徴とする撮影制御装置。 By performing sampling at least twice in the two-dimensional detector during a period between two successive resets, a first image and a second image having different radiation energies are acquired in one frame imaging period. Acquisition means;
First generation means for performing energy subtraction processing on the first image and the second image to generate an energy subtraction image;
And a second generation means for generating a difference image using a plurality of energy subtraction images. - 放射線撮影のための撮影制御方法であって、
1ショット間にエネルギーが変化する放射線が被写体に照射され、当該1ショット間に前記被写体を透過した前記放射線を複数回検出して得られた、互いに異なる放射線エネルギーによる複数の画像を取得する取得工程と、
複数の画像を用いてエネルギーサブトラクション処理を行い、エネルギーサブトラクション画像を生成する第1の生成工程と、
前記第1の生成工程で生成された複数のエネルギーサブトラクション画像を用いて差分画像を生成する第2の生成工程と、を備えることを特徴とする撮影制御方法。 An imaging control method for radiography,
An acquisition step of acquiring a plurality of images with different radiation energies obtained by irradiating a subject with radiation whose energy changes during one shot and detecting the radiation transmitted through the subject a plurality of times during the one shot. When,
A first generation step of performing energy subtraction processing using a plurality of images to generate an energy subtraction image;
And a second generation step of generating a difference image using the plurality of energy subtraction images generated in the first generation step. - 放射線撮影のための撮影制御方法であって、
連続する2つのリセットに挟まれた期間に、二次元検出器において少なくとも2回のサンプリングを行うことにより、互いに異なる放射線エネルギーの第1の画像と第2の画像を1フレームの撮影期間において取得する取得工程と、
前記第1の画像と前記第2の画像についてエネルギーサブトラクション処理を行い、エネルギーサブトラクション画像を生成する第1の生成工程と、
複数のエネルギーサブトラクション画像を用いて差分画像を生成する第2の生成工程と、を備えることを特徴とする撮影制御方法。 An imaging control method for radiography,
By performing sampling at least twice in the two-dimensional detector during a period between two successive resets, a first image and a second image having different radiation energies are acquired in one frame imaging period. Acquisition process;
A first generation step of performing energy subtraction processing on the first image and the second image to generate an energy subtraction image;
And a second generation step of generating a difference image using a plurality of energy subtraction images. - 請求項1乃至17のいずれか1項に記載された撮影制御装置と、
二次元検出器を含む放射線撮影装置と、
放射線を発生する放射線発生装置と、を備えることを特徴とする放射線撮影システム。 An imaging control device according to any one of claims 1 to 17,
A radiography apparatus including a two-dimensional detector;
A radiation imaging system comprising: a radiation generator that generates radiation. - 請求項18または19のいずれか1項に記載された撮影制御方法の各工程をコンピュータに実行させるためのプログラム。 A program for causing a computer to execute each step of the photographing control method according to any one of claims 18 and 19.
Priority Applications (3)
| Application Number | Priority Date | Filing Date | Title |
|---|---|---|---|
| EP19770964.5A EP3769686B1 (en) | 2018-03-20 | 2019-02-01 | Photography control device, photography control method, radiography system, and program |
| US17/019,638 US11422098B2 (en) | 2018-03-20 | 2020-09-14 | Radiation imaging system, imaging control apparatus, and method |
| US17/865,691 US11933743B2 (en) | 2018-03-20 | 2022-07-15 | Radiation imaging system, imaging control apparatus, and method |
Applications Claiming Priority (2)
| Application Number | Priority Date | Filing Date | Title |
|---|---|---|---|
| JP2018052916A JP7075250B2 (en) | 2018-03-20 | 2018-03-20 | Radiation imaging system, imaging control device and method |
| JP2018-052916 | 2018-03-20 |
Related Child Applications (1)
| Application Number | Title | Priority Date | Filing Date |
|---|---|---|---|
| US17/019,638 Continuation US11422098B2 (en) | 2018-03-20 | 2020-09-14 | Radiation imaging system, imaging control apparatus, and method |
Publications (1)
| Publication Number | Publication Date |
|---|---|
| WO2019181229A1 true WO2019181229A1 (en) | 2019-09-26 |
Family
ID=67987113
Family Applications (1)
| Application Number | Title | Priority Date | Filing Date |
|---|---|---|---|
| PCT/JP2019/003593 WO2019181229A1 (en) | 2018-03-20 | 2019-02-01 | Photography control device, photography control method, radiography system, and program |
Country Status (4)
| Country | Link |
|---|---|
| US (2) | US11422098B2 (en) |
| EP (1) | EP3769686B1 (en) |
| JP (2) | JP7075250B2 (en) |
| WO (1) | WO2019181229A1 (en) |
Families Citing this family (2)
| Publication number | Priority date | Publication date | Assignee | Title |
|---|---|---|---|---|
| JP7169853B2 (en) * | 2018-11-09 | 2022-11-11 | キヤノン株式会社 | Image processing device, radiation imaging device, and image processing method |
| KR102590461B1 (en) * | 2021-06-07 | 2023-10-16 | 연세대학교 산학협력단 | Method and apparatus for decomposing multi-material based on dual-energy technique |
Citations (7)
| Publication number | Priority date | Publication date | Assignee | Title |
|---|---|---|---|---|
| JPS58221580A (en) | 1982-04-26 | 1983-12-23 | ゼネラル・エレクトリツク・カンパニイ | X-ray image subtracting method and device |
| JP2002152593A (en) * | 2000-11-08 | 2002-05-24 | Fuji Photo Film Co Ltd | Method and device for energy subtraction and recording medium |
| WO2007086369A1 (en) * | 2006-01-24 | 2007-08-02 | Shimadzu Corporation | X-ray imager |
| JP2011115562A (en) * | 2009-10-29 | 2011-06-16 | Toshiba Corp | X-ray equipment |
| JP2011152280A (en) * | 2010-01-27 | 2011-08-11 | Canon Inc | Radiographic apparatus, and control method and program thereof |
| JP2018023671A (en) * | 2016-08-12 | 2018-02-15 | 株式会社日立製作所 | Image processing device, x-ray imaging apparatus, and image processing method |
| JP2018052916A (en) | 2016-09-23 | 2018-04-05 | 小林製薬株式会社 | Composition for external use |
Family Cites Families (17)
| Publication number | Priority date | Publication date | Assignee | Title |
|---|---|---|---|---|
| US4551800A (en) * | 1982-11-26 | 1985-11-05 | General Electric Company | Integrated hybrid image remasking in a subtraction angiography method |
| US6723746B2 (en) * | 1998-09-08 | 2004-04-20 | Veritas Pharmaceuticals, Inc. | Functional radiographic imaging methods and agents |
| DE10325335A1 (en) * | 2003-06-04 | 2004-12-30 | Siemens Ag | Device and method for taking pictures with the aid of high-energy photons |
| DE10335321A1 (en) * | 2003-08-01 | 2005-03-03 | Siemens Ag | Operating method for medical X-ray device with updating of correction data for image signals in both active and waiting modes of X-ray device |
| DE102004063995A1 (en) * | 2004-10-25 | 2006-08-17 | Siemens Ag | Tomography apparatus and method for a tomography apparatus for generating multiple energy images |
| WO2007017773A2 (en) * | 2005-08-09 | 2007-02-15 | Koninklijke Philips Electronics, N.V. | System and method for dual energy dynamic x-ray imaging |
| JP2008229122A (en) | 2007-03-22 | 2008-10-02 | Fujifilm Corp | Image component separating apparatus, method and program |
| JP2014048204A (en) | 2012-08-31 | 2014-03-17 | Canon Inc | Radiation imaging apparatus, and radiation imaging system |
| JP2014049983A (en) | 2012-08-31 | 2014-03-17 | Canon Inc | Radiographic image pickup device and control method and program therefor |
| JP6087541B2 (en) | 2012-08-31 | 2017-03-01 | キヤノン株式会社 | Radiation imaging apparatus, driving method thereof, and radiation imaging system |
| JP2014049982A (en) | 2012-08-31 | 2014-03-17 | Canon Inc | Radiographic image pickup device and control method and program therefor |
| JP2014216794A (en) | 2013-04-24 | 2014-11-17 | キヤノン株式会社 | Radiation imaging device and radiation inspection device |
| JP6366542B2 (en) | 2015-06-17 | 2018-08-01 | キヤノン株式会社 | Radiation imaging apparatus, radiation imaging system, and irradiation start detection method |
| US9888894B2 (en) * | 2015-12-21 | 2018-02-13 | General Electric Company | Multi-energy X-ray imaging |
| CN106562797B (en) * | 2016-10-27 | 2021-01-01 | 南京航空航天大学 | Single exposure digital subtraction angiography imaging system |
| JP6758249B2 (en) * | 2017-05-18 | 2020-09-23 | 富士フイルム株式会社 | Image processing equipment, radiation imaging system, image processing method, and image processing program |
| JP7161297B2 (en) * | 2018-03-20 | 2022-10-26 | キヤノン株式会社 | Radiation imaging system, image processing device, imaging control device and its operation method, program |
-
2018
- 2018-03-20 JP JP2018052916A patent/JP7075250B2/en active Active
-
2019
- 2019-02-01 WO PCT/JP2019/003593 patent/WO2019181229A1/en unknown
- 2019-02-01 EP EP19770964.5A patent/EP3769686B1/en active Active
-
2020
- 2020-09-14 US US17/019,638 patent/US11422098B2/en active Active
-
2022
- 2022-05-16 JP JP2022080349A patent/JP7352687B2/en active Active
- 2022-07-15 US US17/865,691 patent/US11933743B2/en active Active
Patent Citations (7)
| Publication number | Priority date | Publication date | Assignee | Title |
|---|---|---|---|---|
| JPS58221580A (en) | 1982-04-26 | 1983-12-23 | ゼネラル・エレクトリツク・カンパニイ | X-ray image subtracting method and device |
| JP2002152593A (en) * | 2000-11-08 | 2002-05-24 | Fuji Photo Film Co Ltd | Method and device for energy subtraction and recording medium |
| WO2007086369A1 (en) * | 2006-01-24 | 2007-08-02 | Shimadzu Corporation | X-ray imager |
| JP2011115562A (en) * | 2009-10-29 | 2011-06-16 | Toshiba Corp | X-ray equipment |
| JP2011152280A (en) * | 2010-01-27 | 2011-08-11 | Canon Inc | Radiographic apparatus, and control method and program thereof |
| JP2018023671A (en) * | 2016-08-12 | 2018-02-15 | 株式会社日立製作所 | Image processing device, x-ray imaging apparatus, and image processing method |
| JP2018052916A (en) | 2016-09-23 | 2018-04-05 | 小林製薬株式会社 | Composition for external use |
Also Published As
| Publication number | Publication date |
|---|---|
| JP2019162358A (en) | 2019-09-26 |
| US20200408704A1 (en) | 2020-12-31 |
| JP7352687B2 (en) | 2023-09-28 |
| EP3769686A4 (en) | 2021-12-01 |
| US20220365004A1 (en) | 2022-11-17 |
| JP7075250B2 (en) | 2022-05-25 |
| US11933743B2 (en) | 2024-03-19 |
| EP3769686B1 (en) | 2023-09-13 |
| EP3769686A1 (en) | 2021-01-27 |
| JP2022097760A (en) | 2022-06-30 |
| US11422098B2 (en) | 2022-08-23 |
Similar Documents
| Publication | Publication Date | Title |
|---|---|---|
| JP7085043B2 (en) | Image processing equipment, image processing methods and programs | |
| JP7352687B2 (en) | Radiography system, radiography control device and method | |
| JP7054329B2 (en) | Image processing equipment, image processing methods and programs | |
| US20200408933A1 (en) | Radiation imaging system, imaging control apparatus, and method | |
| JP2020203083A (en) | Radiation imaging apparatus and radiation imaging system | |
| WO2022071024A1 (en) | Image processing device, image processing method, and program | |
| JP7373323B2 (en) | Image processing device, radiation imaging system, image processing method and program | |
| JP7431602B2 (en) | Image processing device and image processing method | |
| JP7425619B2 (en) | Image processing device and image processing method | |
| WO2022185693A1 (en) | Image processing device, radiographic imaging system, image processing method, and program | |
| WO2022181022A1 (en) | Image processing device and method, radiography system, and program | |
| WO2021162026A1 (en) | Image processing device and image processing method | |
| WO2020250900A1 (en) | Image processing device, image processing method, and program | |
| US20230401677A1 (en) | Image processing apparatus, radiation imaging system, image processing method, and non-transitory computer-readable storage medium | |
| JP2023172296A (en) | Information processing device, information processing method and program |
Legal Events
| Date | Code | Title | Description |
|---|---|---|---|
| 121 | Ep: the epo has been informed by wipo that ep was designated in this application |
Ref document number: 19770964 Country of ref document: EP Kind code of ref document: A1 |
|
| NENP | Non-entry into the national phase |
Ref country code: DE |
|
| ENP | Entry into the national phase |
Ref document number: 2019770964 Country of ref document: EP Effective date: 20201020 |