WO2017135235A1 - 分離膜診断方法、水処理方法、分離膜診断装置、水処理装置及び分離膜診断プログラム - Google Patents
分離膜診断方法、水処理方法、分離膜診断装置、水処理装置及び分離膜診断プログラム Download PDFInfo
- Publication number
- WO2017135235A1 WO2017135235A1 PCT/JP2017/003363 JP2017003363W WO2017135235A1 WO 2017135235 A1 WO2017135235 A1 WO 2017135235A1 JP 2017003363 W JP2017003363 W JP 2017003363W WO 2017135235 A1 WO2017135235 A1 WO 2017135235A1
- Authority
- WO
- WIPO (PCT)
- Prior art keywords
- separation membrane
- vibration
- state
- water
- separation
- Prior art date
- Legal status (The legal status is an assumption and is not a legal conclusion. Google has not performed a legal analysis and makes no representation as to the accuracy of the status listed.)
- Ceased
Links
Images









Classifications
-
- B—PERFORMING OPERATIONS; TRANSPORTING
- B01—PHYSICAL OR CHEMICAL PROCESSES OR APPARATUS IN GENERAL
- B01D—SEPARATION
- B01D65/00—Accessories or auxiliary operations, in general, for separation processes or apparatus using semi-permeable membranes
- B01D65/10—Testing of membranes or membrane apparatus; Detecting or repairing leaks
- B01D65/109—Testing of membrane fouling or clogging, e.g. amount or affinity
-
- B—PERFORMING OPERATIONS; TRANSPORTING
- B01—PHYSICAL OR CHEMICAL PROCESSES OR APPARATUS IN GENERAL
- B01D—SEPARATION
- B01D65/00—Accessories or auxiliary operations, in general, for separation processes or apparatus using semi-permeable membranes
- B01D65/02—Membrane cleaning or sterilisation ; Membrane regeneration
-
- G—PHYSICS
- G01—MEASURING; TESTING
- G01N—INVESTIGATING OR ANALYSING MATERIALS BY DETERMINING THEIR CHEMICAL OR PHYSICAL PROPERTIES
- G01N15/00—Investigating characteristics of particles; Investigating permeability, pore-volume or surface-area of porous materials
- G01N15/08—Investigating permeability, pore-volume, or surface area of porous materials
Definitions
- the present invention relates to a separation membrane diagnostic method, a water treatment method, a separation membrane diagnostic device, a water treatment device, and a separation membrane diagnostic program.
- MBR Membrane Bioreactor
- MBR Membrane Bioreactor
- the adhering substances contained in the sludge accumulate on the surface of the separation membrane or block the permeation flow path of the separation membrane over time.
- a phenomenon called fouling in which the permeation performance of the film deteriorates occurs.
- fouling progresses and the permeation performance of the separation membrane deteriorates, maintenance is required to remove the deposits attached to the separation membrane by cleaning.
- the decrease in the permeation performance due to fouling is not constant with respect to the operation time, and the permeation performance rapidly decreases when the predetermined operation time is exceeded. Therefore, when the separation membrane is used until the permeation performance is lowered, the water treatment may have to be stopped unexpectedly for cleaning.
- the separation membrane is cleaned early. In cleaning the separation membrane, a predetermined chemical solution is used to remove organic substances and microorganisms attached to the separation membrane. When the number of cleaning of the separation membrane increases, the operation rate of water treatment decreases due to the stop for cleaning. Further, if the number of times of cleaning increases, costs such as labor costs of workers who perform cleaning operations and chemical costs for cleaning increase.
- fouling can be delayed by performing explosion (aeration) from below the separation membrane and removing the adhering portion adhering to the surface of the separation membrane by air vibration.
- MBR there is a technique for detecting fouling using a sensor such as a fluorescence sensor (see, for example, Patent Document 1). Moreover, in MBR, there exists a technique which predicts fouling by analyzing the component of sludge using a centrifuge etc. (for example, refer patent document 2).
- JP 2014-136210 A Japanese Patent Laid-Open No. 2012-200351
- the amount of blast used to remove deposits is larger than the amount of blast required to secure the biochemical oxygen demand (BOD) required for activated sludge, for example. If the amount of explosion was increased to increase the effect, there was a case where a large amount of energy was consumed due to the explosion. Further, in order to grasp the fouling state of the separation membrane, expensive inspection equipment such as a fluorescence sensor and a centrifuge is required. In addition, in the inspection using the inspection equipment, it is necessary to perform laborious measurement work, and it is difficult to always monitor the fouling state.
- BOD biochemical oxygen demand
- the present invention provides a separation membrane diagnosis method, a water treatment method, a separation membrane diagnosis device, a water treatment device, and a separation membrane diagnosis that can reduce water treatment costs by accurately grasping the state of the separation membrane used for water treatment. It is a program.
- One aspect of the present invention includes an acquisition step of acquiring an index representing a state of a separation membrane that performs solid-liquid separation, a time-change recording step of recording a time-dependent change of the acquired index, and the recorded time-dependent change It is a separation membrane diagnostic method including a vibration analysis step of analyzing vibration and a determination step of determining a water permeation state of the separation membrane based on the analyzed vibration.
- the recorded vibration with time change is frequency-converted
- the water permeability state of the separation membrane is determined based on the magnitude of the frequency-converted vibration.
- the water permeability state of the separation membrane is determined based on the magnitude of the vibration in a predetermined frequency band subjected to frequency conversion.
- the water permeability state of the separation membrane is determined by comparing the magnitude of the vibration in the first frequency band with the magnitude of the vibration in the second frequency band.
- the contribution ratio of the vibration magnitude in the first frequency band is compared with the contribution ratio of the vibration magnitude in the second frequency band.
- the water permeability state of the separation membrane is determined.
- One aspect of the present invention includes an operation condition changing step of changing an operation condition of solid-liquid separation using the separation membrane based on a water permeability state of the separation membrane that performs solid-liquid separation determined in the determination. Is the method.
- the operating condition in the operating condition changing step, is changed by changing the amount of explosion that explodes the separation membrane.
- the operating condition in the operating condition changing step, is changed by changing the amount of permeated water of the separation membrane.
- One aspect of the present invention further includes a notifying step for notifying information for prompting maintenance of the separation membrane based on the determined water permeability state.
- One aspect of the present invention is an acquisition unit that acquires an index that represents a state of a separation membrane that performs solid-liquid separation, a time-change recording unit that records a change over time of the acquired index, and the recorded change over time
- a separation membrane diagnostic apparatus including a vibration analysis unit that analyzes vibration and a determination unit that determines a water permeation state of the separation membrane based on the analyzed vibration.
- One aspect of the present invention is recorded with a separation membrane that performs solid-liquid separation, an acquisition unit that acquires an index that represents the state of the separation membrane, and a time-change recording unit that records a change over time of the acquired index.
- the vibration analysis unit for analyzing the vibration of the secular change, the determination unit for determining the water permeation state of the separation membrane based on the analyzed vibration, and the separation membrane based on the determined water permeation state It is a water treatment apparatus provided with the operation condition change part which changes the operation conditions of solid-liquid separation.
- One aspect of the present invention is an acquisition process for acquiring an index representing a state of a separation membrane for performing solid-liquid separation, a time-change recording process for recording a change over time of the acquired index, A separation membrane diagnostic program for causing a computer to execute vibration analysis processing for analyzing vibration and determination processing for determining a water permeation state of the separation membrane based on the analyzed vibration, and a storage medium storing the program is there.
- a separation membrane diagnostic method, a water treatment method, a separation membrane diagnostic device, a water treatment device, and a water treatment cost can be reduced by accurately grasping the state of a separation membrane used for water treatment, and A separation membrane diagnostic program and a storage medium on which the program is recorded can be provided.
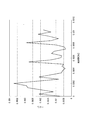
- the graph which shows an example of a time-dependent change in the measurement of the membrane resistance of a separation membrane using the separation membrane diagnostic apparatus in one Embodiment of this invention The graph which shows an example which approximated the time-dependent change in the measurement of the membrane resistance of the separation membrane using the separation membrane diagnostic apparatus in one Embodiment of this invention.
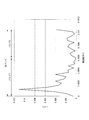
- the graph which shows an example of transition of the contribution rate when changing the explosion amount in the measurement using the separation membrane diagnostic apparatus in one Embodiment of this invention The graph which shows the diagnostic result of the separation membrane in the measurement using the separation membrane diagnostic apparatus in one Embodiment of this invention.
- the graph which shows the diagnostic result of the separation membrane in the measurement using the separation membrane diagnostic apparatus in one Embodiment of this invention The graph which shows the diagnostic result of the separation membrane in the measurement using the separation membrane diagnostic apparatus in one Embodiment of this invention.
- the graph which shows the diagnostic result of the separation membrane in the measurement using the separation membrane diagnostic apparatus in one Embodiment of this invention The graph which shows the diagnostic result of the separation membrane in the measurement using the separation membrane diagnostic apparatus in one Embodiment of this invention.
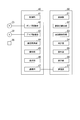
- FIG. 1 is a diagram illustrating an example of a configuration of a water treatment device in the present embodiment.
- the water treatment apparatus of FIG. 1 illustrates an MBR that separates activated sludge with a separation membrane.
- a water treatment apparatus 100 includes a water tank 11, a raw water flow path 12, an excess sludge flow path 13, a separation membrane 21, a permeate flow path 22, a suction pump 23, a drainage flow path 24, a differential pressure gauge 25, an air diffuser 31, It has a blower 32, a water treatment control device 40, and a separation membrane diagnostic device 50.
- the water tank 11 is a biological reaction tank that treats raw water flowing from the raw water flow path 12 by a biological reaction using activated sludge.
- the aquarium 11 discharges excess sludge from the excess sludge flow path 13 in order to bring MLSS (Mixed Liquir Suspended Solids) into the predetermined range.
- MLSS Mated Liquir Suspended Solids
- the separation membrane 21 is immersed in the treated water containing activated sludge in the water tank 11.
- an MF (microfiltration) membrane, a UF (ultrafiltration) membrane, an NF (nanofiltration) membrane, or the like can be used as the separation membrane 21, for example, an MF (microfiltration) membrane, a UF (ultrafiltration) membrane, an NF (nanofiltration) membrane, or the like.
- an MF membrane having a pore diameter of about 0.01 to 10 ⁇ m may be used.
- the UF membrane has a smaller pore size than the MF membrane.
- the NF membrane is a reverse osmosis membrane such as a RO (Reverse Osmosis) membrane.
- the pore diameter of the separation membrane 21 is appropriately selected depending on the size of the particles to be separated.
- the material of the separation membrane 21 is PSF (polysulfone), PE (polyethylene), CA (cellulose acetate), PAN (polyacrylonitrile), PP (polypropylene), PVDF (polyvinylidene fluoride), PTFE (polytetrafluoroethylene), etc. Can be used.
- the separation membrane 21 can be made of an inorganic material such as ceramic.
- the separation membrane 21 may be a separation membrane element in which a plurality of membranes of the above materials are arranged and integrated with parts such as a membrane support. Further, the separation membrane 21 may be a separation membrane module in which separation membrane elements are arranged in a sheet shape or a tubular shape.
- the sheet-like separation membrane module for example, a flat membrane module or a spiral type module can be used.
- the tubular separation membrane module for example, a hollow fiber module in which a number of hollow fibers are bundled and both ends are embedded in a resin can be used.
- the suction pump 23 sucks permeate from the separation membrane 21 through the permeate flow path 22.
- the amount of permeated water sucked by the suction pump 23 affects the permeation flux (flux (also referred to as “filtration flow rate”)) in the separation membrane 21.
- the permeation flux is the amount of permeate per surface area of the separation membrane. If the surface area of the separation membrane 21 is constant, the permeate flux increases as the amount of permeate increases, and the permeate flux decreases as the amount of permeate decreases.
- suction pump 23 By stopping the suction pump 23 for a certain period of time, the progress of fouling can be delayed. Note that while the suction pump 23 is stopped, for example, backwashing may be performed in which the separation membrane 21 is washed by applying a water pressure in the opposite direction to the suction to the separation membrane 21.
- the suction pump 23 is driven by the water treatment control device 40, and the amount of permeated water is adjusted by suction of the suction pump.
- the suction pump 23 drains the sucked permeated water from the drain passage 24.
- the differential pressure gauge 25 measures the differential pressure between the primary side and the secondary side of the separation membrane 21 generated by the suction pump 23, and outputs the measured differential pressure data to the water treatment control device 40.
- the differential pressure gauge 25 outputs the measured differential pressure data to the water treatment controller 40 as a current value of 4 to 20 mA, for example. Since the separation membrane 21 illustrated in FIG. 1 is immersed in the water tank 11 opened to the atmosphere at a predetermined water depth, the primary side of the separation membrane 21 has a constant pressure.
- the differential pressure gauge 25 can measure the differential pressure between the atmospheric pressure and the pressure on the secondary side of the separation membrane 21 (the suction side of the suction pump 23) as the differential pressure between the primary side and the secondary side of the separation membrane 21.
- the air diffuser 31 is installed in the lower part of the separation membrane 21 in the water of the water tank 11, and explodes air from the air hole provided in the air diffuser 31.
- the air exploded from the air diffuser 31 performs a cleaning operation that physically vibrates the separation membrane 21 and peels off deposits adhering to the surface of the separation membrane 21. Separation of deposits by explosion is called air cleaning.
- Air blown from the air diffuser 31 is supplied by the blower 32.
- the size of the bubbles expelled from the air diffuser 31 and the speed of the bubbles vary depending on the size of the air holes of the air diffuser 31 and the air pressure of the air supplied from the blower.
- the magnitude of the cleaning power by air cleaning can be adjusted by controlling the air pressure supplied from the blower.
- the arrangement position of the air diffusing tube 31 and the shape of the separation membrane 21 can be determined so that the cleaning power of air cleaning is improved.
- the separation membrane 21 is arranged to be long in the vertical direction of the water tank 11, thereby extending the time for the separation membrane 21 to contact the bubbles. Therefore, the cleaning power of air cleaning can be improved.
- the blower 32 is driven by the water treatment control device 40.
- the blower 32 can change the air pressure of the air supplied to the air diffuser 31 by the rotation speed of the motor by the water treatment control device 40.
- the water treatment control device 40 drives the suction pump 23 and the blower 32 and acquires differential pressure data from the differential pressure gauge 25.
- the water treatment control device 40 outputs the acquired differential pressure data to the separation membrane diagnostic device 50 and acquires information for changing the operating conditions of the suction pump 23 or the blower 32 from the separation membrane diagnostic device 50. Details of the water treatment control device 40 will be described later with reference to FIG.
- the separation membrane diagnostic device 50 diagnoses the water permeability state of the separation membrane 21.
- the separation membrane diagnostic apparatus 50 will explain a case where the fouling state in the separation membrane 21 in the MBR is diagnosed as the water permeable state of the separation membrane 21.
- the MBR in the present embodiment is not limited to the integrated MBR.
- This embodiment may be implemented in, for example, a separate water tank type MBR in which a separation membrane water tank in which a separation membrane is immersed is provided separately from the water tank 11 and treated water is circulated between the separation membrane water tank and the water tank 11.
- the present embodiment may be implemented in an outside tank type MBR in which a separation membrane casing in which the separation membrane is immersed is provided outside the water tank 11 and treated water is supplied to the casing.
- 1 illustrates the case where the secondary side of the separation membrane 21 is sucked by the suction pump 23 to allow permeate to pass therethrough.
- the separation membrane 21 is installed at a position lower than the water tank 11, and the water tank
- the permeated water may be permeated by applying water pressure to the primary side of the separation membrane 21 due to a drop between the separation membrane 11 and the separation membrane 21.
- description of the structure of the water treatment apparatus 100 using FIG. 1 is complete
- FIG. 2 is a diagram illustrating an example of functional configurations of the water treatment control device 40 and the separation membrane diagnostic device 50 of the water treatment device 100 in the present embodiment.
- the water treatment control device 40 has functions of a control unit 41, a pump drive unit 42, a blower drive unit 43, a differential pressure acquisition unit 44, an operation unit 45, a display unit 46, and a communication unit 47.
- the separation membrane diagnostic apparatus 50 has functions of a control unit 51, a membrane resistance calculation unit 52, a frequency analysis unit 53, a determination unit 54, an operation unit 55, a display unit 56, and a communication unit 57.
- each function of the water treatment control device 40 shown in FIG. 2 can be realized by a program (software) executed by a computer. Moreover, each said function of the separation membrane diagnostic apparatus 50 is realizable in the program (software) performed with a computer. However, any one or more of the above functions of the water treatment control device 40 may be realized in hardware. In addition, any one or more of the above functions of the separation membrane diagnostic apparatus 50 may be realized in hardware. Further, in FIG. 2, each function of the water treatment control device 40 or the separation membrane diagnostic device 50 is described as one function block illustrated by a frame line, but a plurality of functions are realized by one function block. May be. Similarly, each function of the water treatment control device 40 or the separation membrane diagnostic device 50 may be realized by a plurality of functional blocks.
- the control unit 41 controls the operation of the water treatment control device 40.
- the control unit 41 includes an arithmetic processing unit such as a CPU (Central Processing Unit), for example, and each function of the pump drive unit 42, the blower drive unit 43, the differential pressure acquisition unit 44, the operation unit 45, the display unit 46, and the communication unit 47. It may be one that controls.
- a CPU Central Processing Unit
- the pump drive unit 42 drives the suction pump 23.
- the pump drive unit 42 controls, for example, an inverter drive circuit (not shown) to control the rotation speed of the motor that drives the suction pump 23.
- the control of the rotational speed of the motor includes ON / OFF control for turning on / off the motor.
- the blower drive unit 43 drives the blower 32.
- the blower drive unit 43 controls, for example, an inverter drive circuit (not shown) to control the rotation speed of a motor that drives the blower 32.
- the control of the rotational speed of the motor includes ON / OFF control for turning on / off the motor.
- the differential pressure acquisition unit 44 acquires differential pressure data measured by the differential pressure gauge 25.
- the differential pressure data acquired by the differential pressure acquisition unit 44 is monitored by, for example, the control unit 41, and issues a warning that prompts cleaning when the differential pressure data exceeds a preset threshold value.
- the differential pressure data acquired by the differential pressure acquisition unit 44 is output to the separation membrane diagnostic apparatus 50.
- the operation unit 45 is operated by an operator of the water treatment control device 40.
- the operation unit 45 is, for example, a keyboard.
- the display unit 46 displays the state of the water treatment control device 40 and the like to the operator of the water treatment control device 40.
- the display unit 46 displays, for example, a warning that prompts the cleaning described above.
- the display unit 46 is, for example, a display or a lamp.
- the operation unit 45 and the display unit 46 may be a device that performs operation input and display, such as a touch panel.
- the communication unit 47 communicates with the communication unit 57 of the separation membrane diagnostic apparatus 50. Communication between the communication unit 47 and the communication unit 57 can be performed by wired communication or wireless communication.
- the control unit 51 controls the operation of the separation membrane diagnostic apparatus 50.
- the control unit 51 includes an arithmetic processing unit such as a CPU, for example, and controls each function of the membrane resistance calculation unit 52, the frequency analysis unit 53, the determination unit 54, the steering unit 55, the display unit 56, and the communication unit 57. May be.
- the membrane resistance calculation unit 52 calculates the membrane resistance of the separation membrane 21.
- the membrane resistance R is calculated from the equation (1).
- R P / F (KPa / (m / day)) (1)
- P differential pressure of separation membrane 21 (KPa)
- the differential pressure of the separation membrane 21 can be acquired from the differential pressure gauge 25 as differential pressure data. Further, since the surface area of the separation membrane 21 is constant, the permeation flow rate can be obtained by measuring the amount of permeated water (m 3 / day) of the separation membrane 21 with a flow meter (not shown). For example, when the pump drive unit 42 is controlled to keep the amount of permeated water of the separation membrane 21 constant, the permeate flow velocity F becomes a constant value.
- the membrane resistance calculation unit 52 calculates the rate of increase of the membrane resistance R (referred to as “membrane resistance increase rate”).
- the rate of increase in membrane resistance is the change in membrane resistance R per predetermined time.
- the rate of increase of the membrane resistance R is calculated as a change per minute. That is, the rate of increase in film resistance is expressed by equation (2).
- Membrane resistance increase rate ⁇ R / min (KPa / ((m / day) ⁇ min)) (2)
- ⁇ R change in membrane resistance R (KPa / (m / day))
- the membrane resistance calculation unit 52 calculates the membrane resistance R at a rate of once per second, and sets the change in the calculated membrane resistance R as an approximate value with a value of 7 minutes. Can be calculated.
- the membrane resistance increase rate in 7 minutes is approximated by calculating the membrane resistance increase rate in one suction time (7 minutes) in the interval operation in which the suction pump 23 sucks for 7 minutes and stops for 1 minute. It is to do.
- the membrane resistance calculation unit 52 records the calculated membrane resistance increase rate.
- the record of the film resistance increasing speed can be stored in a storage device such as a memory (not shown).
- the rate of increase in membrane resistance is 0 (KPa / ((m / day) ⁇ min)).
- the adhesion of the adhering portion to the separation membrane 21 also changes over time.
- attachment adhering to the separation membrane 21 is physically peeled by the vibration by explosion, the peeling amount of a deposit
- the membrane resistance calculation unit 52 records the state of the separation membrane 21 as a change in the membrane resistance increase rate.
- the rate of increase in membrane resistance is an aspect of an index representing the state of the separation membrane.
- the membrane resistance increase rate is described as an index representing the state of the separation membrane, but the index representing the state of the separation membrane is not limited to the membrane resistance increase rate.
- the membrane resistance increase rate can be calculated based on the differential pressure of the separation membrane 21 and the flow rate of the permeated water. Therefore, for example, the differential pressure of the separation membrane 21, the flow rate of permeated water of the separation membrane 21, the permeation flow rate of the separation membrane 21, etc. may be used as an index representing the state of the separation membrane. That is, the index indicating the state of the separation membrane 21 may be an index indicating that the permeation performance of the separation membrane 21 changes with time (referred to as “time-dependent change”) due to fouling or the like.
- the frequency analysis unit 53 frequency-converts the calculated vibration of the membrane resistance increasing speed and analyzes the vibration of the membrane resistance increasing speed.
- the vibration of the membrane resistance increase rate refers to the fluctuation of the membrane resistance increase rate recorded at a predetermined time interval. When the membrane resistance increase rate is calculated every 7 minutes, the vibration of the membrane resistance increase rate becomes a fluctuation of the membrane resistance increase rate every 7 minutes.
- the frequency analysis unit 53 performs frequency conversion using, for example, fast Fourier transform (FFT: Fast Fourier Transform).
- FFT Fast Fourier Transform
- the frequency analysis unit 53 may transmit vibration data of the membrane resistance increasing speed to an FFT analyzer outside the separation membrane diagnostic apparatus 50 (not shown) to obtain frequency-converted data.
- the frequency analysis unit 53 hereinafter refers to the frequency-converted vibration of the film resistance increasing speed as “frequency conversion data”.
- the frequency conversion data includes the frequency and the magnitude of vibration of the film resistance increasing speed (hereinafter referred to as “power”).
- the frequency analysis unit 53 outputs the frequency conversion data to
- the determination part 54 determines the water permeation state of the separation membrane 21 based on the frequency conversion data. In this embodiment, the case where the fouling state of the separation membrane 21 is determined as the water-permeable state of the separation membrane 21 will be described.
- the determination unit 54 pays attention to a predetermined frequency band in the frequency conversion data, and determines the water permeability state of the separation membrane 21 based on the power in the frequency band.
- the determination algorithm of the determination unit 54 that focuses on a predetermined frequency band is arbitrary.
- the determination unit 54 determines the water permeable state based on the power in a predetermined frequency band.
- the predetermined frequency band is, for example, a frequency band equal to or lower than a predetermined frequency, a frequency band equal to or higher than a predetermined frequency, a frequency band equal to or higher than the first frequency and equal to or lower than the second frequency, and the like.
- the determination unit 54 can determine whether the power exceeds a predetermined threshold (upper limit value or lower limit value) by comparing the power with a threshold value in a predetermined frequency band.
- the power to be compared with the threshold is a maximum value of power, an average value of power, a power contribution rate, or the like.
- the power contribution rate can be calculated based on Equation (3).
- the determination part 54 determines a water-permeable state by comparing a contribution rate and a threshold value.
- the determination unit 54 may determine the water permeation state by separating the frequency conversion data into a plurality of frequency bands and comparing the power for each frequency band. For example, the determination unit 54 can determine the water permeation state by separating the first frequency band and the second frequency band and comparing the power of the first frequency band and the second frequency band.
- the first frequency band is, for example, a low frequency region.
- the second frequency band is, for example, a high frequency band.
- the comparison of power for each frequency band includes, for example, comparison of maximum power values, comparison of average power values, comparison of power contribution ratios, and the like.
- the determination unit 54 can determine the determination of the water permeability state of the separation membrane 21 as a multi-stage evaluation. For example, the determination unit 54 determines the first stage for determining that no fouling occurs, the second stage for determining mild fouling, the third stage for determining moderate fouling, and determines that the fouling is severe. As a fourth stage, determination for evaluating the separation membrane 21 is performed. The determination unit 54 outputs the determination result to the water treatment control device 40.
- the operation unit 55 is operated by an operator of the separation membrane diagnostic apparatus 50.
- the operation unit 55 is, for example, a keyboard.
- the display unit 56 displays the state of the separation membrane diagnostic device 50 and the like to the operator of the separation membrane diagnostic device 50.
- the display part 56 displays the determination result in the determination part 54, for example.
- the display unit 56 is, for example, a display or a lamp.
- the operation unit 55 and the display unit 56 may be a device that performs operation input and display, such as a touch panel.
- the communication unit 57 communicates with the communication unit 47 of the water treatment control device 40. Above, description of the function of the water treatment control apparatus 40 and the separation membrane diagnostic apparatus 50 using FIG. 2 is complete
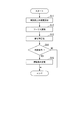
- FIG. 3 is a flowchart showing an example of the operation of the separation membrane diagnostic apparatus in the present embodiment.
- the flowchart shown in FIG. 3 is executed in the functions of the control unit 51 and the like shown in FIG.
- the separation membrane diagnostic apparatus 50 calculates the rate of increase in membrane resistance (step S11).
- the calculation of the rate of increase in membrane resistance is approximated by the suction time by the suction pump 23 for 7 minutes.
- the separation membrane diagnostic apparatus 50 After performing the process of step S11, the separation membrane diagnostic apparatus 50 performs a Fourier transform on the fluctuation (vibration) of the membrane resistance increase rate by an FFT analyzer, and performs frequency analysis on the power of the membrane resistance increase rate (step S12).
- the separation membrane diagnostic apparatus 50 calculates a contribution rate.
- the calculation of the contribution rate will be described later with reference to FIG. 14 as an example of calculating the contribution rate in the low frequency band as the first frequency band and the contribution rate in the high frequency band as the second frequency band.
- the separation membrane diagnostic apparatus 50 determines whether or not to determine the water permeability state of the separation membrane 21 (step S14).
- the determination as to whether or not to determine the water permeability state of the separation membrane 21 is, for example, whether or not the water treatment apparatus 100 is in operation, whether or not it is a predetermined determination time, and the like.
- the separation membrane diagnostic device 50 ends the process shown in the flowchart of FIG. Note that the flowchart of FIG. 3 is repeatedly executed after completion.
- step S15 when it is determined that the water permeation state of the separation membrane 21 is determined (step S14: YES), the separation membrane diagnostic apparatus 50 executes an operation condition changing process (step S15). Details of the operation condition changing process in step S15 will be described later with reference to FIGS. After performing the process of step S15, the separation membrane diagnostic apparatus 50 ends the process shown in the flowchart of FIG. Above, description of operation
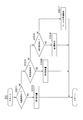
- FIG. 4 is a flowchart showing an example of the first operation of the operation condition changing process of the separation membrane diagnostic apparatus 50 in the present embodiment.
- the first operation of the operation condition changing process is an operation for changing the operation condition of the water treatment device 100 by changing the explosion amount based on the determination result of the water permeability state of the separation membrane 21.
- the separation membrane diagnostic apparatus 50 determines whether or not the determination condition is A1 (step S1511).
- the determination condition is A1, for example, indicates that the water permeable state of the separation membrane 21 is good. For example, when the contribution rate of the low frequency band is 60% or more, the separation membrane diagnostic apparatus 50 determines that the determination condition is A1.
- Whether or not the determination condition is A1, for example, may be determined that the determination condition is A1 when the contribution rate in a predetermined time, or the maximum value or average value of the contribution rate is 60% or more. .
- the predetermined time is, for example, two days. When there is a lot of noise in the differential pressure data, it is possible to reduce the influence of noise by taking a long time.
- step S1511 YES
- the separation membrane diagnostic device 50 instructs the water treatment control device 40 so that the amount of explosion using the blower 32 becomes the first amount of explosion.
- the instruction is output (step S1512).
- the first explosion amount is a smaller explosion amount than a second explosion amount described later. It is assumed that the water treatment control device 40 drives the blower 32 in the blower drive unit 43 in accordance with the instruction acquired from the separation membrane diagnostic device 50. After performing the process of step S1512, the separation membrane diagnostic apparatus 50 ends the process of step S15 shown in FIG.
- the separation membrane diagnostic apparatus 50 determines whether or not the determination condition is A2 (step S1513).
- the determination condition being A2 indicates that, for example, mild fouling has occurred in the separation membrane 21. For example, when the contribution rate of the low frequency band is 50% or more and less than 60%, the separation membrane diagnostic apparatus 50 determines that the determination condition is A2.
- the separation membrane diagnostic device 50 instructs the water treatment control device 40 so that the amount of explosion using the blower 32 becomes the second amount of explosion.
- the instruction is output (step S1514).
- the second explosion amount is larger than the first explosion amount and smaller than a third explosion amount described later.
- step S1513 NO
- the separation membrane diagnostic apparatus 50 determines whether or not the determination condition is A3 (step S1515).
- the determination condition being A3 indicates that, for example, moderate fouling has occurred in the separation membrane 21.
- the separation membrane diagnostic apparatus 50 determines that the determination condition is A3.
- step S1515: YES the separation membrane diagnostic apparatus 50 instructs the water treatment control apparatus 40 so that the explosion amount using the blower 32 becomes the third explosion amount.
- the instruction is output (step S1516).
- the third explosion amount is a larger explosion amount than the second explosion amount.
- the separation membrane diagnostic apparatus 50 issues a filter cleaning notification that prompts the cleaning operation of the separation membrane 21 (step S1517).
- the determination condition not A3 indicates that, for example, severe fouling has occurred in the separation membrane 21.
- the filter cleaning notification is, for example, an operation for displaying on the display unit 46 or the display unit 56 urging the cleaning work of the separation membrane 21 or issuing a predetermined alarm from a speaker or the like.
- FIG. 5 is a flowchart showing an example of the second operation of the operating condition changing process of the separation membrane diagnostic apparatus 50 in the present embodiment.
- the second operation of the operation condition changing process is an operation for changing the operation condition of the water treatment device 100 by changing the explosion amount and the flux based on the determination result of the water permeability state of the separation membrane 21.
- One of the first operation of the operation condition changing process described using FIG. 4 and the second operation of the operation condition changing process described using FIG. 5 is performed.
- the separation membrane diagnosis apparatus 50 determines whether or not the determination condition is B1 (step S1521).
- the determination condition being B1 indicates, for example, that the water permeable state of the separation membrane 21 is good. For example, when the contribution rate of the low frequency band is 60% or more, the separation membrane diagnostic apparatus 50 determines that the determination condition is B1.
- Whether or not the determination condition is B1 may be determined that the determination condition is B1 when, for example, the contribution rate in a predetermined time, the maximum value of the contribution rate, or the average value is 60% or more.
- the predetermined time is, for example, two days.
- step S1521 YES
- the separation membrane diagnostic apparatus 50 does not change the operation condition of the water treatment apparatus 100, and ends the process of step S15 shown in FIG.
- the separation membrane diagnostic apparatus 50 starts controlling the amount of explosion using the blower 32 (step S1522).
- the explosion amount control is, for example, control for increasing the explosion amount until the determination condition becomes B1.
- the separation membrane diagnostic device 50 outputs an instruction to increase the amount of explosion to the water treatment control device 40.
- the separation membrane diagnostic apparatus 50 determines whether or not the determination condition is B2 (step S1523).
- the determination condition of B2 indicates that, for example, mild fouling has occurred in the separation membrane 21. For example, when the contribution rate of the low frequency band is 50% or more and less than 60%, the separation membrane diagnostic apparatus 50 determines that the determination condition is B2. If it is determined that the determination condition is B2 (step S1523: YES), the separation membrane diagnostic apparatus 50 ends the process of step S15 shown in FIG. That is, when mild fouling occurs and it is determined that the determination condition is B2, the separation membrane diagnostic apparatus 50 performs only explosion amount control without performing flux control.
- step S1523 NO
- the separation membrane diagnostic apparatus 50 starts flux control using the suction pump 23 (step S1524).
- the flux control is, for example, control for reducing the flux until the determination condition becomes B2.
- the separation membrane diagnostic device 50 outputs an instruction to reduce the flux to the water treatment control device 40.
- the separation membrane diagnostic apparatus 50 determines whether or not the determination condition is B3 (step S1525).
- the determination condition is B3, for example, indicates that moderate fouling has occurred in the separation membrane 21. For example, when the contribution rate of the low frequency band is 40% or more and less than 50%, the separation membrane diagnostic apparatus 50 determines that the determination condition is BB. If it is determined that the determination condition is BB (step S1525: YES), the separation membrane diagnostic apparatus 50 ends the process of step S15 shown in FIG. That is, when the medium fouling occurs and it is determined that the determination condition is B3, the separation membrane diagnostic apparatus 50 performs the flux control and the explosion amount control.
- the separation membrane diagnostic apparatus 50 issues a filter cleaning notification that prompts the cleaning operation of the separation membrane 21 (step S1526).
- the determination condition is not B3, for example, indicates that severe fouling has occurred in the separation membrane 21.
- the filter cleaning notification is, for example, an operation for displaying on the display unit 46 or the display unit 56 urging the cleaning work of the separation membrane 21 or issuing a predetermined alarm from a speaker or the like.
- FIGS. 4 and 5 exemplify the operation of changing the operating condition based on the determination result of the water permeable state of the separation membrane 21, the operation of changing the operating condition based on the determination result of the water permeable state of the separation membrane 21 is illustrated here. It is not limited to. For example, in FIGS. 4 and 5, the case where the water permeation state of the separation membrane 21 is determined in four stages has been described, but three or less stages or five or more stages may be determined. Moreover, although the method of changing the amount of explosions, the method of changing the amount of explosions and a flux was shown as a change of operating conditions, the method of changing only a flux, the method of changing the flow volume of raw water, the method of changing MLSS For example, other operating conditions may be changed.
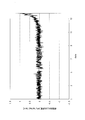
- FIG. 6 is a graph showing an example of the change over time of the membrane resistance of the separation membrane 21 in the present embodiment.
- FIG. 6 shows the change over time in the differential pressure when an interval operation is repeated in which a suction time of 7 minutes by the suction pump 23 and a stop time of 1 minute are repeated.
- One point illustrated in FIG. 6 is the measured differential pressure every minute.
- the difference in pressure during the time t1, t2, t3, etc. is a measured value when the suction pump 23 is stopped.
- FIG. 6 shows that the differential pressure may increase during the suction time of 7 minutes, while the differential pressure may decrease during the suction time of 7 minutes.
- FIG. 7 is a graph showing an example of approximating the change with time of the membrane resistance of the separation membrane 21 in the present embodiment.
- the straight line shown approximates the change in the differential pressure during the suction time of 7 minutes with a straight line.
- the approximation method is arbitrary.
- the linear approximation can be performed by, for example, the least square method. Further, instead of performing linear approximation, curve approximation may be performed.
- the background of the straight line is displayed in white so that the approximate straight line can be easily seen.
- the approximate straight line shown in FIG. 7 indicates that there is a case of a positive slope and a case of a negative slope.
- the slope of the approximate straight line shown in FIG. 7 indicates the film resistance increase rate.
- FIG. 8 is a graph showing an example of a change with time of the rate of increase in membrane resistance of the separation membrane 21 in the present embodiment.
- the horizontal axis indicates the number of days that have elapsed since the day (first day) when the separation membrane 21 was cleaned.
- the vertical axis represents the rate of increase in membrane resistance.
- the film resistance increase rate has changed around 0 (KPa / ((m / day) ⁇ min)) from about the 11th day after the cleaning operation. However, it rapidly increases from around the 12th day, indicating that the membrane resistance R is increasing at an accelerated rate.
- FIG. 8 shows that the permeation performance of the separation membrane 21 by fouling rapidly deteriorates after a predetermined number of days. The separation membrane 21 whose change with time was measured was emergency stopped by fouling on the 13th day. Therefore, for example, even if only the measurement value of the differential pressure gauge is recorded, it is difficult to predict a rapid deterioration of the permeation performance of the separation membrane 21 due to fouling.
- FIG. 9 is a graph showing an example of frequency conversion of the change over time in the rate of increase in membrane resistance after the first time has elapsed since the separation membrane 21 was washed in the present embodiment.
- the first time elapse is the cleaning work execution date in FIG.
- the separation membrane 21 is assumed to be clean by washing.
- the horizontal axis indicates the frequency.
- the entire frequency band is in the vicinity of 0 to 1.05 ⁇ 10 ⁇ 3 (Hz).
- the vertical axis represents the magnitude (power) of the membrane resistance increase rate.
- the graph shown in FIG. 9 uses a Hanning window as a window function in FFT. The FFT is performed once every 80 minutes, and noise is removed by averaging the conversion results for 8 hours before and after. The result shown in FIG.
- the filter 9 has a peak in the vicinity of 0.1 ⁇ 10 ⁇ 3 (Hz), the entire frequency band is 0 to 0.6 ⁇ 10 ⁇ 3 (Hz), the low frequency band, 0.6
- a frequency band of ⁇ 10 ⁇ 3 (Hz) or higher is classified as a high frequency band, the power in the low frequency band is high.
- FIG. 10 is a graph showing an example of frequency conversion of the change over time in the rate of increase in membrane resistance after the second time has elapsed since cleaning of the separation membrane 21 in the present embodiment.
- the second time passage is the seventh day in FIG.
- the elapsed time is roughly in the middle of the thirteenth day when the permeation performance of the separation membrane 21 rapidly deteriorates due to fouling.
- the FFT conditions in FIG. 10 are the same as those in FIG.
- the results shown in FIG. 10 indicate that, as in FIG. 9, the entire frequency band is 0 to 0.6 ⁇ 10 ⁇ 3 (Hz), the low frequency band, and the frequency band of 0.6 ⁇ 10 ⁇ 3 (Hz) or higher. Is classified as a high frequency band, the power in the low frequency band is high. However, peaks also appear in the vicinity of 0.25 ⁇ 10 ⁇ 3 (Hz) and in the vicinity of 0.9 ⁇ 10 ⁇ 3 (Hz), and the power distribution in the entire frequency band is shifted to the high frequency band compared to FIG. .
- FIG. 11 is a graph showing an example of frequency conversion of the change over time in the rate of increase in membrane resistance after the third time has elapsed since the separation membrane 21 was washed in the present embodiment.
- the third time passage is the 11th day in FIG.
- the 11th day is 2 days before the permeation performance of the separation membrane 21 is rapidly deteriorated due to fouling, and the magnitude of the rate of increase in membrane resistance shown in FIG. 8 is after the first time and the second time. There is no difference.
- the FFT conditions in FIG. 11 are the same as those in FIGS.
- the results shown in FIG. 11 indicate that, as in FIG. 9, when the entire frequency band is 0 to 0.6 ⁇ 10 ⁇ 3 (Hz), the power peak is dispersed in the entire frequency band. That is, the magnitude of the film resistance increase rate for which no difference is recognized in FIG. 8 is expressed as a large difference after frequency conversion. This is the end of the description of the result of frequency conversion of the time-dependent change in the membrane resistance increase rate with reference to FIGS.
- FIG. 12 is a graph showing an example of a frequency band setting method for calculating the contribution rate in the present embodiment.
- the graph shown in FIG. 12 uses the graph shown in FIG.
- the entire frequency band (all bands) is 0 to 1.05 ⁇ 10 ⁇ 3 (Hz).
- the first frequency band (band 1) is 0 to 0.6 ⁇ 10 ⁇ 3 (Hz).
- the second frequency band (band 2) is 0.6 ⁇ 10 ⁇ 3 to 1.05 ⁇ 10 ⁇ 3 (Hz).
- the contribution rate in the first frequency band is defined as a band 1 contribution rate
- the contribution rate in the second frequency band is defined as a band 2 contribution rate.
- the calculation method of the band 1 contribution ratio and the band 2 contribution ratio is calculated by Expression (3).
- FIG. 12 shows the case where the entire frequency band is divided into two frequency bands and the first frequency band and the second frequency band are set as the determination target frequency bands.
- the setting method is not limited to this.
- the first frequency band and the second frequency band may be discontinuous frequency bands.
- a predetermined part of the entire frequency band may be determined.
- the entire frequency band may be divided into three or more frequency bands to be determined.
- FIG. 13 is a graph showing an example of transition of the band 1 contribution ratio and the band 2 contribution ratio in the present embodiment.
- the band 1 contribution rate is higher than the band 2 contribution rate.
- the band 1 contribution rate decreases and the band 2 contribution rate rises, and the band 1 contribution rate graph and the band 2 contribution rate graph are interlaced.
- the ninth day is four days before the permeation performance of the separation membrane 21 suddenly deteriorates. That is, FIG. 13 shows that a fouling sign can be determined based on the transition of the contribution rate. Since the signs of fouling can be determined in advance, it is possible to prevent an emergency stop of water treatment due to fouling by the pre-cleaning work, and it is possible to reduce the cleaning cost associated with the regular cleaning work. . Above, description of transition of the band 1 contribution rate and the band 2 contribution rate using FIG. 13 is complete
- FIG. 14 is a graph showing an example of the transition of the contribution rate when the explosion amount is changed in the present embodiment.
- the band 1 contribution rate graph and the band 2 contribution rate graph are interlaced to show signs of fouling.
- the band 1 contribution rate increases and the band 2 contribution rate decreases, indicating that the signs of fouling have disappeared. That is, based on the contribution rate, it can be determined that the permeation performance of the separation membrane 21 has been recovered by explosion or the like.
- the operating conditions described with reference to FIGS. 3 to 5 are changed based on the contribution rate.
- FIG. 14 shows that in this embodiment, it is possible to change the appropriate operating conditions based on the contribution rate. Above, description of transition of the contribution rate when changing the amount of explosions using FIG. 14 is complete
- the separation membrane diagnostic apparatus 50 in this embodiment was demonstrated as what diagnoses the water permeation state of the separation membrane 21 in MBR, the separation membrane diagnostic apparatus 50 is a pure water manufacturing system, a water treatment system, seawater, for example It can also be applied to diagnosis of the water permeability of the separation membrane in a desalination system or the like.
- the separation membrane diagnostic method includes an acquisition step, a time-change recording step, a vibration analysis step, and a determination step, so that the state of the separation membrane used for water treatment is determined.
- a separation membrane diagnosis method a water treatment method, a separation membrane diagnosis device, a water treatment device, a separation membrane diagnosis program, or a storage medium on which the program is recorded, which can reduce water treatment costs by accurately grasping be able to.
- the above-described apparatus may be realized by a computer.
- a program for realizing the function of each functional block is recorded on a computer-readable recording medium.
- the program recorded on the recording medium may be read by a computer system and executed by the CPU.
- the “computer system” here includes hardware such as an OS (Operating System) and peripheral devices.
- the “computer-readable recording medium” refers to a portable medium such as a flexible disk, a magneto-optical disk, a ROM, and a CD-ROM.
- the “computer-readable recording medium” includes a storage device such as a hard disk built in the computer system.
- the “computer-readable recording medium” may include a medium that dynamically holds a program for a short time.
- the “computer-readable recording medium” may include a medium that holds a program for a certain period of time, such as a volatile memory inside a computer system that serves as a server or a client.
- the program may be for realizing a part of the functions described above.
- the program may be a program that can realize the above-described functions in combination with a program already recorded in the computer system.
- the program may be realized using a programmable logic device.
- the programmable logic device is, for example, an FPGA (Field Programmable Gate Array).
- each functional unit of the apparatus described with reference to the drawings is a software functional unit, but a part or all of the functions may be a hardware functional unit such as an LSI.
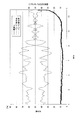
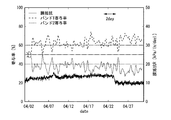
- Example 1 An example in which MBR film fouling is predicted is shown in FIG. FIG. 15 shows changes in the membrane resistance R, the band 1 contribution ratio, and the band 2 contribution ratio of the separation membrane 21 in the present embodiment.
- the membrane resistance increased rapidly from February 13, and operation was stopped on February 14.
- a method of predicting this sudden rise using the transition of the band 1 contribution rate will be described.
- the value of the band 1 contribution ratio for two days is determined as a sign of fouling.
- the method for calculating the band 1 contribution rate is as described above.
- the band 1 contribution ratio does not maintain 60% or less for 2 days, and it can be determined that the water permeability of the separation membrane is good. From February 9, it can be determined that the contribution ratio of the band 1 is maintained at 50% or less for 2 days and the state of the separation membrane is poor. This made it possible to predict fouling a few days ago.
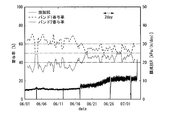
- FIG. 16 shows an example in which MBR film fouling is predicted in the same manner as in Example 1.
- FIG. 16 shows an operation example from June 1 to July 4, and the film resistance suddenly increased on July 4 and the operation was stopped. From June 1 to June 17 in the initial operation, the band 1 contribution ratio does not maintain 60% or less for 2 days, and it can be determined that the water permeability of the separation membrane is good. From June 17, it can be determined that the band 1 contribution ratio is maintained at 60% or less and the state of the separation membrane is poor. This made it possible to predict fouling from about two weeks ago.
- FIG. 17 shows an example in which MBR film fouling is predicted under the same conditions as in Example 1.
- FIG. 17 shows an operation example from March 1 to March 10, and the film resistance increased from March 6, and the operation was stopped on March 10. From March 1 of the operation start date, it can be determined that the band 1 contribution ratio is maintained at 60% or less for 2 days and the state of the separation membrane is poor. As a result, it was possible to predict fouling from several days ago.
- FIG. 18 shows an example in which MBR film fouling is predicted under the same conditions as in Example 1.
- FIG. 18 shows an example of operation from April 1 to April 30, and the membrane resistance did not increase after one month of operation. From April 1 of the operation start date, it can be determined that the band 1 contribution ratio does not maintain 60% or less for two days, and the water permeability of the separation membrane is good and fouling does not occur.
- FIG. 19 shows an example in which MBR film fouling is predicted under the same conditions as in Example 1.
- FIG. 19 shows an operation example from March 4th to March 19th. From March 10, it can be judged that the band 1 contribution ratio is maintained at 60% or less for 2 days and the state of the separation membrane is poor. According to this result, the explosion air volume was changed 1.5 times on March 16. Thereafter, the pressure difference does not rapidly increase, and the band 1 contribution ratio does not maintain 60% or less, and it can be determined that the water permeability of the separation membrane is improved.
Landscapes
- Chemical & Material Sciences (AREA)
- Chemical Kinetics & Catalysis (AREA)
- Dispersion Chemistry (AREA)
- Physics & Mathematics (AREA)
- Health & Medical Sciences (AREA)
- Life Sciences & Earth Sciences (AREA)
- Analytical Chemistry (AREA)
- Biochemistry (AREA)
- General Health & Medical Sciences (AREA)
- General Physics & Mathematics (AREA)
- Immunology (AREA)
- Pathology (AREA)
- Separation Using Semi-Permeable Membranes (AREA)
Abstract
水処理に用いる分離膜の状態を正確に把握することにより水処理コストを低減することができる、分離膜診断方法、水処理方法、分離膜診断装置、水処理装置及び分離膜診断プログラムまたは当該プログラムが記録された記憶媒体を提供する。 分離膜診断方法は、固液分離を行う分離膜の状態を表す指標を取得する取得ステップと、取得された指標の経時変化を記録する経時変化記録ステップと、記録された経時変化の振動を解析する振動解析ステップと、解析された振動に基づいて分離膜の透水状態を判定する判定ステップとを含む。
Description
本発明は、分離膜診断方法、水処理方法、分離膜診断装置、水処理装置及び分離膜診断プログラムに関する。
本願は、2016年2月1日に、日本に出願された特願2016-017371号に基づき優先権を主張し、その内容をここに援用する。
本願は、2016年2月1日に、日本に出願された特願2016-017371号に基づき優先権を主張し、その内容をここに援用する。
従来、下水道等の水処理において、固液分離を行う分離膜を用いた膜分離活性汚泥法(MBR:Membrane Bioreactor)が用いられている。MBRにおいては、活性汚泥から液体の透過水を分離するときに、時間の経過とともに汚泥に含まれる付着物質が分離膜の表面に累積したり分離膜の透過流路を閉塞したりして分離膜の透過性能が低下するファウリングと呼ばれる現象が発生する。ファウリングが進行して分離膜の透過性能が低下した場合には清掃によって分離膜に付着した付着物を剥離するメンテナンスが必要となる。ファウリングによる透過性能の低下は稼働時間に対して一定ではなく、所定の稼働時間を超えると透過性能が急激に低下する。したがって、透過性能が低下するまで分離膜を使用した場合には洗浄のために予定外に水処理を停止しなくてはいけない場合がある。一方、ファウリングによる水処理の予定外の停止を避けるためには、早目に分離膜の洗浄を実施する。分離膜の洗浄においては、所定の薬液が用いられ、分離膜に付着した有機物や微生物を除去する。分離膜の洗浄の回数が多くなると、清掃のための停止により水処理の稼働率が低下する。また、洗浄の回数が多くなると、洗浄作業を行う作業者の労務費、洗浄用の薬品費等のコストが増える。
また、MBRにおいては、分離膜の下方から爆気(エアレーション)を行い、分離膜の表面に付着した付着部を空気の振動で除去することにより、ファウリングの発生を遅らせることができる。
また、MBRにおいて、蛍光センサ等のセンサを用いてファウリングを検出する技術がある(例えば、特許文献1を参照)。また、MBRにおいて、遠心分離機等を用いて汚泥の成分を分析してファウリングを予測する技術がある(例えば、特許文献2を参照)。
しかしながら、付着物の除去に用いる爆気量は、例えば活性汚泥に必要な生物化学的酸素要求量(BOD:Biochemical Oxygen Demand)の確保に必要な爆気量に比べて多いため、付着物を除去する効果を上げるために爆気量を増やすと、爆気のために大きなエネルギーを消費してしまう場合があった。
また、分離膜のファウリング状態を把握するためには、蛍光センサや遠心分離機等の高額な検査機器が必要であった。また、検査機器を用いた検査においては手間の掛る測定作業が必要であり、ファウリング状態を常に監視することは困難であった。
また、分離膜のファウリング状態を把握するためには、蛍光センサや遠心分離機等の高額な検査機器が必要であった。また、検査機器を用いた検査においては手間の掛る測定作業が必要であり、ファウリング状態を常に監視することは困難であった。
本発明は、水処理に用いる分離膜の状態を正確に把握することにより水処理コストを低減することができる、分離膜診断方法、水処理方法、分離膜診断装置、水処理装置及び分離膜診断プログラムである。
本発明の一態様は、固液分離を行う分離膜の状態を表す指標を取得する取得ステップと、取得された前記指標の経時変化を記録する経時変化記録ステップと、記録された前記経時変化の振動を解析する振動解析ステップと、解析された前記振動に基づいて前記分離膜の透水状態を判定する判定ステップとを含む分離膜診断方法である。
本発明の一態様は、前記振動解析ステップにおいて、記録された前記経時変化の振動を周波数変換し、前記判定ステップにおいて、周波数変換した前記振動の大きさに基づいて前記分離膜の透水状態を判定する。
本発明の一態様は、前記判定ステップにおいて、周波数変換した所定の周波数帯域における前記振動の大きさに基づいて前記分離膜の透水状態を判定する。
本発明の一態様は、前記判定ステップにおいて、第1の周波数帯域における前記振動の大きさと、第2の周波数帯域における前記振動の大きさとを比較することにより、前記分離膜の透水状態を判定する。
本発明の一態様は、前記判定ステップにおいて、第1の周波数帯域における前記振動の大きさの寄与率と、第2の周波数帯域における前記振動の大きさの寄与率とを比較することにより、前記分離膜の透水状態を判定する。
本発明の一態様は、前記判定において判定された固液分離を行う分離膜の透水状態に基づき、前記分離膜を用いた固液分離の運転条件を変更する運転条件変更ステップを含む、水処理方法である。
本発明の一態様は、前記運転条件変更ステップにおいて、前記分離膜を爆気する爆気量を変更することにより前記運転条件を変更する。
本発明の一態様は、前記運転条件変更ステップにおいて、前記分離膜の透過水量を変更することにより前記運転条件を変更する。
本発明の一態様は、判定された前記透水状態に基づき、さらに前記分離膜のメンテナンスを促す情報を報知する報知ステップをさらに含む。
本発明の一態様は、固液分離を行う分離膜の状態を表す指標を取得する取得部と、取得された前記指標の経時変化を記録する経時変化記録部と、記録された前記経時変化の振動を解析する振動解析部と、解析された前記振動に基づいて前記分離膜の透水状態を判定する判定部とを備える分離膜診断装置である。
本発明の一態様は、固液分離を行う分離膜と、前記分離膜の状態を表す指標を取得する取得部と、取得された前記指標の経時変化を記録する経時変化記録部と、記録された前記経時変化の振動を解析する振動解析部と、解析された前記振動に基づいて前記分離膜の透水状態を判定する判定部と、判定された前記透水状態に基づき、前記分離膜を用いた固液分離の運転条件を変更する運転条件変更部と、を備える水処理装置である。
本発明の一態様は、固液分離を行う分離膜の状態を表す指標を取得する取得処理と、取得された前記指標の経時変化を記録する経時変化記録処理と、記録された前記経時変化の振動を解析する振動解析処理と、解析された前記振動に基づいて前記分離膜の透水状態を判定する判定処理とをコンピュータに実行させるための分離膜診断プログラムおよび前記プログラムが記録された記憶媒体である。
本発明の一態様により、水処理に用いる分離膜の状態を正確に把握することにより水処理コストを低減することができる、分離膜診断方法、水処理方法、分離膜診断装置、水処理装置及び分離膜診断プログラムおよび前記プログラムが記録された記憶媒体を提供することができる。
以下、図面を参照して、本発明に係る一実施形態における分離膜診断方法、水処理方法、分離膜診断装置、水処理装置及び分離膜診断プログラムまたは当該プログラムが記憶された記憶媒体について説明する。
先ず、図1を用いて、水処理装置の構成を説明する。図1は、本実施形態における、水処理装置の構成の一例を示す図である。図1の水処理装置は、活性汚泥を分離膜により分離するMBRを例示している。
図1において、水処理装置100は、水槽11、原水流路12、余剰汚泥流路13、分離膜21、透過水流路22、吸引ポンプ23、排水流路24、差圧計25、散気管31、ブロア32、水処理制御装置40及び分離膜診断装置50を有する。
水槽11は、原水流路12から流入する原水を、活性汚泥による生物反応によって処理をする生物反応槽である。水槽11は、MLSS(Mixed Liquor Suspended Solids:活性汚泥浮遊物質)を所定範囲内にするために、余剰汚泥流路13から余剰汚泥を排出する。
分離膜21は、水槽11の中の活性汚泥を含む処理水に浸漬される。分離膜21は、例えば、MF(精密ろ過:Microfiltration)膜、UF(限外ろ過:Ultrafiltration)膜、NF(ナノろ過:Nanofiltration)膜等を用いることができる。MBRにおいては、例えば、0.01~10μm程度の孔径のMF膜を用いてもよい。UF膜は、MF膜より小さい孔径を持つ。また、NF膜は、RO(逆浸透:Reverse Osmosis)膜等の逆浸透膜である。分離膜21の孔径は、分離対象の粒子の大きさによって適宜選択される。分離膜21の材質には、PSF(ポリスルホン)、PE(ポリエチレン)、CA(酢酸セルロース)、PAN(ポリアクリロニトリル)、PP(ポリプロピレン)、PVDF(ポリフッ化ビニリデン)、PTFE(ポリテトラフロロエチレン)等を用いることができる。また、分離膜21には、セラミック等の無機物の材質を用いることができる。また、分離膜21は、上記素材の膜を複数配置して膜の支持体等の部品と一体化した分離膜エレメントであってもよい。また、分離膜21は、分離膜エレメントをシート状や管状に配置した分離膜モジュールであってもよい。シート状の分離膜モジュールとしては、例えば、平膜モジュール、スパイラル型モジュールを用いることができる。また、管状の分離膜モジュールとしては、例えば、中空糸を多数本束ねて両端を樹脂に包埋した中空糸モジュールを用いることができる。
吸引ポンプ23は、分離膜21から透過水流路22を通じて透過水を吸引する。吸引ポンプ23により吸引される透過水の量は、分離膜21における透過流束(フラックス(「濾過流速」ともいう))に影響する。透過流束は、分離膜の表面積あたりの透過水の量である。分離膜21の表面積が一定であるとすると、透過水の量が大きくなると透過流束も大きくなり、透過水の量が小さくなると透過流束も小さくなる。透過流束が大きいと、分離膜21におけるファウリングの進行が早くなるため、分離膜21の洗浄の周期が短くなり、洗浄作業時の水処理の停止により所定期間における平均処理量が低下する。一方、透過流束が小さいと、ファウリングの進行は遅くなり、分離膜21の洗浄の周期が長くなるが、透過水の量が小さくなるため、所定期間における平均処理量が低下する。本実施形態では、所定の時間吸引ポンプ23を運転して透過水を吸引した後に吸引ポンプを停止して、一定の時間爆気による分離膜21の洗浄を行うインターバル運転を行う場合を説明する。図6等を用いて説明するインターバル運転においては、7分間の吸引と1分間の停止を繰り返す場合について説明する。一定の時間の吸引ポンプ23の停止を行うことにより、ファウリングの進行を遅らせることができる。なお、吸引ポンプ23の停止の間、例えば、分離膜21に対して吸引と逆方向の水圧を与えて分離膜21を洗浄する逆洗を行うようにしてもよい。吸引ポンプ23は、水処理制御装置40により駆動されて、吸引ポンプの吸引により透過水量が調整される。吸引ポンプ23は、吸引した透過水を排水流路24から排水する。
差圧計25は、吸引ポンプ23によって生じる、分離膜21の1次側と2次側の差圧を測定して、測定した差圧データを水処理制御装置40に出力する。差圧計25は、測定した差圧データを、例えば4~20mAの電流値として水処理制御装置40に出力する。図1に図示する分離膜21は、大気開放された水槽11に所定の水深で浸漬されるため、分離膜21の1次側は一定圧力となる。差圧計25は、大気圧と分離膜21の2次側(吸引ポンプ23の吸引側)の圧力の差圧を分離膜21の1次側と2次側の差圧として測定することができる。
散気管31は、水槽11の水中において分離膜21の下部に設置されて、散気管31に設けられた空気孔から空気を爆気する。散気管31から爆気された空気は、分離膜21を物理的に振動させて、分離膜21の表面に付着した付着物を剥離させる洗浄を行う。爆気による付着物の剥離を空気洗浄という。散気管31から爆気される空気は、ブロア32によって供給される。散気管31から爆気される気泡の大きさ及び気泡の速度は、散気管31の空気孔の大きさとブロアから供給される空気の空気圧によって異なる。空気洗浄による洗浄力の大きさは、ブロアから供給される空気圧を制御することにより調整することができる。なお、散気管31の配置位置及び分離膜21の形状は、空気洗浄の洗浄力が向上するように決定することができる。例えば、爆気された気泡は水槽11の水中を上方に向かって移動するため、分離膜21を水槽11の上下方向に長くなるように配置することにより、分離膜21が気泡に接する時間を長くすることができるので空気洗浄の洗浄力を向上させることができる。
ブロア32は、水処理制御装置40によって駆動される。ブロア32は、水処理制御装置40によってモータの回転速度によって散気管31に供給する空気の空気圧を変更することができる。
水処理制御装置40は、吸引ポンプ23及びブロア32を駆動するとともに、差圧計25から差圧データを取得する。水処理制御装置40は、取得した差圧データを分離膜診断装置50に出力するとともに、分離膜診断装置50から吸引ポンプ23又はブロア32の運転条件を変更するための情報を取得する。なお、水処理制御装置40の詳細は、図2を用いて後述する。
分離膜診断装置50は、分離膜21の透水状態を診断する。以下の説明において、分離膜診断装置50は、分離膜21の透水状態として、MBRにおける分離膜21におけるファウリングの状態を診断する場合を説明する。
なお、図1では、分離膜21を水槽11の処理水に直接浸漬する一体型のMBRを例示したが、本実施形態におけるMBRは、一体型のMBRに限定されるものではない。本実施形態は、例えば、分離膜を浸漬させる分離膜水槽を水槽11とは別個に設け、分離膜水槽と水槽11とで処理水を循環させる水槽別置型のMBRにおいて実施されてもよい。また、本実施形態は、分離膜を浸漬させる分離膜のケーシングを水槽11の外に設け、ケーシングに処理水を送水する槽外型のMBRにおいて実施されてもよい。また、図1においては、分離膜21の2次側を吸引ポンプ23で吸引して透過水を透過する場合を例示したが、例えば、分離膜21を水槽11より低い位置に設置して、水槽11と分離膜21の落差により分離膜21の1次側に水圧をかけて透過水を透過させてもよい。
以上で、図1を用いた、水処理装置100の構成の説明を終了する。
以上で、図1を用いた、水処理装置100の構成の説明を終了する。
次に、図2を用いて、水処理装置100の水処理制御装置40と分離膜診断装置50の機能を説明する。図2は、本実施形態における、水処理装置100の水処理制御装置40と分離膜診断装置50の機能構成の一例を示す図である。
図2において、水処理制御装置40は、制御部41、ポンプ駆動部42、ブロア駆動部43、差圧取得部44、操作部45、表示部46及び通信部47の各機能を有する。分離膜診断装置50は、制御部51、膜抵抗算出部52、周波数解析部53、判定部54、操作部55、表示部56、通信部57の各機能を有する。
図2に示す、水処理制御装置40の上記各機能は、コンピュータで実行されるプログラム(ソフトウェア)において実現することができる。また、分離膜診断装置50の上記各機能は、コンピュータで実行されるプログラム(ソフトウェア)において実現することができる。但し、水処理制御装置40の上記各機能のいずれか1以上の機能はハードウェアにおいて実現されてもよい。また、分離膜診断装置50の上記各機能のいずれか1以上の機能はハードウェアにおいて実現されてもよい。また、図2において水処理制御装置40又は分離膜診断装置50の上記各機能は、それぞれ枠線で図示する1つの機能ブロックとして説明するが、複数の機能を1の機能ブロックで実現するようにしてもよい。同様に、水処理制御装置40又は分離膜診断装置50の上記各機能は、複数の機能ブロックで実現するようにしてもよい。
制御部41は、水処理制御装置40の動作を制御する。制御部41は、例えばCPU(Central Processing Unit)等の演算処理装置を含み、ポンプ駆動部42、ブロア駆動部43、差圧取得部44、操作部45、表示部46及び通信部47の各機能を制御するものであってもよい。
ポンプ駆動部42は、吸引ポンプ23を駆動する。ポンプ駆動部42は、例えば、図示しないインバータ駆動回路を制御して、吸引ポンプ23を駆動するモータの回転数を制御する。モータの回転数の制御には、モータをON/OFFするON/OFF制御も含まれる。
ブロア駆動部43は、ブロア32を駆動する。ブロア駆動部43は、例えば、図示しないインバータ駆動回路を制御して、ブロア32を駆動するモータの回転数を制御する。モータの回転数の制御には、モータをON/OFFするON/OFF制御も含まれる。
差圧取得部44は、差圧計25で測定された差圧データを取得する。差圧取得部44が取得した差圧データは、例えば、制御部41が監視して、予め設定された閾値以上となったときに清掃を促す警告を行う。差圧取得部44が取得した差圧データは、分離膜診断装置50に出力される。
操作部45は、水処理制御装置40の操作者によって操作される。操作部45は、例えば、キーボードである。表示部46は、水処理制御装置40の操作者に対して、水処理制御装置40の状態等を表示する。表示部46は、例えば、上述の清掃を促す警告を表示する。表示部46は、例えば、ディスプレイ、ランプ等である。なお、操作部45と表示部46は、例えばタッチパネルのように操作入力と表示とを行う機器を用いてもよい。通信部47は、分離膜診断装置50の通信部57と通信する。通信部47と通信部57の通信は、有線通信又は無線通信において行うことができる。
制御部51は、分離膜診断装置50の動作を制御する。制御部51は、例えばCPU等の演算処理装置を含み、膜抵抗算出部52、周波数解析部53、判定部54、操舵部55、表示部56、通信部57の各機能を制御するものであってもよい。
膜抵抗算出部52は、分離膜21の膜抵抗を算出する。膜抵抗Rは式(1)より算出される。
R=P/F(KPa/(m/day))・・・(1)
但し、P=分離膜21の差圧(KPa)
F=透過流速(m3/(m2・day)=m/day)
R=P/F(KPa/(m/day))・・・(1)
但し、P=分離膜21の差圧(KPa)
F=透過流速(m3/(m2・day)=m/day)
上記式(1)において、分離膜21の差圧は、差圧計25から差圧データとして取得することができる。また、透過流速は、分離膜21の表面積は一定であるので、分離膜21の透過水量(m3/day)を、図示しない流量計で測定することによって取得することができる。例えば、ポンプ駆動部42において分離膜21の透過水量を一定に保つ制御が行われた場合、透過流速Fは一定値となる。
膜抵抗算出部52は、算出した膜抵抗Rに基づき、膜抵抗Rの上昇速度(「膜抵抗上昇速度」という。)を算出する。膜抵抗上昇速度とは、所定の時間あたりの膜抵抗Rの変化である。本実施形態では、膜抵抗Rの上昇速度を1分あたりの変化として算出する場合を示す。すなわち、膜抵抗上昇速度は式(2)で表される。
膜抵抗上昇速度=ΔR/min(KPa/((m/day)・min))・・・(2)
但し、ΔR=膜抵抗Rの変化(KPa/(m/day))
膜抵抗上昇速度=ΔR/min(KPa/((m/day)・min))・・・(2)
但し、ΔR=膜抵抗Rの変化(KPa/(m/day))
膜抵抗算出部52は、例えば、膜抵抗Rを1秒に1回の割合で算出し、算出した膜抵抗Rの値の変化を7分間の値で近似値とすることにより膜抵抗上昇速度を算出することができる。ここで、7分間における膜抵抗上昇速度を近似するのは、吸引ポンプ23による7分間の吸引と1分間の停止を繰り返すインターバル運転における1回の吸引時間(7分間)の膜抵抗上昇速度を算出するためである。膜抵抗算出部52は、算出した膜抵抗上昇速度を記録する。膜抵抗上昇速度の記録は、例えば図示しないメモリ等の記憶装置に記憶することができる。
ところで、分離膜21の膜抵抗Rが一定である場合、膜抵抗上昇速度は0(KPa/((m/day)・min))となる。しかし、処理水の水質、活性汚泥の状態等は経時的に変化するために、分離膜21への付着部の付着も経時的に変化する。また、分離膜21に付着した付着物は爆気による振動で物理的に剥離されるため、付着物の剥離量も経時的に変化する。したがって、分離膜21の状態は経時的に変化している。膜抵抗算出部52は、分離膜21の状態を膜抵抗上昇速度の変化として記録する。
なお、膜抵抗上昇速度は分離膜の状態を表す指標の一態様である。本実施形態においては、膜抵抗上昇速度を分離膜の状態を表す指標として説明するが、分離膜の状態を表す指標は膜抵抗上昇速度に限定されるものではない。膜抵抗上昇速度は上述の通り、分離膜21の差圧と透過水の流量に基づき算出することができる。したがって、分離膜の状態を表す指標として、例えば、分離膜21の差圧、分離膜21の透過水の流量、分離膜21の透過流速等を用いてもよい。すなわち、分離膜21の状態を表す指標とは、ファウリング等により分離膜21の透過性能が、時間の経過とともに変化(「経時変化」という。)することを表す指標であればよい。
周波数解析部53は、算出された膜抵抗上昇速度の振動を周波数変換して、膜抵抗上昇速度の振動を解析する。膜抵抗上昇速度の振動とは、所定の時間間隔で記録された膜抵抗上昇速度の変動をいう。膜抵抗上昇速度を7分毎に算出した場合、膜抵抗上昇速度の振動は、7分毎の膜抵抗上昇速度の変動となる。周波数解析部53は、例えば、高速フーリエ変換(FFT:Fast Fourier Transform)を用いて周波数変換を行う。周波数解析部53は、図示しない分離膜診断装置50の外部のFFTアナライザに膜抵抗上昇速度の振動のデータを送信し、周波数変換されたデータを取得するものであってもよい。周波数解析部53は、周波数変換した膜抵抗上昇速度の振動のデータを以下、「周波数変換データ」という。周波数変換データは、周波数と、膜抵抗上昇速度の振動の大きさ(以下、「パワー」という。)を含む。周波数解析部53は、周波数変換データを判定部54に出力する。
判定部54は、周波数変換データ基づき、分離膜21の透水状態を判定する。本実施形態では、分離膜21の透水状態として、分離膜21のファウリング状態を判定する場合を説明する。判定部54は、周波数変換データにおける所定の周波数帯域に着目して、その周波数帯域におけるパワーに基づき分離膜21の透水状態を判定する。所定の周波数帯域に着目した判定部54の判定アルゴリズムは任意である。
例えば、判定部54は、所定の周波数帯域におけるにパワーに基づき透水状態を判定する。所定の周波数帯域とは、例えば、所定の周波数以下の周波数帯域、所定の周波数以上の周波数帯域、第1の周波数以上かつ第2の周波数以下の周波数帯域等である。判定部54は、所定の周波数帯域におけるにパワーと閾値を比較して、パワーが予め定められた閾値(上限値又は下限値)を超えたか否かを判断することができる。ここで、閾値と比較するパワーとは、パワーの最大値、パワーの平均値、パワーの寄与率等である。パワーの寄与率は式(3)に基づき算出することができる。
寄与率=POA/OA・・・(3)
但し、OA=全周波数帯域におけるパワーの合計値(Over All)
POA=所定の周波数帯域におけるパワーの合計値(Partial OA)
判定部54は、寄与率と閾値とを比較することにより透水状態を判定する。
寄与率=POA/OA・・・(3)
但し、OA=全周波数帯域におけるパワーの合計値(Over All)
POA=所定の周波数帯域におけるパワーの合計値(Partial OA)
判定部54は、寄与率と閾値とを比較することにより透水状態を判定する。
また、判定部54は、周波数変換データを複数の周波数帯域に分離して、周波数帯域毎のパワーの比較によって透水状態を判定してもよい。例えば、判定部54は、第1の周波帯域と第2の周波帯域に分離して、第1の周波帯域と第2周波帯域のパワーを比較することにより透水状態を判定することができる。第1の周波帯域は、例えば低周波領域である。第2の周波帯域は、例えば高周波帯域である。周波数帯域毎のパワーの比較は、例えば、パワーの最大値の比較、パワーの平均値の比較、パワーの寄与率の比較等である。
判定部54は、分離膜21の透水状態の判定を複数段階の評価として判定することができる。例えば、判定部54は、ファウリングの発生が無いと判定する第1段階、軽度のファウリングと判定する第2段階、中度のファウリングと判定する第3段階、重度のファウリングと判定する第4段階として分離膜21を評価する判定を行う。判定部54は、判定の結果を水処理制御装置40に出力する。
操作部55は、分離膜診断装置50の操作者によって操作される。操作部55は、例えば、キーボードである。表示部56は、分離膜診断装置50の操作者に対して、分離膜診断装置50の状態等を表示する。表示部56は、例えば、判定部54における判定結果を表示する。表示部56は、例えば、ディスプレイ、ランプ等である。なお、操作部55と表示部56は、例えばタッチパネルのように操作入力と表示とを行う機器を用いてもよい。通信部57は、水処理制御装置40の通信部47と通信する。
以上で、図2を用いた、水処理制御装置40と分離膜診断装置50の機能の説明を終了する。
以上で、図2を用いた、水処理制御装置40と分離膜診断装置50の機能の説明を終了する。
次に、図3を用いて、分離膜診断装置50の動作を説明する。図3は、本実施形態における、分離膜診断装置の動作の一例を示すフローチャートである。図3に示すフローチャートは、図2で示した制御部51等の機能において実行されるものとする。
図3において、分離膜診断装置50は、膜抵抗上昇速度を算出する(ステップS11)。本実施形態において膜抵抗上昇速度の算出は、7分間の吸引ポンプ23による吸引時間において近似される。
ステップS11の処理を実行した後、分離膜診断装置50は、膜抵抗上昇速度の変動(振動)についてFFTアナライザによってフーリエ変換して、膜抵抗上昇速度のパワーについて周波数分析を行う(ステップS12)。
ステップS12の処理を実行した後、分離膜診断装置50は、寄与率を算出する。寄与率の算出は、第1の周波数帯域としての低周波帯域における寄与率と、第2の周波数帯域としての高周波帯域における寄与率とを算出する場合の例を、図14を用いて後述する。
ステップS13の処理を実行した後、分離膜診断装置50は、分離膜21の透水状態を判定するか否かを判断する(ステップS14)。分離膜21の透水状態を判定するか否かの判断は、例えば、水処理装置100が稼働中であるか否か、所定の判定時刻であるか否か等である。分離膜21の透水状態を判定しないと判断した場合(ステップS14:NO)、分離膜診断装置50は、図3のフローチャートに示す処理を終了する。なお、図3のフローチャートは終了後に繰り返して実行されるものとする。
一方、分離膜21の透水状態を判定すると判断した場合(ステップS14:YES)、分離膜診断装置50は、運転条件変更処理を実行する(ステップS15)。ステップS15における運転条件変更処理の詳細は図4及び図5を用いて後述する。ステップS15の処理を実行した後、分離膜診断装置50は、図3のフローチャートに示す処理を終了する。
以上で、図3を用いた、分離膜診断装置50の動作の説明を終了する。
以上で、図3を用いた、分離膜診断装置50の動作の説明を終了する。
次に、図4を用いて、図3のステップS15の運転条件変更処理の第1の動作を説明する。図4は、本実施形態における、分離膜診断装置50の運転条件変更処理の第1の動作の一例を示すフローチャートである。運転条件変更処理の第1の動作は、分離膜21の透水状態の判定結果に基づき、爆気量を変更することにより、水処理装置100の運転条件を変更する動作である。
図4において、分離膜診断装置50は、判定条件がA1であるか否かを判断する(ステップS1511)。判定条件がA1であるとは、例えば、分離膜21の透水状態が良好であることを示す。分離膜診断装置50は、例えば、低周波帯域の寄与率が60%以上である場合、判定条件がA1であると判断する。判定条件がA1であるか否かは、例えば、所定の時間における寄与率、又は寄与率の最大値、又は平均値が60%以上であるときに判定条件がA1であると判断してもよい。所定の時間とは例えば2日である。差圧データにノイズが多い場合は時間を長くとることでノイズの影響を小さくすることが可能である。一方、ノイズが少ない場合は時間を短くすることが可能である。以上は、以下の判定条件A2及びA3についても同様である。判定条件がA1であると判断した場合(ステップS1511:YES)、分離膜診断装置50は、ブロア32を用いた爆気量が第1爆気量になるように、水処理制御装置40に対して指示を出力する(ステップS1512)。第1爆気量は、後述する第2爆気量より少ない爆気量である。水処理制御装置40は分離膜診断装置50から取得した指示に従い、ブロア駆動部43においてブロア32を駆動するものとする。ステップS1512の処理を実行した後、分離膜診断装置50は、図4に示すステップS15の処理を終了する。
一方、判定条件がA1でないと判断した場合(ステップS1511:NO)、分離膜診断装置50は、判定条件がA2であるか否かを判断する(ステップS1513)。判定条件がA2であるとは、例えば、分離膜21において軽度のファウリングが発生していることを示す。分離膜診断装置50は、例えば、低周波帯域の寄与率が50%以上60%未満である場合、判定条件がA2であると判断する。判定条件がA2であると判断した場合(ステップS1513:YES)、分離膜診断装置50は、ブロア32を用いた爆気量が第2爆気量になるように、水処理制御装置40に対して指示を出力する(ステップS1514)。第2爆気量は第1爆気量より多く、後述する第3爆気量より少ない爆気量である。ステップS1514の処理を実行した後、分離膜診断装置50は、図4に示すステップS15の処理を終了する。
一方、判定条件がA2でないと判断した場合(ステップS1513:NO)、分離膜診断装置50は、判定条件がA3であるか否かを判断する(ステップS1515)。判定条件がA3であるとは、例えば、分離膜21において中度のファウリングが発生していることを示す。分離膜診断装置50は、例えば、低周波帯域の寄与率が40%以上50%未満である場合、判定条件がA3であると判断する。判定条件がA3であると判断した場合(ステップS1515:YES)、分離膜診断装置50は、ブロア32を用いた爆気量が第3爆気量になるように、水処理制御装置40に対して指示を出力する(ステップS1516)。第3爆気量は第2爆気量より多い爆気量である。ステップS1516の処理を実行した後、分離膜診断装置50は、図4に示すステップS15の処理を終了する。
一方、判定条件がA3でないと判断した場合(ステップS1513:NO)、分離膜診断装置50は、分離膜21の清掃作業の実施を促すフィルタ清掃報知をする(ステップS1517)。判定条件がA3でないは、例えば、分離膜21において重度のファウリングが発生していることを示す。分離膜診断装置50は、例えば、低周波帯域の寄与率が40%未満である場合、判定条件がA3であると判断する。フィルタ清掃報知は、例えば、表示部46又は表示部56に分離膜21の清掃作業の実施を促す表示をしたり、スピーカ等から所定の警報を発したりする動作である。
ステップS1517の処理を実行した後、分離膜診断装置50は、図4に示すステップS15の処理を終了する。
以上で、図4を用いた、運転条件変更処理の第1の動作の説明を終了する。
ステップS1517の処理を実行した後、分離膜診断装置50は、図4に示すステップS15の処理を終了する。
以上で、図4を用いた、運転条件変更処理の第1の動作の説明を終了する。
次に、図5を用いて、図3のステップS15の運転条件変更処理の第2の動作を説明する。図5は、本実施形態における、分離膜診断装置50の運転条件変更処理の第2の動作の一例を示すフローチャートである。運転条件変更処理の第2の動作は、分離膜21の透水状態の判定結果に基づき、爆気量とフラックスを変更することにより、水処理装置100の運転条件を変更する動作である。図4を用いて説明した運転条件変更処理の第1の動作と図5を用いて説明する運転条件変更処理の第2の動作とは、いずれか一方を実施するものとする。
図5において、分離膜診断装置50は、判定条件がB1であるか否かを判断する(ステップS1521)。判定条件がB1であるとは、例えば、分離膜21の透水状態が良好であることを示す。分離膜診断装置50は、例えば、低周波帯域の寄与率が60%以上である場合、判定条件がB1であると判断する。判定条件がB1であるか否かは、例えば、所定の時間における寄与率、又は寄与率の最大値、又は平均値が60%以上であるときに判定条件がB1であると判断してもよい。所定の時間とは例えば2日である。差圧データにノイズが多い場合は時間を長くとることでノイズの影響を小さくすることが可能である。一方、ノイズが少ない場合は時間を短くすることが可能である。以上は、以下の判定条件B2及びB3についても同様である。判定条件がB1であると判断した場合(ステップS1521:YES)、分離膜診断装置50は、水処理装置100の運転条件の変更を行わず、図5に示すステップS15の処理を終了する。
一方、判定条件がB1でないと判断した場合(ステップS1521:NO)、分離膜診断装置50は、ブロア32を用いた爆気量の制御を開始する(ステップS1522)。爆気量の制御とは、例えば、判定条件がB1になるまで爆気量を増加させる制御である。分離膜診断装置50は、水処理制御装置40に対して爆気量を増加させる指示を出力する。
ステップS1522の処理を実行した後、分離膜診断装置50は、判定条件がB2であるか否かを判断する(ステップS1523)。判定条件がB2であるとは、例えば、分離膜21において軽度のファウリングが発生していることを示す。分離膜診断装置50は、例えば、低周波帯域の寄与率が50%以上60%未満である場合、判定条件がB2であると判断する。判定条件がB2であると判断した場合(ステップS1523:YES)、分離膜診断装置50は、図5に示すステップS15の処理を終了する。すなわち、軽度のファウリングが発生して判定条件がB2であると判断した場合は、分離膜診断装置50は、フラックス制御は行わず、爆気量制御のみを行う。
一方、判定条件がB2でないと判断した場合(ステップS1523:NO)、分離膜診断装置50は、吸引ポンプ23を用いたフラックス制御を開始する(ステップS1524)。フラックス制御とは、例えば、判定条件がB2になるまでフラックスを低下させる制御である。分離膜診断装置50は、水処理制御装置40に対してフラックスを低下させる指示を出力する。
ステップS1524の処理を実行した後、分離膜診断装置50は、判定条件がB3であるか否かを判断する(ステップS1525)。判定条件がB3であるとは、例えば、分離膜21において中度のファウリングが発生していることを示す。分離膜診断装置50は、例えば、低周波帯域の寄与率が40%以上50%未満である場合、判定条件がBBであると判断する。判定条件がBBであると判断した場合(ステップS1525:YES)、分離膜診断装置50は、図5に示すステップS15の処理を終了する。すなわち、中度のファウリングが発生して判定条件がB3であると判断した場合は、分離膜診断装置50は、フラックス制御と爆気量制御を行う。
一方、判定条件がB3でないと判断した場合(ステップS1525:NO)、分離膜診断装置50は、分離膜21の清掃作業の実施を促すフィルタ清掃報知をする(ステップS1526)。判定条件がB3でないは、例えば、分離膜21において重度のファウリングが発生していることを示す。分離膜診断装置50は、例えば、低周波帯域の寄与率が40%未満である場合、判定条件がB3であると判断する。フィルタ清掃報知は、例えば、表示部46又は表示部56に分離膜21の清掃作業の実施を促す表示をしたり、スピーカ等から所定の警報を発したりする動作である。
ステップS1526の処理を実行した後、分離膜診断装置50は、図5に示すステップS15の処理を終了する。
以上で、図5を用いた、運転条件変更処理の第2の動作の説明を終了する。
ステップS1526の処理を実行した後、分離膜診断装置50は、図5に示すステップS15の処理を終了する。
以上で、図5を用いた、運転条件変更処理の第2の動作の説明を終了する。
なお、図4及び図5は、分離膜21の透水状態の判定結果に基づく運転条件の変更の動作を例示したが、分離膜21の透水状態の判定結果に基づく運転条件の変更の動作はこれに限定されるものではない。例えば、図4及び図5においては、分離膜21の透水状態を4段階で判定する場合を示したが、3段階以下又は5段階以上の判定を行うものであってもよい。また、運転条件の変更として、爆気量を変更する方法、爆気量とフラックスを変更する方法を示したが、フラックスのみを変更する方法、原水の流量を変更する方法、MLSSを変更する方法等、他の運転条件を変更するようにしてもよい。
次に、図6から図14を用いて、分離膜診断装置50を用いた測定結果を説明する。
先ず図6を用いて、吸引ポンプ23のインターバル運転における分離膜21の差圧の経時変化の測定結果を説明する。図6は、本実施形態における、分離膜21の膜抵抗の経時変化の一例を示すグラフである。
図6において、横軸は時間軸であり、縦軸は差圧計25において測定された差圧である。図6は、吸引ポンプ23による7分間の吸引時間と1分間の停止時間を繰り返すインターバル運転をした場合の差圧の経時変化を示している。図6に図示する1つの点は1分毎の差圧の測定値である。t1、t2、t3等の時間において差圧が小さくなっているのは、吸引ポンプ23が停止しているときの測定値である。図6においては、7分間の吸引時間において差圧が上昇する場合がある一方、7分間の吸引時間においても差圧が下降する場合があることを示している。
次に、図7を用いて、図6の測定結果の近似を説明する。図7は、本実施形態における、分離膜21の膜抵抗の経時変化を近似した一例を示すグラフである。
図7において、図示する直線は、7分間の吸引時間における差圧の変化を直線で近似したものである。近似の方法は任意である。直線近似は、例えば最小二乗法によって行うことができる。また、直線近似を行う代わりに曲線近似を行なってもよい。図7においては、近似直線を見やすいように、直線の背景を白抜きで表示している。図7に示す近似直線は、正の傾きである場合と負の傾きである場合とがあることを示している。図7に示す近似直線の傾きは膜抵抗上昇速度を示している。
次に、図8を用いて、図7の膜抵抗上昇速度の経時変化を説明する。図8は、本実施形態における、分離膜21の膜抵抗上昇速度の経時変化の一例を示すグラフである。
図8において、横軸は分離膜21の清掃作業を実施した日(1日目)からの経過日数を示している。縦軸は、膜抵抗上昇速度を示している。
膜抵抗上昇速度は、清掃作業を実施してから11日目あたりまでは、膜抵抗上昇速度0(KPa/((m/day)・min))付近で推移している。しかし、12日目あたりから急上昇して、膜抵抗Rが加速度的に増加していることを示している。図8は、ファウリングによる分離膜21の透過性能が、所定の日数を経過した後急激に劣化することを示している。経時変化を測定した分離膜21は、13日目にファウリングによる緊急停止がされている。したがって、例えば差圧計の測定値のみを記録していても、ファウリングによる分離膜21の透過性能の急激な劣化を予想することは困難である。
次に、図9~図11を用いて、図8の膜抵抗上昇速度の経時変化を周波数変換した結果を説明する。図9は、本実施形態における、分離膜21の洗浄から第1の時間経過後の膜抵抗上昇速度の経時変化を周波数変換した一例を示すグラフである。第1の時間経過は、図8における洗浄作業実施日である。第1の時間経過時において、分離膜21は洗浄によって清浄な状態であるものとする。
図9において、横軸は周波数を示している。図9において、0~1.05×10⁻³(Hz)付近を全周波数帯域としている。縦軸は膜抵抗上昇速度の大きさ(パワー)を示している。図9に示すグラフは、FFTにおいて、窓関数としてハニング窓を用いた。FFTは80分に1回実施して、前後8時間の変換結果を平均化することによりノイズを除去している。図9に示す結果は、0.1×10⁻³(Hz)付近にピークを持ち、全周波数帯域を0~0.6×10⁻³(Hz)の周波数帯域を低周波帯域、0.6×10⁻³(Hz)以上の周波数帯域を高周波帯域と分類したときに、低周波帯域のパワーが高くなっている。
図10は、本実施形態における、分離膜21の洗浄から第2の時間経過後の膜抵抗上昇速度の経時変化を周波数変換した一例を示すグラフである。第2の時間経過は、図8における7日目である。7日目はファウリングにより分離膜21の透過性能が急激に劣化する13日目に対して大凡中間の経過時間となる。
図10におけるFFTの条件は図9と同じである。図10に示す結果は、図9と同様に全周波数帯域を0~0.6×10⁻³(Hz)の周波数帯域を低周波帯域、0.6×10⁻³(Hz)以上の周波数帯域を高周波帯域と分類したときに、低周波帯域のパワーが高くなっている。しかし、0.25×10⁻³(Hz)付近と0.9×10⁻³(Hz)付近にもピークが現れ全周波数帯域におけるパワーの分布は図9に比べて高周波帯域にシフトしている。
図11は、本実施形態における、分離膜21の洗浄から第3の時間経過後の膜抵抗上昇速度の経時変化を周波数変換した一例を示すグラフである。第3の時間経過は、図8における11日目である。11日目はファウリングにより分離膜21の透過性能が急激に劣化する2日前であり、図8に示す膜抵抗上昇速度の大きさにおいては、第1の時間経過後と第2の時間経過後と差異が認められない。
図11におけるFFTの条件は図9及び図10と同じである。図11に示す結果は、図9と同様に全周波数帯域を0~0.6×10⁻³(Hz)としたときに、パワーのピークが全周波数帯域に分散している。すなわち、図8において差異の認められなかった膜抵抗上昇速度の大きさは、周波数変換後においては大きな差異として表されている。
以上で、図9~図11を用いた、膜抵抗上昇速度の経時変化を周波数変換した結果の説明を終了する。
以上で、図9~図11を用いた、膜抵抗上昇速度の経時変化を周波数変換した結果の説明を終了する。
次に、図12を用いて、寄与率を算出するための周波数帯域の設定方法について説明する。図12は、本実施形態における、寄与率を算出するための周波数帯域の設定方法の一例を示すグラフである。なお、図12に示すグラフは図9で示したグラフを利用している。
図12において、全周波数帯域(全バンド)を0~1.05×10⁻³(Hz)とする。第1の周波数帯域(バンド1)を0~0.6×10⁻³(Hz)とする。第2の周波数帯域(バンド2)を0.6×10⁻³~1.05×10⁻³(Hz)とする。第1の周波数帯域における寄与率をバンド1寄与率、第2の周波数帯域における寄与率をバンド2寄与率とする。バンド1寄与率とバンド2寄与率の算出方法は、式(3)によって算出される。
なお、図12においては、全周波数帯域を2つの周波数帯域に分割して第1の周波数帯域と第2の周波数帯域を判定対象の周波数帯域として設定する場合を示したが、判定対象の周波数帯域の設定方法はこれに限定されるものではない。例えば、第1の周波数帯域と第2の周波数帯域は連続している場合を示したが、第1の周波数帯域と第2の周波数帯域は不連続な周波数帯域であってもよい。また、全周波数帯域の所定の一部の周波数帯域を判定対象としてもよい。また、全周波数帯域を3以上の周波数帯域に分割して判定対象としてもよい。
以上で、図12を用いた、寄与率を算出するための周波数帯域の設定方法についての説明を終了する。
以上で、図12を用いた、寄与率を算出するための周波数帯域の設定方法についての説明を終了する。
次に、図13を用いて、図12において説明した、バンド1寄与率とバンド2寄与率の推移を説明する。図13は、本実施形態における、バンド1寄与率とバンド2寄与率の推移の一例を示すグラフである。
図13において、1日目から9日目までは、バンド1寄与率がバンド2寄与率に比べて高くなっている。しかし、9日目以降は、バンド1寄与率が低下するとともにバンド2寄与率が上昇して、バンド1寄与率のグラフとバンド2寄与率のグラフが交錯している。9日目は分離膜21の透過性能が急激に劣化する4日前である。すなわち、図13は、寄与率の推移によってファウリングの兆候を判定可能であることを示している。予めファウリングの兆候を判定することができるので、事前の洗浄作業によりファウリングによる水処理の緊急停止を防止できるとともに、定期的な洗浄作業の実施に伴う洗浄コストを削減することが可能となる。
以上で、図13を用いた、バンド1寄与率とバンド2寄与率の推移の説明を終了する。
以上で、図13を用いた、バンド1寄与率とバンド2寄与率の推移の説明を終了する。
次に、図14を用いて、爆気量を変更したときの寄与率の推移を説明する。図14は、本実施形態における、爆気量を変更したときの寄与率の推移の一例を示すグラフである。
図14において、4日目以降において、バンド1寄与率のグラフとバンド2寄与率のグラフが交錯し、ファウリングの兆候を示している。矢印で図示する12日目において、爆気量を1.5倍に変更すると、バンド1寄与率は上昇し、バンド2寄与率は下降してファウリングの兆候が消えたことを示している。すなわち、寄与率に基づいて、爆気等によって分離膜21の透過性能が回復したことを判定できることを示している。本実施形態においては、寄与率に基づき、図3~図5で説明した運転条件の変更を実施する。図14は、本実施形態において、寄与率に基づき適切な運転条件の変更が可能であることを示している。
以上で、図14を用いた、爆気量を変更したときの寄与率の推移の説明を終了する。
以上で、図14を用いた、爆気量を変更したときの寄与率の推移の説明を終了する。
なお、本実施形態における分離膜診断装置50は、MBRにおける分離膜21の透水状態を診断するものとして説明したが、分離膜診断装置50は、例えば、純水製造システム、上水処理システム、海水淡水化システム等における分離膜の透水状態等の診断にも適用することができる。
以上説明した少なくともひとつの実施形態によれば、分離膜診断方法は、取得ステップと、経時変化記録ステップと、振動解析ステップと、判定ステップとを含むことにより、水処理に用いる分離膜の状態を正確に把握することにより水処理コストを低減することができる、分離膜診断方法、水処理方法、分離膜診断装置、水処理装置及び分離膜診断プログラムまたは当該プログラムが記録された記憶媒体を提供することができる。
なお、上述した装置は、コンピュータで実現するようにしてもよい。その場合、各機能ブロックの機能を実現するためのプログラムをコンピュータ読み取り可能な記録媒体に記録する。この記録媒体に記録されたプログラムをコンピュータシステムに読み込ませ、CPUが実行することで実現してもよい。ここでいう「コンピュータシステム」とは、OS(Operating System)や周辺機器等のハードウェアを含むものとする。また、「コンピュータ読み取り可能な記録媒体」とは、フレキシブルディスク、光磁気ディスク、ROM、CD-ROM等の可搬媒体のことをいう。また、「コンピュータ読み取り可能な記録媒体」は、コンピュータシステムに内蔵されるハードディスク等の記憶装置を含む。さらに「コンピュータ読み取り可能な記録媒体」とは、短時間の間、動的にプログラムを保持するものを含んでいてもよい。短時間の間、動的にプログラムを保持するものは、例えば、インターネット等のネットワークや電話回線等の通信回線を介してプログラムを送信する場合の通信線である。また、「コンピュータ読み取り可能な記録媒体」には、サーバやクライアントとなるコンピュータシステム内部の揮発性メモリのように、一定時間プログラムを保持しているものも含んでもよい。また上記プログラムは、前述した機能の一部を実現するためのものであってもよい。また、上記プログラムは、前述した機能をコンピュータシステムにすでに記録されているプログラムとの組み合わせで実現できるものであってもよい。また、上記プログラムは、プログラマブルロジックデバイスを用いて実現されるものであってもよい。プログラマブルロジックデバイスは、例えば、FPGA(Field Programmable Gate Array)である。
また、図を用いて説明した装置の各機能部は、ソフトウェア機能部であるものとしたが、機能の一部又は全部は、LSI等のハードウェア機能部であってもよい。
また、図を用いて説明した装置の各機能部は、ソフトウェア機能部であるものとしたが、機能の一部又は全部は、LSI等のハードウェア機能部であってもよい。
本発明のいくつかの実施形態を説明したが、これらの実施形態は、例として提示したものであり、発明の範囲を限定することは意図していない。これら実施形態は、その他の様々な形態で実施されることが可能であり、発明の要旨を逸脱しない範囲で、種々の省略、置き換え、変更を行うことができる。これら実施形態やその変形は、発明の範囲や要旨に含まれると同様に、特許請求の範囲に記載された発明とその均等の範囲に含まれるものである。
(実施例1)図15にMBRの膜ファウリングを予測した例を提示する。図15は本実施形態における分離膜21の膜抵抗Rとバンド1寄与率、バンド2寄与率の推移を表したものである。2月13日から膜抵抗が急上昇し、2月14日に運転を止めている。この急上昇をバンド1寄与率の推移を用いて予測する方法を説明する。なお、ここでは2日間のバンド1寄与率の値をもってファウリングの兆候と判断する。バンド1寄与率の算出方法は前述のとおりである。
運転開始から2月9日までバンド1寄与率の値が2日間60%以下を維持することがなく、分離膜の透水状態は良好と判断できる。2月9日からバンド1寄与率が2日間50%以下を維持し分離膜の状態が悪いと判断できる。これにより数日前にファウリングを予測することが可能であった。
(実施例2)図16に例1と同様にMBRの膜ファウリングを予測した例を提示する。図16は6月1日から7月4日までの運転例であり、7月4日に急激に膜抵抗が上昇し運転をやめている。運転初期の6月1日から6月17日まではバンド1寄与率が2日間60%以下を維持することがなく、分離膜の透水状態は良好と判断できる。6月17日からバンド1寄与率が60%以下を維持し分離膜の状態が悪いと判断できる。これにより約2週間前からファウリングを予測することが可能であった。
(実施例3)図17に例1と同様の条件でMBRの膜ファウリングを予測した例を提示する。図17は3月1日から3月10日までの運転例であり、3月6日から膜抵抗が上昇し3月10日に運転をやめている。運転開始日の3月1日からバンド1寄与率が2日間60%以下を維持し分離膜の状態が悪いと判断できる。これにより数日前からファウリングを予測することが可能であった。
(実施例4)図18に例1と同様の条件でMBRの膜ファウリングを予測した例を提示する。図18は4月1日から4月30日までの運転例であり、1ヵ月の運転で膜抵抗が上昇することはなかった。運転開始日の4月1日からバンド1寄与率が2日間60%以下を維持することがなく、分離膜の透水状態が良くファウリングが発生しないと判断できる。
(実施例5)図19に例1と同様の条件でMBRの膜ファウリングを予測した例を提示する。図19は3月4日から3月19日までの運転例である。3月10日からバンド1寄与率が2日間60%以下を維持し分離膜の状態が悪いと判断できる。この結果に従って3月16日に爆気風量を1.5倍に変更した。その後差圧の急上昇は起きず、バンド1寄与率は60%以下を維持しなくなり、分離膜の透水状態が良好になったと判断できる。
11 水槽
12 原水流路
13 余剰汚泥流路
21 分離膜
22 透過水流路
23 吸引ポンプ
24 排水流路
25 差圧計
31 散気管
32 ブロア
40 水処理制御装置
50 分離膜診断装置
100 水処理装置
41 制御部
42 ポンプ駆動部
43 ブロア駆動部
44 差圧取得部
45 操作部
46 表示部
47 通信部
51 制御部
52 膜抵抗算出部
53 周波数解析部
54 判定部
55 操舵部
56 表示部
57 通信部
12 原水流路
13 余剰汚泥流路
21 分離膜
22 透過水流路
23 吸引ポンプ
24 排水流路
25 差圧計
31 散気管
32 ブロア
40 水処理制御装置
50 分離膜診断装置
100 水処理装置
41 制御部
42 ポンプ駆動部
43 ブロア駆動部
44 差圧取得部
45 操作部
46 表示部
47 通信部
51 制御部
52 膜抵抗算出部
53 周波数解析部
54 判定部
55 操舵部
56 表示部
57 通信部
Claims (13)
- 固液分離を行う分離膜の状態を表す指標を取得する取得ステップと、
取得された前記指標の経時変化を記録する経時変化記録ステップと、
記録された前記経時変化の振動を周波数変換する振動解析ステップと、
周波数変換した前記振動の大きさに基づいて前記分離膜の透水状態を判定する判定ステップと
を含む分離膜診断方法。 - 前記指標が、差圧またはろ過流量の少なくとも一方である、請求項1に記載の分離膜診断方法。
- 前記判定ステップにおいて、周波数変換した所定の周波数帯域における前記振動の大きさに基づいて前記分離膜の透水状態を判定する、請求項1または2に記載の分離膜診断方法。
- 前記判定ステップにおいて、第1の周波数帯域における前記振動の大きさと、第2の周波数帯域における前記振動の大きさとを比較することにより、前記分離膜の透水状態を判定する、請求項3に記載の分離膜診断方法。
- 前記判定ステップにおいて、第1の周波数帯域における前記振動の大きさの寄与率と、第2の周波数帯域における前記振動の大きさの寄与率とを比較することにより、前記分離膜の透水状態を判定する、請求項4に記載の分離膜診断方法。
- 前記判定ステップにおいて判定された固液分離を行う分離膜の透水状態に基づき、さらに前記分離膜を用いた固液分離の運転条件を変更する運転条件変更ステップを含む、請求項1から5のいずれか一項に記載の分離膜診断方法を用いた水処理方法。
- 前記運転条件変更ステップにおいて、前記分離膜を爆気する爆気量を変更することにより前記運転条件を変更する、請求項6に記載の水処理方法。
- 前記運転条件変更ステップにおいて、前記分離膜の透過水量を変更することにより前記運転条件を変更する、請求項6又は7に記載の水処理方法。
- 診断された前記透水状態に基づき、さらに前記分離膜のメンテナンスを促す情報を報知する報知ステップをさらに含む、請求項6から8のいずれか一項に記載の水処理方法。
- 前記判定ステップにおいて第1の周波数帯域における前記振動の大きさの寄与率が60%以下となった時、前記分離膜を用いた固液分離の運転条件を変更する、請求項6から9のいずれか一項に記載の水処理方法。
- 固液分離を行う分離膜の状態を表す指標を取得する取得部と、
取得された前記指標の経時変化を記録する経時変化記録部と、
記録された前記経時変化の振動を周波数変換する振動解析部と、
周波数変換した前記振動の大きさに基づいて前記分離膜の透水状態を判定する判定部と
を備える分離膜診断装置。 - 固液分離を行う分離膜と、
前記分離膜の状態を表す指標を取得する取得部と、
取得された前記指標の経時変化を記録する経時変化記録部と、
記録された前記経時変化の振動を周波数変換する振動解析部と、
周波数変換した前記振動の大きさに基づいて前記分離膜の透水状態を判定する判定部と、
判定された前記透水状態に基づき、前記分離膜を用いた固液分離の運転条件を変更する運転条件変更部と、
を備える水処理装置。 - 固液分離を行う分離膜の状態を表す指標を取得する取得処理と、
取得された前記指標の経時変化を記録する経時変化記録処理と、
記録された前記経時変化の振動を周波数変換する振動解析処理と、
周波数変換した前記振動の大きさに基づいて前記分離膜の透水状態を判定する判定処理と
をコンピュータに実行させるための分離膜診断プログラム。
Priority Applications (2)
| Application Number | Priority Date | Filing Date | Title |
|---|---|---|---|
| JP2017510426A JP6376283B2 (ja) | 2016-02-01 | 2017-01-31 | 分離膜診断方法、水処理方法、分離膜診断装置、水処理装置及び分離膜診断プログラム |
| CN201780008552.9A CN108602021B (zh) | 2016-02-01 | 2017-01-31 | 分离膜诊断方法、水处理方法、分离膜诊断装置、水处理装置及分离膜诊断程序 |
Applications Claiming Priority (2)
| Application Number | Priority Date | Filing Date | Title |
|---|---|---|---|
| JP2016017371 | 2016-02-01 | ||
| JP2016-017371 | 2016-02-01 |
Publications (1)
| Publication Number | Publication Date |
|---|---|
| WO2017135235A1 true WO2017135235A1 (ja) | 2017-08-10 |
Family
ID=59500831
Family Applications (1)
| Application Number | Title | Priority Date | Filing Date |
|---|---|---|---|
| PCT/JP2017/003363 Ceased WO2017135235A1 (ja) | 2016-02-01 | 2017-01-31 | 分離膜診断方法、水処理方法、分離膜診断装置、水処理装置及び分離膜診断プログラム |
Country Status (3)
| Country | Link |
|---|---|
| JP (1) | JP6376283B2 (ja) |
| CN (1) | CN108602021B (ja) |
| WO (1) | WO2017135235A1 (ja) |
Cited By (2)
| Publication number | Priority date | Publication date | Assignee | Title |
|---|---|---|---|---|
| JPWO2021200752A1 (ja) * | 2020-03-30 | 2021-10-07 | ||
| JPWO2024247949A1 (ja) * | 2023-05-30 | 2024-12-05 |
Families Citing this family (2)
| Publication number | Priority date | Publication date | Assignee | Title |
|---|---|---|---|---|
| JP7103513B2 (ja) * | 2020-02-14 | 2022-07-20 | 東レ株式会社 | ろ過特性予測による造水装置の制御方法、造水装置のトラブル判定方法、造水装置、造水装置の運転プログラム、造水装置のトラブル判定プログラム、および記録媒体 |
| CN112624317B (zh) * | 2020-11-10 | 2022-07-12 | 宁波职业技术学院 | 一种基于音频分析的mbr膜组件检测方法与系统 |
Citations (5)
| Publication number | Priority date | Publication date | Assignee | Title |
|---|---|---|---|---|
| JP2005296908A (ja) * | 2004-04-16 | 2005-10-27 | Maezawa Ind Inc | 膜ろ過装置及び膜破断の検知方法 |
| JP2006281092A (ja) * | 2005-03-31 | 2006-10-19 | Toshiba Corp | 膜濾過設備の制御装置 |
| JP2007240373A (ja) * | 2006-03-09 | 2007-09-20 | Toshiba It & Control Systems Corp | 水処理用ろ過システムの膜損傷検出装置及び膜損傷検出方法 |
| JP2013104849A (ja) * | 2011-11-16 | 2013-05-30 | Mitsubishi Electric Corp | クラック検査装置 |
| JP2014519898A (ja) * | 2011-05-23 | 2014-08-21 | フレゼニウス メディカル ケア ドイッチェランド ゲゼルシャフト ミット ベシュレンクテル ハフツング | 体外血液処理の動作状態を検出するためのデバイス及び方法 |
Family Cites Families (5)
| Publication number | Priority date | Publication date | Assignee | Title |
|---|---|---|---|---|
| JP3572992B2 (ja) * | 1999-04-21 | 2004-10-06 | 日立プラント建設株式会社 | 膜濾過装置の運転方法 |
| JP2003275759A (ja) * | 2002-03-20 | 2003-09-30 | Hitachi Plant Eng & Constr Co Ltd | 水処理装置 |
| JP4373684B2 (ja) * | 2003-02-19 | 2009-11-25 | 株式会社フィリップスエレクトロニクスジャパン | フィルタ目詰まり状況監視装置およびベッドサイドシステム |
| JP5034326B2 (ja) * | 2005-06-09 | 2012-09-26 | 東レ株式会社 | 膜ろ過予測方法、及び膜ろ過予測プログラム |
| CN105084520B (zh) * | 2015-08-17 | 2017-05-24 | 北京金控数据技术股份有限公司 | 优化的膜生物反应器反冲洗的方法 |
-
2017
- 2017-01-31 JP JP2017510426A patent/JP6376283B2/ja active Active
- 2017-01-31 WO PCT/JP2017/003363 patent/WO2017135235A1/ja not_active Ceased
- 2017-01-31 CN CN201780008552.9A patent/CN108602021B/zh active Active
Patent Citations (5)
| Publication number | Priority date | Publication date | Assignee | Title |
|---|---|---|---|---|
| JP2005296908A (ja) * | 2004-04-16 | 2005-10-27 | Maezawa Ind Inc | 膜ろ過装置及び膜破断の検知方法 |
| JP2006281092A (ja) * | 2005-03-31 | 2006-10-19 | Toshiba Corp | 膜濾過設備の制御装置 |
| JP2007240373A (ja) * | 2006-03-09 | 2007-09-20 | Toshiba It & Control Systems Corp | 水処理用ろ過システムの膜損傷検出装置及び膜損傷検出方法 |
| JP2014519898A (ja) * | 2011-05-23 | 2014-08-21 | フレゼニウス メディカル ケア ドイッチェランド ゲゼルシャフト ミット ベシュレンクテル ハフツング | 体外血液処理の動作状態を検出するためのデバイス及び方法 |
| JP2013104849A (ja) * | 2011-11-16 | 2013-05-30 | Mitsubishi Electric Corp | クラック検査装置 |
Cited By (9)
| Publication number | Priority date | Publication date | Assignee | Title |
|---|---|---|---|---|
| JPWO2021200752A1 (ja) * | 2020-03-30 | 2021-10-07 | ||
| WO2021200752A1 (ja) * | 2020-03-30 | 2021-10-07 | 東レ株式会社 | 造水装置の洗浄トラブル判定方法および洗浄トラブル判定プログラム |
| JP7103526B2 (ja) | 2020-03-30 | 2022-07-20 | 東レ株式会社 | 造水装置の洗浄トラブル判定方法および洗浄トラブル判定プログラム |
| US20230121715A1 (en) * | 2020-03-30 | 2023-04-20 | Toray Industries, Inc. | Method and program for determining cleaning trouble in fresh water generator |
| EP4129455A4 (en) * | 2020-03-30 | 2024-04-17 | Toray Industries, Inc. | METHOD AND PROGRAM FOR DETERMINING CLEANING PROBLEMS IN A FRESH WATER GENERATOR |
| US12569813B2 (en) * | 2020-03-30 | 2026-03-10 | Toray Industries, Inc. | Method and program for determining cleaning trouble in fresh water generator |
| JPWO2024247949A1 (ja) * | 2023-05-30 | 2024-12-05 | ||
| WO2024247949A1 (ja) * | 2023-05-30 | 2024-12-05 | 東レ株式会社 | 分離膜の状態診断方法、その状態診断プログラム、その状態診断装置、および記録媒体機器 |
| JP7810269B2 (ja) | 2023-05-30 | 2026-02-03 | 東レ株式会社 | 分離膜の状態診断方法、その状態診断プログラム、その状態診断装置、および記録媒体機器 |
Also Published As
| Publication number | Publication date |
|---|---|
| CN108602021A (zh) | 2018-09-28 |
| CN108602021B (zh) | 2021-08-31 |
| JPWO2017135235A1 (ja) | 2018-02-08 |
| JP6376283B2 (ja) | 2018-08-22 |
Similar Documents
| Publication | Publication Date | Title |
|---|---|---|
| JP6376283B2 (ja) | 分離膜診断方法、水処理方法、分離膜診断装置、水処理装置及び分離膜診断プログラム | |
| CN111727174A (zh) | 曝气量控制系统及曝气量控制方法 | |
| JP7306826B2 (ja) | 造水システムの物理洗浄工程トラブル判定プログラム及び物理洗浄工程トラブル判定装置、並びに記録媒体 | |
| JP5841474B2 (ja) | 膜分離装置の運転方法及び膜分離装置 | |
| RU2394778C2 (ru) | Способ обработки сточных вод | |
| JP5841473B2 (ja) | 膜分離装置の運転方法及び膜分離装置 | |
| JP5290883B2 (ja) | 中空糸膜モジュールユニット、水処理装置および水処理方法 | |
| JPWO2014034836A1 (ja) | 膜分離活性汚泥法の膜面洗浄方法 | |
| JP4979519B2 (ja) | 膜分離活性汚泥処理装置の運転方法 | |
| JP7574710B2 (ja) | 水処理装置、及び水処理方法 | |
| JP5034326B2 (ja) | 膜ろ過予測方法、及び膜ろ過予測プログラム | |
| JP2025100759A (ja) | 膜間差圧予測方法及び水処理装置 | |
| JP2022070613A (ja) | 水処理装置及び水処理方法 | |
| JP2013233484A (ja) | 膜モジュールを用いた膜ろ過装置及びろ過膜洗浄方法 | |
| JP2014128784A (ja) | 膜分離活性汚泥処理装置 | |
| US7435343B2 (en) | Vibration filter | |
| JP6052866B2 (ja) | 水処理方法 | |
| JP3616503B2 (ja) | 膜濾過装置 | |
| JP2021102184A (ja) | 浸漬型膜分離装置の異常判定方法及び浸漬型膜分離装置の異常判定装置 | |
| JP4917792B2 (ja) | 膜分離活性汚泥装置に使用される分離膜の汚染の程度を見積る方法 | |
| JP2022017857A (ja) | 監視制御システム、監視制御方法、及び監視制御プログラム | |
| JP5034337B2 (ja) | 膜ろ過装置の運転条件の決定方法、およびそれを用いた膜ろ過装置の運転方法 | |
| JP2017170327A (ja) | 揺動状態検出方法、膜洗浄方法、揺動状態検出装置、及び膜洗浄装置 | |
| JP7628465B2 (ja) | 洗浄評価方法 | |
| EP2607881B1 (en) | Concentration device |
Legal Events
| Date | Code | Title | Description |
|---|---|---|---|
| ENP | Entry into the national phase |
Ref document number: 2017510426 Country of ref document: JP Kind code of ref document: A |
|
| 121 | Ep: the epo has been informed by wipo that ep was designated in this application |
Ref document number: 17747391 Country of ref document: EP Kind code of ref document: A1 |
|
| NENP | Non-entry into the national phase |
Ref country code: DE |
|
| 122 | Ep: pct application non-entry in european phase |
Ref document number: 17747391 Country of ref document: EP Kind code of ref document: A1 |