WO2017002274A1 - 糸、検知システム、繊維シート、コネクタ、検知装置および液体種類推定方法 - Google Patents
糸、検知システム、繊維シート、コネクタ、検知装置および液体種類推定方法 Download PDFInfo
- Publication number
- WO2017002274A1 WO2017002274A1 PCT/JP2015/078337 JP2015078337W WO2017002274A1 WO 2017002274 A1 WO2017002274 A1 WO 2017002274A1 JP 2015078337 W JP2015078337 W JP 2015078337W WO 2017002274 A1 WO2017002274 A1 WO 2017002274A1
- Authority
- WO
- WIPO (PCT)
- Prior art keywords
- output unit
- signal output
- fiber sheet
- frequency
- conductor
- Prior art date
Links
Images


Classifications
-
- G—PHYSICS
- G01—MEASURING; TESTING
- G01N—INVESTIGATING OR ANALYSING MATERIALS BY DETERMINING THEIR CHEMICAL OR PHYSICAL PROPERTIES
- G01N27/00—Investigating or analysing materials by the use of electric, electrochemical, or magnetic means
- G01N27/02—Investigating or analysing materials by the use of electric, electrochemical, or magnetic means by investigating impedance
-
- A—HUMAN NECESSITIES
- A61—MEDICAL OR VETERINARY SCIENCE; HYGIENE
- A61B—DIAGNOSIS; SURGERY; IDENTIFICATION
- A61B5/00—Measuring for diagnostic purposes; Identification of persons
- A61B5/02—Detecting, measuring or recording pulse, heart rate, blood pressure or blood flow; Combined pulse/heart-rate/blood pressure determination; Evaluating a cardiovascular condition not otherwise provided for, e.g. using combinations of techniques provided for in this group with electrocardiography or electroauscultation; Heart catheters for measuring blood pressure
- A61B5/02042—Determining blood loss or bleeding, e.g. during a surgical procedure
-
- A—HUMAN NECESSITIES
- A61—MEDICAL OR VETERINARY SCIENCE; HYGIENE
- A61M—DEVICES FOR INTRODUCING MEDIA INTO, OR ONTO, THE BODY; DEVICES FOR TRANSDUCING BODY MEDIA OR FOR TAKING MEDIA FROM THE BODY; DEVICES FOR PRODUCING OR ENDING SLEEP OR STUPOR
- A61M1/00—Suction or pumping devices for medical purposes; Devices for carrying-off, for treatment of, or for carrying-over, body-liquids; Drainage systems
- A61M1/36—Other treatment of blood in a by-pass of the natural circulatory system, e.g. temperature adaptation, irradiation ; Extra-corporeal blood circuits
- A61M1/3621—Extra-corporeal blood circuits
- A61M1/3653—Interfaces between patient blood circulation and extra-corporal blood circuit
- A61M1/3656—Monitoring patency or flow at connection sites; Detecting disconnections
-
- D—TEXTILES; PAPER
- D02—YARNS; MECHANICAL FINISHING OF YARNS OR ROPES; WARPING OR BEAMING
- D02G—CRIMPING OR CURLING FIBRES, FILAMENTS, THREADS, OR YARNS; YARNS OR THREADS
- D02G3/00—Yarns or threads, e.g. fancy yarns; Processes or apparatus for the production thereof, not otherwise provided for
- D02G3/02—Yarns or threads characterised by the material or by the materials from which they are made
- D02G3/04—Blended or other yarns or threads containing components made from different materials
-
- D—TEXTILES; PAPER
- D02—YARNS; MECHANICAL FINISHING OF YARNS OR ROPES; WARPING OR BEAMING
- D02G—CRIMPING OR CURLING FIBRES, FILAMENTS, THREADS, OR YARNS; YARNS OR THREADS
- D02G3/00—Yarns or threads, e.g. fancy yarns; Processes or apparatus for the production thereof, not otherwise provided for
- D02G3/22—Yarns or threads characterised by constructional features, e.g. blending, filament/fibre
- D02G3/38—Threads in which fibres, filaments, or yarns are wound with other yarns or filaments, e.g. wrap yarns, i.e. strands of filaments or staple fibres are wrapped by a helically wound binder yarn
-
- D—TEXTILES; PAPER
- D02—YARNS; MECHANICAL FINISHING OF YARNS OR ROPES; WARPING OR BEAMING
- D02G—CRIMPING OR CURLING FIBRES, FILAMENTS, THREADS, OR YARNS; YARNS OR THREADS
- D02G3/00—Yarns or threads, e.g. fancy yarns; Processes or apparatus for the production thereof, not otherwise provided for
- D02G3/44—Yarns or threads characterised by the purpose for which they are designed
- D02G3/441—Yarns or threads with antistatic, conductive or radiation-shielding properties
-
- G—PHYSICS
- G01—MEASURING; TESTING
- G01N—INVESTIGATING OR ANALYSING MATERIALS BY DETERMINING THEIR CHEMICAL OR PHYSICAL PROPERTIES
- G01N27/00—Investigating or analysing materials by the use of electric, electrochemical, or magnetic means
- G01N27/02—Investigating or analysing materials by the use of electric, electrochemical, or magnetic means by investigating impedance
- G01N27/04—Investigating or analysing materials by the use of electric, electrochemical, or magnetic means by investigating impedance by investigating resistance
- G01N27/06—Investigating or analysing materials by the use of electric, electrochemical, or magnetic means by investigating impedance by investigating resistance of a liquid
-
- G—PHYSICS
- G01—MEASURING; TESTING
- G01N—INVESTIGATING OR ANALYSING MATERIALS BY DETERMINING THEIR CHEMICAL OR PHYSICAL PROPERTIES
- G01N33/00—Investigating or analysing materials by specific methods not covered by groups G01N1/00 - G01N31/00
- G01N33/48—Biological material, e.g. blood, urine; Haemocytometers
- G01N33/483—Physical analysis of biological material
- G01N33/487—Physical analysis of biological material of liquid biological material
- G01N33/48785—Electrical and electronic details of measuring devices for physical analysis of liquid biological material not specific to a particular test method, e.g. user interface or power supply
-
- A—HUMAN NECESSITIES
- A61—MEDICAL OR VETERINARY SCIENCE; HYGIENE
- A61M—DEVICES FOR INTRODUCING MEDIA INTO, OR ONTO, THE BODY; DEVICES FOR TRANSDUCING BODY MEDIA OR FOR TAKING MEDIA FROM THE BODY; DEVICES FOR PRODUCING OR ENDING SLEEP OR STUPOR
- A61M2205/00—General characteristics of the apparatus
- A61M2205/15—Detection of leaks
-
- A—HUMAN NECESSITIES
- A61—MEDICAL OR VETERINARY SCIENCE; HYGIENE
- A61M—DEVICES FOR INTRODUCING MEDIA INTO, OR ONTO, THE BODY; DEVICES FOR TRANSDUCING BODY MEDIA OR FOR TAKING MEDIA FROM THE BODY; DEVICES FOR PRODUCING OR ENDING SLEEP OR STUPOR
- A61M2205/00—General characteristics of the apparatus
- A61M2205/33—Controlling, regulating or measuring
- A61M2205/3317—Electromagnetic, inductive or dielectric measuring means
-
- D—TEXTILES; PAPER
- D02—YARNS; MECHANICAL FINISHING OF YARNS OR ROPES; WARPING OR BEAMING
- D02G—CRIMPING OR CURLING FIBRES, FILAMENTS, THREADS, OR YARNS; YARNS OR THREADS
- D02G3/00—Yarns or threads, e.g. fancy yarns; Processes or apparatus for the production thereof, not otherwise provided for
- D02G3/22—Yarns or threads characterised by constructional features, e.g. blending, filament/fibre
- D02G3/36—Cored or coated yarns or threads
-
- D—TEXTILES; PAPER
- D10—INDEXING SCHEME ASSOCIATED WITH SUBLASSES OF SECTION D, RELATING TO TEXTILES
- D10B—INDEXING SCHEME ASSOCIATED WITH SUBLASSES OF SECTION D, RELATING TO TEXTILES
- D10B2401/00—Physical properties
- D10B2401/16—Physical properties antistatic; conductive
-
- D—TEXTILES; PAPER
- D10—INDEXING SCHEME ASSOCIATED WITH SUBLASSES OF SECTION D, RELATING TO TEXTILES
- D10B—INDEXING SCHEME ASSOCIATED WITH SUBLASSES OF SECTION D, RELATING TO TEXTILES
- D10B2509/00—Medical; Hygiene
-
- D—TEXTILES; PAPER
- D10—INDEXING SCHEME ASSOCIATED WITH SUBLASSES OF SECTION D, RELATING TO TEXTILES
- D10B—INDEXING SCHEME ASSOCIATED WITH SUBLASSES OF SECTION D, RELATING TO TEXTILES
- D10B2509/00—Medical; Hygiene
- D10B2509/02—Bandages, dressings or absorbent pads
Definitions
- the present invention relates to a yarn, a detection system, a fiber sheet, a connector, a detection device, and a liquid type estimation method.
- Needle extraction during artificial dialysis may lead to a serious accident due to sudden bleeding, and therefore prompt detection is required when the needle is removed.
- a method for detecting the withdrawal of needles by detecting bleeding has been proposed. In this method, it is desired to detect blood separately from sweat in order to prevent erroneous detection. In this way, it may be required to detect the adhesion of a specific liquid in distinction from the adhesion of other liquids to the sensor.
- the moisture sensor includes an electrode sheet, a filter sheet, and a water-permeable sheet.
- the electrode sheet has a three-layer base sheet and includes a reinforcing sheet.
- the reinforcing sheet has a large number of fine holes and has air permeability that allows water vapor to pass therethrough but also has waterproof properties that prevent passage of water droplets.
- the connector includes a lever and a clip. The lever and the clip sandwich one end and the other end of the moisture sensor, respectively.
- the clip includes a normally closed switch. The switch is turned off when the clip holds the moisture sensor, and the switch is turned on when the clip is detached from the moisture sensor. According to Patent Document 1, it is thereby possible to reliably detect bleeding due to withdrawal and the probability of withdrawal without causing malfunction due to sweat.
- a moisture sensor to which blood adheres during bleeding has a complicated structure as described above. For this reason, manufacturing a moisture sensor requires a great deal of cost, and the moisture sensor may not be disposable. On the other hand, from the viewpoint of more surely preventing sick blood infection, it is preferable to dispose a portion to which blood may adhere. In this way, it may be desirable to be able to detect the attachment of a specific liquid such as blood while distinguishing it from other liquids such as sweat, and to make the part to which the liquid adheres disposable.
- the present invention is capable of detecting the adhesion of a specific liquid in distinction from other liquids, and is optimal for a detection system that can make the portion to which the liquid adheres disposable, thread, detection system, fiber sheet, connector, and detection device And a liquid type estimation method.
- the yarn includes a first conductive yarn having conductivity, and a first insulating portion that covers the first conductive yarn and is formed of an insulating material having water absorption properties. And a second conductive yarn having conductivity disposed on the outer peripheral side of the first insulating portion.
- the second conductive yarn may be spirally wound around the outer peripheral surface of the first insulating portion.
- the second conductive yarn may be formed of an insulating material having water absorption.
- the yarn may be covered with a third insulating portion formed of an insulating material having water absorption.
- the insulating material may be cotton.
- the detection system includes a fiber sheet and a detection device, and the fiber sheet is combined with a fiber sheet main body formed of an insulating material so as not to contact each other. And a sensor fiber including two conductors, the sensor fiber covering the first conductive thread and the insulating material formed by an insulating material that absorbs water.
- An AC signal output unit that inputs a signal
- a frequency characteristic acquisition unit that acquires a frequency characteristic between the conductors when the AC signal output unit inputs an AC signal between the conductors
- the AC signal output unit The frequency characteristic acquired by the frequency characteristic acquisition unit by inputting a plurality of AC signals having different frequencies between the conductors shows a predetermined difference according to the frequency difference of the AC signal from the AC signal output unit, And, when the frequency characteristics at different times acquired by the frequency characteristics acquisition unit by inputting the AC signal of the same frequency between the conductors, the AC signal output unit shows a predetermined change over time,
- a detection signal output unit that outputs a detection signal.
- the AC signal output unit inputs at least three AC signals having different frequencies between a plurality of conductors provided on the fiber sheet, and the frequency characteristic acquisition unit receives the AC signal output unit.
- the impedance measurement value between the conductors is acquired for each AC signal, and the detection signal output unit obtains a Cole-Cole locus that approximates the impedance measurement value acquired by the frequency characteristic acquisition unit with a part of an arc,
- a circuit parameter value in a predetermined equivalent circuit model simulating the impedance of the liquid having a film is obtained based on the Cole-Cole locus, and the type of the liquid is estimated based on the obtained circuit parameter value.
- the AC signal output unit inputs a plurality of AC signals having different frequencies between the conductors, and the frequency characteristic acquisition unit acquires the frequency. Number characteristics, it is determined whether or not showing a predetermined difference in accordance with the difference in frequency of the AC signal from the AC signal output unit may be so.
- a fiber sheet includes a fiber sheet body formed of an insulating material and sensor fibers including at least two conductors combined so as not to contact each other,
- the sensor fiber is disposed on the outer peripheral side of the insulating portion, the first conductive yarn having conductivity, the insulating portion that covers the first conductive yarn and is formed of an insulating material having water absorption.
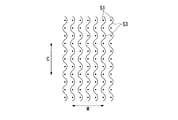
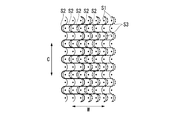
- the fiber sheet body may be stretchable in at least one direction, and the sensor fibers may be arranged in a wave shape along the extending direction of the fiber sheet body.
- the connector is a connector for connecting the first conductive yarn and the second conductive yarn and the detection device, and the sensor fiber is fitted and extends in one direction.
- the detection device includes an AC signal output unit that inputs an AC signal between a plurality of conductors provided in a fiber sheet, and the AC signal output unit is an AC between the conductors.
- a frequency characteristic acquisition unit that acquires a frequency characteristic between the conductors when a signal is input, and the AC signal output unit inputs a plurality of AC signals having different frequencies between the conductors, and the frequency characteristic acquisition unit
- the acquired frequency characteristic indicates a predetermined difference according to a difference in frequency of the AC signal from the AC signal output unit, and the AC signal output unit inputs an AC signal of the same frequency between the conductors.
- a detection signal output unit that outputs a detection signal when the frequency characteristics acquired at different times acquired by the frequency characteristic acquisition unit exhibit a predetermined change with time.
- the liquid type estimation method includes an AC signal input step of inputting at least three AC signals having different frequencies between a plurality of conductors provided on the fiber sheet, and the AC signal input.
- An impedance measurement value acquisition step for acquiring an impedance measurement value between the conductors for each AC signal input in the step, and a Cole-Cole that approximates the impedance measurement value obtained in the impedance measurement value acquisition step with a part of an arc.
- a Cole-Cole locus acquisition step for obtaining a locus a capacitance acquisition step for obtaining a value of a circuit parameter in a predetermined equivalent circuit model simulating the impedance of the liquid having a film based on the Cole-Cole locus, and the obtained circuit parameter Liquid type to estimate the liquid type based on the value of Including a constant step, the.
- the present invention it is possible to determine with high accuracy whether or not the liquid dripping on the fiber sheet is a predetermined liquid (for example, blood), and the possibility of erroneously outputting the detection signal can be reduced.
- a predetermined liquid for example, blood
- FIG. 3 is a structural diagram showing a schematic structure of a sensor fiber used in an experiment related to the embodiment. It is explanatory drawing which shows the layer structure of a sensor fiber in the experiment regarding the embodiment. It is the schematic which shows the manufacturing apparatus of a sensor fiber.
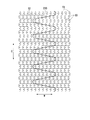
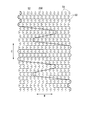
- FIG. 3 is a structural diagram showing a schematic structure of a fiber sheet in the same embodiment. It is a figure explaining the manufacturing method of the fiber sheet containing a sensor fiber, Comprising: It is the figure which showed the knitting structure of the warp.
- FIG. 10 is a structural diagram illustrating a schematic structure of another form of the sensor fiber illustrated in FIG. 9.
- FIG. 9 is a structural diagram illustrating a schematic structure of another form of the sensor fiber illustrated in FIG. 9.
- FIG. 10 is a structural diagram illustrating a schematic structure of another form of the sensor fiber illustrated in FIG. 9. It is explanatory drawing which shows another example of arrangement
- FIG. 53 is an explanatory diagram illustrating an arrangement example of two conductors in the cross section of the yarn illustrated in FIG. 52.
- FIG. 1 is a schematic block diagram showing a functional configuration of a frequency characteristic detection system according to an embodiment of the present invention.
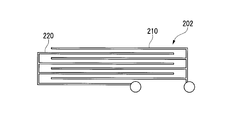
- the detection system 1 includes a detection device 100 and a fiber sheet 200.
- the detection device 100 includes an AC signal output unit 110, a frequency characteristic acquisition unit 120, an alarm output unit 130, a storage unit 180, and a control unit 190.
- the storage unit 180 includes a detection condition storage unit 181.
- the control unit 190 includes a detection signal output unit 191.
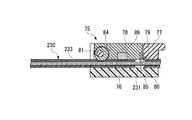
- the fiber sheet 200 includes a first conductor 210 and a second conductor 220.
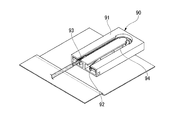
- FIG. 2 is an explanatory view showing an example of needle removal in artificial dialysis.
- a Teflon needle (Teflon is a registered trademark) 921 is inserted into a blood vessel 911, and the Teflon needle 921 is provided with a lateral groove H11.
- a Teflon needle 921 is inserted into the artery.
- a Teflon needle 921 is inserted into the vein on the blood return side from the artificial dialyzer to the body.
- a part of the Teflon needle 921 has slipped out of the body (outside the skin 912), and blood has leaked from the lateral groove H11 exposed outside the body.
- needle withdrawal is more likely to occur than on the blood collection side due to the effect of increasing blood pressure with an artificial dialyzer.
- the needle is likely to be removed.
- the fiber sheet 200 is a bandage wound around an arm that is punctured with a needle, that is, a site to be monitored for blood leakage, during artificial dialysis.
- a needle that is, a site to be monitored for blood leakage
- the fiber sheet 200 is wound around the patient's arm, and a Teflon needle 921 (FIG. 2) is punctured around the patient's arm around which the fiber sheet 200 is wound.
- the fiber sheet 200 has water absorption and prevents blood, sweat, etc. from leaking to the bed side.
- the fiber sheet 200 may be waterproof in addition to or instead of water absorption. Thereby, it can prevent more reliably that blood, sweat, etc. leak to the bed side.
- the fiber sheet 200 When the patient moves greatly, such as turning over, the fiber sheet 200 is laid on the bed and the patient's arm is placed on the bed. Depending on the size of the fiber sheet 200, blood can leak outside the fiber sheet 200. There is sex. On the other hand, by wrapping the fiber sheet 200 configured as a bandage around the site to be monitored for blood leakage, the possibility of the fiber sheet 200 being detached from the site to be monitored for blood leakage can be reduced and more reliably. Blood leakage can be detected.
- the detection device 100 may not be able to detect blood leakage inside the bandage.
- the detection apparatus 100 can detect blood leakage inside the bandage more reliably by winding and fixing the puncture site with the fiber sheet 200 configured as a bandage.
- the fiber sheet 200 may be placed under the patient's arm when the patient is not moving for a short time.
- the fiber sheet 200 comprised as a gauze can be applied to a blood leak monitoring object site
- the first conductor 210 and the second conductor 220 are conductors provided on the fiber sheet 200, respectively, and an AC signal from the AC signal output unit 110 is input thereto.
- the first conductor 210 and the second conductor 220 are not in contact.
- the main body of the fiber sheet 200 (the portion serving as a base on which the first conductor 210 and the second conductor 220 are provided) is made of insulating fibers. For this reason, in the state where the liquid is not attached to the fiber sheet 200, the first conductor 210 and the second conductor 220 are insulated or only a minute alternating current due to the capacitor effect or the like flows. On the other hand, when a liquid drips between the first conductor 210 and the second conductor 220, the first conductor 210 and the second conductor 220 are energized with frequency characteristics corresponding to the dripping liquid.
- the fiber sheet 200 absorbs water and diffuses the liquid, so that even if the liquid hangs at a position other than between the first conductor 210 and the second conductor 220, the first conductor 210 and the second conductor
- the possibility that the two conductors 220 are energized can be increased.
- the possibility that the detection system 1 can detect blood leakage can be increased.
- the patient's arm is directly attached to the first conductor 210 or the second conductor 220, such as a structure in which an insulating layer having water absorbency is provided on the surfaces of the first conductor 210 and the second conductor 220. It is good also as a structure which does not contact.
- the detection system 1 may detect blood leakage by detecting a current-carrying characteristic (frequency characteristic) that can be distinguished from contact with the patient's arm.
- conductive yarn may be used as the first conductor 210 or the second conductor 220 and may be knitted when the fiber sheet 200 is manufactured. Or you may make it sew on the fiber sheet 200 main body after manufacture using a conductive thread as the 1st conductor 210 or the 2nd conductor 220.
- FIG. By using conductive yarns as the first conductor 210 and the second conductor 220, the touch of the fiber sheet 200 can be improved. Thereby, it is not necessary to give discomfort when the patient puts his arm on the fiber sheet 200.
- the detection device 100 inputs an AC signal to the fiber sheet 200, acquires frequency characteristics on the fiber sheet 200 side, and determines the presence or absence of blood leakage.
- the AC signal input to the fiber sheet 200 by the detection device 100 various signals whose voltages change (that is, various signals having frequencies) can be used.
- the detection apparatus 100 may input a sine wave to the fiber sheet 200, may input a triangular wave, or may input a rectangular wave.
- the frequency characteristic which the detection apparatus 100 acquires can be various data measured according to the frequency of the alternating current signal input.
- the detection apparatus 100 measures the magnitude of impedance (Impedance) and its phase rotation as frequency characteristics will be described as an example, but the present invention is not limited to this.
- the impedance measurement will be described using the two-electrode method as an example, but a four-electrode method or the like may be used.
- the detection device 100 includes, for example, a microcomputer. Or it is good also as structures other than the structure containing a microcomputer, such as each part of the detection apparatus 100 comprised by a dedicated circuit, or using a smart phone or a personal computer.
- the AC signal output unit 110 outputs an AC signal for input to the fiber sheet 200. Specifically, the AC signal output unit 110 inputs an AC signal between a plurality of conductors provided in the fiber sheet 200 (between the first conductor 210 and the second conductor 220 in this embodiment). As described above, various signals whose voltage changes can be used as the AC signal output from the AC signal output unit 110.
- the frequency characteristic acquisition unit 120 acquires frequency characteristics between the conductors when the AC signal output unit 110 inputs an AC signal between the plurality of conductors provided in the fiber sheet 200.
- the frequency characteristic acquisition unit 120 may measure the impedance of the fiber sheet 200 at the frequency of the AC signal output from the AC signal output unit 110 or the AC signal in the fiber sheet 200 with respect to the AC signal output from the AC signal output unit 110. Measure phase rotation. Furthermore, for example, the frequency characteristic acquisition unit 120 outputs an AC signal of an impedance between the first conductor 210 and the second conductor 220 or an electric current flowing between the first conductor 210 and the second conductor 220. The phase rotation with respect to the AC signal output from the unit 110 is measured.
- the frequency characteristic acquisition unit 120 acquires frequency characteristics when the first frequency AC signal and the second frequency AC signal are input to the first conductor 210 and the second conductor 220, respectively.
- the frequency characteristic acquisition unit 120 measures the frequency characteristics when each AC signal having a different frequency is input to the first conductor 210 and the second conductor 220.
- the detection device 100 detects blood leakage based on the frequency characteristics of each of the AC signals having different frequencies, so that blood and sweat can be distinguished. Thereby, the erroneous detection of the needle removal can be reduced.
- the alarm output unit 130 outputs an alarm when the detection device 100 (detection signal output unit 191) detects blood leakage based on the frequency characteristic acquired by the frequency characteristic acquisition unit 120.
- the alarm output unit 130 includes a speaker and outputs an alarm sound according to the detection signal output from the detection signal output unit 191.
- the alarm output unit 130 may include a lamp in addition to or instead of the speaker, and output an alarm when the lamp emits light. Or you may make it the alarm output part 130 transmit an alarm signal to other apparatuses, such as transmitting an alarm signal to the personal computer (PC) installed in the nurse center.
- PC personal computer
- the storage unit 180 includes, for example, a storage device included in the detection apparatus 100 and stores various data.
- the detection condition storage unit 181 stores a determination threshold value as to whether or not the detection signal output unit 191 outputs a detection signal. That is, the threshold value is used as a detection condition when the detection signal output unit 191 determines whether or not blood leakage has been detected.
- the control unit 190 controls each unit of the detection device 100 to execute various functions.
- the control unit 190 is realized by, for example, a CPU (Central Processing Unit) included in the detection device 100 reading out a program from the storage unit 180 and executing the program.
- the detection signal output unit 191 outputs a detection signal when the frequency characteristic acquisition unit 120 acquires a predetermined frequency characteristic. More specifically, the detection signal output unit 191 determines whether or not the frequency characteristic acquired by the frequency characteristic acquisition unit 120 satisfies the detection condition stored in the detection condition storage unit 181. When the detection signal output unit 191 determines that the detection condition is satisfied, the detection signal output unit 191 outputs a detection signal to the alarm output unit 130.
- a CPU Central Processing Unit
- the detection signal output unit 191 has a frequency characteristic acquisition unit in which the AC signal output unit 110 inputs a plurality of AC signals having different frequencies between conductors (between the first conductor 210 and the second conductor 220).
- the frequency characteristic acquired by 120 indicates a predetermined difference according to the difference in the frequency of the AC signal from the AC signal output unit 110, and the AC signal output unit 110 inputs an AC signal having the same frequency between the conductors.
- a detection signal is output.
- the AC signal output unit 110 inputs an AC signal a plurality of times while changing the frequency between the first conductor 210 and the second conductor 220.
- the frequency characteristic acquisition unit 120 measures the frequency characteristic (for example, impedance or phase) between the first conductor 210 and the second conductor 220 every time the AC signal output unit 110 inputs an AC signal.
- the detection signal output unit 191 has a frequency characteristic between the first conductor 210 and the second conductor 220 that is greater than or equal to a predetermined magnitude according to a change in the frequency of the AC signal from the AC signal output unit 110. Determine if it has changed.
- the AC signal output unit 110 inputs an AC signal between the first conductor 210 and the second conductor 220, and inputs an AC current having the same frequency again after a predetermined time has elapsed.
- the number of times the AC signal output unit 110 inputs the AC signal may be two times or three or more times.
- the AC signal output unit 110 may continuously input an AC signal having the same frequency between the first conductor 210 and the second conductor 220 for a predetermined time.
- the frequency characteristic acquisition part 120 measures the frequency characteristic between the 1st conductor 210 and the 2nd conductor 220 in multiple times, when the alternating current signal output part 110 is inputting the alternating current signal of the same frequency. .
- the detection signal output unit 191 determines whether the first conductor 210 and the second conductor 220 correspond to the passage of time from when the frequency characteristic acquisition unit 120 measures the frequency characteristic to when the frequency characteristic is acquired. It is determined whether or not the frequency characteristic between them changes beyond a predetermined magnitude.
- the detection signal output unit 191 has a frequency characteristic between the first conductor 210 and the second conductor 220 that is greater than or equal to a predetermined magnitude according to a change in the frequency of the AC signal from the AC signal output unit 110. And the time between the frequency characteristic acquisition unit 120 measuring the frequency characteristic and the next acquisition of the frequency characteristic, between the first conductor 210 and the second conductor 220. When it is determined that the frequency characteristic has changed to a predetermined magnitude or more, a detection signal is output to the alarm output unit 130. As described above, whether the detection signal output unit 191 determines both the difference in the frequency characteristics based on the difference in the input frequency and the change in the frequency characteristics based on the passage of time, and whether or not blood has dripped on the fiber sheet 200. Can be determined with higher accuracy.
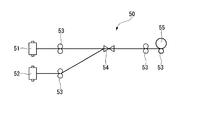
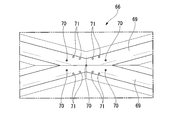
- FIG. 3 is an external view showing an outline of the outer shape of the container and measurement electrode used in the experiment.
- electrodes 802 were inserted into both ends of the acrylic container 801, and blood and saline were placed in the container.
- the acrylic container 801 was placed in a thermostatic bath, and an experiment was conducted at a temperature close to body temperature (37 degrees (° C.)).
- each of the electrodes 802 was connected to a constant current source 803 to pass an AC signal.
- Each of the electrodes 802 is connected to a voltmeter 804, and the voltage between the electrodes 802 was measured with the voltmeter 804.
- the electrode 802 simulates the first conductor 210 and the second conductor 220.
- the constant current source 803 simulates the AC signal output unit 110.
- the voltmeter 804 simulates the frequency characteristic acquisition unit 120.
- FIG. 4 is an explanatory diagram showing an outline of a circuit in the experiment.
- the constant current source 803 is connected between the two electrodes 802 and inputs an AC signal to the two electrodes 802.
- a voltmeter 804 is connected between the two electrodes 802 and measures the voltage between the two electrodes 802.
- Hct hematocrit value
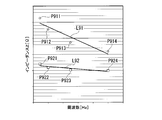
- FIG. 5 is a graph showing the measurement result of the impedance magnitude Z in the state in which the saline solution is contained in the acrylic container 801.
- the magnitude of the impedance is also simply expressed as impedance.
- the horizontal axis of the graph shown in the figure represents the frequency, and the vertical axis represents the impedance.
- saline was placed in three acrylic containers 801 (hereinafter referred to as container A, container B, and container C) having different sizes, and impedance was measured.
- container A, container B, and container C acrylic containers 801 having different sizes, and impedance was measured.
- the frequency characteristic in the state where the saline is contained in the acrylic container 801 indicates the frequency characteristic of the acrylic container 801 itself. Further, the frequency characteristic in a state where the saline solution enters the acrylic container 801 simulates the frequency characteristic of sweat.
- Lines L11, L12, and L13 indicate impedance measurement values in the container A, the container B, and the container C, respectively.
- Each of the lines L11, L12, and L13 shows an approximately constant impedance in the range of about 3 kilohertz (kHz) to about 2 megahertz (MHz). In other frequency ranges, the influence of the contact impedance of the electrode and the measurement cable is considered to have occurred.
- FIG. 6 is a graph showing the measurement result of the phase difference (phase rotation) in a state in which saline is contained in the acrylic container 801.
- the phase difference here is a difference between the phase of the AC signal output from the constant current source 803 and the phase of the AC signal between the electrodes 802 whose voltage is measured by the voltmeter 804.
- the horizontal axis of the graph shown in FIG. 6 indicates the frequency, and the vertical axis indicates the phase difference.
- Lines L21, L22, and L23 indicate the phase differences in the container A, the container B, and the container C, respectively.
- All of the lines L11, L12, and L13 show a substantially constant phase difference (approximately zero phase difference) in the range of about 40 kilohertz to about 2 megahertz. From the measurement results of FIGS. 5 and 6, in the saline solution, both the amplitude and the phase are approximately constant in the range from about 40 kilohertz to about 2 megahertz. In other frequency ranges, the influence of the contact impedance of the electrode and the measurement cable is considered to have occurred.
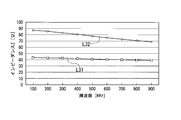
- FIG. 7 is a graph showing the measurement result of the impedance magnitude Z in the state in which porcine blood enters the acrylic container 801.
- the horizontal axis of the graph shown in the figure represents the frequency, and the vertical axis represents the impedance.
- the frequency characteristic in the state where porcine blood is contained in the acrylic container 801 simulates the frequency characteristic of human blood.
- Line L31 indicates the impedance of non-coagulated blood.
- Line L32 represents the impedance of the coagulated blood.
- the impedance decreases as the frequency increases from 100 kilohertz to 900 kilohertz.
- the impedance is larger than that in the case of non-coagulated blood, and the rate of decrease in impedance with respect to the increase in frequency is larger.
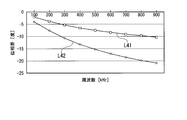
- FIG. 8 is a graph showing the measurement result of the phase difference (phase rotation) in a state where porcine blood is in the acrylic container 801.
- the phase difference in FIG. 8 is the difference between the phase of the AC signal output from the constant current source 803 and the phase of the AC signal between the electrodes 802 whose voltage is measured by the voltmeter 804.
- the horizontal axis of the graph shown in FIG. 8 indicates the frequency, and the vertical axis indicates the phase difference.
- a line L41 indicates a phase difference in non-coagulated blood.
- a line L42 indicates the phase difference in the coagulated blood.
- the phase difference increases as the frequency increases from 100 kilohertz to 900 kilohertz.
- the phase difference is larger than that in the case of non-coagulated blood, and the rate of increase in the phase delay with respect to the increase in frequency is also increased.
- the saline solution (sweat) and the blood are distinguished by comparing the amplitude and / or phase in the case of relatively low frequency and in the case of relatively high frequency. It is possible. Specifically, when the change according to the change in frequency is relatively small, it is determined as saline or sweat, and when it is relatively large, it is determined as blood.
- a relatively low frequency case for example, an AC signal of 100 kilohertz or less is used.
- a relatively high frequency for example, an AC signal of 900 kHz or higher is used.
- the AC signal output unit 110 inputs an AC signal of 100 kHz as an AC signal having a first frequency to the first conductor 210 and the second conductor 220.
- the AC signal output unit 110 inputs an AC signal of 900 kHz as the AC signal of the second frequency to the first conductor 210 and the second conductor 220.
- the frequency characteristic acquisition part 120 is the impedance between the 1st conductor 210 and the 2nd conductor 220, and the 1st conductor 210 and the 2nd in each case in the case of the 1st frequency and the 2nd frequency. The phase delay of the current between the conductor 220 and the current output from the AC signal output unit 110 is measured.
- the detection signal output part 191 outputs a detection signal, for example, when the measured value by the frequency characteristic acquisition part 120 satisfy
- the magnitude of impedance in the case of the second frequency is 95% or less with respect to the magnitude of impedance in the case of the first frequency. (In other words, it is smaller than 5 percent.)
- the magnitude of the phase delay in the case of the second frequency is more than twice the magnitude of the phase delay in the case of the first frequency.
- both the condition (1) and the condition (2) are satisfied.
- the conditions (1) and (2) are not satisfied. Therefore, the outflow of blood can be detected by the condition (1) or the condition (2) or a combination of these conditions, and erroneous detection due to sweat or the like can be reduced.
- the detection signal output unit 191 detects so as to distinguish between coagulated blood and non-coagulated blood.
- the fiber sheet 200 may be used for a gauze or bandage applied to a wound after surgery or the like, and the detection signal output unit 191 may detect a change in state where blood leakage coagulates with time. More specifically, when the detection signal output unit 191 includes a timer and detects that a predetermined time has elapsed since the end of the operation, the presence / absence of blood coagulation is determined.
- the detection device 100 When it is determined that there is no blood coagulation, the detection device 100 outputs an alarm for prompting confirmation of hemostasis. Further, after the bleeding from the wound stops, when the detection signal output unit 191 detects non-coagulated blood, the detection device 100 may output an alarm indicating the possibility that the wound has opened.
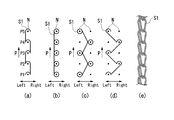
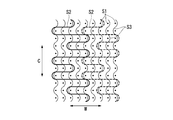
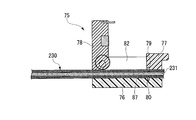
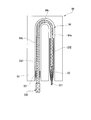
- 9 and 10 are structural views showing a schematic structure of the sensor fiber.
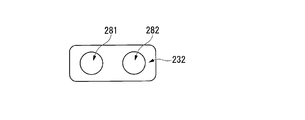
- the sensor fiber 230 shown in the figure has conductive yarns 231 and 233 each having a core 234 formed of an organic fiber and a copper foil 235 that covers the core 234.
- the conductive yarn 231 and the conductive yarn 233 are respectively covered with insulating cotton 232 (first insulating portion) and second insulating cotton 236 (second insulating portion), which are insulating materials having water absorption.
- the sensor fiber 230 covers a conductive yarn group composed of a plurality of first conductive yarns 231 (functioning as the first conductor 210) with insulating cotton 232 and insulates the outer periphery of the insulating cotton 232.
- the second conductive yarn 233 (functioning as the second conductor 220) covered with the conductive cotton 236 is spirally wound. That is, the second conductive thread 233 is disposed on the outer peripheral side of the second insulating portion 236. Since the first conductive yarn 231 is covered with the insulating cotton 232 and the second conductive yarn 233 is covered with the insulating cotton 236, the insulating yarns 231 and 233 can directly touch the body surface or the like. Disappear.
- the insulating material covering the conductive yarns 232 and 233 is not limited to cotton, and any insulating material having water absorption can be used. For example, rayon or silk can be used.
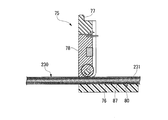
- FIG. 10 is an explanatory diagram showing the layer structure of the sensor fiber 230.
- FIG. 10 shows a layer structure in a cross section of the sensor fiber 230.
- insulating cotton 232 and insulating cotton 236 are interposed between the conductive yarn 231 and the conductive yarn 233.
- the main reason for such a coaxial structure is to reduce noise due to body movement or lap winding on the arm.
- the current density between the conductive yarn 231 and the conductive yarn 233 is maximized, and the influence of noise from the outside of the sensor fiber can be reduced.
- the measurement value hardly fluctuates.
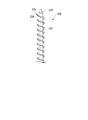
- FIG. 11 is a schematic view of a sensor fiber manufacturing apparatus 50.
- the sensor fiber manufacturing apparatus 50 includes a first supply reel 51 that supplies a core wire, a second supply reel 52 that supplies a covering yarn, a plurality of feed rollers 53, and a false twisting apparatus 54.
- a take-up roller 55 The manufacturing apparatus 50 can arbitrarily change the pitch of the covered wire to be coated (pitch in the longitudinal direction of the yarn) by adjusting the false twisting apparatus 54.
- the conductive yarn 231 (conductive yarn group) is set as the core wire on the first supply reel 51, and the insulating cotton 232 is set as the covering yarn, and the conductive material covered (covered) by the insulating cotton 232 is covered.
- a yarn 231 (hereinafter referred to as a first processed yarn) is manufactured.
- the first processed yarn is taken up by the take-up roller 55.
- the conductive yarn 233 covered with the insulating cotton 236 is manufactured.
- the first processed yarn is set on the first supply reel 51, the conductive yarn 233 is set on the second supply reel 52, and the first processed yarn (hereinafter referred to as the second processed yarn) around which the conductive yarn 233 is wound. Called process yarn).
- the sensor fiber 230 can be manufactured more easily. That is, by using the cover ring, the sensor fiber 230 can be manufactured using an existing manufacturing apparatus.
- the manufacturing method of the sensor fiber 230 is not limited to this, and may be manufactured, for example, by knitting a conductive thread that is a core wire and an insulating cotton that is a covered wire, such as a braid.
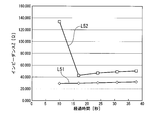
- FIG. 12 is a graph showing the change over time of the measured value of the magnitude Z of impedance in a state where saline or blood (pig blood) is dropped on the sensor fiber.
- the horizontal axis of the graph shown in the figure shows the elapsed time from the dropping, and the vertical axis shows the impedance.
- a line L51 indicates the impedance in a state where saline is dropped, and a line L52 indicates the impedance in a state where blood is dropped.
- an AC signal of 75 kilohertz is input to the sensor fiber 230 (conductive threads 231 and 233).
- the impedance In contrast to the dripping of the saline solution indicated by the line L51, the impedance hardly changes, whereas in the dripping of the blood indicated by the line L52, the impedance increases after decreasing once. Needless to say, the impedance is very high before the saline or blood is dropped on the sensor fiber.
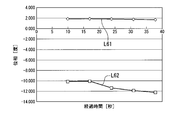
- FIG. 13 is a graph showing the change over time of the measured value of the phase difference in a state where saline solution or blood (pig blood) is dropped on the sensor fiber.
- the phase difference here is the phase difference (phase delay) of the AC signal flowing between the conductive yarns 231 and 233 with respect to the phase of the AC signal input to the conductive yarns 231 and 233.
- the horizontal axis of the graph shown in FIG. 13 indicates the elapsed time from the dropping, and the vertical axis indicates the phase difference.
- a line L61 indicates a phase difference in a state where saline is dropped, and a line L62 indicates a phase difference in a state where blood is dropped.
- an AC signal of 1 megahertz is input to the sensor fiber 230 (conductive threads 231 and 233).
- the phase difference is larger in the state where the blood indicated by the line L62 is dropped than in the state where the saline shown by the line L61 is dropped.
- the phase difference hardly changes in the dripping of the saline solution, whereas the phase is delayed with the passage of time in the dripping of the blood.
- FIG. 12 and FIG. 13 there is a difference in the time change of the frequency characteristics between saline and blood. Therefore, as a detection condition of the detection signal output unit 191, a condition regarding a change in the frequency characteristic over time may be used in addition to or instead of the difference in frequency characteristic due to the difference in frequency.
- the difference in frequency characteristics between saline and blood described with reference to FIGS. 3 to 13 is considered to be due to the structure of red blood cells in the blood. More specifically, it is considered that the impedance and the phase difference change depending on the frequency due to the dielectric caused by the red blood cell membrane. Therefore, the detection device 100 can detect blood by distinguishing it from various liquids that do not include structures such as red blood cell membranes, such as water and cola, as well as sweat. Therefore, in the detection apparatus 100, even when a patient spills a drink such as water or cola, the possibility of erroneous detection of the withdrawal of the needle can be reduced.
- FIG. 14 is an explanatory diagram showing an example of a change over time in the impedance ratio of blood and physiological saline.
- the horizontal axis of the graph of the figure shows the elapsed time from the dropping of the liquid, and the vertical axis shows the impedance ratio.
- an impedance signal is measured by inputting an AC signal of 5 MHz and an AC signal of 10 kHz between the first conductor 210 and the second conductor 220 at each sampling time. . Then, the impedance ratio is obtained by dividing the impedance when an AC signal of 5 MHz is input by the impedance when an AC signal of 10 kHz is input.
- Line L71 shows an example of the time change of the impedance ratio when physiological saline is dropped on the fiber sheet 200.
- Lines L72 to L76 show examples of changes in impedance ratio over time when blood with a hematocrit (Ht) value of 20%, 30%, 43%, 41%, and 44% is dropped on the fiber sheet 200, respectively.
- Ht hematocrit
- the impedance ratio is decreased both when the physiological saline (line L71) is dropped and when blood of any hematocrit value (lines L72 to L76) is dropped.
- the impedance ratio of blood (lines L72 to L76) is higher than that of physiological saline (line L71), blood and physiological saline (only when the impedance ratio threshold value is determined after 5 seconds of dripping). It can be seen that sweat can be separated. Furthermore, after the impedance ratio is lowered, the low impedance ratio is maintained in the case of the organized saline solution (line L71). On the other hand, in the case of blood (lines L72 to L76), the impedance ratio once increases and then increases.
- the detection device 100 detects that a liquid has dropped on the fiber sheet 200, and further determines whether or not the liquid is blood, thereby detecting leakage of liquid other than blood, such as infusion, in addition to leakage of blood. be able to.
- the leakage of the liquid can be detected by detecting the decrease in impedance.
- Determination of whether or not the liquid dripping on the fiber sheet 200 is blood can be performed by, for example, determining whether the time derivative of the impedance ratio is equal to or greater than a predetermined threshold. Specifically, when the liquid dripping on the fiber sheet 200 is blood, the impedance ratio between the first conductor 210 and the second conductor 220 decreases and then increases. This increase in impedance ratio can be detected by the value of the time derivative of the impedance ratio.
- the detection signal output unit 191 calculates the time derivative of the impedance ratio, and determines whether or not the obtained time derivative of the impedance ratio is equal to or greater than a predetermined threshold value. When the time derivative of the impedance ratio is equal to or greater than a predetermined threshold, the detection signal output unit 191 determines that blood has dripped on the fiber sheet 200. On the other hand, when the time derivative of the impedance ratio is less than the predetermined threshold, the detection signal output unit 191 determines that a liquid other than blood has dripped on the fiber sheet 200.
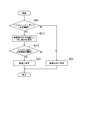
- FIG. 15 is a flowchart illustrating an example of a processing procedure in which the detection apparatus 100 detects that blood has dropped on the fiber sheet 200 and liquid other than blood has dropped.
- variable i is a variable that indicates the number of times that the frequency characteristic acquisition unit 120 measures the impedance between the first conductor 210 and the second conductor 220.
- variable j is a variable indicating the number of times that the detection signal output unit 191 calculates the impedance ratio based on the impedance measurement value.
- the frequency characteristic acquisition unit 120 acquires an impedance measurement value between the first conductor 210 and the second conductor 220 (step S102).
- the AC signal output unit 110 has an AC signal having a predetermined first frequency and a second frequency (a predetermined frequency different from the first frequency) between the first conductor 210 and the second conductor 220. Input AC signals.
- the frequency characteristic acquisition part 120 is the impedance between the 1st conductor 210 and the 2nd conductor 220 about each, when the alternating signal of a 1st frequency is input, and the alternating signal of a 2nd frequency is input. taking measurement. It is assumed that the first frequency is lower than the second frequency.
- the impedance measurement value when the AC signal output unit 110 inputs the first frequency AC signal in the i-th sampling is expressed as Za (i)
- the impedance when the second frequency AC signal is input is expressed as Zb (i).
- the frequency characteristic acquisition unit 120 causes the storage unit 180 to store the acquired impedance measurement values Za (i) and Zb (i).
- the detection signal output unit 191 determines whether i ⁇ N (step S103).
- the constant N (N is a positive integer of N ⁇ 1) is a constant set in advance as the number of data used by the detection signal output unit 191 to calculate the moving average of the impedance measurement values.
- the detection signal output unit 191 calculates a moving average of the impedance measurement values obtained in step S102 (step S104). Specifically, the detection signal output unit 191 obtains the latest N (Za (i ⁇ N + 1) to Za (i) among the impedance measurement values obtained by the frequency characteristic acquisition unit 120 at the first frequency AC signal input. )) Moving average Za_mean (i) is calculated. The detection signal output unit 191 also obtains the nearest N pieces (Zb (i ⁇ N + 1) to Zb (i)) of the impedance measurement values acquired by the frequency characteristic acquisition unit 120 at the second frequency AC signal input. The moving average Zb_mean (i) is calculated. The detection signal output unit 191 stores the calculated moving averages Za_mean (i) and Zb_mean (i) in the storage unit 180.
- the storage unit 180 does not have to store all the impedance measurement values acquired by the frequency characteristic acquisition unit 120 in step S102.
- the storage unit 180 includes the latest N impedance measurement values (Za (i ⁇ N + 1) to Za (i)) at the first frequency AC signal input and the impedance measurement value at the second frequency AC signal input. Of these, it is only necessary to memorize the latest N pieces (Zb (i ⁇ N + 1) to Zb (i)). Further, the storage unit 180 need not store all the moving averages calculated by the detection signal output unit 191 in step S104.
- the storage unit 180 includes Za_mean (i) for the latest one of the moving averages of the impedance measurement values at the first frequency AC signal input and the latest of the moving averages of the impedance measurement values at the second frequency AC signal input.
- One Zb_mean (i) may be stored.
- the detection signal output unit 191 calculates the impedance ratio Zmean (i) based on the moving averages Za_mean (i) and Zb_mean (i) of the impedance measurement values obtained in step S104, and stores them in Z (j). (Step S105). Specifically, the detection signal output unit 191 calculates the impedance ratio Zmean (i) by dividing the moving average Za_mean (i) of the impedance measurement value by the moving average Zb_mean (i) of the impedance measurement value. Then, the detection signal output unit 191 stores the calculated impedance ratio Zmean (i) in the storage unit 180 as the impedance ratio Z (j).
- the detection signal output unit 191 determines whether j ⁇ M (step S106).
- the constant M (M is a positive integer of M ⁇ 2) is a constant set in advance as the number of data used by the detection signal output unit 191 to determine whether or not the liquid is dripped onto the fiber sheet 200. is there.
- the storage unit 180 stores at least the latest M (Z (j ⁇ M + 1) to Z (j)) among the impedance ratios calculated by the detection signal output unit 191 in step S105.
- the storage unit 180 may store all the impedance ratios calculated by the detection signal output unit 191 in step S105 (Z (1) to Z (j)).
- step S106 NO
- step S106 determines whether or not all the latest M impedance ratios obtained in step S106 are equal to or less than the liquid detection threshold (step S106).
- step S107 the detection signal output unit 191 determines whether or not Z (j ⁇ M + 1) ⁇ the liquid detection determination threshold value, and Z (j) ⁇ the liquid detection determination threshold value (step S107).
- the detection signal output unit 191 performs blood determination processing (step S111).
- the blood determination process is a process for determining whether or not the liquid dripping on the fiber sheet 200 is blood.
- FIG. 16 is a flowchart illustrating a procedure in which the detection signal output unit 191 performs blood determination processing.
- the detection signal output unit 191 performs the process of FIG. 16 in step S111 of FIG.
- the detection signal output unit 191 determines whether or not the latest impedance ratio Z (j) obtained in step S105 of FIG. 15 is greater than or equal to a predetermined impedance ratio threshold (step S201).
- the detection signal output unit 191 determines the most recent M impedance ratios Z (step S105 in FIG. 15).
- An average value Z (j) div_mean of time differentiation is calculated from j ⁇ M + 1) to Z (j) (step S211).
- the detection signal output unit 191 uses the difference obtained by subtracting the impedance ratio Z (j ⁇ M + 1) from the impedance ratio Z (j ⁇ M + 2) as the time interval (sampling period) for impedance measurement in step S102 in FIG. To calculate the time derivative of the impedance ratio Z (j ⁇ M + 1).
- the detection signal output unit 191 divides the difference obtained by subtracting the impedance ratio Z (j ⁇ M + k) from the impedance ratio Z (j ⁇ M + k + 1) by the time interval of the impedance measurement in step S102 of FIG.
- the process of calculating the time derivative of the impedance ratio Z (j ⁇ M + k) is performed for all positive integers k satisfying 1 ⁇ k ⁇ M ⁇ 1.
- the detection signal output unit 191 calculates an average value of all obtained time derivatives (time derivative of impedance ratio Z (j ⁇ M + 1) to time derivative of impedance ratio Z (j ⁇ 1)) to An average value Z (j) div_mean of the differentiation is used.
- the detection signal output unit 191 determines whether or not the time differential Z (j) div_mean of the impedance ratio obtained in step S211 is equal to or greater than a predetermined time differential threshold (step S212). When it is determined that the time differential Z (j) div_mean of the impedance ratio is equal to or greater than the time differential threshold (step S212: YES), the detection signal output unit 191 determines that the liquid dripping on the fiber sheet 200 is blood ( Step S221). After step S221, the process of FIG. 16 is terminated, and the process returns to the process of FIG.
- step S221 when it is determined in step S221 that the time ratio Z (j) div_mean of the impedance ratio is less than the time differentiation threshold (step S212: NO), the detection signal output unit 191 indicates that the liquid dripping on the fiber sheet 200 is It is determined that the liquid is other than blood (step S231). After step S231, the process of FIG. 16 is terminated, and the process returns to the process of FIG. On the other hand, when it determines with impedance ratio Z (j) being less than an impedance ratio threshold value by step S201 (step S201: NO), it changes to step S231.
- the detection signal output unit 191 performs a conditional branch based on the determination result in step S111 (step S112). Specifically, the detection signal output unit 191 performs conditional branching based on whether or not it is determined that the liquid dripping on the fiber sheet 200 is blood. If it is determined that the liquid dripping on the fiber sheet 200 is blood (step S112: YES), the alarm output unit 130 outputs a blood leak detection alarm (step S121).
- the blood leak detection alarm here is an alarm indicating that blood has dropped on the fiber sheet 200.
- step S ⁇ b> 121 the detection signal output unit 191 outputs a detection signal indicating that blood has dropped on the fiber sheet 200 to the alarm output unit 130. Then, the alarm output unit 130 outputs a blood leak detection alarm according to the detection signal from the detection signal output unit 191.
- the alarm output unit 130 outputs a liquid detection preliminary alarm (step S131).
- the liquid detection preliminary alarm referred to here is an alarm indicating that liquid other than blood drips on the fiber sheet 200.
- the detection signal output unit 191 outputs a detection signal indicating that a liquid other than blood has dripped onto the fiber sheet 200 to the alarm output unit 130.
- the alarm output unit 130 outputs a liquid detection preliminary alarm according to the detection signal from the detection signal output unit 191.
- the detection apparatus 100 may repeatedly perform the process of FIG. Thereby, the detection apparatus 100 can detect that the blood has dripped when the liquid has dripped on the fiber sheet 200 after detecting that the liquid other than blood has dripped on the fiber sheet 200.
- the detection device 100 or a person may distinguish between blood and a liquid other than blood using a Cole-Cole locus.
- a Cole-Cole locus instead of the process in which the detection signal output unit 191 determines whether the liquid dripping on the fiber sheet 200 is blood in step S201 of FIG. 16 by comparing the average value of the impedance ratio with a threshold value, Cole The determination may be performed using a Cole locus. Processing for distinguishing blood and liquid other than blood using the Cole-Cole locus will be described with reference to FIGS. In the description of FIG. 17 and the description of FIG. 18, the impedance is represented by a complex number including resistance in the real part and reactance in the imaginary part.
- FIG. 17 is an explanatory diagram showing an example of a Cole-Cole locus obtained by impedance measurement.
- the horizontal axis of the graph shown in the figure represents the real part of the impedance, and the vertical axis represents the imaginary part of the impedance.
- a standardized impedance value (a value obtained by dividing the impedance value by a predetermined size (real number)) is used.
- the Cole-Cole locus may be obtained based on the impedance value itself without standardizing the impedance value.
- a line L81 in the figure shows the measured impedance value as a vector.
- the angle ⁇ indicates the phase difference between the input signal and the impedance measurement value.
- the measured impedance value can be plotted on the graph.
- a line L82 indicates a Cole-Cole locus.
- the Cole-Cole locus has a shape of a part of an arc. The Cole-Cole locus is obtained from the impedance measurement value.
- a Cole-Cole locus is obtained by approximating with a part (performing curve fitting).
- a method for performing curve fitting for example, a known approximation method such as a least square method can be used.
- the AC signal output unit 110 inputs at least three AC signals having different frequencies between the first conductor 210 and the second conductor 220, and the frequency characteristic acquisition unit 120 The frequency characteristic between the one conductor 210 and the second conductor 220 is acquired for each input AC signal.
- the point P11 indicates the center of an arc indicating the Cole-Cole locus (the center of a circle including the arc as a part of the circumference).
- Points P12 and P13 are intersections of the Cole-Cole locus and the horizontal axis, respectively. Of the two intersections, the point with the smaller real part of the impedance is designated as point P12, and the part with the larger real part of the impedance is designated as point P13.
- a point P14 is a midpoint of an arc indicating the Cole-Cole locus. Therefore, the line segment connecting the points P11 and P14 (line L84) is the angle formed by the line segment connecting the points P11 and P12 (line L83) and the line segment connecting the points P11 and P13. Is divided into two equal parts.
- the angle ⁇ / 2 is an angle formed by a line segment connecting the point P12 and the point P11 (line L83) and the horizontal axis.
- the Cole-Cole trajectory is expressed as in Equation (1)
- Z (f) represents the impedance when a signal of frequency f is input.
- R ⁇ represents resistance (real part of impedance) when a signal having an infinite frequency is input. Since it is impossible to actually measure the R ⁇ , Cole-Cole intersection of the trajectory with the horizontal axis (the two certain intersections, Resistance smaller) read from. In the example of FIG. 17, the resistance indicated by the point P12, used as R ⁇ .
- R 0 represents resistance when a signal having a frequency of 0, that is, a DC signal is input. R 0 may be actually measured, or may be read from the intersection of the Cole-Cole locus and the horizontal axis (the larger of the two intersections, the resistance is greater). In the example of FIG.
- the resistance indicated by the point P13 can be used as R0 .
- f c denotes a center frequency corresponding to the point P14 (input frequency point P14 is obtained impedance values indicate).
- J represents an imaginary unit.
- ⁇ represents a coefficient of a value obtained by dividing the angle ⁇ / 2 described above by ⁇ / 2.
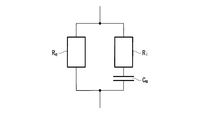
- FIG. 18 is an explanatory diagram showing an equivalent circuit model that simulates the impedance of a liquid having a film.
- R i denotes the resistance by the object with a film included in the liquid.
- C m represents the capacitance due to an object having a film contained in a liquid.
- the capacitance here can be regarded as the reactance in FIG. R e represents a resistance by an object other than an object having a film included in the liquid.
- plasma corresponds to an object other than an object having a membrane.
- the equivalent circuit model here is an electric circuit having an impedance that is equal to or approximately equal to the impedance of the modeling target (here, the liquid having a film).
- One or more of an electric resistance (resistor), a capacitor (capacitor), and a coil (reactor) are used as elements constituting the equivalent circuit.
- the equivalent circuit model shown in FIG. 18 the electrical resistance of the resistance R i, the capacitor capacitance C m, and are configured using the electrical resistance of the resistance R e.
- the resistance, capacitance, or impedance of the elements constituting the equivalent circuit model is referred to as a circuit parameter.
- a circuit parameter For example, in the equivalent circuit model shown in FIG. 18, resistance R i, a capacitance C m, each of resistance R e corresponds to the circuit parameters.
- the detection signal output unit 191 or the person calculates a circuit parameter value (circuit parameter value) in which the impedance of the equivalent circuit model is equal to or substantially equal to the impedance measurement value to be modeled.
- FIG. 18 shows an example of an equivalent circuit model, and the same method can be applied to an equivalent circuit model having a more complicated structure.
- the detection signal output unit 191 or a person may use a two dispersion model or a three dispersion model.
- the one-dispersion model here is a model constituted by an electric circuit in which one series connection of an electric resistance and a capacitor (or coil) and an electric resistance are connected in parallel.
- the two-dispersion model is a model configured by an electric circuit in which two series connections of an electric resistance and a capacitor (or a coil) and an electric resistance are connected in parallel.
- the 3-dispersion model is a model configured by an electric circuit in which three series connections of an electric resistance and a capacitor (or a coil) and an electric resistance are connected in parallel.
- the red blood cells have a single membrane structure, and therefore the impedance of the modeling target can be simulated using a single dispersion model.
- the modeled object is an animal cell
- the animal cell has a double membrane structure because it has a nucleus in the cell membrane.
- the impedance of the modeling target can be simulated using a two-dispersion model.
- the impedance can be simulated using a three-dispersion model.
- Detection signal output unit 191 or the person on the basis of the Cole-Cole trajectory obtained from impedance measurements determine the value of the model parameters (the value of resistance R i, a capacitance C m and resistance R e).
- resistance R 0 determined from Cole-Cole trajectory, using the resistance R ⁇ and center frequency f c can be obtained the value of resistance R i, a capacitance C m and resistance R e, as follows .
- the resistance Re is obtained as shown in Equation (2).
- Formula (4) is obtained by substituting Formula (2) into Formula (3).
- the center frequency f c is shown as Equation (5).
- Equation (5) can be transformed to obtain Equation (6).
- the detection signal output unit 191 or the person calculates the impedance R e , impedance R i , and capacitance C m using equations (1), (3), and (6), respectively.
- the values of the resistance R i , the capacitance C m , and the resistance R e vary depending on the film and the tissue structure contained in the liquid. Therefore, the type of liquid can be estimated from these values.
- the detection signal output unit 191 or the person compares the capacitance C m with a predetermined threshold value (blood detection threshold value), so that the liquid dripping on the fiber sheet 200 (the liquid to be measured) is blood. It is determined whether or not.
- the detection signal output unit 191 or a human If the capacitance C m is greater than the threshold value for detecting blood, the detection signal output unit 191 or a human, the liquid dripping into the fiber sheet 200 is determined to be blood. On the other hand, it is determined that if the capacitance C m is equal to or smaller than the threshold value for detecting blood, the detection signal output unit 191 or a human, the liquid dripping into the fiber sheet 200 is a liquid other than blood.
- the detection signal output unit 191 or a person may obtain the values of all model parameters included in the equivalent circuit model, or may obtain only the values of some model parameters. For example, in the example of FIG. 18, the detection signal output unit 191 or a person calculates impedance R e , impedance R i , and capacitance C m , compares each value with a threshold value, and hangs on the fiber sheet 200. It may be determined whether or not the liquid is blood.
- the detection signal output unit 191 or a person calculates only the capacitance C m among the impedance R e , the impedance R i , and the capacitance C m , and compares the capacitance C m with the threshold value as described above, and the fiber It may be determined whether the liquid dripping on the sheet 200 is blood.
- a pulse signal or a step signal may be input between conductors.
- impedance measurement values for different input frequencies can be obtained by Fourier transforming the impedance measurement values. Accordingly, the time required for inputting a signal between the conductors can be shortened compared with the case where an AC signal is input between the conductors while changing the frequency.
- a signal obtained by superimposing three or more sine waves having different frequencies may be input between the conductors.
- impedance measurement values for different input frequencies can be obtained by Fourier transforming the impedance measurement values. Accordingly, the time required for inputting a signal between the conductors can be shortened compared with the case where an AC signal is input between the conductors while changing the frequency.
- the AC signal output unit 110 executes the AC signal input step of inputting at least three AC signals having different frequencies between the plurality of conductors provided on the fiber sheet.
- a person may connect an AC signal output device (AC power supply) whose frequency is variable between a plurality of conductors to execute the AC signal input step.
- the frequency characteristic acquisition part 120 performs the impedance measurement value acquisition step which acquires the impedance measurement value between conductors for every alternating current signal input at the alternating current signal input step.
- a person may perform the impedance measurement value acquisition step using an impedance measurement device (for example, an oscilloscope).
- the detection signal output unit 191 executes a Cole-Cole locus acquisition step for obtaining a Cole-Cole locus that approximates the impedance measurement value obtained in the impedance measurement value acquisition step with a part of an arc.
- a person may execute the Cole-Cole locus acquisition step.
- the detection signal output unit 191 executes a capacitance acquisition step of obtaining the capacitance in a predetermined equivalent circuit model that simulates the impedance of the liquid having the film based on the Cole-Cole locus.
- a person may perform the capacitance acquisition step.
- the detection signal output part 191 performs the liquid kind estimation step which estimates the kind of liquid based on the acquired capacitance.
- a person may perform the liquid type estimation step. Thereby, the detection signal output unit 191 or the person can determine with high accuracy whether blood has dripped on the fiber sheet 200. Note that when the detection signal output unit 191 determines in the liquid type estimation step that blood has dropped on the fiber sheet 200, the alarm output unit 130 may output a blood leak detection alarm.
- the detection signal output unit 191 or a person may determine whether the liquid dripping on the fiber sheet 200 is a predetermined liquid other than blood. For example, if the milk is hanging in the fiber sheet 200, the capacitance C m is smaller than that of blood. Therefore, the detection signal output unit 191 or the person, in addition to comparing the blood detection threshold value and the capacitance C m , has a threshold value that is smaller than the blood detection threshold value set in advance as the milk detection threshold value. Compare the capacitance C m . When the capacitance C m is larger than the milk detection threshold and not more than the blood detection threshold, the detection signal output unit 191 or the person determines that the liquid dripping on the fiber sheet 200 is milk.
- the AC signal output unit 110 inputs a plurality of AC signals having different frequencies between the conductors (between the first conductor 210 and the second conductor 220), and the frequency characteristic acquisition unit 120 acquires the signals.
- the frequency characteristic obtained shows a predetermined difference according to the difference in the frequency of the AC signal from the AC signal output unit 110, and the AC signal output unit 110 inputs the AC signal multiple times between the conductors, and the frequency characteristic acquisition unit
- the detection signal output unit 191 outputs a detection signal (blood leakage detection alarm).
- the detection signal output unit 191 is used for both a difference in frequency characteristics between conductors due to a difference in frequency of an AC signal input between conductors, and a specific change in frequency between conductors over time. Based on this, by determining whether or not to output a detection signal, it is possible to determine with high accuracy whether or not the liquid dripping on the fiber sheet is a predetermined liquid (for example, blood), and erroneously output the detection signal The possibility of being reduced can be reduced.
- a predetermined liquid for example, blood
- the detection signal output unit 191 or a person obtains a Cole-Cole locus that approximates an impedance measurement value between conductors (between the first conductor 210 and the second conductor 220) with a part of an arc. Then, the detection signal output unit 191 or the person obtains the capacitance in a predetermined equivalent circuit model that simulates the impedance of the liquid having the film based on the Cole-Cole locus, and estimates the type of the liquid from the obtained capacitance.
- the detection signal output unit 191 or the person can determine whether the liquid dripping on the fiber sheet 200 is a predetermined liquid (for example, blood). The determination of whether or not can be performed with high accuracy.
- the detection device 100 or a person may distinguish between blood and a liquid other than blood based on the slope of a straight line that approximates the relationship between the frequency of the input signal and the impedance measurement value. For example, instead of the process in which the detection signal output unit 191 determines whether or not the liquid dripping on the fiber sheet 200 is blood in step S201 of FIG. 16 by comparing the average value of the impedance ratio and the threshold value, Based on the slope of the straight line, blood and liquid other than blood may be distinguished. A process for distinguishing between blood and a liquid other than blood based on the inclination of the straight line will be described with reference to FIG.
- FIG. 19 is an explanatory diagram showing an example of a straight line that approximates the relationship between the frequency of the input signal and the impedance measurement value in a certain frequency band.
- the horizontal axis of the graph shown in the figure represents the frequency of the input signal (input frequency), and the vertical axis represents the impedance (impedance magnitude).
- Line L91 shows an example of a straight line that approximates the relationship between the frequency of the input signal for blood and the impedance measurement value.
- points P911, P912, P913, and P914 indicate the relationship between the input frequency and the impedance at that frequency when an AC signal is input to the blood, respectively.
- a line L91 is a line obtained by linearly approximating the points P911, P912, P913, and P914.
- the line L92 shows an example of a straight line that approximates the relationship between the frequency of the input signal with respect to the saline solution and the impedance measurement value.
- points P921, P922, P923, and P924 indicate the relationship between the input frequency and the impedance at that frequency when an AC signal is input to the saline solution, respectively.
- a line L92 is a line obtained by linearly approximating the points P921, P922, P923, and P924.
- the slope of the approximate straight line has a negative value. That is, blood shows a smaller impedance as the input frequency is higher, so that the approximate straight line in the case of blood becomes lower right.
- the magnitude of the inclination of the approximate straight line is smaller than that in the case of blood. That is, in the case of saline, the magnitude of the change in impedance with respect to the change in input frequency is small, so that the approximate straight line in the case of saline is closer to the horizontal (parallel to the horizontal axis) than in the case of blood.
- the detection device 100 or a person distinguishes blood and liquid other than blood based on the slope of a straight line that approximates the relationship between the frequency of the input signal and the impedance measurement value.
- the storage unit 180 of the detection apparatus 100 stores in advance a threshold value of the slope of the approximate line as a negative real constant.
- the detection signal output part 191 of the detection apparatus 100 calculates
- a method of linear approximation for example, the least square method can be used, but is not limited thereto.
- the approximation formula is not limited to a linear function, and a curve approximation using a multi-order function, an exponential function, a logarithmic function, a logistic curve, or the like may be used. Then, the detection signal output unit 191 compares the obtained inclination with a threshold value, and determines that blood is detected when the inclination is smaller than the threshold value (that is, when the magnitude of the inclination is larger than the threshold value). To do. On the other hand, when the inclination is equal to or larger than the threshold value (that is, when the magnitude of the inclination is equal to or smaller than the threshold value), the detection signal output unit 191 determines that blood is not detected.
- the storage unit 180 stores the threshold value as ⁇ 0.000001 ( ⁇ 1 ⁇ 10 ⁇ 6 ).
- the detection signal output unit 191 outputs a detection signal indicating that blood has been detected. That is, the detection signal output unit 191 determines that blood has been detected.
- the detection signal output unit 191 suppresses the output of the detection signal. That is, the detection signal output unit 191 determines that blood is not detected.
- the detection signal output unit 191 obtains a slope of a straight line that approximates the relationship between the frequency of the input signal and the impedance measurement value, and compares the obtained slope with the threshold value in a relatively simple process. It can be determined whether or not a predetermined liquid is detected. In this respect, the load on the detection signal output unit 191 can be reduced. Furthermore, in steps S211 to S212 in FIG. 16, detection determination of blood or the like may be performed using a time change such as an approximate straight line or an inclination of an approximate curve.
- the structure will be described.
- the bandage-shaped fiber sheet 200 is used by being wrapped around a site for monitoring blood leakage such as an arm punctured with a needle during artificial dialysis, for example.
- the fiber sheet 200 can be cut to an arbitrary length, and by connecting the two conductive yarns 231 and 233 to one of the ends of the conductive yarns 231 and 233, respectively, to the AC signal output unit 110, It can be set as the structure of FIG.
- the detection apparatus 100 can detect blood leakage as described above.
- the fiber sheet 200 is configured such that the sensor fiber 230 meanders and is knitted (sewn) in a wavy manner to an insulating fiber sheet main body 201 having water absorption.
- the detection apparatus 100 can detect blood leakage as described above.
- the detection device 100 can detect liquid penetration such as blood leakage in various portions of the fiber sheet 200.
- the fiber sheet 200 can be configured.
- the two conductors can be arranged at a relatively narrow interval, and the detection accuracy of the detection signal output unit 191 can be increased when the liquid soaks into the fiber sheet 200.
- the fiber sheet 200 is easier than the case where the two conductors (the conductive threads 231 and 233) are knitted or sewn into a bandage or a fiber sheet or the like so as not to contact each other and at a relatively narrow interval. Can be generated. Thereby, the manufacturing cost of the fiber sheet 200 can be reduced.
- the fiber sheet 200 in which the sensor fiber 230 is knitted can be manufactured in the following three patterns.
- the fiber sheet 200 (bandage) of the pattern A has (1) warp, (2) elastic yarn, (3) weft, and (4) sensor fiber as constituent elements.
- a method for manufacturing the pattern A fiber sheet 200 will be described. First, we made stitches using elastic yarn (for example, covering yarn with polyurethane as a core material) as warp, and wefted weft while inserting elastic yarn (for example, covering yarn with polyurethane as core material) A thing is made into the fiber sheet main body 201 (elastic bandage) used as a base fabric. Sensor fibers are inserted and knitted into the fiber sheet main body 201 to obtain a pattern A fiber sheet 200.
- elastic yarn for example, covering yarn with polyurethane as a core material
- elastic yarn for example, covering yarn with polyurethane as core material
- the fiber sheet 200 of the pattern B has (1) warp, (2) elastic yarn, (3) weft, and (4) sensor fiber as constituent elements.
- the fiber sheet 200 of the pattern B has the same configuration as the fiber sheet 200 of the pattern B except that non-stretchable yarn is used as the warp.
- the fiber sheet 200 of the pattern C has (1) warp, (2) weft, and (3) sensor fiber as constituent elements. That is, the fiber sheet 200 of the pattern C is a fiber sheet 200 that does not use elastic yarn.
- the manufacturing method of the fiber sheet 200 of the pattern C is demonstrated. First, a yarn having a stretchability (for example, a covering yarn having polyurethane as a core material) is used as a warp, and a weave knitted fabric is used as a fiber sheet body 201 serving as a base fabric. Sensor fibers are inserted and knitted into the fiber sheet main body 201 to obtain a pattern C fiber sheet 200.
- a yarn having a stretchability for example, a covering yarn having polyurethane as a core material
- a weave knitted fabric is used as a fiber sheet body 201 serving as a base fabric.
- Sensor fibers are inserted and knitted into the fiber sheet main body 201 to obtain a pattern C fiber sheet 200.
- FIG. 21 is a view showing a warp knitting structure of a bandage-like fiber sheet 200.
- the warp knitting method includes an open crochet shown in FIG. 21 (a), a close crochet shown in FIG. 21 (b), a closed tricot shown in FIG. Any of the open tricots shown in FIG. Moreover, you may combine these.
- the tricot knitting as shown in FIG. 21, not only the knitting needles adjacent to each other but also one stitch skipping or two stitch skipping may be used.
- N indicates a knitting needle.
- FIG. 21A to FIG. 21D show that the knitting process proceeds from the lower side in the longitudinal direction P to the upper side in time series.
- a line S1 indicates the carrying of the warp yarn on the knitting needle N.
- the open crochet shown in FIG. 21A and the close crochet shown in FIG. 21B are knitted with one knitting needle N in the left-right direction.
- the warp S1 is applied from the left to the right at the main shaft first rotation P1 shown at the bottom, and the warp from the right to the left at the second main shaft second rotation P2. S1 takes.
- the warp S1 is applied from the left to the right, and the carrying of the warp S1 is repeated thereafter.
- the closed tricot shown in FIG. 21C and the open tricot shown in FIG. 21D are knitted by two knitting needles N adjacent in the left-right direction.
- one warp S1 is repeatedly knitted on the left knitting needle N or the right knitting needle N.
- the warp S1 is applied to the left needle N from the left to the right at the first rotation of the main shaft, and the right adjacent needle at the second rotation of the main shaft. N warps S1 from right to left.
- the carrying of the warp S1 is repeated.
- a knitted string as shown in FIG. 21 (e) can be formed.
- the braided string By connecting the braided string with wefts, for example, it can be formed into an 80 mm wide bag.
- the elastic yarn S3 is knitted. As shown in FIG. 22, the elastic yarn S3 is knitted by alternately inserting one stitch per stitch with respect to the course direction (stretching direction indicated by the arrow C direction, longitudinal direction of the fiber sheet 200).
- the first insertion method of the weft S2 is that the weft S2 forming the fiber sheet main body 201 (base fabric, see FIG. 20) of the fiber sheet 200 reciprocates at both ends of the fiber sheet 200 for each stitch.
- This is a method of knitting the fiber sheet main body 201 by inserting it as described above. By adopting such a method, the fiber sheet main body 201 that becomes the base fabric of the bandage can be knitted more easily.
- the second insertion method of the weft S2 is the weft S2 forming the fiber sheet body 201 in the wale direction of the fiber sheet 200 (the non-stretch direction indicated by the arrow W direction, the width direction of the fiber sheet 200).
- the fiber sheet main body 201 is knitted by arranging them side by side.
- a third insertion method of the weft S2 will be described.
- the third method of inserting the weft S2 is to insert the weft S2 forming the fiber sheet main body 201 so as to change the way of swinging for each arbitrary stitch, so that the fiber sheet main body 201 serving as a base is inserted.
- a special base fabric such as a mesh M is knitted in an arbitrary portion.
- the fourth method of inserting the weft S2 is to insert the weft S2 forming the fiber sheet main body 201 so as to change the way of swinging for each arbitrary stitch, and to select an arbitrary portion of the fiber sheet main body 201.
- This is a method of knitting a special base fabric such as buttonhole BH.
- the sensor fiber 230 is knitted.
- a method for weaving the sensor fiber 230 for example, the following two methods can be employed.
- a first weaving method of the sensor fiber 230 will be described.
- the first weaving method of the sensor fiber 230 is to insert the sensor fiber 230 into the central portion of the fiber sheet 200 at an arbitrary length and an arbitrary period so as to have a waveform (sine curve shape). It is a method of letting you organize.
- the sensor fibers 230 can be arranged with good balance.
- positioning shape of the sensor fiber 230 is not restricted to an above-described waveform, For example, it is good also as a rectangular wave shape.
- the second weaving method of the sensor fiber 230 includes inserting the sensor fiber 230 into, for example, one end of the fiber sheet 200 to increase the width in the wale direction W at a specific portion.
- the cycle in the course direction C (the interval between the sensor fibers 230 adjacent to each other in the extending direction of the fiber sheet 200) is reduced. That is, the amplitude and period of the waveform of the sensor fiber 230 may be arbitrarily changed.
- a connector is used to connect the first conductive thread 231 (first conductor 210) and the second conductive thread 233 (second conductor 220) of the sensor fiber 230 to the detection device 100.
- first connector 60 the second connector 75, the third connector 90, and the fourth connector 95 will be described.
- the first connector 60 includes a casing 61, a substrate 62 disposed inside the casing 61, and a connection unit 63 that connects the sensor fiber 230 and the substrate 62.
- the substrate 62 is connected to the detection device 100 (see FIG. 1) via a cable or the like.
- the connection unit 63 includes a base portion 64, a sensor guide 66 placed on the base portion 64 via a compression coil spring 65, a pushing member 67 that pushes the sensor fiber 230 into the sensor guide 66, and a pushing member 67. And a lock lever 68 to be pushed into the sensor guide 66.
- the first connector 60 pushes the sensor fiber 230 into the concave groove 69 formed in the sensor guide 66, and the sensor fiber 230 and the substrate 62 via the terminals 70 and 71 arranged in the concave groove 69 of the sensor guide 66. And connect.
- the sensor guide 66 is a block-shaped member formed of plastic such as polyacetal resin.
- On the upper surface of the sensor guide 66 at least one concave groove 69 is formed.
- the concave groove 69 is an end face U-shaped groove extending in one direction, and is formed in a straight line.
- two concave grooves 69 of the present embodiment are provided on the upper surface of the sensor guide 66 and intersect each other.
- the sensor fiber 230 when the sensor fiber 230 is woven into a bandage as shown in FIG. 20 and the connector is sandwiched from the lateral direction of the bandage cross section, the sensor fiber 230 may be “right diagonally upward. This is because the sensor guide 69 can correspond to either direction with a single connector.
- the concave groove 69 has a size corresponding to the thickness of the sensor fiber 230.
- the width W ⁇ b> 2 in the direction orthogonal to the longitudinal direction of the concave groove 69 is slightly smaller than the diameter of the sensor fiber 230. That is, the concave groove 69 is formed so that the sensor fiber 230 is fixed in the concave groove 69 by pushing the sensor fiber 230 from above.
- the lower surface of the sensor guide 66 is disposed in parallel with the substrate 62.
- a plurality of terminals 70 and 71 protrude from the substrate 62 upward in the vertical direction.
- the plurality of terminals 70 and 71 are composed of at least one central conductor terminal 70 and at least one external conductor terminal 71.
- the terminals 70 and 71 are disposed so as to protrude from the lower side of the sensor guide 66 into the inner space of the concave groove 69 through a through hole formed in the sensor guide 66.
- the sensor guide 66 is supported by a compression coil spring 65, and the terminals 70 and 71 protrude from the inner peripheral surface of the concave groove 69 by pressing the sensor guide 66 from above.
- the center conductor terminal 70 is disposed at the center of the groove 69 in the width direction.
- the center conductor terminal 70 inserts the sensor fiber 230 into the groove 69 and presses the sensor guide 66 from above so that the center conductor terminal 70 pierces the vicinity of the center of the sensor fiber 230.
- the first conductive yarn 231 (see FIGS. 9 and 10) of the sensor fiber 230 and the detection device 100 are connected.
- Insulating paint I is applied to a part of the center conductor terminal 70 so that the center conductor terminal 70 and the second conductive thread 233 of the sensor fiber 230 are not electrically connected. .
- the outer conductor terminal 71 is disposed on the outer side in the width direction from the center in the width direction of the concave groove 69.
- the outer conductor terminal 71 inserts the sensor fiber 230 into the concave groove 69 and presses the sensor guide 66 from above, so that the outer conductor terminal 71 is positioned on the outer peripheral side from the center of the sensor fiber 230. It is arranged to stab. As a result, the second conductive thread 233 of the sensor fiber 230 and the detection device 100 are connected.
- the conductive yarn and the detection device 100 can be easily attached by simply fitting the sensor fiber 230 into the groove 69 of the sensor guide 66 without peeling off the coating of the sensor fiber 230. Can be connected.
- the configuration of the terminals 70 and 71 is not limited to the configuration shown in FIG.
- the length of the center conductor terminal 70 may be shortened.
- the first conductive yarn 231 and the second conductive yarn 233 have a structure that is not electrically connected, but a unique impedance value can be given between both electrodes during manufacturing. For this reason, in the unlikely event that the center conductor terminal 70 and the outer conductor terminal 71 are not in good contact with the respective conductive yarns, values other than the specific impedance value are displayed, so that a contact failure accident can be prevented in advance. . Similarly, when the center conductor terminal 70 and the outer conductor terminal 71 are in contact with each other due to a manufacturing defect or the like, an extremely low impedance value is displayed, so that a detection error can be prevented.
- the first connector is not limited to the structure described above, and can be simplified.
- the first connector 60B shown in FIG. 34 it may be configured to include only a block-shaped sensor guide 66B in which a concave groove 69B having a U-shaped cross section is formed and a lid member 72.
- the concave groove 69 ⁇ / b> B has a shape corresponding to the thickness of the sensor fiber 230, and terminals 70 and 71 for connecting the sensor fiber 230 and the substrate 62 are disposed.
- the lid member 72 is a member that pushes the sensor fiber 230 into the concave groove 69B and fixes it.
- a protrusion 73 is formed which is inserted into a guide hole 74 formed on the upper surface of the sensor guide 66B.
- the second connector 75 includes a base portion 76, a wire stripper portion 77 that is rotatably attached to the base portion 76, and a terminal portion 78 that is rotatably attached to the base portion 76. ,have.
- the wire stripper part 77 is a part having a so-called wire stripper function.
- the wire stripper portion 77 includes a wire stripper portion main body 82 that can rotate around a rotation shaft 81, and a first round hole blade 79.
- the first round hole blade 79 is a semicircular groove-like blade that cuts into a portion of the sensor fiber 230 excluding the conductive thread 231 in cooperation with the second round hole blade 80 fixed to the base portion 76. .
- the terminal portion 78 includes a terminal portion main body 83 that can rotate around a rotation shaft 81, a central conductor terminal 85 that is connected to the first conductive thread 231, and an external that is connected to the second conductive thread 233. It has a conductor terminal 86 and a roller 84 attached integrally with the rotation shaft 81.
- the center conductor terminal 85 and the external conductor terminal 86 are connected to the detection device 100 (see FIG. 1) via a cable or the like.
- the external conductor terminal 86 is composed of a plurality of needles. By pressing the external conductor terminal 86 from the outer peripheral surface of the sensor fiber 230, the external conductor terminal 86 is connected to the second conductive thread 233.
- the roller 84 has a cylindrical shape and a plurality of fine irregularities are formed on the outer peripheral surface (knurling). The roller 84 is eccentrically attached to the rotation shaft 81. The terminal portion 78 is changed from the upright state shown in FIG. 35 to the tilted state shown in FIG.
- the sensor fiber 230 and the detection device 100 are connected using the second connector 75, first, the sensor fiber 230 is disposed in the fixing groove 87 of the base portion 76 as shown in FIG. As a result, the second round hole blade 80 is cut into a portion of the sensor fiber 230 excluding the first conductive thread 231.
- the wire stripper part 77 is tilted to make other cuts so as to leave the first conductive yarn 231 of the sensor fiber 230.
- the sensor fiber 230 is fixed by the wire stripper main body 82 by the wire stripper 77 being tilted down.
- the covering of the sensor fiber 230 can be peeled off by operating the wire stripper 77, and the conductive yarn and the detection device 100 can be easily connected.
- a mechanism equivalent to the roller 84 may be incorporated in the base portion 76 in order to make the coating easier to peel off.
- the third connector 90 includes a casing 91, a center conductor terminal 92 fixed to the casing 91, and an external conductor terminal 93.
- the center conductor terminal 92 and the external conductor terminal 93 are connected to the detection device 100 (see FIG. 1).
- the casing 91 has a box shape, and is formed with a wire receiving groove 94 extending in a U shape when viewed from above.
- the wire receiving groove 94 includes a first straight line portion 94a in which the center conductor terminal 92 is accommodated, a second straight line portion 94b in which the external conductor terminal 93 is accommodated, a first straight line portion 94a, and a first straight line portion 94a. It has a curved portion 94c that smoothly connects the two straight portions 94b.
- channel 94 does not need to be U shape seeing from upper direction, when it considers from a user's convenience, it is preferable that it is U shape.
- the center conductor terminal 92 is composed of a pair of terminals arranged so as to gradually approach one direction in the extending direction of the first straight portion 94a.
- the tip portions of the pair of terminals are in contact with each other, but the first conductive thread 231 can be sandwiched between the pair of terminals.
- the external conductor terminal 93 is also composed of a pair of terminals arranged so as to gradually approach one direction in the extending direction of the second linear portion 94b.
- the pair of terminals are arranged such that the distance between the tip portions of the pair of terminals is slightly smaller than the diameter of the sensor fiber 230.
- the first conductive yarn 231 and the second conductive yarn 233 are exposed to the wire receiving groove 94 with a wire stripper or a nipper.
- the first conductive thread 231 is connected to the center conductor terminal 92 and the second conductive thread 233 is connected to the outer conductor terminal 93 by accommodating the sensor fiber 230 in the wire accommodation groove 94. .
- the third connector 90 it is possible to connect the conductive yarn and the detection device 100 only by peeling off the covering of the sensor fiber 230.
- the fourth connector 95 is a connector using a general coaxial connector.
- the fourth connector 95 includes a female connector 96, a male connector 97 connected to the female connector 96, and a fixing folder 98 for fixing the male connector 97 to the fiber sheet 200.
- the female connector 96 has a plurality of terminals (not shown), and these terminals are connected to the detection device 100.
- the male connector 97 and the female connector 96 are coaxial cable connectors formed of resin.
- the user can perform terminal processing of the sensor fiber 230, connect the sensor fiber 230 to the male connector 97, and fix the male connector 97 to the fiber sheet 200 using the fixing folder 98. Then, by connecting the female connector 96 to the male connector 97, the conductive threads 231 and 233 and the detection device 100 can be connected.
- the price of the fiber sheet 200 which is a consumable, is increased, although the price of the connector becomes expensive. Can be suppressed.
- FIG. 43 is an explanatory view showing another first example of the arrangement of the first conductor 210 and the second conductor 220 on the fiber sheet 202.
- the first conductors 210 and the second conductors 220 are alternately arranged.
- the first conductor 210 and the second conductor 220 may be arranged with a certain width.
- FIG. 44 is an explanatory diagram showing another second example of the arrangement of the first conductor 210 and the second conductor 220. As in the example of FIG. 43, the first conductor 210 and the second conductor 220 are alternately arranged in the example of FIG. However, in the example of FIG. 44, the widths of the first conductor 210 and the second conductor 220 are thicker than in the case of FIG. Thereby, the space
- the detection device 100 can easily detect blood dripping.
- FIG. 45 is an explanatory view showing another third example of the arrangement of the first conductor 210 and the second conductor 220.
- the fiber sheet 202 has a three-layer structure in which a sheet 242 is sandwiched between a sheet 241 including the first conductor 210 and a sheet 243 including the second conductor 220.
- the first conductor 210 and the second conductor 220 may be arranged in different directions, or may be arranged in the same direction.
- the main body of the sheet 241, the main body of the sheet 243, and the sheet 242 are all insulating sheets having water absorption. By sandwiching the sheet 242, the first conductor 210 and the second conductor 220 are not in contact with each other. Further, when the sheet 242 absorbs moisture such as blood, impedance characteristics between the first conductor 210 and the second conductor 220 change. Thereby, the detection signal output unit 191 can detect leakage of blood into the fiber sheet 202.
- each line may constitute an independent channel.
- FIG. 46 is an explanatory diagram showing another fourth example of the arrangement of the first conductor 210 and the second conductor 220.
- the fiber sheet 202 is configured in a three-layer structure in which a sheet 252 is sandwiched between a sheet 251 including the first conductor 210 and a sheet 253 including the second conductor 220. Further, the first conductor 210 and the second conductor 220 are arranged in different directions. Further, the main body of the sheet 251, the main body of the sheet 253, and the sheet 252 are all insulating sheets having water absorption. Since the sheet 252 is sandwiched, the first conductor 210 and the second conductor 220 are not in contact with each other.
- each line of the first conductor 210 is not electrically connected, and each line constitutes channel 1 to channel 4. Further, each line of the second conductor 220 is not electrically connected, and each line constitutes channel 5 to channel 8.
- each channel of the first conductor 210 and each channel of the second conductor 220 are arranged orthogonal to each other. However, since the sheet 252 is sandwiched, each channel of the first conductor 210 and each channel of the second conductor 220 are not in contact with each other. When the liquid soaks into a part of the sheet 252, the frequency characteristics of the first conductor 210 and the second conductor 220 change in the channel corresponding to the soaked position. Thereby, the detection signal output unit 191 can detect the leaching position in addition to the presence or absence of the liquid leaching.
- the fiber sheet 202 is used as a carpet, and equipment is installed in each of the regions A11, A12, and A13 on the fiber sheet 202.
- the frequency characteristic between the channel 2 and the channel 5 changes, it is possible to detect the necessity of protecting the equipment installed in the region A11 from a failure due to liquid adhesion.
- the frequency characteristics between the channel 3 and the channel 7 change, it is necessary to protect the device installed in the region A12 and the device installed in the region A13 from a failure due to liquid adhesion. Can be detected.
- the detection system 1 can be applied not only to detection of the needle removal but also to detection of various liquids that change the frequency characteristics between the first conductor 210 and the second conductor 220.
- the position where the liquid is soaked into the fiber sheet 202 can be detected even if a direct current is applied to the channel instead of the alternating current signal.
- the presence or absence of liquid permeation into the region A11 can be determined by measuring the voltages of the channel 5 and the channel 6 in a state where a direct current is applied to the channel 1 and the channel 2.
- the conductivity of the liquid shows a sufficiently large value with respect to the conductivity of the air, and a measured value of a predetermined magnitude or less is obtained for the potential difference between the channel 5 and the channel 6, the liquid is present in the region A11.
- Judged to have soaked when the conductivity of the liquid shows a sufficiently large value with respect to the conductivity of the air, and a measured value of a predetermined magnitude or less is obtained for the potential difference between the channel 5 and the channel 6, the liquid is present in the region A11. Judged to have soaked.
- FIG. 48 is an explanatory diagram showing a first example of the arrangement of yarns combined so that two conductors do not contact each other.
- the bandage 261 (fiber sheet) is configured to include a thread 262 knitted vertically in the center of the bandage 261 itself.
- the thread 262 includes two conductors combined so as not to contact each other.
- the bandage 261 corresponds to the example of the fiber sheet 200, and the two conductors included in the thread 262 correspond to the example of the first conductor 210 and the second conductor 220.
- yarn is not restricted to what is shown by the example of FIG. 9 and FIG.
- the conductive yarn 233 is wrapped around the conductive yarn 231 covered with the insulating cotton 232, and these are wound around the insulating cotton 236B (third insulating portion).
- the sensor fiber 230 shown in FIG. 9 may be further covered with insulating cotton 236B shown in FIG.
- the insulating cotton 236 may be knitted together with insulating cotton 232. That is, the loop 239 may be formed on the outer surface of the insulating cotton 232 so that the conductive yarn 233 and the insulating cotton 236 pass through the loop 239.
- FIG. 51 is an explanatory diagram showing another example of the arrangement of two conductors included in one thread.
- the yarn 280 includes two conductive yarns 281 and 282 twisted so as not to contact each other.
- the conductive yarns 281 and 282 are covered with a stretchable material such as rubber, and are twisted into the arrangement as shown in FIG.
- the conductive yarns 281 and 282 can be disposed at a relatively narrow interval, and the yarn 280 can be stretched.
- Each of the conductive yarn 281 and the conductive yarn 282 may be covered with insulating cotton, or as shown in FIG. 51, the twisted conductive yarn 281 and conductive yarn 282 are covered with insulating cotton 236C. May be.
- a shield layer made of conductive yarn covered with an insulating material having water absorption (for example, insulating cotton) is provided on the outer peripheral side thereof.
- a conductive yarn covered with insulating cotton is further wound or knitted around the outer peripheral side of the conductive yarn 233 having the form shown in FIG. 49 or the outer peripheral side of the insulating cotton 236B.
- the yarn may be grounded.
- FIG. 52 is an explanatory view showing still another example of the arrangement of two conductors included in one thread.
- FIG. 53 is an explanatory diagram showing an arrangement example of two conductors in the cross section of the yarn illustrated in FIG. 52 and 53, two conductive yarns 281 and 282 are arranged in parallel, and these two conductive yarns are covered with a water-absorbing insulating material such as insulating cotton 232. It has a structure. With this structure, there is no need to twist the conductive yarns, and in this respect yarns can be produced relatively easily.
- the conductive yarn covered with insulating cotton may be further wound or knitted around the outer peripheral side of the insulating cotton 232, and the conductive yarn may be grounded.
- the frequency characteristic acquisition unit 120 acquires frequency characteristics when an AC signal is input to at least two conductors provided on the fiber sheet.
- the detection signal output unit 191 outputs a detection signal when the frequency characteristic acquisition unit 120 acquires a predetermined frequency characteristic.
- the detection apparatus 100 can detect adhesion of a specific liquid by distinguishing it from other liquids based on the difference in frequency characteristics.
- a fiber sheet provided with at least two conductors (first conductor 210 and second conductor 220) can be used.
- the fiber sheet for example, a fiber sheet in which a plurality of conductive yarns are knitted can be used, and the fiber sheet structure can be simplified. Thereby, the manufacturing cost of a fiber sheet can be reduced and the said fiber sheet (part to which a liquid adheres) can be made disposable.
- the frequency characteristic acquisition unit 120 obtains frequency characteristics when the AC signal of the first frequency and the AC signal of the second frequency are input to at least two conductors (the first conductor 210 and the second conductor 220). get.
- the detection signal output unit 191 has a predetermined difference between a frequency characteristic when an AC signal of the first frequency is input to the conductor and a frequency characteristic when an AC signal of the second frequency is input to the conductor. If it is, a detection signal is output.
- sweat and blood have different frequency characteristic change ratios with respect to frequency changes. For this reason, the detection signal output unit 191 can detect blood separately from sweat based on the difference in frequency characteristics at a plurality of frequencies, and can reduce false detection of needle removal.
- the detection signal output unit 191 can detect a specific liquid and another liquid based on the difference in frequency characteristics at a plurality of frequencies.
- the fiber sheet 200 also includes conductive yarns 231 and 233 (yarn 262 or yarn 280) including at least two conductors 210 and 220 that are combined so as not to contact each other. Thereby, the two conductors 210 and 220 can be arranged at a relatively narrow interval, and the detection accuracy of the detection signal output unit 191 can be increased when the liquid soaks into the fiber sheet 200.
- a program for realizing the function of the detection signal output unit 191 is recorded on a computer-readable recording medium, and the program recorded on the recording medium is read into a computer system and executed to execute the processing of each unit.
- the “computer system” includes an OS and hardware such as peripheral devices.
- the “computer system” includes a homepage providing environment (or display environment) if a WWW system is used.
- the “computer-readable recording medium” refers to a storage device such as a flexible medium, a magneto-optical disk, a portable medium such as a ROM or a CD-ROM, and a hard disk incorporated in a computer system.
- the “computer-readable recording medium” dynamically holds a program for a short time like a communication line when transmitting a program via a network such as the Internet or a communication line such as a telephone line.
- a volatile memory in a computer system serving as a server or a client in that case and a program that holds a program for a certain period of time are also included.
- the program may be a program for realizing a part of the functions described above, and may be a program capable of realizing the functions described above in combination with a program already recorded in a computer system.
- the detection system the fiber sheet, the connector, the detection device, and the liquid type estimation method, it is possible to accurately determine whether or not the liquid dripping on the fiber sheet is a predetermined liquid (for example, blood). The possibility of erroneously outputting a signal can be reduced.
- a predetermined liquid for example, blood
Landscapes
- Health & Medical Sciences (AREA)
- Engineering & Computer Science (AREA)
- Life Sciences & Earth Sciences (AREA)
- Chemical & Material Sciences (AREA)
- Physics & Mathematics (AREA)
- Biomedical Technology (AREA)
- General Health & Medical Sciences (AREA)
- Pathology (AREA)
- Biochemistry (AREA)
- Biophysics (AREA)
- Immunology (AREA)
- General Physics & Mathematics (AREA)
- Analytical Chemistry (AREA)
- Heart & Thoracic Surgery (AREA)
- Textile Engineering (AREA)
- Mechanical Engineering (AREA)
- Hematology (AREA)
- Vascular Medicine (AREA)
- Molecular Biology (AREA)
- Chemical Kinetics & Catalysis (AREA)
- Electrochemistry (AREA)
- Animal Behavior & Ethology (AREA)
- Public Health (AREA)
- Cardiology (AREA)
- Veterinary Medicine (AREA)
- Urology & Nephrology (AREA)
- Human Computer Interaction (AREA)
- Medicinal Chemistry (AREA)
- Food Science & Technology (AREA)
- Surgery (AREA)
- Anesthesiology (AREA)
- Nuclear Medicine, Radiotherapy & Molecular Imaging (AREA)
- Physiology (AREA)
- Medical Informatics (AREA)
- External Artificial Organs (AREA)
- Investigating Or Analyzing Materials By The Use Of Electric Means (AREA)
- Yarns And Mechanical Finishing Of Yarns Or Ropes (AREA)
Abstract
導電性を有する第一導電性糸231と、第一導電性糸231を覆い、吸水性を有する絶縁素材によって形成されている第一絶縁部232と、第一絶縁部232の外周側に配置されている導電性を有する第二導電性糸233と、を有する糸。
Description
本発明は、糸、検知システム、繊維シート、コネクタ、検知装置および液体種類推定方法に関する。
本願は、2015年6月30日に出願された特願2015-132024号について優先権を主張し、その内容をここに援用する。
本願は、2015年6月30日に出願された特願2015-132024号について優先権を主張し、その内容をここに援用する。
人工透析の際の抜針は、急激な出血による重大事故につながる可能性があるため、抜針が生じた際には早急な検知が求められる。そこで、抜針の検知方法の1つとして、出血を検知することにより抜針を検知する方法が提案されている。この方法では、誤検知防止のため、汗と区別して血液を検知することが望まれる。このように、他の液体のセンサへの付着と区別して特定の液体の付着を検知することが求められる場合がある。
人工透析の際の抜針の検知に関連して、特許文献1に記載の人工透析用血液検知装置では、水分センサは、電極シート、フィルターシート及び通水性シートを備える。電極シートは、三層構造のベースシートを有し、補強シートを備える。補強シートは、多数の微細孔を有し、水蒸気を通過させる通気性を備えるが水滴の通過を阻止する防水性をも備える。コネクタは、レバー及びクリップを備える。レバー及びクリップは、それぞれ水分センサの一端部及び他端部を挟持する。クリップは、ノーマルクローズ型のスイッチを備える。クリップが水分センサを保持したときにスイッチがOFFとなり、クリップが水分センサから外れると、スイッチがONとなる。
特許文献1では、これにより、汗によって誤作動を起こすことなく、抜針による出血及び抜針の蓋然性を確実に検知することができる、とされている。
特許文献1では、これにより、汗によって誤作動を起こすことなく、抜針による出血及び抜針の蓋然性を確実に検知することができる、とされている。
特許文献1に記載の人工透析用血液検知装置では、出血の際に血液の付着する水分センサが、上記のように複雑な構造を有している。このため、水分センサの製造に多大なコストを要し、水分センサを使い捨てにできない可能性がある。これに対し、病気の血液感染をより確実に防止する観点から、血液が付着する可能性のある部分は使い捨てにすることが好ましい。
このように、汗など他の液体と区別して血液など特定の液体の付着を検知でき、かつ、液体の付着する部分を使い捨てにし得ることが望ましい場合がある。
このように、汗など他の液体と区別して血液など特定の液体の付着を検知でき、かつ、液体の付着する部分を使い捨てにし得ることが望ましい場合がある。
本発明は、他の液体と区別して特定の液体の付着を検知可能であり、かつ、液体の付着する部分を使い捨てにし得る検知システムに最適な、糸、検知システム、繊維シート、コネクタ、検知装置および液体種類推定方法を提供する。
本発明の第一の態様によれば、糸は、導電性を有する第一導電性糸と、前記第一導電性糸を覆い、吸水性を有する絶縁素材によって形成されている第一絶縁部と、前記第一絶縁部の外周側に配置されている導電性を有する第二導電性糸と、を有する。
上記糸において、前記第二導電性糸は、前記第一絶縁部の外周面に螺旋状に巻かれていてよい。
上記糸において、前記第二導電性糸は、吸水性を有する絶縁素材によって形成されていてよい。
上記糸において、吸水性を有する絶縁素材によって形成されている第三絶縁部によって覆われていてよい。
上記糸において、絶縁素材は木綿であってよい。
本発明の第二の態様によれば、検知システムは、繊維シートと検知装置とを備え、前記繊維シートは、絶縁素材によって形成されている繊維シート本体と、互いに接触しないように組み合わされた少なくとも2つの導電体を含むセンサ繊維と、を備え、前記センサ繊維は、導電性を有する第一導電性糸と、前記第一導電性糸を覆い、吸水性を有する絶縁素材によって形成されている絶縁部と、前記絶縁部の外周側に配置されている導電性を有する第二導電性糸と、を有し、前記検知装置は、前記繊維シートに設けられた少なくとも2つの前記導電体間に交流信号を入力する交流信号出力部と、前記交流信号出力部が前記導電体間に交流信号を入力した場合の当該導電体間の周波数特性を取得する周波数特性取得部と、前記交流信号出力部が前記導電体間に周波数の異なる複数の交流信号を入力して前記周波数特性取得部が取得した周波数特性が、前記交流信号出力部からの交流信号の周波数の相違に応じて所定の相違を示し、かつ、前記交流信号出力部が前記導電体間に同一周波数の交流信号を入力して前記周波数特性取得部が取得した異なる時刻における周波数特性が、時間経過に応じて所定の変化を示す場合に、検知信号を出力する検知信号出力部と、を備える。
上記検知システムにおいて、前記交流信号出力部は、繊維シートに設けられた複数の導電体間に周波数の異なる少なくとも3つの交流信号を入力し、前記周波数特性取得部は、前記交流信号出力部が入力した交流信号毎に前記導電体間のインピーダンス測定値を取得し、前記検知信号出力部は、前記周波数特性取得部が取得したインピーダンス測定値を円弧の一部で近似するCole-Cole軌跡を求め、膜を有する液体のインピーダンスを模擬する所定の等価回路モデルにおける回路パラメータの値を前記Cole-Cole軌跡に基づいて求め、得られた回路パラメータの値に基づいて液体の種類を推定することで、前記交流信号出力部が前記導電体間に周波数の異なる複数の交流信号を入力して前記周波数特性取得部が取得した周波数特性が、前記交流信号出力部からの交流信号の周波数の相違に応じて所定の相違を示すか否かの判定を行う、ようにしてもよい。
本発明の第三の態様によれば、繊維シートは、絶縁素材によって形成されている繊維シート本体と、互いに接触しないように組み合わされた少なくとも2つの導電体を含むセンサ繊維と、を備え、前記センサ繊維は、導電性を有する第一導電性糸と、前記第一導電性糸を覆い、吸水性を有する絶縁素材によって形成されている絶縁部と、前記絶縁部の外周側に配置されている導電性を有する第二導電性糸と、を有する。
上記繊維シートにおいて、前記繊維シート本体は、少なくとも一方向に伸縮性を有し、前記センサ繊維は、前記繊維シート本体の延在方向に沿って波状に配置されていてよい。
本発明の第四の態様によれば、コネクタは、第一導電性糸及び第二導電性糸と、検知装置とを接続するコネクタであって、センサ繊維が嵌るとともに、一方向に延在する溝と、前記溝の幅方向の中央近傍に突出して、前記第一導電性糸と前記検知装置とを接続する中心導体用端子と、前記溝の幅方向の端部近傍に突出して、前記第二導電性糸と前記検知装置とを接続する外部導体用端子と、を有する。
本発明の第五の態様によれば、検知装置は、繊維シートに設けられた複数の導電体間に交流信号を入力する交流信号出力部と、前記交流信号出力部が前記導電体間に交流信号を入力した場合の当該導電体間の周波数特性を取得する周波数特性取得部と、前記交流信号出力部が前記導電体間に周波数の異なる複数の交流信号を入力して前記周波数特性取得部が取得した周波数特性が、前記交流信号出力部からの交流信号の周波数の相違に応じて所定の相違を示し、かつ、前記交流信号出力部が前記導電体間に同一周波数の交流信号を入力して前記周波数特性取得部が取得した異なる時刻における周波数特性が、時間経過に応じて所定の変化を示す場合に、検知信号を出力する検知信号出力部と、を備える。
本発明の第六の態様によれば、液体種類推定方法は、繊維シートに設けられた複数の導電体間に周波数の異なる少なくとも3つの交流信号を入力する交流信号入力ステップと、前記交流信号入力ステップで入力した交流信号毎に前記導電体間のインピーダンス測定値を取得するインピーダンス測定値取得ステップと、前記インピーダンス測定値取得ステップで得られたインピーダンス測定値を円弧の一部で近似するCole-Cole軌跡を求めるCole-Cole軌跡取得ステップと、膜を有する液体のインピーダンスを模擬する所定の等価回路モデルにおける回路パラメータの値を前記Cole-Cole軌跡に基づいて求めるキャパシタンス取得ステップと、得られた回路パラメータの値に基づいて液体の種類を推定する液体種類推定ステップと、を含む。
本発明によれば、繊維シートに垂れた液体が所定の液体(例えば血液)か否かを高精度に判定することができ、検知信号を誤って出力する可能性を低減させることができる。
以下、本発明の実施形態を説明するが、以下の実施形態は請求の範囲にかかる発明を限定するものではない。また、実施形態の中で説明されている特徴の組み合わせの全てが発明の解決手段に必須であるとは限らない。
図1は、本発明の一実施形態における周波数特性検知システムの機能構成を示す概略ブロック図である。同図において、検知システム1は、検知装置100と、繊維シート200とを具備する。検知装置100は、交流信号出力部110と、周波数特性取得部120と、警報出力部130と、記憶部180と、制御部190とを具備する。記憶部180は、検知条件記憶部181を具備する。制御部190は、検知信号出力部191を具備する。繊維シート200は、第一導電体210と、第二導電体220とを具備する。
図1は、本発明の一実施形態における周波数特性検知システムの機能構成を示す概略ブロック図である。同図において、検知システム1は、検知装置100と、繊維シート200とを具備する。検知装置100は、交流信号出力部110と、周波数特性取得部120と、警報出力部130と、記憶部180と、制御部190とを具備する。記憶部180は、検知条件記憶部181を具備する。制御部190は、検知信号出力部191を具備する。繊維シート200は、第一導電体210と、第二導電体220とを具備する。
検知システム1は、人工透析時における漏血を検知することで抜針を検知する。
図2は、人工透析における抜針の例を示す説明図である。同図において、血管911にテフロン針(テフロンは登録商標)921が挿入されており、テフロン針921には、側溝H11が設けられている。体内から人工透析器への取血側では、動脈にテフロン針921が挿入される。また、人工透析器から体内への返血側では、静脈にテフロン針921が挿入される。
図2は、人工透析における抜針の例を示す説明図である。同図において、血管911にテフロン針(テフロンは登録商標)921が挿入されており、テフロン針921には、側溝H11が設けられている。体内から人工透析器への取血側では、動脈にテフロン針921が挿入される。また、人工透析器から体内への返血側では、静脈にテフロン針921が挿入される。
図2の例において、テフロン針921の一部が体外(皮膚912の外)へ、抜け出ており、体外に露出した側溝H11から血液が漏出している。
特に、返血側では、人工透析器にて血液の圧を高める影響で、取血側よりも抜針が生じやすい。また、人工透析を繰り返すことや糖尿病の影響等で血管がもろくなった場合も、抜針が生じやすくなる。
特に、返血側では、人工透析器にて血液の圧を高める影響で、取血側よりも抜針が生じやすい。また、人工透析を繰り返すことや糖尿病の影響等で血管がもろくなった場合も、抜針が生じやすくなる。
繊維シート200は、人工透析の際、針を穿刺される腕、即ち漏血監視対象部位に巻きつけられる包帯である。例えば、人工透析の間、患者はベッドに横たわって透析を受ける。そして、繊維シート200は、患者の腕に巻かれ、繊維シート200が巻かれた患者の腕にテフロン針921(図2)が穿刺される。繊維シート200は吸水性を有しており、血液や汗などがベッド側に漏出するのを防止する。繊維シート200が、吸水性に加えて、あるいは代えて、防水性を有するようにしてもよい。これにより、血液や汗などがベッド側に漏出することを、より確実に防止できる。
患者が寝返りを打つなど大きく動いた場合、繊維シート200をベッドの上に敷き、その上に患者の腕が置かれる用法では、繊維シート200の大きさによっては繊維シート200外に漏血する可能性がある。
これに対し、包帯として構成されている繊維シート200を漏血監視対象部位に巻きつけて用いることで、繊維シート200が漏血監視対象部位から外れる可能性を低減させることができ、より確実に漏血を検知し得る。
これに対し、包帯として構成されている繊維シート200を漏血監視対象部位に巻きつけて用いることで、繊維シート200が漏血監視対象部位から外れる可能性を低減させることができ、より確実に漏血を検知し得る。
また、患者が自ら抜針してしまう可能性がある場合など、包帯で穿刺箇所を巻いて固定する場合がある。この場合、繊維シート200をベッドの上に敷き、その上に患者の腕が置かれる用法では、検知装置100が包帯内部の漏血を検知できない可能性がある。これに対し、包帯として構成されている繊維シート200で穿刺箇所を巻いて固定することで、検知装置100は、より確実に包帯内部の漏血を検知し得る。
なお、患者が動くことがない短時間の使用などにおいては、繊維シート200は、を患者の腕の下に敷く形態としてもよい。
また、ガーゼとして構成されている繊維シート200を、漏血監視対象部位に当て、包帯で巻いて用いることができる。ガーゼとして構成されている繊維シート200を、漏血監視対象部位に当て、包帯で巻いて用いることで、繊維シート200が漏血監視対象部位から外れる可能性を低減させることができ、より確実に漏血を検知し得る。
また、ガーゼとして構成されている繊維シート200を、漏血監視対象部位に当て、包帯で巻いて用いることができる。ガーゼとして構成されている繊維シート200を、漏血監視対象部位に当て、包帯で巻いて用いることで、繊維シート200が漏血監視対象部位から外れる可能性を低減させることができ、より確実に漏血を検知し得る。
第一導電体210および第二導電体220は、それぞれ、繊維シート200に設けられた導電体であり、交流信号出力部110からの交流信号が入力される。
第一導電体210と第二導電体220とは接触していない。また、繊維シート200の本体(第一導電体210および第二導電体220が設けられるベースとなる部分)は絶縁性の繊維で作られている。このため、繊維シート200に液体が付着していない状態では、第一導電体210と第二導電体220とは絶縁されているか、あるいは、コンデンサ効果等による微小な交流電流が流れるのみである。
一方、第一導電体210と第二導電体220との間に液体が垂れると、第一導電体210と第二導電体220とは垂れた液体に応じた周波数特性で通電する。
第一導電体210と第二導電体220とは接触していない。また、繊維シート200の本体(第一導電体210および第二導電体220が設けられるベースとなる部分)は絶縁性の繊維で作られている。このため、繊維シート200に液体が付着していない状態では、第一導電体210と第二導電体220とは絶縁されているか、あるいは、コンデンサ効果等による微小な交流電流が流れるのみである。
一方、第一導電体210と第二導電体220との間に液体が垂れると、第一導電体210と第二導電体220とは垂れた液体に応じた周波数特性で通電する。
なお、繊維シート200が吸水性を有し液体を拡散させることで、液体が第一導電体210と第二導電体220との間以外の位置に垂れた場合でも、第一導電体210と第二導電体220とが通電する可能性を高めることができる。特に、検知システム1が血液の漏出を検知できる可能性を高めることができる。
なお、第一導電体210と第二導電体220との表面に吸水性のある絶縁性の層を設けた構成にするなど、患者の腕が第一導電体210や第二導電体220に直接接触しない構成としてもよい。あるいは、検知システム1(検知装置100)が、患者の腕の接触と区別可能な通電の特性(周波数特性)を検知することで、血液の漏出を検知するようにしてもよい。
なお、第一導電体210と第二導電体220との表面に吸水性のある絶縁性の層を設けた構成にするなど、患者の腕が第一導電体210や第二導電体220に直接接触しない構成としてもよい。あるいは、検知システム1(検知装置100)が、患者の腕の接触と区別可能な通電の特性(周波数特性)を検知することで、血液の漏出を検知するようにしてもよい。
第一導電体210や第二導電体220の素材として、導電性のある様々な素材を用いることができる。例えば、第一導電体210や第二導電体220として導電性糸(導電性を有する糸)を用いて、繊維シート200の製造の際に編み込むようにしてもよい。あるいは、第一導電体210や第二導電体220として導電性糸を用いて、製造後の繊維シート200本体に縫い付けるようにしてもよい。
第一導電体210や第二導電体220として導電性糸を用いることで、繊維シート200の肌触りを良くすることができる。これにより、患者が繊維シート200に腕を置いた際に不快感を与えずに済む。
第一導電体210や第二導電体220として導電性糸を用いることで、繊維シート200の肌触りを良くすることができる。これにより、患者が繊維シート200に腕を置いた際に不快感を与えずに済む。
検知装置100は、繊維シート200へ交流信号を入力し、繊維シート200側における周波数特性を取得して漏血の有無を判定する。
検知装置100が、繊維シート200へ入力する交流信号として、電圧の変化する様々な信号(すなわち、周波数を有する様々な信号)を用いることができる。例えば、検知装置100が繊維シート200へ正弦波を入力するようにしてもよいし、三角波を入力するようにしてもよいし、矩形波を入力するようにしてもよい。
検知装置100が、繊維シート200へ入力する交流信号として、電圧の変化する様々な信号(すなわち、周波数を有する様々な信号)を用いることができる。例えば、検知装置100が繊維シート200へ正弦波を入力するようにしてもよいし、三角波を入力するようにしてもよいし、矩形波を入力するようにしてもよい。
また、検知装置100が取得する周波数特性は、入力する交流信号の周波数に応じて測定される様々なデータとすることができる。本実施形態では、検知装置100が周波数特性としてインピーダンス(Impedance)の大きさやその位相回転を測定する場合を例に説明するが、これに限らない。さらに、インピーダンスの測定は2電極法を例に説明するが4電極法などを用いてもよい。
検知装置100は、例えばマイコン(Microcomputer)を含んで構成される。あるいは、検知装置100の各部が専用回路にて構成される、あるいはスマートフォンまたはパーソナルコンピュータ等を用いて構成されるなど、マイコンを含む構成以外の構成としてもよい。
検知装置100は、例えばマイコン(Microcomputer)を含んで構成される。あるいは、検知装置100の各部が専用回路にて構成される、あるいはスマートフォンまたはパーソナルコンピュータ等を用いて構成されるなど、マイコンを含む構成以外の構成としてもよい。
交流信号出力部110は、繊維シート200へ入力するための交流信号を出力する。具体的には交流信号出力部110は、繊維シート200に設けられた複数の導電体間(本実施形態では第一導電体210と第二導電体220との間)に交流信号を入力する。上記のように、交流信号出力部110が出力する交流信号として、電圧の変化する様々な信号を用いることができる。
周波数特性取得部120は、繊維シート200に設けられた複数の導電体間に、交流信号出力部110が交流信号を入力した場合の当該導電体間の周波数特性を取得する。例えば、周波数特性取得部120は、交流信号出力部110が出力する交流信号の周波数における繊維シート200のインピーダンスの大きさや、交流信号出力部110の出力する交流信号に対する、繊維シート200における交流信号の位相回転を測定する。さらに例えば、周波数特性取得部120は、第一導電体210と第二導電体220との間のインピーダンスや、第一導電体210と第二導電体220との間に流れる電流の、交流信号出力部110の出力する交流信号に対する位相回転を測定する。
周波数特性取得部120は、繊維シート200に設けられた複数の導電体間に、交流信号出力部110が交流信号を入力した場合の当該導電体間の周波数特性を取得する。例えば、周波数特性取得部120は、交流信号出力部110が出力する交流信号の周波数における繊維シート200のインピーダンスの大きさや、交流信号出力部110の出力する交流信号に対する、繊維シート200における交流信号の位相回転を測定する。さらに例えば、周波数特性取得部120は、第一導電体210と第二導電体220との間のインピーダンスや、第一導電体210と第二導電体220との間に流れる電流の、交流信号出力部110の出力する交流信号に対する位相回転を測定する。
特に、周波数特性取得部120は、第一周波数の交流信号、第二周波数の交流信号それぞれを第一導電体210と第二導電体220とに入力した場合の周波数特性を取得する。
後述するように、血液と汗とでは、周波数の変化に対するインピーダンスの変化の大きさや位相回転の変化の大きさが異なる。そこで、周波数特性取得部120は、周波数の異なる交流信号の各々について、当該交流信号を第一導電体210と第二導電体220とに入力した場合の周波数特性を測定する。
検知装置100(検知信号出力部191)がこれら周波数の異なる交流信号の各々についての周波数特性に基づいて血液の漏出を検知することで、血液と汗とを区別することができる。これにより、抜針の誤検知を低減させることができる。
後述するように、血液と汗とでは、周波数の変化に対するインピーダンスの変化の大きさや位相回転の変化の大きさが異なる。そこで、周波数特性取得部120は、周波数の異なる交流信号の各々について、当該交流信号を第一導電体210と第二導電体220とに入力した場合の周波数特性を測定する。
検知装置100(検知信号出力部191)がこれら周波数の異なる交流信号の各々についての周波数特性に基づいて血液の漏出を検知することで、血液と汗とを区別することができる。これにより、抜針の誤検知を低減させることができる。
警報出力部130は、周波数特性取得部120の取得した周波数特性に基づいて検知装置100(検知信号出力部191)が血液の漏出を検知すると、警報を出力する。
警報出力部130の警報出力方法として様々な方法を用いることができる。例えば、警報出力部130はスピーカを具備し、検知信号出力部191の出力する検知信号に応じて警報音を出力する。あるいは、警報出力部130が、スピーカに加えて、あるいは代えてランプを具備し、当該ランプの発光にて警報を出力するようにしてもよい。あるいは、警報出力部130が、ナースセンターに設置されたパソコン(Personal Computer;PC)に警報信号を送信するなど、他機器に警報信号を送信するようにしてもよい。
警報出力部130の警報出力方法として様々な方法を用いることができる。例えば、警報出力部130はスピーカを具備し、検知信号出力部191の出力する検知信号に応じて警報音を出力する。あるいは、警報出力部130が、スピーカに加えて、あるいは代えてランプを具備し、当該ランプの発光にて警報を出力するようにしてもよい。あるいは、警報出力部130が、ナースセンターに設置されたパソコン(Personal Computer;PC)に警報信号を送信するなど、他機器に警報信号を送信するようにしてもよい。
記憶部180は、例えば検知装置100の具備する記憶デバイスを含んで構成され、各種データを記憶する。
検知条件記憶部181は、検知信号出力部191が検知信号を出力するか否かの判定閾値を記憶する。すなわち、当該閾値は、検知信号出力部191が、血液の漏出を検知したか否かを判定する際の検知条件として用いられる。
検知条件記憶部181は、検知信号出力部191が検知信号を出力するか否かの判定閾値を記憶する。すなわち、当該閾値は、検知信号出力部191が、血液の漏出を検知したか否かを判定する際の検知条件として用いられる。
制御部190は、検知装置100の各部を制御して各種機能を実行する。制御部190は、例えば検知装置100の具備するCPU(Central Processing Unit、中央処理装置)が、記憶部180からプログラムを読み出して実行することで実現される。
検知信号出力部191は、周波数特性取得部120が所定の周波数特性を取得した場合に検知信号を出力する。より具体的には、検知信号出力部191は、周波数特性取得部120が取得した周波数特性が、検知条件記憶部181の記憶する検知条件を満たすか否かを判定する。そして、検知信号出力部191は、検知条件を満たすと判定した場合に、警報出力部130へ検知信号を出力する。
検知信号出力部191は、周波数特性取得部120が所定の周波数特性を取得した場合に検知信号を出力する。より具体的には、検知信号出力部191は、周波数特性取得部120が取得した周波数特性が、検知条件記憶部181の記憶する検知条件を満たすか否かを判定する。そして、検知信号出力部191は、検知条件を満たすと判定した場合に、警報出力部130へ検知信号を出力する。
特に、検知信号出力部191は、交流信号出力部110が導電体間(第一導電体210と第二導電体220との間)に周波数の異なる複数の交流信号を入力して周波数特性取得部120が取得した周波数特性が、交流信号出力部110からの交流信号の周波数の相違に応じて所定の相違を示し、かつ、交流信号出力部110が導電体間に同一周波数の交流信号を入力して周波数特性取得部120が取得した異なる時刻における周波数特性が、時間経過に応じて所定の変化を示す場合に、検知信号を出力する。
例えば、交流信号出力部110は、第一導電体210と第二導電体220との間に、周波数を変えながら交流信号を複数回入力する。そして、周波数特性取得部120は、交流信号出力部110が交流信号を入力する毎に、第一導電体210と第二導電体220との間の周波数特性(例えば、インピーダンス又は位相)を測定する。そして、検知信号出力部191は、交流信号出力部110からの交流信号の周波数の変化に応じて、第一導電体210と第二導電体220との間の周波数特性が所定の大きさ以上に変化しているか否かを判定する。
また、交流信号出力部110は、第一導電体210と第二導電体220との間に交流信号を入力し、所定時間経過した後、同じ周波数の交流電流を再度入力する。交流信号出力部110が交流信号を入力する回数は2回であってもよいし3回以上であってもよい。あるいは、交流信号出力部110が、同じ周波数の交流信号を第一導電体210と第二導電体220との間に所定時間入力し続けるようにしてもよい。
そして、周波数特性取得部120は、交流信号出力部110が同一周波数の交流信号を入力しているときに、第一導電体210と第二導電体220との間の周波数特性を複数回測定する。そして、検知信号出力部191は、周波数特性取得部120が周波数特性を測定してから次に周波数特性を取得するまでの時間経過に応じて、第一導電体210と第二導電体220との間の周波数特性が所定の大きさ以上に変化しているか否かを判定する。
そして、周波数特性取得部120は、交流信号出力部110が同一周波数の交流信号を入力しているときに、第一導電体210と第二導電体220との間の周波数特性を複数回測定する。そして、検知信号出力部191は、周波数特性取得部120が周波数特性を測定してから次に周波数特性を取得するまでの時間経過に応じて、第一導電体210と第二導電体220との間の周波数特性が所定の大きさ以上に変化しているか否かを判定する。
そして、検知信号出力部191は、交流信号出力部110からの交流信号の周波数の変化に応じて、第一導電体210と第二導電体220との間の周波数特性が所定の大きさ以上に変化しており、かつ、周波数特性取得部120が周波数特性を測定してから次に周波数特性を取得するまでの時間経過に応じて、第一導電体210と第二導電体220との間の周波数特性が所定の大きさ以上に変化していると判定した場合に、警報出力部130へ検知信号を出力する。
このように、検知信号出力部191が、入力周波数の違いに基づく周波数特性の違い、及び、時間経過に基づく周波数特性の変化の両方を判定することで、繊維シート200に血液が垂れたか否かを、より高精度に判定し得る。
このように、検知信号出力部191が、入力周波数の違いに基づく周波数特性の違い、及び、時間経過に基づく周波数特性の変化の両方を判定することで、繊維シート200に血液が垂れたか否かを、より高精度に判定し得る。
次に、図3~図8を参照して、検知信号出力部191が血液の漏出を検知するための判定条件について説明する。実験にて、人間の血液を模擬した豚の血液と、汗を模擬した食塩水とでは異なる周波数特性が得られており、かかる実験結果に基づいて、検知信号出力部191が血液の漏出を検知するための判定条件を設定することができる。
図3は、実験に用いた容器および測定電極の外形の概略を示す外観図である。実験において、アクリル容器801の両端にそれぞれ電極802を挿入し、容器内に血液や食塩水を入れた。アクリル容器801を恒温槽内に置き、体温に近い温度(37度(℃))で実験を行った。
また、電極802のそれぞれを定電流源803と接続して交流信号を流した。電極802のそれぞれは電圧計804との接続されており、電圧計804にて電極802間の電圧を測定した。
電極802は、第一導電体210および第二導電体220を模擬する。定電流源803は、交流信号出力部110を模擬する。電圧計804は、周波数特性取得部120を模擬する。
また、電極802のそれぞれを定電流源803と接続して交流信号を流した。電極802のそれぞれは電圧計804との接続されており、電圧計804にて電極802間の電圧を測定した。
電極802は、第一導電体210および第二導電体220を模擬する。定電流源803は、交流信号出力部110を模擬する。電圧計804は、周波数特性取得部120を模擬する。
図4は、実験における回路の概略を示す説明図である。同図に示すように、定電流源803は、2つの電極802の間に接続されて、これら2つの電極802に交流信号を入力する。電圧計804は、2つの電極802の間に接続されて、これら2つの電極802間の電圧を測定する。
また、実験では、豚10頭の血液を使用し、平均値を算出した。実験に用いた血液のヘマトクリット値(Hct)は、約40パーセント(%)である。
また、非凝固血では、抗凝固剤としてクエン酸ナトリウムを用いた。
また、実験では、豚10頭の血液を使用し、平均値を算出した。実験に用いた血液のヘマトクリット値(Hct)は、約40パーセント(%)である。
また、非凝固血では、抗凝固剤としてクエン酸ナトリウムを用いた。
図5は、アクリル容器801に食塩水が入った状態でのインピーダンスの大きさZの測定結果を示すグラフである。なお、インピーダンスの大きさを単にインピーダンスとも表記する。同図に示すグラフの横軸は周波数を示し、縦軸はインピーダンスを示す。
実験では、大きさの異なる3つのアクリル容器801(以下、容器A、容器B、容器Cと表記する。)に食塩水を入れてインピーダンスを測定した。アクリル容器801に食塩水が入った状態での周波数特性は、アクリル容器801自体の周波数特性を示す。また、アクリル容器801に食塩水が入った状態での周波数特性は、汗の周波数特性を模擬している。
線L11、L12、L13は、それぞれ、容器A、容器B、容器Cでのインピーダンス測定値を示す。線L11、L12、L13のいずれも、約3キロヘルツ(kHz)から約2メガヘルツ(MHz)の範囲では、おおよそ一定のインピーダンスを示している。それ以外の周波数範囲では、電極の接触インピーダンス及び測定ケーブルの影響が生じていると考えられる。
図6は、アクリル容器801に食塩水が入った状態での位相差(位相回転)の測定結果を示すグラフである。ここでの位相差は、定電流源803が出力する交流信号の位相と、電圧計804が電圧を測定する電極802間の交流信号の位相との差である。
図6に示すグラフの横軸は周波数を示し、縦軸は位相差を示す。また、線L21、L22、L23は、それぞれ、容器A、容器B、容器Cでの位相差を示す。線L11、L12、L13のいずれも、約40キロヘルツから約2メガヘルツの範囲では、おおよそ一定の位相差(おおよそ位相差0)を示している。
図5および図6の測定結果から、食塩水では、約40キロヘルツから約2メガヘルツまでの範囲で振幅、位相ともにおおよそ一定となっている。それ以外の周波数範囲では、電極の接触インピーダンス及び測定ケーブルの影響が生じていると考えられる。
図6に示すグラフの横軸は周波数を示し、縦軸は位相差を示す。また、線L21、L22、L23は、それぞれ、容器A、容器B、容器Cでの位相差を示す。線L11、L12、L13のいずれも、約40キロヘルツから約2メガヘルツの範囲では、おおよそ一定の位相差(おおよそ位相差0)を示している。
図5および図6の測定結果から、食塩水では、約40キロヘルツから約2メガヘルツまでの範囲で振幅、位相ともにおおよそ一定となっている。それ以外の周波数範囲では、電極の接触インピーダンス及び測定ケーブルの影響が生じていると考えられる。
図7は、アクリル容器801に豚血液が入った状態でのインピーダンスの大きさZの測定結果を示すグラフである。同図に示すグラフの横軸は周波数を示し、縦軸はインピーダンスを示す。アクリル容器801に豚血液が入った状態での周波数特性は、人の血液の周波数特性を模擬している。
線L31は、非凝固血液のインピーダンスを示す。線L32は、凝固血液のインピーダンスを示す。
線L31にて示される非凝固血液では、100キロヘルツから900キロヘルツへと周波数が大きくなるほどインピーダンスが小さくなっている。また、線L32にて示される凝固血では、非凝固血の場合よりもインピーダンスが大きくなっており、また、周波数の増大に対するインピーダンスの減少の割合が大きくなっている。
線L31にて示される非凝固血液では、100キロヘルツから900キロヘルツへと周波数が大きくなるほどインピーダンスが小さくなっている。また、線L32にて示される凝固血では、非凝固血の場合よりもインピーダンスが大きくなっており、また、周波数の増大に対するインピーダンスの減少の割合が大きくなっている。
図8は、アクリル容器801に豚血液が入った状態での位相差(位相回転)の測定結果を示すグラフである。図6の場合と同様、図8での位相差は、定電流源803が出力する交流信号の位相と、電圧計804が電圧を測定する電極802間の交流信号の位相との差である。図8に示すグラフの横軸は周波数を示し、縦軸は位相差を示す。
線L41は、非凝固血液での位相差を示す。線L42は、凝固血液での位相差を示す。
線L41にて示される非凝固血液では、100キロヘルツから900キロヘルツへと周波数が大きくなるほど位相差(位相遅れ)が大きくなっている。また、線L42にて示される凝固血では、非凝固血の場合よりも位相差が大きくなっており、また、周波数の増大に対する位相遅れの増大の割合も大きくなっている。
線L41にて示される非凝固血液では、100キロヘルツから900キロヘルツへと周波数が大きくなるほど位相差(位相遅れ)が大きくなっている。また、線L42にて示される凝固血では、非凝固血の場合よりも位相差が大きくなっており、また、周波数の増大に対する位相遅れの増大の割合も大きくなっている。
図5~図8に示される測定結果から、比較的低周波の場合と比較的高周波の場合とで振幅または位相、あるいはこれら両方を比較することで、食塩水(汗)と血液とを区別することが考えられる。具体的には、周波数の変化に応じた変化が比較的小さい場合は、食塩水または汗と判断し、比較的大きい場合は、血液と判断する。
比較的低周波の場合として、例えば100キロヘルツ以下の交流信号を用いる。また、比較的高周波の場合として、例えば900キロヘルツ以上の交流信号を用いる。
比較的低周波の場合として、例えば100キロヘルツ以下の交流信号を用いる。また、比較的高周波の場合として、例えば900キロヘルツ以上の交流信号を用いる。
例えば、交流信号出力部110は、第一周波数の交流信号として100キロヘルツの交流信号を第一導電体210および第二導電体220に入力する。また、また、交流信号出力部110は、第二周波数の交流信号として900キロヘルツの交流信号を第一導電体210および第二導電体220に入力する。
また、周波数特性取得部120は、第一周波数の場合、第二周波数の場合それぞれについて、第一導電体210と第二導電体220との間のインピーダンス、および、第一導電体210と第二導電体220との間を電流の、交流信号出力部110の出力する電流に対する位相遅れを測定する。
また、周波数特性取得部120は、第一周波数の場合、第二周波数の場合それぞれについて、第一導電体210と第二導電体220との間のインピーダンス、および、第一導電体210と第二導電体220との間を電流の、交流信号出力部110の出力する電流に対する位相遅れを測定する。
そして、検知信号出力部191は、例えば、周波数特性取得部120による測定値が以下の条件(1)、(2)の両方を満たす場合に、検知信号を出力する。
(1)第一周波数の場合のインピーダンスの大きさに対し、第二周波数の場合のインピーダンスの大きさが95パーセント以下である。(すなわち、5パーセント以上小さくなっている。)
(2)第一周波数の場合の位相遅れの大きさに対し、第二周波数の場合の位相遅れの大きさが2倍以上である。
(1)第一周波数の場合のインピーダンスの大きさに対し、第二周波数の場合のインピーダンスの大きさが95パーセント以下である。(すなわち、5パーセント以上小さくなっている。)
(2)第一周波数の場合の位相遅れの大きさに対し、第二周波数の場合の位相遅れの大きさが2倍以上である。
図7や図8に示す例では、条件(1)、条件(2)の両方を満たしている。一方、図5や図6に示す例のように、食塩水や汗の場合はインピーダンスや位相遅れの変化がほとんど見られず、条件(1)や条件(2)を満たさないと考えられる。
従って、条件(1)または条件(2)、あるいはこれらの条件の併用により、血液の流出を検知し、かつ、汗等による誤検知を低減させることができる。
従って、条件(1)または条件(2)、あるいはこれらの条件の併用により、血液の流出を検知し、かつ、汗等による誤検知を低減させることができる。
また、図7や図8に示されるように、非凝固血と凝固血とで位相変化が異なることから、検知信号出力部191が、凝固血と非凝固血とを区別して検知するように検知条件を設定できる。
例えば、手術後等に傷口に当てるガーゼまたは包帯に繊維シート200を用い、検知信号出力部191が、時間経過に伴って漏血が凝固する状態変化を検知するようにしてもよい。より具体的には、検知信号出力部191がタイマを具備し、手術終了時などから所定時間経過したことを検知すると血液凝固の有無を判定する。血液凝固無しと判定した場合、検知装置100は、止血の確認を促す警報を出力する。
また、傷口からの出血が止まった後、検知信号出力部191が非凝固血を検知した場合、検知装置100が、傷口が開いた可能性を示す警報を出力するようにしてもよい。
例えば、手術後等に傷口に当てるガーゼまたは包帯に繊維シート200を用い、検知信号出力部191が、時間経過に伴って漏血が凝固する状態変化を検知するようにしてもよい。より具体的には、検知信号出力部191がタイマを具備し、手術終了時などから所定時間経過したことを検知すると血液凝固の有無を判定する。血液凝固無しと判定した場合、検知装置100は、止血の確認を促す警報を出力する。
また、傷口からの出血が止まった後、検知信号出力部191が非凝固血を検知した場合、検知装置100が、傷口が開いた可能性を示す警報を出力するようにしてもよい。
次に、図9~図12を参照して、センサ繊維(糸)を用いての周波数特性の時間変化の測定実験について説明する。
図9及び図10は、センサ繊維の概略構造を示す構造図である。同図に示すセンサ繊維230は、有機繊維によって形成された芯234と、芯234を被覆する銅箔235と、を有する導電性糸231、233を有している。導電性糸231及び導電性糸233は、それぞれ、吸水性を有する絶縁素材である絶縁用木綿232(第一絶縁部)、第二絶縁用木綿236(第二絶縁部)によって被覆されている。具体的には、センサ繊維230は、複数の第一導電性糸231(第一導電体210として機能する)からなる導電性糸群を絶縁用木綿232によって被覆し、絶縁用木綿232の外周に絶縁性木綿236によって被覆されている第二導電性糸233(第二導電体220として機能する)を螺旋状に巻き付けることで構成されている。即ち、第二導電性糸233は、第二絶縁部236の外周側に配置されている。
第一導電性糸231が絶縁性木綿232に覆われるとともに、第二導電性糸233が絶縁性木綿236で覆われていることによって、絶縁性糸231、233が体表面等に直接触れることがなくなる。
なお、導電性糸232、233を被覆する絶縁素材は、木綿に限ることはなく、吸水性を有する絶縁素材であれば採用が可能である。例えば、レーヨン、絹等も採用することができる。
図10は、センサ繊維230の層構造を示す説明図である。図10は、センサ繊維230の断面における層構造を示している。同図に示すように、導電性糸231と導電性糸233との間に絶縁用木綿232及び絶縁用木綿236が介在している。絶縁用木綿232及び絶縁用木綿236が液体を吸収すると、導電性糸231と導電性糸233との間の周波数特性が変化する。
このような同軸構造とする主な理由は、体動や腕部上の重ね巻によるノイズの低減である。同軸構造とすることで、導電性糸231と導電性糸233間の電流密度が最大となり、かつ、センサ繊維外側からのノイズの影響を少なくできる。さらに、センサ繊維230が誘電率の高い皮膚に触れたり、腕部にセンサ繊維230を多重に巻くことでセンサ繊維230同士が接触しても、測定値の変動はほとんど生じない。
このような同軸構造とする主な理由は、体動や腕部上の重ね巻によるノイズの低減である。同軸構造とすることで、導電性糸231と導電性糸233間の電流密度が最大となり、かつ、センサ繊維外側からのノイズの影響を少なくできる。さらに、センサ繊維230が誘電率の高い皮膚に触れたり、腕部にセンサ繊維230を多重に巻くことでセンサ繊維230同士が接触しても、測定値の変動はほとんど生じない。
次に、センサ繊維230の製造装置について説明する。図9及び図10に示すセンサ繊維230は、延伸された芯線に被覆線を巻き付ける、所謂カバーリングを用いて製造することができる。
図11は、センサ繊維の製造装置50の概略図である。図11に示すように、センサ繊維の製造装置50は、芯線を供給する第一供給リール51と、被覆糸を供給する第二供給リール52と、複数のフィードローラー53と、仮撚装置54と、巻き取りローラー55と、を有している。製造装置50は、仮撚装置54を調整することによって、被覆する被覆線のピッチ(糸の長手方向のピッチ)を、任意に変更することができる。
図11は、センサ繊維の製造装置50の概略図である。図11に示すように、センサ繊維の製造装置50は、芯線を供給する第一供給リール51と、被覆糸を供給する第二供給リール52と、複数のフィードローラー53と、仮撚装置54と、巻き取りローラー55と、を有している。製造装置50は、仮撚装置54を調整することによって、被覆する被覆線のピッチ(糸の長手方向のピッチ)を、任意に変更することができる。
次に、センサ繊維230の製造方法について説明する。
まず、芯線として導電性糸231(導電性糸群)を第一供給リール51にセットすると共に、被覆糸として絶縁用木綿232をセットして、絶縁用木綿232によって被覆(カバーリング)された導電性糸231(以下、第一加工糸と呼ぶ)を製造する。第一加工糸は、巻き取りローラー55によって巻き取られる。
同様の方法で、絶縁用木綿236によって被覆された導電性糸233を製造する。
まず、芯線として導電性糸231(導電性糸群)を第一供給リール51にセットすると共に、被覆糸として絶縁用木綿232をセットして、絶縁用木綿232によって被覆(カバーリング)された導電性糸231(以下、第一加工糸と呼ぶ)を製造する。第一加工糸は、巻き取りローラー55によって巻き取られる。
同様の方法で、絶縁用木綿236によって被覆された導電性糸233を製造する。
次に、第一加工糸を第一供給リール51にセットすると共に、導電性糸233を第二供給リール52にセットして、導電性糸233が巻かれた第一加工糸(以下、第二加工糸と呼ぶ)を製造する。
このような製造方法を用いることによって、より容易にセンサ繊維230を製造することができる。即ち、カバーリングを用いることによって、既存の製造装置を利用してセンサ繊維230を製造することができる。
センサ繊維230の製造方法はこれに限らず、例えば、組み紐のように、芯線である導電性糸と被覆線である絶縁性木綿とを編むなどして製造してもよい。
このような製造方法を用いることによって、より容易にセンサ繊維230を製造することができる。即ち、カバーリングを用いることによって、既存の製造装置を利用してセンサ繊維230を製造することができる。
センサ繊維230の製造方法はこれに限らず、例えば、組み紐のように、芯線である導電性糸と被覆線である絶縁性木綿とを編むなどして製造してもよい。
図12は、センサ繊維に食塩水または血液(豚血液)を滴下した状態でのインピーダンスの大きさZの測定値の時間変化を示すグラフである。同図に示すグラフの横軸は滴下からの経過時間を示し、縦軸はインピーダンスを示す。線L51は、食塩水を滴下した状態でのインピーダンスを示し、線L52は、血液を滴下した状態でのインピーダンスを示す。
図12の例では、センサ繊維230(導電性糸231および233)に、75キロヘルツの交流信号を入力している。
線L51に示される食塩水の滴下ではインピーダンスがほとんど変化していないのに対し、線L52に示される血液の滴下ではインピーダンスが一度減少した後増大している。
なお、センサ繊維に食塩水または血液を滴下する前は、インピーダンスが非常に高値を示すことは、いうまでもない。
図12の例では、センサ繊維230(導電性糸231および233)に、75キロヘルツの交流信号を入力している。
線L51に示される食塩水の滴下ではインピーダンスがほとんど変化していないのに対し、線L52に示される血液の滴下ではインピーダンスが一度減少した後増大している。
なお、センサ繊維に食塩水または血液を滴下する前は、インピーダンスが非常に高値を示すことは、いうまでもない。
図13は、センサ繊維に食塩水または血液(豚血液)を滴下した状態での位相差の測定値の時間変化を示すグラフである。ここでの位相差は、導電性糸231および233に入力される交流信号の位相に対する、導電性糸231と233との間に流れる交流信号の位相差(位相遅れ)である。
図13に示すグラフの横軸は滴下からの経過時間を示し、縦軸は位相差を示す。線L61は、食塩水を滴下した状態での位相差を示し、線L62は、血液を滴下した状態での位相差を示す。図12の例では、センサ繊維230(導電性糸231および233)に、1メガヘルツの交流信号を入力している。
図13に示すグラフの横軸は滴下からの経過時間を示し、縦軸は位相差を示す。線L61は、食塩水を滴下した状態での位相差を示し、線L62は、血液を滴下した状態での位相差を示す。図12の例では、センサ繊維230(導電性糸231および233)に、1メガヘルツの交流信号を入力している。
線L61に示される食塩水を滴下した状態よりも、線L62に示される血液を滴下した状態の方が、位相差が大きい。また、食塩水の滴下では位相差がほとんど変化していないのに対し、血液の滴下では時間経過に伴って位相が遅れている。
図12や図13に示されるように、食塩水と血液とでは周波数特性の時間変化にも差が生じる。そこで、検知信号出力部191の検知条件として、周波数の違いによる周波数特性の違いに加えて、あるいは代えて、時間経過による周波数特性の変化についての条件を用いるようにしてもよい。
図12や図13に示されるように、食塩水と血液とでは周波数特性の時間変化にも差が生じる。そこで、検知信号出力部191の検知条件として、周波数の違いによる周波数特性の違いに加えて、あるいは代えて、時間経過による周波数特性の変化についての条件を用いるようにしてもよい。
図3~図13を参照して説明した食塩水と血液との周波数特性の違いは、血液中の赤血球の構造に起因すると考えられる。より具体的には、赤血球細胞膜に起因する誘電体により、インピーダンスや位相差が周波数に応じて変化すると考えられる。このことから、検知装置100は、汗に限らず水やコーラなど、赤血球細胞膜のような構造を含まない様々な液体と区別して血液を検知し得る。従って、検知装置100では、患者が水やコーラ等の飲料をこぼした場合にも、抜針を誤検知する可能性を低減させることができる。
なお、繊維シート200に液体が垂れるとインピーダンス比率が低下する。ここでいうインピーダンス比率は、第一導電体210と第二導電体220との間に、ある周波数の交流信号を入力した場合のインピーダンスを、他の周波数の交流信号を入力した場合のインピーダンスで除算した値である。なお、周波数が低い方の交流信号を入力した場合のインピーダンスを、周波数が高い方の交流信号を入力した場合のインピーダンスで除算する。
図14は、血液及び生理食塩水のインピーダンス比率の時間変化の例を示す説明図である。同図のグラフの横軸は液の滴下からの経過時間を示し、縦軸はインピーダンス比率を示す。
図14は、血液及び生理食塩水のインピーダンス比率の時間変化の例を示す説明図である。同図のグラフの横軸は液の滴下からの経過時間を示し、縦軸はインピーダンス比率を示す。
同図の例では、サンプリング時間毎に、第一導電体210と第二導電体220との間に5メガヘルツの交流信号と、10キロヘルツの交流信号とを入力してそれぞれインピーダンスを測定している。そして、5メガヘルツの交流信号を入力した場合のインピーダンスを、10キロヘルツの交流信号を入力した場合のインピーダンスで除算してインピーダンス比率を求めている。
線L71は、繊維シート200に生理食塩水を滴下した場合のインピーダンス比率の時間変化の例を示す。線L72~L76は、それぞれ繊維シート200にヘマトクリット(Ht)値20%、30%、43%、41%、44%の血液を滴下した場合のインピーダンス比率の時間変化の例を示す。
同図に示すように、生理食塩水(線L71)を滴下した場合も、いずれのヘマトクリット値の血液(線L72~L76)を滴下した場合も、インピーダンス比率が低下しているが、滴下後の血液(線L72~L76)のインピーダンス比率は、生理食塩水(線L71)のそれよりも高値を示しているため、滴下5秒以降であればインピーダンス比率の閾値判別だけでも血液と生理食塩水(汗)を分離できることがわかる。さらに、インピーダンス比率が低下した後、整理食塩水(線L71)の場合は、低いインピーダンス比率を維持している。一方、血液(線L72~L76)の場合は、インピーダンス比率が一旦低下した後、上昇している。
同図に示すように、生理食塩水(線L71)を滴下した場合も、いずれのヘマトクリット値の血液(線L72~L76)を滴下した場合も、インピーダンス比率が低下しているが、滴下後の血液(線L72~L76)のインピーダンス比率は、生理食塩水(線L71)のそれよりも高値を示しているため、滴下5秒以降であればインピーダンス比率の閾値判別だけでも血液と生理食塩水(汗)を分離できることがわかる。さらに、インピーダンス比率が低下した後、整理食塩水(線L71)の場合は、低いインピーダンス比率を維持している。一方、血液(線L72~L76)の場合は、インピーダンス比率が一旦低下した後、上昇している。
このインピーダンス比率の低下を検知することで、血液に限らず何らかの液体が繊維シート200に垂れたことを検知することができる。検知装置100が、繊維シート200に液体が垂れたことを検知し、さらにその液体が血液か否かを判定することで、血液の漏出に加えて、輸液など血液以外の液体の漏出を検知することができる。
なお、インピーダンス比率の低下に加えて、或いは代えて、インピーダンスの低下を検知することでも、液体の漏出を検知することができる。
なお、インピーダンス比率の低下に加えて、或いは代えて、インピーダンスの低下を検知することでも、液体の漏出を検知することができる。
繊維シート200に垂れた液体が血液か否かの判定は、例えば、インピーダンス比率の時間微分が所定の閾値以上か否かを判定することで行うことができる。具体的には、繊維シート200に垂れた液体が血液である場合、第一導電体210と第二導電体220との間のインピーダンス比率が低下した後、上昇する。このインピーダンス比率の上昇を、インピーダンス比率の時間微分の値にて検知することができる。
そこで、検知信号出力部191は、インピーダンス比率の時間微分を算出し、得られたインピーダンス比率の時間微分が所定の閾値以上か否かを判定する。インピーダンス比率の時間微分が所定の閾値以上である場合、検知信号出力部191は、繊維シート200に血液が垂れたと判定する。一方、インピーダンス比率の時間微分が所定の閾値未満である場合、検知信号出力部191は、繊維シート200に血液以外の液体が垂れたと判定する。
次に、図15及び図16を参照して、検知装置100が、繊維シート200に血液が垂れたこと、及び、血液以外の液体が垂れたことを検知する動作について説明する。
図15は、検知装置100が、繊維シート200に血液が垂れたこと、及び、血液以外の液体が垂れたことを検知する処理手順の例を示すフローチャートである。
同図の処理にて、検知信号出力部191は、変数i(iは、i≧1の正整数)の初期値及び変数jの初期値を設定する(ステップS101)。具体的には、検知信号出力部191は、i=1、j=1とする。ここで、変数iは、周波数特性取得部120が第一導電体210と第二導電体220との間のインピーダンスを測定するサンプリング回数を示す変数である。また、変数jは、検知信号出力部191がインピーダンス測定値に基づいてインピーダンス比率を算出する算出回数を示す変数である。
図15は、検知装置100が、繊維シート200に血液が垂れたこと、及び、血液以外の液体が垂れたことを検知する処理手順の例を示すフローチャートである。
同図の処理にて、検知信号出力部191は、変数i(iは、i≧1の正整数)の初期値及び変数jの初期値を設定する(ステップS101)。具体的には、検知信号出力部191は、i=1、j=1とする。ここで、変数iは、周波数特性取得部120が第一導電体210と第二導電体220との間のインピーダンスを測定するサンプリング回数を示す変数である。また、変数jは、検知信号出力部191がインピーダンス測定値に基づいてインピーダンス比率を算出する算出回数を示す変数である。
次に、周波数特性取得部120は、第一導電体210と第二導電体220との間のインピーダンス測定値を取得する(ステップS102)。具体的には、交流信号出力部110が、第一導電体210と第二導電体220との間に、所定の第1周波数の交流信号、第2周波数(第1周波数と異なる所定の周波数)の交流信号をそれぞれ入力する。そして、周波数特性取得部120は、第1周波数の交流信号を入力した場合、第2周波数の交流信号を入力した場合それぞれについて、第一導電体210と第二導電体220との間のインピーダンスを測定する。なお、第1周波数は第2周波数よりも低周波であるとする。
なお、以下では、ステップS102で検知装置100が第1周波数を入力した場合、第2周波数を入力した場合それぞれについて、インピーダンスを複数回測定する。1回の測定でも検知装置100は血液の検出及び血液以外の液体を検知し得るが、複数回測定することで、ノイズによる誤検知を低減させることができる。以下では、i番目のサンプリングにて交流信号出力部110が第1周波数の交流信号を入力した場合のインピーダンス測定値をZa(i)と表記し、第2周波数の交流信号を入力した場合のインピーダンス測定値をZb(i)と表記する。周波数特性取得部120は、取得したインピーダンス測定値Za(i)及びZb(i)を記憶部180に記憶させる。
なお、以下では、ステップS102で検知装置100が第1周波数を入力した場合、第2周波数を入力した場合それぞれについて、インピーダンスを複数回測定する。1回の測定でも検知装置100は血液の検出及び血液以外の液体を検知し得るが、複数回測定することで、ノイズによる誤検知を低減させることができる。以下では、i番目のサンプリングにて交流信号出力部110が第1周波数の交流信号を入力した場合のインピーダンス測定値をZa(i)と表記し、第2周波数の交流信号を入力した場合のインピーダンス測定値をZb(i)と表記する。周波数特性取得部120は、取得したインピーダンス測定値Za(i)及びZb(i)を記憶部180に記憶させる。
次に、検知信号出力部191は、i≧Nか否かを判定する(ステップS103)。ここで、定数N(Nは、N≧1の正整数)は、検知信号出力部191がインピーダンス測定値の移動平均を算出するのに用いるデータ数として予め設定されている定数である。
i<Nであると判定した場合(ステップS103:NO)、検知信号出力部191は、iの値に1を加算(i:=i+1)する(ステップS141)。
ステップS141の後、ステップS102へ戻る。
i<Nであると判定した場合(ステップS103:NO)、検知信号出力部191は、iの値に1を加算(i:=i+1)する(ステップS141)。
ステップS141の後、ステップS102へ戻る。
一方、i≧Nであると判定した場合(ステップS103:YES)、検知信号出力部191は、ステップS102で得られたインピーダンス測定値の移動平均を算出する(ステップS104)。具体的には、検知信号出力部191は、周波数特性取得部120が取得した、第1周波数の交流信号入力でのインピーダンス測定値のうち直近N個分(Za(i-N+1)~Za(i))の移動平均Za_mean(i)を算出する。また、検知信号出力部191は、周波数特性取得部120が取得した、第2周波数の交流信号入力でのインピーダンス測定値のうち直近N個分(Zb(i-N+1)~Zb(i))の移動平均Zb_mean(i)を算出する。検知信号出力部191は、算出した移動平均Za_mean(i)及びZb_mean(i)を記憶部180に記憶させる。
なお、記憶部180は、ステップS102で周波数特性取得部120が取得したインピーダンス測定値を全て記憶しておく必要はない。記憶部180は、第1周波数の交流信号入力でのインピーダンス測定値のうち直近N個分(Za(i-N+1)~Za(i))と、第2周波数の交流信号入力でのインピーダンス測定値のうち直近N個分(Zb(i-N+1)~Zb(i))とを記憶知れていればよい。
また、記憶部180は、ステップS104で検知信号出力部191が算出した移動平均を全て記憶しておく必要はない。記憶部180は、第1周波数の交流信号入力でのインピーダンス測定値の移動平均のうち直近1個分Za_mean(i)と、第2周波数の交流信号入力でのインピーダンス測定値の移動平均のうち直近1個分Zb_mean(i)とを記憶していればよい。
また、記憶部180は、ステップS104で検知信号出力部191が算出した移動平均を全て記憶しておく必要はない。記憶部180は、第1周波数の交流信号入力でのインピーダンス測定値の移動平均のうち直近1個分Za_mean(i)と、第2周波数の交流信号入力でのインピーダンス測定値の移動平均のうち直近1個分Zb_mean(i)とを記憶していればよい。
次に、検知信号出力部191は、ステップS104で得られたインピーダンス測定値の移動平均Za_mean(i)及びZb_mean(i)に基づいてインピーダンス比率Zmean(i)を算出し、Z(j)に格納する(ステップS105)。具体的には、検知信号出力部191は、インピーダンス測定値の移動平均Za_mean(i)をインピーダンス測定値の移動平均Zb_mean(i)で除算して、インピーダンス比率Zmean(i)を算出する。そして、検知信号出力部191は、算出したインピーダンス比率Zmean(i)を、インピーダンス比率Z(j)として記憶部180に記憶させる。
次に、検知信号出力部191は、j≧Mか否かを判定する(ステップS106)。ここで、定数M(Mは、M≧2の正整数)は、検知信号出力部191が繊維シート200への液体の滴下の有無を判定するのに用いるデータ数として予め設定されている定数である。
なお、記憶部180は、ステップS105で検知信号出力部191が算出したインピーダンス比率のうち、少なくとも直近M個分(Z(j-M+1)~Z(j))を記憶しておく。記憶部180が、ステップS105で検知信号出力部191が算出したインピーダンス比率を全て(Z(1)~Z(j))記憶しておくようにしてもよい。
なお、記憶部180は、ステップS105で検知信号出力部191が算出したインピーダンス比率のうち、少なくとも直近M個分(Z(j-M+1)~Z(j))を記憶しておく。記憶部180が、ステップS105で検知信号出力部191が算出したインピーダンス比率を全て(Z(1)~Z(j))記憶しておくようにしてもよい。
j<Mであると判定した場合(ステップS106:NO)、検知信号出力部191は、i、jそれぞれの値に1を加算(i:=i+1、j:=j+1)する(ステップS151)。
ステップS151の後、ステップS102へ戻る。
ステップS151の後、ステップS102へ戻る。
一方、j≧Mであると判定した場合(ステップS106:YES)、検知信号出力部191は、ステップS106で得られた直近M個のインピーダンス比率が全て液体検知閾値以下か否かを判定する(ステップS107)。すなわち、検知信号出力部191は、Z(j-M+1)≦液体検知判定閾値、・・・、かつ、Z(j)≦液体検知判定閾値か否かを判定する(ステップS107)。
直近M個のインピーダンス比率のいずれかが液体検知閾値より大きいと判定した場合(ステップS107:NO)、ステップS151へ遷移する。
直近M個のインピーダンス比率のいずれかが液体検知閾値より大きいと判定した場合(ステップS107:NO)、ステップS151へ遷移する。
一方、直近M個のインピーダンス比率が全て液体検知閾値以下であると判定した場合(ステップS107:YES)、検知信号出力部191は、血液判定処理を行う(ステップS111)。ここでいう血液判定処理は、繊維シート200に垂れた液体が血液か否かの判定を行う処理である。
図16は、検知信号出力部191が血液判定処理を行う手順を示すフローチャートである。検知信号出力部191は、図15のステップS111にて図16の処理を行う。
図16の処理にて、検知信号出力部191は、図15のステップS105で得られた直近のインピーダンス比率Z(j)が所定のインピーダンス比率閾値以上か否かを判定する(ステップS201)。
図16の処理にて、検知信号出力部191は、図15のステップS105で得られた直近のインピーダンス比率Z(j)が所定のインピーダンス比率閾値以上か否かを判定する(ステップS201)。
直近のインピーダンス比率Z(j)がインピーダンス比率閾値以上であると判定した場合(ステップS201:YES)、検知信号出力部191は、図15のステップS105で得られた直近M個のインピーダンス比率Z(j-M+1)~Z(j)から時間微分の平均値Z(j)div_meanを算出する(ステップS211)。
具体的には検知信号出力部191は、インピーダンス比率Z(j-M+2)からインピーダンス比率Z(j-M+1)を減算した差を、図15のステップS102でのインピーダンス測定の時間間隔(サンプリング周期)で除算して、インピーダンス比率Z(j-M+1)の時間微分を算出する。検知信号出力部191は、このように、インピーダンス比率Z(j-M+k+1)からインピーダンス比率Z(j-M+k)を減算した差を、図15のステップS102でのインピーダンス測定の時間間隔で除算してインピーダンス比率Z(j-M+k)の時間微分を算出する処理を、1≦k≦M-1となる全ての正整数kについて行う。
そして、検知信号出力部191は、得られた全ての時間微分(インピーダンス比率Z(j-M+1)の時間微分~インピーダンス比率Z(j-1)の時間微分)の平均値を算出して、時間微分の平均値Z(j)div_meanとする。
そして、検知信号出力部191は、ステップS211で得られたインピーダンス比率の時間微分Z(j)div_meanが所定の時間微分閾値以上か否かを判定する(ステップS212)。
インピーダンス比率の時間微分Z(j)div_meanが時間微分閾値以上であると判定した場合(ステップS212:YES)、検知信号出力部191は、繊維シート200に垂れた液体は血液であると判定する(ステップS221)。
ステップS221の後、図16の処理を終了し、図15の処理に戻る。
インピーダンス比率の時間微分Z(j)div_meanが時間微分閾値以上であると判定した場合(ステップS212:YES)、検知信号出力部191は、繊維シート200に垂れた液体は血液であると判定する(ステップS221)。
ステップS221の後、図16の処理を終了し、図15の処理に戻る。
一方、ステップS221にて、インピーダンス比率の時間微分Z(j)div_meanが時間微分閾値未満であると判定した場合(ステップS212:NO)、検知信号出力部191は、繊維シート200に垂れた液体は血液以外の液体であると判定する(ステップS231)。
ステップS231の後、図16の処理を終了し、図15の処理に戻る。
一方、ステップS201でインピーダンス比率Z(j)がインピーダンス比率閾値未満であると判定した場合(ステップS201:NO)、ステップS231へ遷移する。
ステップS231の後、図16の処理を終了し、図15の処理に戻る。
一方、ステップS201でインピーダンス比率Z(j)がインピーダンス比率閾値未満であると判定した場合(ステップS201:NO)、ステップS231へ遷移する。
図15の処理に戻って、ステップS111での血液判定処理を終了すると、検知信号出力部191は、ステップS111での判定結果に基づいて条件分岐を行う(ステップS112)。具体的には、検知信号出力部191は、繊維シート200に垂れた液体が血液であると判定したか否かで条件分岐を行う。
繊維シート200に垂れた液体が血液であると判定した場合(ステップS112:YES)、警報出力部130が、漏血検知警報を出力する(ステップS121)。ここでいう漏血検知警報は、繊維シート200に血液が垂れたことを示す警報である。
ステップS121では、検知信号出力部191が、繊維シート200に血液が垂れたことを示す検知信号を警報出力部130へ出力する。そして、警報出力部130は、検知信号出力部191からの検知信号に従って、漏血検知警報を出力する。
ステップS121の後、図15の処理を終了する。
繊維シート200に垂れた液体が血液であると判定した場合(ステップS112:YES)、警報出力部130が、漏血検知警報を出力する(ステップS121)。ここでいう漏血検知警報は、繊維シート200に血液が垂れたことを示す警報である。
ステップS121では、検知信号出力部191が、繊維シート200に血液が垂れたことを示す検知信号を警報出力部130へ出力する。そして、警報出力部130は、検知信号出力部191からの検知信号に従って、漏血検知警報を出力する。
ステップS121の後、図15の処理を終了する。
一方、繊維シート200に垂れた液体が血液以外の液体であると判定した場合(ステップS122:NO)、警報出力部130が、液体検知予備警報を出力する(ステップS131)。ここでいう液体検知予備警報は、繊維シート200に血液以外の液体が垂れたことを示す警報である。
ステップS122では、検知信号出力部191が、繊維シート200に血液以外の液体が垂れたことを示す検知信号を警報出力部130へ出力する。そして、警報出力部130は、検知信号出力部191からの検知信号に従って、液体検知予備警報を出力する。
ステップS131の後、図15の処理を終了する。
なお、検知装置100が図15の処理を繰り返し行うようにしてもよい。これにより、検知装置100は、繊維シート200に血液以外の液体が垂れたことを検知した後、さらに繊維シート200に血液が垂れた場合に、当該血液が垂れたことを検知することができる。
ステップS122では、検知信号出力部191が、繊維シート200に血液以外の液体が垂れたことを示す検知信号を警報出力部130へ出力する。そして、警報出力部130は、検知信号出力部191からの検知信号に従って、液体検知予備警報を出力する。
ステップS131の後、図15の処理を終了する。
なお、検知装置100が図15の処理を繰り返し行うようにしてもよい。これにより、検知装置100は、繊維シート200に血液以外の液体が垂れたことを検知した後、さらに繊維シート200に血液が垂れた場合に、当該血液が垂れたことを検知することができる。
なお、検知装置100又は人が、Cole-Cole軌跡を用いて血液と血液以外の液体とを区別するようにしてもよい。例えば、検知信号出力部191が、図16のステップS201での、繊維シート200に垂れた液体が血液か否かをインピーダンス比率の平均値と閾値との比較にて判定する処理に代えて、Cole-Cole軌跡を用いて当該判定を行うようにしてもよい。Cole-Cole軌跡を用いて血液と血液以外の液体とを区別する処理について図17及び図18を参照して説明する。
なお、図17の説明及び図18の説明では、インピーダンスを、レジスタンス(Resistance)を実部に含み、リアクタンス(Reactance)を虚部に含む複素数で示す。
なお、図17の説明及び図18の説明では、インピーダンスを、レジスタンス(Resistance)を実部に含み、リアクタンス(Reactance)を虚部に含む複素数で示す。
図17は、インピーダンスの測定にて得られるCole-Cole軌跡の例を示す説明図である。同図に示すグラフの横軸はインピーダンスの実部を示し、縦軸はインピーダンスの虚部を示す。なお、図17では、規格化されたインピーダンス値(インピーダンス値を所定の大きさ(実数)で除算した値)を用いている。但し、インピーダンス値を規格化せず、インピーダンス値そのものに基づいてCole-Cole軌跡を求めるようにしてもよい。
同図の線L81は、インピーダンスの測定値をベクトルで示す。角度φは、入力信号とインピーダンス測定値との位相差を示す。このように、インピーダンスの大きさ(またはインピーダンスの実部の大きさ=レジスタンス)と位相差に基づいて、インピーダンス測定値をグラフにプロットすることができる。
また、線L82は、Cole-Cole軌跡を示す。ここで、Cole-Cole軌跡は円弧の一部の形状を有する。
Cole-Cole軌跡は、インピーダンス測定値から求められる。具体的には、繊維シート200への入力信号の周波数を変えて複数回、インピーダンスの大きさ(またはレジスタンス)と、位相差(角度φ)とを測定し、得られた測定値を円弧の一部で近似する(カーブフィッティングを行う)ことでCole-Cole軌跡を得る。インピーダンス測定値からCole-Cole軌跡を求める方法(カーブフィッティングを行う方法)として、例えば最小二乗法など公知の近似手法を用いることができる。Cole-Cole軌跡を求めるため、交流信号出力部110は、第一導電体210と第二導電体220との間に周波数の異なる少なくとも3つの交流信号を入力し、周波数特性取得部120は、第一導電体210と第二導電体220との間の周波数特性を、入力された交流信号毎に取得する。
点P11は、Cole-Cole軌跡を示す円弧の中心(当該円弧を円周の一部に含む円の中心)を示す。点P12、P13は、それぞれCole-Cole軌跡と横軸との交点である。2つある交点のうち、インピーダンスの実部が小さい方を点P12とし、インピーダンスの実部が大きい方を点P13とする。また、点P14は、Cole-Cole軌跡を示す円弧の中点である。従って、点P11と点P14とを結んだ線分(線L84)は、点P11と点P12(線L83)とを結んだ線分と、点P11と点P13とを結んだ線分のなす角を二等分する。
角度απ/2は、点P12と点P11(線L83)とを結んだ線分と横軸とのなす角である。
Cole-Cole軌跡は、式(1)のように示される。
角度απ/2は、点P12と点P11(線L83)とを結んだ線分と横軸とのなす角である。
Cole-Cole軌跡は、式(1)のように示される。

ここで、Z(f)は、周波数fの信号を入力した場合のインピーダンスを示す。R∞は、周波数無限大の信号を入力した場合のレジスタンス(インピーダンスの実部)を示す。R∞を実測することはできないので、Cole-Cole軌跡と横軸との交点(2つある交点のうち、レジスタンスが小さい方)から読み取る。図17の例では、点P12が示すレジスタンスを、R∞として用いる。
R0は、周波数0の信号、すなわち直流信号を入力した場合のレジスタンスを示す。R0を実測するようにしてもよいし、Cole-Cole軌跡と横軸との交点(2つある交点のうち、レジスタンスが大きい方)から読み取るようにしてもよい。図17の例では、点P13が示すレジスタンスを、R0として用いることができる。
また、fcは、点P14に対応する中心周波数(点P14が示すインピーダンス値を得られる入力周波数)を示す。
また、jは虚数単位を示す。αは、上述した角度απ/2をπ/2で除算して得られる値の係数を示す。
R0は、周波数0の信号、すなわち直流信号を入力した場合のレジスタンスを示す。R0を実測するようにしてもよいし、Cole-Cole軌跡と横軸との交点(2つある交点のうち、レジスタンスが大きい方)から読み取るようにしてもよい。図17の例では、点P13が示すレジスタンスを、R0として用いることができる。
また、fcは、点P14に対応する中心周波数(点P14が示すインピーダンス値を得られる入力周波数)を示す。
また、jは虚数単位を示す。αは、上述した角度απ/2をπ/2で除算して得られる値の係数を示す。
図18は、膜を有する液体のインピーダンスを模擬する等価回路モデルを示す説明図である。
Riは液体に含まれる膜を有する物体によるレジスタンスを示す。例えば液体が血液である場合、赤血球が膜を有する物体に該当する。Cmは、液体に含まれる膜を有する物体によるキャパシタンスを示す。なお、ここでのキャパシタンスは、図17におけるリアクタンスと同視できる。Reは、液体に含まれる膜を有する物体以外の物体によるレジスタンスを示す。例えば液体が血液である場合、血漿が膜を有する物体以外の物体に該当する。
Riは液体に含まれる膜を有する物体によるレジスタンスを示す。例えば液体が血液である場合、赤血球が膜を有する物体に該当する。Cmは、液体に含まれる膜を有する物体によるキャパシタンスを示す。なお、ここでのキャパシタンスは、図17におけるリアクタンスと同視できる。Reは、液体に含まれる膜を有する物体以外の物体によるレジスタンスを示す。例えば液体が血液である場合、血漿が膜を有する物体以外の物体に該当する。
ここでいう等価回路モデルは、モデル化対象(ここでは、膜を有する液体)のインピーダンスと等しい、又は、ほぼ等しいインピーダンスを示す電気回路である。等価回路を構成する素子として、電気抵抗(レジスタ)、コンデンサ(キャパシタ)及びコイル(リアクタ)のうち1つ以上を用いる。例えば、図18に示す等価回路モデルは、レジスタンスRiの電気抵抗、キャパシタンスCmのコンデンサ、及び、レジスタンスReの電気抵抗を用いて構成されている。
また、等価回路モデルを構成する素子のレジスタンス、キャパシタンス又はインピーダンスを回路パラメータと称する。例えば、図18に示す等価回路モデルでは、レジスタンスRi、キャパシタンスCm、レジスタンスReの各々が回路パラメータに該当する。
回路パラメータの値が変化すると、等価回路モデルのインピーダンスが変化する。検知信号出力部191又は人は、後述するように、等価回路モデルのインピーダンスがモデル化対象のインピーダンス測定値と等しくなる、又は、ほぼ等しくなる回路パラメータ値(回路パラメータの値)を算出する。
回路パラメータの値が変化すると、等価回路モデルのインピーダンスが変化する。検知信号出力部191又は人は、後述するように、等価回路モデルのインピーダンスがモデル化対象のインピーダンス測定値と等しくなる、又は、ほぼ等しくなる回路パラメータ値(回路パラメータの値)を算出する。
なお図18は、等価回路モデルの一例であり、より複雑な構造を有する等価回路モデルにおいても同手法を適用可能である。例えば、図18に示す1分散モデルに代えて、検知信号出力部191又は人が、2分散モデル又は3分散モデルを用いるようにしてもよい。
ここでいう1分散モデルは、電気抵抗とコンデンサ(又はコイル)との直列接続1つと電気抵抗とが並列接続された電気回路にて構成されるモデルである。一方、2分散モデルは、電気抵抗とコンデンサ(又はコイル)との直列接続2つと電気抵抗とが並列接続された電気回路にて構成されるモデルである。3分散モデルは、電気抵抗とコンデンサ(又はコイル)との直列接続3つと電気抵抗とが並列接続された電気回路にて構成されるモデルである。
ここでいう1分散モデルは、電気抵抗とコンデンサ(又はコイル)との直列接続1つと電気抵抗とが並列接続された電気回路にて構成されるモデルである。一方、2分散モデルは、電気抵抗とコンデンサ(又はコイル)との直列接続2つと電気抵抗とが並列接続された電気回路にて構成されるモデルである。3分散モデルは、電気抵抗とコンデンサ(又はコイル)との直列接続3つと電気抵抗とが並列接続された電気回路にて構成されるモデルである。
モデル化対象が血液である場合、赤血球は、1重の膜の構造になっていることから、1分散モデルを用いてモデル化対象のインピーダンスを模擬することができる。
一方、モデル化対象が動物細胞である場合、動物細胞は、細胞膜の中に核を有していることから2重の膜の構造になっている。このように、モデル化の対象が2重の膜の構造を有している場合、2分散モデルを用いてモデル化対象のインピーダンスを模擬することができる。また、モデル化の対象が3重の膜の構造を有している場合、3分散モデルを用いてインピーダンスを模擬することができる。
一方、モデル化対象が動物細胞である場合、動物細胞は、細胞膜の中に核を有していることから2重の膜の構造になっている。このように、モデル化の対象が2重の膜の構造を有している場合、2分散モデルを用いてモデル化対象のインピーダンスを模擬することができる。また、モデル化の対象が3重の膜の構造を有している場合、3分散モデルを用いてインピーダンスを模擬することができる。
検知信号出力部191又は人は、インピーダンス測定値から得られたCole-Cole軌跡に基づいて、モデルパラメータの値(レジスタンスRi、キャパシタンスCm及びレジスタンスReの値)を求める。
具体的には、Cole-Cole軌跡から求められるレジスタンスR0、レジスタンスR∞及び中心周波数fcを用いて、以下のようにレジスタンスRi、キャパシタンスCm及びレジスタンスReの値を求めることができる。
まず、レジスタンスReは、式(2)のように求められる。
具体的には、Cole-Cole軌跡から求められるレジスタンスR0、レジスタンスR∞及び中心周波数fcを用いて、以下のようにレジスタンスRi、キャパシタンスCm及びレジスタンスReの値を求めることができる。
まず、レジスタンスReは、式(2)のように求められる。
また、レジスタンスR∞は式(3)のように表される。

式(2)を式(3)に代入して式(4)を得られる。

また、中心周波数fcは式(5)のように示される。

式(5)を変形して式(6)を得られる。

検知信号出力部191又は人は、式(1)、(3)、(6)を用いて、それぞれインピーダンスRe、インピーダンスRi、キャパシタンスCmを算出する。
ここで、液体に含まれる膜や組織構造によってレジスタンスRi、キャパシタンスCm、レジスタンスReの値が異なる。そこで、これらの値から液体の種類を推定することができる。
例えば、検知信号出力部191又は人は、キャパシタンスCmと所定の閾値(血液検出用の閾値)とを比較することで、繊維シート200に垂れた液体(測定対象となっている液体)が血液か否かを判定する。キャパシタンスCmが血液検出用の閾値よりも大きい場合、検知信号出力部191又は人は、繊維シート200に垂れた液体は血液であると判定する。一方、キャパシタンスCmが血液検出用の閾値以下である場合、検知信号出力部191又は人は、繊維シート200に垂れた液体は血液以外の液体であると判定する。
なお、検知信号出力部191又は人が、等価回路モデルに含まれる全てのモデルパラメータの値を求めるようにしてもよいし、一部のモデルパラメータの値のみを求めるようにしてもよい。
例えば、図18の例で、検知信号出力部191又は人が、インピーダンスRe、インピーダンスRi、及び、キャパシタンスCmを算出し、それぞれの値と閾値とを比較して、繊維シート200に垂れた液体が血液か否かを判定するようにしてもよい。あるいは、検知信号出力部191又は人が、インピーダンスRe、インピーダンスRi、及び、キャパシタンスCmのうちキャパシタンスCmのみを算出し、上記のようにキャパシタンスCmと閾値とを比較して、繊維シート200に垂れた液体が血液か否かを判定するようにしてもよい。
例えば、図18の例で、検知信号出力部191又は人が、インピーダンスRe、インピーダンスRi、及び、キャパシタンスCmを算出し、それぞれの値と閾値とを比較して、繊維シート200に垂れた液体が血液か否かを判定するようにしてもよい。あるいは、検知信号出力部191又は人が、インピーダンスRe、インピーダンスRi、及び、キャパシタンスCmのうちキャパシタンスCmのみを算出し、上記のようにキャパシタンスCmと閾値とを比較して、繊維シート200に垂れた液体が血液か否かを判定するようにしてもよい。
なお、Cole-Cole軌跡を求めるために周波数の異なる少なくとも3つの交流信号を入力する方法として、導電体間にパルス信号またはステップ信号を入力するようにしてもよい。この場合、インピーダンス測定値をフーリエ変換することで、異なる入力周波数毎のインピーダンス測定値を得られる。
これにより、周波数を変化させながら導電体間に交流信号を入力する場合よりも、導電体間への信号の入力に要する時間が短くてすむ。
これにより、周波数を変化させながら導電体間に交流信号を入力する場合よりも、導電体間への信号の入力に要する時間が短くてすむ。
あるいは、Cole-Cole軌跡を求めるために周波数の異なる少なくとも3つの交流信号を入力する方法として、異なる周波数の正弦波を3つ以上重ね合わせた信号を導電体間に入力するようにしてもよい。この場合も、インピーダンス測定値をフーリエ変換することで、異なる入力周波数毎のインピーダンス測定値を得られる。
これにより、周波数を変化させながら導電体間に交流信号を入力する場合よりも、導電体間への信号の入力に要する時間が短くてすむ。
これにより、周波数を変化させながら導電体間に交流信号を入力する場合よりも、導電体間への信号の入力に要する時間が短くてすむ。
以上のように、交流信号出力部110は、繊維シートに設けられた複数の導電体間に周波数の異なる少なくとも3つの交流信号を入力する交流信号入力ステップを実行する。あるいは、人が複数の導電体間に周波数可変の交流信号出力装置(交流電源)を接続して交流信号入力ステップを実行するようにしてもよい。
そして、周波数特性取得部120は、交流信号入力ステップで入力した交流信号毎に導電体間のインピーダンス測定値を取得するインピーダンス測定値取得ステップを実行する。あるいは、人がインピーダンス測定装置(例えばオシロスコープ)を用いてインピーダンス測定値取得ステップを実行するようにしてもよい。
そして、周波数特性取得部120は、交流信号入力ステップで入力した交流信号毎に導電体間のインピーダンス測定値を取得するインピーダンス測定値取得ステップを実行する。あるいは、人がインピーダンス測定装置(例えばオシロスコープ)を用いてインピーダンス測定値取得ステップを実行するようにしてもよい。
そして、検知信号出力部191は、インピーダンス測定値取得ステップで得られたインピーダンス測定値を円弧の一部で近似するCole-Cole軌跡を求めるCole-Cole軌跡取得ステップを実行する。あるいは、人がCole-Cole軌跡取得ステップを実行するようにしてもよい。
そして、検知信号出力部191は、膜を有する液体のインピーダンスを模擬する所定の等価回路モデルにおけるキャパシタンスをCole-Cole軌跡に基づいて求めるキャパシタンス取得ステップを実行する。あるいは人が、キャパシタンス取得ステップを実行するようにしてもよい。
そして、検知信号出力部191は、得られたキャパシタンスに基づいて液体の種類を推定する液体種類推定ステップを実行する。あるいは人が、液体種類推定ステップを実行するようにしてもよい。
これにより、検知信号出力部191又は人は、繊維シート200に血液が垂れたか否かの判定を高精度に行うことができる。
なお、検知信号出力部191が、繊維シート200に血液が垂れたと液体種類推定ステップで判定した場合、警報出力部130が漏血検知警報を出力するようにしてもよい。
なお、検知信号出力部191又は人が、繊維シート200に垂れた液体が血液以外の所定の液体か否かを判定するようにしてもよい。例えば、繊維シート200に牛乳が垂れた場合、キャパシタンスCmは血液の場合よりも小さくなる。そこで、検知信号出力部191又は人は、血液検出用の閾値とキャパシタンスCmとの比較に加えて、牛乳検出用の閾値として予め定められている血液検出用の閾値よりも小さい値の閾値と、キャパシタンスCmとを比較する。キャパシタンスCmが牛乳検出用の閾値よりも大きく、かつ、血液検出用の閾値以下である場合、検知信号出力部191又は人は、繊維シート200に垂れた液体は牛乳であると判定する。
以上のように、交流信号出力部110が導電体間(第一導電体210と、第二導電体220との間)に周波数の異なる複数の交流信号を入力し、周波数特性取得部120が取得した周波数特性が交流信号出力部110からの交流信号の周波数の相違に応じて所定の相違を示し、かつ、交流信号出力部110が導電体間に交流信号を複数回入力し、周波数特性取得部120が取得した周波数特性が交流信号出力部110からの交流信号の入力の時間経過に応じて所定の変化を示す場合、検知信号出力部191が検知信号(漏血検知警報)を出力する。
このように、検知信号出力部191が、導電体間に入力される交流信号の周波数の相違による導電体間の周波数特性の相違と、時間経過による導電体間の周波数特定の変化との両方に基づいて、検知信号を出力するか否かを判定することで、繊維シートに垂れた液体が所定の液体(例えば血液)か否かを高精度に判定することができ、検知信号を誤って出力する可能性を低減させることができる。
このように、検知信号出力部191が、導電体間に入力される交流信号の周波数の相違による導電体間の周波数特性の相違と、時間経過による導電体間の周波数特定の変化との両方に基づいて、検知信号を出力するか否かを判定することで、繊維シートに垂れた液体が所定の液体(例えば血液)か否かを高精度に判定することができ、検知信号を誤って出力する可能性を低減させることができる。
また、検知信号出力部191又は人は、導電体間(第一導電体210と第二導電体220との間)のインピーダンス測定値を円弧の一部で近似するCole-Cole軌跡を求める。そして、検知信号出力部191又は人は、膜を有する液体のインピーダンスを模擬する所定の等価回路モデルにおけるキャパシタンスをCole-Cole軌跡に基づいて求め、得られたキャパシタンスから液体の種類を推定する。
このように、繊維シート200に垂れた液体のインピーダンスをモデルで模擬してキャパシタンスを求めることで、検知信号出力部191又は人は、繊維シート200に垂れた液体が所定の液体(例えば血液)か否かの判定を高精度に行うことができる。
このように、繊維シート200に垂れた液体のインピーダンスをモデルで模擬してキャパシタンスを求めることで、検知信号出力部191又は人は、繊維シート200に垂れた液体が所定の液体(例えば血液)か否かの判定を高精度に行うことができる。
なお、検知装置100又は人が、入力信号の周波数とインピーダンス測定値との関係を近似する直線の傾きに基づいて血液と血液以外の液体とを区別するようにしてもよい。例えば、検知信号出力部191が、図16のステップS201での、繊維シート200に垂れた液体が血液か否かをインピーダンス比率の平均値と閾値との比較にて判定する処理に代えて、上記の直線の傾きに基づいて血液と血液以外の液体とを区別するようにしてもよい。上記の直線の傾きに基づいて血液と血液以外の液体とを区別する処理について図19を参照して説明する。
図19は、ある周波数帯域において、入力信号の周波数とインピーダンス測定値との関係を近似する直線の例を示す説明図である。同図に示すグラフの横軸は入力信号の周波数(入力周波数)を示し、縦軸はインピーダンス(インピーダンスの大きさ)を示す。
線L91は、血液に対する入力信号の周波数とインピーダンス測定値との関係を近似する直線の例を示す。具体的には、点P911、P912、P913、P914は、それぞれ、血液に交流信号を入力した場合の、入力周波数とその周波数でのインピーダンスとの関係を示す。線L91は、点P911、P912、P913、P914を直線近似して得られる線である。
線L91は、血液に対する入力信号の周波数とインピーダンス測定値との関係を近似する直線の例を示す。具体的には、点P911、P912、P913、P914は、それぞれ、血液に交流信号を入力した場合の、入力周波数とその周波数でのインピーダンスとの関係を示す。線L91は、点P911、P912、P913、P914を直線近似して得られる線である。
また、線L92は、食塩水に対する入力信号の周波数とインピーダンス測定値との関係を近似する直線の例を示す。具体的には、点P921、P922、P923、P924は、それぞれ、食塩水に交流信号を入力した場合の、入力周波数とその周波数でのインピーダンスとの関係を示す。線L92は、点P921、P922、P923、P924を直線近似して得られる線である。
線L91に例示されるように、血液の場合は、近似直線の傾きが負の値になる。すなわち、血液は、入力周波数が高いほど小さいインピーダンスを示し、これにより、血液の場合の近似直線は右下がりになる。これに対し、線L92に例示されるように、食塩水の場合は、近似直線の傾きの大きさは、血液の場合よりも小さくなる。すなわち、食塩水の場合は、入力周波数の変化に対するインピーダンスの変化の大きさが小さく、これにより、食塩水の場合の近似直線は、血液の場合と比較すると水平(横軸と平行)に近い。
そこで、検知装置100又は人が、入力信号の周波数とインピーダンス測定値との関係を近似する直線の傾きに基づいて血液と血液以外の液体とを区別する。
例えば、検知装置100の記憶部180は、近似直線の傾きの閾値を負の実数の定数にて予め記憶しておく。そして、検知装置100の検知信号出力部191は、測定対象物への入力信号の周波数とインピーダンス測定値との関係を直線近似する線の傾きを求める。直線近似の方法としては、例えば最小二乗法を用いることができるが、これに限らない。また近似式は一次関数に限らず、多次関数、指数関数、対数関数、ロジスティック曲線などによる曲線近似を用いてもよい。そして、検知信号出力部191は、得られた傾きと閾値とを比較し、傾きが閾値よりも小さい場合(すなわち、傾きの大きさが閾値の大きさよりも大きい場合)、血液を検知したと判定する。一方、傾きが閾値以上である場合(すなわち、傾きの大きさが閾値の大きさ以下である場合)、検知信号出力部191は、血液を検知していないと判定する。
例えば、検知装置100の記憶部180は、近似直線の傾きの閾値を負の実数の定数にて予め記憶しておく。そして、検知装置100の検知信号出力部191は、測定対象物への入力信号の周波数とインピーダンス測定値との関係を直線近似する線の傾きを求める。直線近似の方法としては、例えば最小二乗法を用いることができるが、これに限らない。また近似式は一次関数に限らず、多次関数、指数関数、対数関数、ロジスティック曲線などによる曲線近似を用いてもよい。そして、検知信号出力部191は、得られた傾きと閾値とを比較し、傾きが閾値よりも小さい場合(すなわち、傾きの大きさが閾値の大きさよりも大きい場合)、血液を検知したと判定する。一方、傾きが閾値以上である場合(すなわち、傾きの大きさが閾値の大きさ以下である場合)、検知信号出力部191は、血液を検知していないと判定する。
さらに例えば、記憶部180は、閾値の値を、-0.000001(-1×10⁻⁶)と記憶しておく。そして、得られた傾きが-0.000004(-4×10⁻⁶)であった場合、検知信号出力部191は、血液を検知したことを示す検知信号を出力する。すなわち、検知信号出力部191は、血液を検知した判定する。
一方、得られた傾きが-0.0000008(-8×10⁻⁷)であった場合、検知信号出力部191は、検知信号の出力を抑制する。すなわち、検知信号出力部191は、血液を検知していないと判定する。
一方、得られた傾きが-0.0000008(-8×10⁻⁷)であった場合、検知信号出力部191は、検知信号の出力を抑制する。すなわち、検知信号出力部191は、血液を検知していないと判定する。
このように、検知信号出力部191は、入力信号の周波数とインピーダンス測定値との関係を近似する直線の傾きを求め、得られた傾きと閾値とを比較するという比較的簡単な処理で、血液など所定の液体を検出したか否かを判定することができる。この点で、検知信号出力部191の負荷を低減させることができる。
さらに、図16のステップS211からS212において近似直線または近似曲線の傾きなどの時間変化を用いて血液などの検知判定を行うようにしてもよい。
さらに、図16のステップS211からS212において近似直線または近似曲線の傾きなどの時間変化を用いて血液などの検知判定を行うようにしてもよい。
次に、図20を参照して、第一導電体210として機能する第一導電性糸231、及び第二導電体220として機能する第二導電性糸233を有する包帯状の繊維シート200の詳細構造について説明する。
包帯状の繊維シート200は、例えば人工透析時に針を穿刺される腕など漏血監視対象部位に巻きつけて用いられる。その際、繊維シート200を任意の長さに切断可能であり、導電性糸231、233の端部の一方において2つの導電性糸231、233をそれぞれ交流信号出力部110に接続することで、図1の構成とすることができる。これにより、検知装置100は、上述したように漏血を検知することができる。
図20に示すように、繊維シート200は、吸水性を有する絶縁性の繊維シート本体201に、センサ繊維230が波状に蛇行して編み込まれて(縫い付けられて)構成されている。
包帯状の繊維シート200は、例えば人工透析時に針を穿刺される腕など漏血監視対象部位に巻きつけて用いられる。その際、繊維シート200を任意の長さに切断可能であり、導電性糸231、233の端部の一方において2つの導電性糸231、233をそれぞれ交流信号出力部110に接続することで、図1の構成とすることができる。これにより、検知装置100は、上述したように漏血を検知することができる。
図20に示すように、繊維シート200は、吸水性を有する絶縁性の繊維シート本体201に、センサ繊維230が波状に蛇行して編み込まれて(縫い付けられて)構成されている。
センサ繊維230の端部の一方において2本の導電性糸231、233をそれぞれ交流信号出力部110に接続することで、図1の構成とすることができる。これにより、検知装置100は、上述したように漏血を検知することができる。特に、センサ繊維230を蛇行させて配置することで、検知装置100は、繊維シート200の様々な部分において、漏血など液体の染み込みを検知することができる。
2つの導電性糸231、233が絶縁用木綿232によって互いに接触しないように配置されたセンサ繊維230を用いることで、1本のセンサ繊維230を繊維シート本体201に編み込んで、または縫い付けて繊維シート200を構成することができる。
これにより、2つの導電体を比較的狭い間隔で配置することができ、液体が繊維シート200に染み込んだ際に、検知信号出力部191の検知精度を高めることができる。
しかも、2つの導電体(導電性糸231、233)を、互いに接触しないように、かつ、比較的狭い間隔で、包帯または繊維シート等にそれぞれ編み込む、または縫い付ける場合よりも簡単に繊維シート200を生成することができる。これにより、繊維シート200の製造コストを低減させることができる。
これにより、2つの導電体を比較的狭い間隔で配置することができ、液体が繊維シート200に染み込んだ際に、検知信号出力部191の検知精度を高めることができる。
しかも、2つの導電体(導電性糸231、233)を、互いに接触しないように、かつ、比較的狭い間隔で、包帯または繊維シート等にそれぞれ編み込む、または縫い付ける場合よりも簡単に繊維シート200を生成することができる。これにより、繊維シート200の製造コストを低減させることができる。
次に、センサ繊維230を含んだ包帯状の繊維シート200の製造方法について説明する。
センサ繊維230を編み込んだ繊維シート200は、以下の三つのパターンで製造することができる。
(パターンA)
パターンAの繊維シート200(包帯)は、構成要素として(1)経糸、(2)弾性糸、(3)緯糸、及び(4)センサ繊維、を有している。
次に、パターンAの繊維シート200の製造方法を説明する。まず、伸縮性を有する糸(例えば、ポリウレタンを芯材としたカバーリング糸)を経糸として編目を作り、弾性糸(例えば、ポリウレタンを芯材としたカバーリング糸)を挿入しながら緯糸を編み込んだものをベース生地となる繊維シート本体201(伸縮性包帯)とする。この繊維シート本体201に、センサ繊維を挿入編み込みしてパターンAの繊維シート200とする。
(パターンB)
パターンBの繊維シート200は、構成要素として(1)経糸、(2)弾性糸、(3)緯糸、及び(4)センサ繊維、を有している。パターンBの繊維シート200は、経糸として非伸縮性の糸を使用する以外は、パターンBの繊維シート200と同様の構成である。
パターンBの繊維シート200は、構成要素として(1)経糸、(2)弾性糸、(3)緯糸、及び(4)センサ繊維、を有している。パターンBの繊維シート200は、経糸として非伸縮性の糸を使用する以外は、パターンBの繊維シート200と同様の構成である。
(パターンC)
パターンCの繊維シート200は、構成要素として(1)経糸、(2)緯糸、及び(3)センサ繊維、を有している。即ち、パターンCの繊維シート200は、弾性糸を用いない繊維シート200である。
次に、パターンCの繊維シート200の製造方法を説明する。まず、伸縮性を有する糸(例えば、ポリウレタンを芯材としたカバーリング糸)を経糸として編目を作り、緯糸を編み込んだものをベース生地となる繊維シート本体201とする。この繊維シート本体201に、センサ繊維を挿入編み込みしてパターンCの繊維シート200とする。
パターンCの繊維シート200は、構成要素として(1)経糸、(2)緯糸、及び(3)センサ繊維、を有している。即ち、パターンCの繊維シート200は、弾性糸を用いない繊維シート200である。
次に、パターンCの繊維シート200の製造方法を説明する。まず、伸縮性を有する糸(例えば、ポリウレタンを芯材としたカバーリング糸)を経糸として編目を作り、緯糸を編み込んだものをベース生地となる繊維シート本体201とする。この繊維シート本体201に、センサ繊維を挿入編み込みしてパターンCの繊維シート200とする。
次に、パターンAの繊維シート200を例に、包帯状の繊維シート200の製造方法の詳細を説明する。図21は、包帯状の繊維シート200の経糸の編組織を示した図である。
まず、図21に示すように、経糸のニッティング方法は、図21(a)に示すオープンクロッシェ、図21(b)に示すクローズクロッシェ、図21(c)に示すクローズトリコット、図21(d)に示すオープントリコット、のいずれかを採用することができる。また、これらを組み合わせてもよい。トリコット編みに関しては、図21に示すように、隣り合う編み針にニットするだけでなく、1針飛ばしや2針飛ばしとしてもよい。
図21において、Nは編み針を示している。図21(a)から図21(d)は、縦方向Pの下方から時系列で上方へと編み工程が進んでいくことを示している。線S1は、編み針Nにかかる経糸の運びを示している。
まず、図21に示すように、経糸のニッティング方法は、図21(a)に示すオープンクロッシェ、図21(b)に示すクローズクロッシェ、図21(c)に示すクローズトリコット、図21(d)に示すオープントリコット、のいずれかを採用することができる。また、これらを組み合わせてもよい。トリコット編みに関しては、図21に示すように、隣り合う編み針にニットするだけでなく、1針飛ばしや2針飛ばしとしてもよい。
図21において、Nは編み針を示している。図21(a)から図21(d)は、縦方向Pの下方から時系列で上方へと編み工程が進んでいくことを示している。線S1は、編み針Nにかかる経糸の運びを示している。
図21(a)に示すオープンクロッシェ、及び図21(b)に示すクローズクロッシェは、左右方向に1本の編み針Nによって編成されている。図21(a)に示すように、オープンクロッシェでは、一番下に示すメインシャフト1回転目P1において左から右へ経糸S1がかかり、次のメインシャフト2回転目P2において、右から左へ経糸S1がかかる。次のメインシャフト3回転目P3において、左から右左へ経糸S1がかかり、以下、この経糸S1の運びが繰り返される。
図21(c)に示すクローズトリコット、及び図21(d)に示すオープントリコットは、左右方向に隣り合う2本の編み針Nによって編成されている。つまり、一本の経糸S1が、左の編み針Nにかかったり、右の編み針Nにかかったりを繰り返して編成している。具体的には、図21(d)に示すように、メインシャフト1回転目においては、左側の針Nに左から右へ経糸S1がかかり、メインシャフト2回転目においては、右側の隣り合う針Nに右から左へ経糸S1がかかる。メインシャフト3回転目以降は、この経糸S1の運びが繰り返される。
図21(b)に示すクローズクロッシェを用いて編むことによって、図21(e)に示すような編み紐ができる。この編み紐を緯糸でつなぎ合わせることによって、例えば、80mm幅の包袋状とすることができる。
次に、弾性糸S3を編み込む。図22に示すように、弾性糸S3は、コース方向(矢印C方向で示す伸縮方向、繊維シート200の長手方向)に対して1針に対して1編目ごとに交互に挿入させて編み込む。
緯糸S2の挿入方法は、例えば、以下の4つの方法を採用することができる。
緯糸S2の第1の挿入方法について説明する。緯糸S2の第1の挿入方法は、図23に示すように、繊維シート200の繊維シート本体201(ベース生地、図20参照)を形成する緯糸S2を1編目ごとに繊維シート200の両端を往復するように挿入させて繊維シート本体201を編成する方法である。
このような方法を採用することによって、より容易に包帯のベース生地となる繊維シート本体201を編成することができる。
緯糸S2の第1の挿入方法について説明する。緯糸S2の第1の挿入方法は、図23に示すように、繊維シート200の繊維シート本体201(ベース生地、図20参照)を形成する緯糸S2を1編目ごとに繊維シート200の両端を往復するように挿入させて繊維シート本体201を編成する方法である。
このような方法を採用することによって、より容易に包帯のベース生地となる繊維シート本体201を編成することができる。
緯糸S2の第2の挿入方法について説明する。緯糸S2の第2の挿入方法は、図24に示すように、繊維シート本体201を形成する緯糸S2を繊維シート200のウェール方向(矢印W方向で示す非伸縮方向、繊維シート200の巾方向)に並べて配置することで繊維シート本体201を編成する方法である。
緯糸S2の第3の挿入方法について説明する。緯糸S2の第3の挿入方法は、図25に示すように、繊維シート本体201を形成する緯糸S2を任意の編目ごとに振り方を変化させるように挿入させてベースとなる繊維シート本体201の任意の部分にメッシュMなどの特殊なベース生地を編成する方法である。
緯糸S2の第4の挿入方法について説明する。緯糸S2の第4の挿入方法は、図26に示すように、繊維シート本体201を形成する緯糸S2を任意の編目ごとに振り方を変化させるように挿入させて繊維シート本体201の任意の部分にボタンホールBHなどの特殊なベース生地を編成する方法である。
次に、センサ繊維230を編み込む。センサ繊維230の編み込み方法は、例えば、以下の2つの方法を採用することができる。
センサ繊維230の第1の編み込み方法について説明する。センサ繊維230の第1の編み込み方法は、図27に示すように、センサ繊維230を波形(サインカーブ状)となるように、任意の長さ、任意の周期で繊維シート200の中央部に挿入させて編成する方法である。
このような方法を採用することによって、バランス良くセンサ繊維230を配置することができる。なお、センサ繊維230の配置形状は、上記した波形に限らず、例えば、矩形波状としてもよい。
センサ繊維230の第1の編み込み方法について説明する。センサ繊維230の第1の編み込み方法は、図27に示すように、センサ繊維230を波形(サインカーブ状)となるように、任意の長さ、任意の周期で繊維シート200の中央部に挿入させて編成する方法である。
このような方法を採用することによって、バランス良くセンサ繊維230を配置することができる。なお、センサ繊維230の配置形状は、上記した波形に限らず、例えば、矩形波状としてもよい。
センサ繊維230の第2の編み込み方法について説明する。センサ繊維230の第2の編み込み方法は、図28に示すように、センサ繊維230を、例えば、繊維シート200の一方の端に挿入して、特定の部分でウェール方向Wの幅を大きくしたり、コース方向C方向の周期(繊維シート200の延在方向に隣り合うセンサ繊維230の間隔)を小さくしたりする方法である。即ち、センサ繊維230の波形の振幅、及び周期は、任意に変更してもよい。
このような方法を採用することによって、目的に応じたセンシングが可能となる。
このような方法を採用することによって、目的に応じたセンシングが可能となる。
次に、センサ繊維230が配置された繊維シート200と、検知装置100との接続方法について説明する。
センサ繊維230の第一導電性糸231(第一導電体210)及び第二導電性糸233(第二導電体220)と検知装置100との接続には、コネクタを使用する。以下、第一コネクタ60、第二コネクタ75、第三コネクタ90、及び第四コネクタ95を用いた、四種類の接続構造について説明する。
センサ繊維230の第一導電性糸231(第一導電体210)及び第二導電性糸233(第二導電体220)と検知装置100との接続には、コネクタを使用する。以下、第一コネクタ60、第二コネクタ75、第三コネクタ90、及び第四コネクタ95を用いた、四種類の接続構造について説明する。
まず、第一コネクタ60について説明する。
図29に示すように、第一コネクタ60は、ケーシング61と、ケーシング61の内部に配置されている基板62と、センサ繊維230と基板62とを接続する接続ユニット63と、を備えている。基板62は、ケーブルなどを介して検知装置100(図1参照)と接続されている。
接続ユニット63は、ベース部64と、ベース部64上に圧縮コイルばね65を介して載置されているセンサガイド66と、センサガイド66にセンサ繊維230と押し込む押込部材67と、押込部材67をセンサガイド66に押し込むロックレバー68と、を備えている。
図29に示すように、第一コネクタ60は、ケーシング61と、ケーシング61の内部に配置されている基板62と、センサ繊維230と基板62とを接続する接続ユニット63と、を備えている。基板62は、ケーブルなどを介して検知装置100(図1参照)と接続されている。
接続ユニット63は、ベース部64と、ベース部64上に圧縮コイルばね65を介して載置されているセンサガイド66と、センサガイド66にセンサ繊維230と押し込む押込部材67と、押込部材67をセンサガイド66に押し込むロックレバー68と、を備えている。
第一コネクタ60は、センサガイド66に形成されている凹溝69にセンサ繊維230を押し込んで、センサガイド66の凹溝69に配置された端子70、71を介して、センサ繊維230と基板62とを接続する。
図30に示すように、センサガイド66は、例えば、ポリアセタール樹脂などのプラスチックによって形成されている、ブロック状の部材である。センサガイド66の上面には、少なくとも1本の凹溝69が形成されている。凹溝69は、一方向に延在する端面U字状の溝であり、直線状に形成されている。図31に示すように、本実施形態の凹溝69は、センサガイド66の上面に2本設けられており、互いに交差している。
この理由は、図20のような包帯に波目状にセンサ繊維230が織り込まれた場合、包帯断面となる横方向からコネクタを挟んだ場合、センサ繊維230はその切断箇所によって「右斜め上方向」と「右斜め下方向」の二方向となるため、センサガイド69がどちらの向きでも一つのコネクタで対応できるようにしたからである。
凹溝69は、センサ繊維230の太さに対応した大きさを有している。凹溝69の長手方向と直交する方向の幅W2は、センサ繊維230の直径よりもやや小さく形成されている。即ち、凹溝69は、上方からセンサ繊維230を押し込むことによって、センサ繊維230が凹溝69内に固定されるように形成されている。センサガイド66の下面は、基板62と平行に配置されている。
図32に示すように、基板62からは複数の端子70、71が鉛直方向上方に突出している。複数の端子70、71は、少なくとも1本の中心導体用端子70と、少なくとも1本の外部導体用端子71と、から構成されている。端子70、71は、センサガイド66の下方からセンサガイド66に形成された貫通孔を介して凹溝69の内部空間に突出するように配置されている。センサガイド66は、圧縮コイルばね65によって支持されており、端子70、71は、上方からセンサガイド66を押圧することによって、凹溝69の内周面から突出する。
中心導体用端子70は、凹溝69の幅方向の中心に配置されている。換言すれば、中心導体用端子70は、凹溝69にセンサ繊維230を挿入するとともに、センサガイド66を上方から押圧することによって、中心導体用端子70がセンサ繊維230の中心近傍を刺すように配置されている。これによって、センサ繊維230の第一導電性糸231(図9、図10参照)と、検知装置100とが接続される。なお、中心導体用端子70の一部には、絶縁塗料Iが塗布されており、中心導体用端子70とセンサ繊維230の第二導電性糸233とが電気的に接続されないようになっている。
外部導体用端子71は、凹溝69の幅方向の中心よりも幅方向の外側に配置されている。換言すれば、外部導体用端子71は、凹溝69にセンサ繊維230を挿入するとともに、センサガイド66を上方から押圧することによって、外部導体用端子71がセンサ繊維230の中心よりも外周側を刺すように配置されている。これによって、センサ繊維230の第二導電性糸233と、検知装置100とが接続される。
上記第一コネクタ60を用いることによって、センサ繊維230の被覆を剥くなどすることなく、センサガイド66の凹溝69にセンサ繊維230を嵌め込むだけで、容易に導電性糸と検知装置100とを接続することができる。
なお、端子70、71の構成は、図32に示す構成に限ることはない。例えば、図33に示すように、中心導体用端子70の長さを短くしてもよい。
第一導電性糸231と第二導電性糸233とは、電気的に接続されないような構造となっているが、製造時に両電極間には固有のインピーダンス値を与えることができる。このため、万が一中心導体用端子70と外部導体用端子71がそれぞれの導電性糸と良好な接触がされない場合は、固有インピーダンス値以外の値を示すため、接触不良事故を未然に防ぐことができる。同様に、中心導体用端子70と外部導体用端子71が製造不良等で接触している場合は、極めて低いインピーダンス値を示すため、検出ミスを未然に防ぐことができる。
第一導電性糸231と第二導電性糸233とは、電気的に接続されないような構造となっているが、製造時に両電極間には固有のインピーダンス値を与えることができる。このため、万が一中心導体用端子70と外部導体用端子71がそれぞれの導電性糸と良好な接触がされない場合は、固有インピーダンス値以外の値を示すため、接触不良事故を未然に防ぐことができる。同様に、中心導体用端子70と外部導体用端子71が製造不良等で接触している場合は、極めて低いインピーダンス値を示すため、検出ミスを未然に防ぐことができる。
また、第一コネクタは、上記した構造に限らず、簡素化も可能である。
例えば、図34に示す第一コネクタ60Bのように、断面U字状の凹溝69Bが形成されたブロック形状のセンサガイド66Bと、蓋部材72のみを備える構成としてもよい。
凹溝69Bは、センサ繊維230の太さに対応した形状を有しており、センサ繊維230と基板62とを接続する端子70、71が配置されている。蓋部材72は、凹溝69Bにセンサ繊維230を押し込むとともに固定する部材である。蓋部材72の下面には、センサガイド66Bの上面に形成されたガイド穴74に差し込まれる突起73が形成されている。
例えば、図34に示す第一コネクタ60Bのように、断面U字状の凹溝69Bが形成されたブロック形状のセンサガイド66Bと、蓋部材72のみを備える構成としてもよい。
凹溝69Bは、センサ繊維230の太さに対応した形状を有しており、センサ繊維230と基板62とを接続する端子70、71が配置されている。蓋部材72は、凹溝69Bにセンサ繊維230を押し込むとともに固定する部材である。蓋部材72の下面には、センサガイド66Bの上面に形成されたガイド穴74に差し込まれる突起73が形成されている。
次に、第二コネクタ75について説明する。
図35に示すように、第二コネクタ75は、ベース部76と、ベース部76に回動自在に取り付けられたワイヤーストリッパー部77と、ベース部76に回動自在に取り付けられた端子部78と、を有している。
ワイヤーストリッパー部77は、所謂ワイヤーストリッパーの機能を有する部位である。図36に示すように、ワイヤーストリッパー部77は、回動軸81を中心に回動可能なワイヤーストリッパー部本体82と、第一丸穴刃79と、を有している。第一丸穴刃79は、ベース部76に固定されている第二丸穴刃80と協働してセンサ繊維230の導電性糸231を除く部位に切り込みを入れる半円溝状の刃である。
図35に示すように、第二コネクタ75は、ベース部76と、ベース部76に回動自在に取り付けられたワイヤーストリッパー部77と、ベース部76に回動自在に取り付けられた端子部78と、を有している。
ワイヤーストリッパー部77は、所謂ワイヤーストリッパーの機能を有する部位である。図36に示すように、ワイヤーストリッパー部77は、回動軸81を中心に回動可能なワイヤーストリッパー部本体82と、第一丸穴刃79と、を有している。第一丸穴刃79は、ベース部76に固定されている第二丸穴刃80と協働してセンサ繊維230の導電性糸231を除く部位に切り込みを入れる半円溝状の刃である。
端子部78は、回動軸81を中心に回動可能な端子部本体83と、第一導電性糸231と接続される中心導体用端子85と、第二導電性糸233と接続される外部導体用端子86と、回動軸81と一体に取り付けられたローラー84と、を有している。中心導体用端子85と外部導体用端子86とは、ケーブルなどを介して検知装置100(図1参照)と接続されている。
外部導体用端子86は、複数の針状から構成されている。外部導体用端子86をセンサ繊維230の外周面から押し付けることによって、外部導体用端子86が第二導電性糸233と接続される。
ローラー84は、円筒状をなし外周面に複数の細かい凹凸が形成されている(ローレット加工)。ローラー84は、回動軸81に偏心して取り付けられている。端子部78を図35に示す直立状態から、図36に示す倒れ状態とすることによって、ローラー84の外周面がベース部76の固定溝87に固定されているセンサ繊維230の外周面に食い込む。
ローラー84は、円筒状をなし外周面に複数の細かい凹凸が形成されている(ローレット加工)。ローラー84は、回動軸81に偏心して取り付けられている。端子部78を図35に示す直立状態から、図36に示す倒れ状態とすることによって、ローラー84の外周面がベース部76の固定溝87に固定されているセンサ繊維230の外周面に食い込む。
第二コネクタ75を用いて、センサ繊維230と検知装置100との接続を行う際は、まず、図37に示すように、ベース部76の固定溝87にセンサ繊維230を配置する。これにより、第二丸穴刃80がセンサ繊維230の第一導電性糸231を除く部位に切り込まれる。
次いで、図38に示すように、ワイヤーストリッパー部77を倒すことで、センサ繊維230の第一導電性糸231を残すように、それ以外に切り込みを入れる。ワイヤーストリッパー部77が倒されることによって、ワイヤーストリッパー部本体82によってセンサ繊維230が固定される。
次いで、図39に示すように、端子部78を倒すことによって、ローラー84が第一導電性糸231を露出させるとともに、中心導体用端子85が第一導電性糸231に押し付けられて、第一導電性糸231と中心導体用端子85とが接続される。同時に、外部導体用端子86がセンサ繊維230を貫通して、第二導電性糸233と接続される。
次いで、図38に示すように、ワイヤーストリッパー部77を倒すことで、センサ繊維230の第一導電性糸231を残すように、それ以外に切り込みを入れる。ワイヤーストリッパー部77が倒されることによって、ワイヤーストリッパー部本体82によってセンサ繊維230が固定される。
次いで、図39に示すように、端子部78を倒すことによって、ローラー84が第一導電性糸231を露出させるとともに、中心導体用端子85が第一導電性糸231に押し付けられて、第一導電性糸231と中心導体用端子85とが接続される。同時に、外部導体用端子86がセンサ繊維230を貫通して、第二導電性糸233と接続される。
上記第二コネクタ75を用いることによって、ワイヤーストリッパー部77の操作によってセンサ繊維230の被覆を剥くことができ、容易に導電性糸と検知装置100とを接続することができる。なお、より被覆を剥き易くするためにローラー84と同等の機構をベース部76に組み込んでもよい。
次に、第三コネクタ90について説明する。
図40に示すように、第三コネクタ90は、ケーシング91と、ケーシング91に固定された中心導体用端子92と、外部導体用端子93と、を有している。中心導体用端子92と外部導体用端子93とは、検知装置100(図1参照)と接続されている。
ケーシング91は、箱状をなし、上方から見てU字状に延在するワイヤ収容溝94が形成されている。
図40に示すように、第三コネクタ90は、ケーシング91と、ケーシング91に固定された中心導体用端子92と、外部導体用端子93と、を有している。中心導体用端子92と外部導体用端子93とは、検知装置100(図1参照)と接続されている。
ケーシング91は、箱状をなし、上方から見てU字状に延在するワイヤ収容溝94が形成されている。
図41に示すように、ワイヤ収容溝94は、中心導体用端子92が収容される第一直線部94aと、外部導体用端子93が収容される第二直線部94bと、第一直線部94aと第二直線部94bとを滑らかに接続する曲線部94cとを有している。なお、ワイヤ収容溝94は上方から見てU字状である必要はないが、使用者の利便性から鑑みるとU字状であることが好ましい。
中心導体用端子92は、第一直線部94aの延在方向の一方向に向かって徐々に近づくように配置された一対の端子から構成されている。一対の端子の先端部は接触されているが、一対の端子間に第一導電性糸231を挟み込むことが可能である。
外部導体用端子93も、第二直線部94bの延在方向の一方向に向かって徐々に近づくように配置された一対の端子から構成されている。一対の端子は、一対の端子の先端部間の距離がセンサ繊維230の直径よりもやや小さくなるように配置されている。
外部導体用端子93も、第二直線部94bの延在方向の一方向に向かって徐々に近づくように配置された一対の端子から構成されている。一対の端子は、一対の端子の先端部間の距離がセンサ繊維230の直径よりもやや小さくなるように配置されている。
使用者が、センサ繊維230を第三コネクタ90に接続する際には、ワイヤーストリッパーや、ニッパーなどで、第一導電性糸231及び第二導電性糸233をワイヤ収容溝94に合わせて露出させる。次いで、センサ繊維230をワイヤ収容溝94に収容することによって、第一導電性糸231が中心導体用端子92と接続されると共に、第二導電性糸233が外部導体用端子93と接続される。
上記第三コネクタ90を用いることによって、センサ繊維230の被覆を剥くだけで、導電性糸と検知装置100とを接続することができる。
次に、第四コネクタ95について説明する。
図42に示すように、第四コネクタ95は、一般的な同軸コネクタを利用したコネクタである。第四コネクタ95は、雌コネクタ96と、雌コネクタ96と接続される雄コネクタ97と、雄コネクタ97を繊維シート200に固定するための固定用フォルダ98と、を有している。雌コネクタ96は複数の端子(図示せず)を有しており、これらの端子は、検知装置100と接続されている。
図42に示すように、第四コネクタ95は、一般的な同軸コネクタを利用したコネクタである。第四コネクタ95は、雌コネクタ96と、雌コネクタ96と接続される雄コネクタ97と、雄コネクタ97を繊維シート200に固定するための固定用フォルダ98と、を有している。雌コネクタ96は複数の端子(図示せず)を有しており、これらの端子は、検知装置100と接続されている。
雄コネクタ97及び雌コネクタ96は、樹脂によって形成されている同軸ケーブル用のコネクタである。使用者は、センサ繊維230の端末処理を行い、センサ繊維230を雄コネクタ97に接続し、固定用フォルダ98を用いて雄コネクタ97を繊維シート200に固定することができる。そして、雄コネクタ97に雌コネクタ96を接続することによって、導電性糸231、233と検知装置100とを接続することができる。
以上、四種類のコネクタについて説明したが、例えば、第一コネクタ60、第二コネクタ75、第三コネクタ90を用いることによって、コネクタの価格は高価になるものの、消耗品である繊維シート200の価格を抑えることができる。
次に、図43~図53を参照して、繊維シートにおける第一導電体210および第二導電体220の別の配置例について説明する。繊維シートにおいて第一導電体210と第二導電体220とを様々に配置することができる。
図43は、繊維シート202上における第一導電体210および第二導電体220の配置の別の第1例を示す説明図である。同図に示す配置例では、第一導電体210と第二導電体220とが交互に配置されている。第一導電体210と第二導電体220との間に血液が滴下すると、第一導電体210と第二導電体220との間の周波数特性が変化する。これにより、検知信号出力部191は、血液の漏出を検知し得る。
図43は、繊維シート202上における第一導電体210および第二導電体220の配置の別の第1例を示す説明図である。同図に示す配置例では、第一導電体210と第二導電体220とが交互に配置されている。第一導電体210と第二導電体220との間に血液が滴下すると、第一導電体210と第二導電体220との間の周波数特性が変化する。これにより、検知信号出力部191は、血液の漏出を検知し得る。
なお、第一導電体210や第二導電体220が、ある程度の幅を持って配置されていてもよい。
図44は、第一導電体210および第二導電体220の配置の別の第2例を示す説明図である。図43の例と同様、図44の例でも第一導電体210と第二導電体220とが交互に配置されている。但し、図44の例では、第一導電体210や第二導電体220の幅が、図43の場合よりも太くなっている。これにより、図43の場合よりも、第一導電体210と第二導電体220との間隔が狭くなる。第一導電体210と第二導電体220との間隔が狭くなることで、第一導電体210と第二導電体220との間に血液が滴下された場合のインピーダンス特性の変化がより大きくなり、検知装置100が血液の滴下を検知し易くなることが期待される。
図44は、第一導電体210および第二導電体220の配置の別の第2例を示す説明図である。図43の例と同様、図44の例でも第一導電体210と第二導電体220とが交互に配置されている。但し、図44の例では、第一導電体210や第二導電体220の幅が、図43の場合よりも太くなっている。これにより、図43の場合よりも、第一導電体210と第二導電体220との間隔が狭くなる。第一導電体210と第二導電体220との間隔が狭くなることで、第一導電体210と第二導電体220との間に血液が滴下された場合のインピーダンス特性の変化がより大きくなり、検知装置100が血液の滴下を検知し易くなることが期待される。
図45は、第一導電体210および第二導電体220の配置の別の第3例を示す説明図である。同図の配置例では、繊維シート202は、第一導電体210を含むシート241と第二導電体220を含むシート243との間にシート242が挟まれた3層構造にて構成されている。なお、第一導電体210と第二導電体220とが異なる向きになるように配置されていてもよいし、同じ向きになるように配置されていてもよい。
シート241の本体、シート243の本体、およびシート242は、いずれも吸水性を有する絶縁性のシートとなっている。シート242が挟まれることで、第一導電体210と第二導電体220とが非接触となっている。また、シート242が血液等の水分を吸収すると、第一導電体210と第二導電体220との間のインピーダンス特性が変化する。これにより、検知信号出力部191は、繊維シート202への血液の漏出を検知し得る。
なお、第一導電体210および第二導電体220において、各線が独立したチャネルを構成するようにしてもよい。
図46は、第一導電体210および第二導電体220の配置の別の第4例を示す説明図である。図46の例において、繊維シート202は、第一導電体210を含むシート251と第二導電体220を含むシート253との間にシート252が挟まれた3層構造にて構成されている。また、第一導電体210と第二導電体220とは異なる向きになるように配置されている。また、シート251の本体、シート253の本体、およびシート252は、いずれも吸水性を有する絶縁性のシートとなっている。シート252が挟まれることで、第一導電体210と第二導電体220とが非接触となっている。
図46は、第一導電体210および第二導電体220の配置の別の第4例を示す説明図である。図46の例において、繊維シート202は、第一導電体210を含むシート251と第二導電体220を含むシート253との間にシート252が挟まれた3層構造にて構成されている。また、第一導電体210と第二導電体220とは異なる向きになるように配置されている。また、シート251の本体、シート253の本体、およびシート252は、いずれも吸水性を有する絶縁性のシートとなっている。シート252が挟まれることで、第一導電体210と第二導電体220とが非接触となっている。
一方、図45の例と異なり図46の例では、第一導電体210の各線は電気的に接続されておらず、それぞれの線がチャネル1~チャネル4を構成している。また、第二導電体220の各線も電気的に接続されておらず、それぞれの線がチャネル5~チャネル8を構成している。
図47は、第一導電体210の各チャネルと第二導電体220の各チャネルとの位置関係の例を示す説明図である。同図の例において第一導電体210の各チャネルと第二導電体220の各チャネルとは互いに直交して配置されている。但し、シート252が挟まれていることで、第一導電体210の各チャネルと第二導電体220の各チャネルとは非接触となっている。シート252の一部に液体が染み込んだ場合、染み込んだ位置に応じたチャネルにおいて、第一導電体210と第二導電体220との周波数特性が変化する。これにより、検知信号出力部191は、液体の浸出の有無に加えて浸出した位置を検知し得る。
例えば、繊維シート202がカーペットとして用いられており、繊維シート202の上の領域A11、A12、A13の各々に、機器が設置されているとする。この場合、チャネル2とチャネル5との間の周波数特性が変化すれば、領域A11に設置されている機器について液体が付着することによる故障等から保護する必要性を検知できる。一方、チャネル3とチャネル7との間の周波数特性が変化すれば、領域A12に設置されている機器や領域A13に設置されている機器について、液体が付着することによる故障等から保護する必要性を検知できる。
このように、検知システム1は、抜針の検知に限らず、第一導電体210と第二導電体220との間の周波数特性を変化させる様々な液体の検知に適用し得る。
このように、検知システム1は、抜針の検知に限らず、第一導電体210と第二導電体220との間の周波数特性を変化させる様々な液体の検知に適用し得る。
なお、液体の種類を区別する必要がない場合、交流信号に代えて直流電流をチャネルに印加するようにしても、繊維シート202に液体が染み込んだ位置を検知し得る。
例えば、チャネル1とチャネル2とに直流電流を印加した状態で、チャネル5、チャネル6それぞれの電圧を測定することで、領域A11への液体の染み込みの有無を判定し得る。この場合、液体の導電率が空気の導電率に対して十分大きな値を示し、チャネル5とチャネル6との電位差について、所定の大きさ以下の測定値が得られた場合、領域A11に液体が染み込んだと判定する。
例えば、チャネル1とチャネル2とに直流電流を印加した状態で、チャネル5、チャネル6それぞれの電圧を測定することで、領域A11への液体の染み込みの有無を判定し得る。この場合、液体の導電率が空気の導電率に対して十分大きな値を示し、チャネル5とチャネル6との電位差について、所定の大きさ以下の測定値が得られた場合、領域A11に液体が染み込んだと判定する。
また、包帯状の繊維シートに関して、少なくとも2つの導電体(導電性糸)が互いに接触しないように組み合わせて1本の糸を構成することができれば、他の構成を採用することもできる。
図48は、2つの導電体が互いに接触しないように組み合わせられた糸の配置の第1例を示す説明図である。
同図において、包帯261(繊維シート)は、包帯261自らの中央に縦に編み込まれた糸262を含んで構成されている。糸262は、互いに接触しないように組み合わせられた2つの導電体を含んで構成されている。包帯261は、繊維シート200の例に該当し、糸262に含まれる2つの導電体が、第一導電体210および第二導電体220の例に該当する。
図48は、2つの導電体が互いに接触しないように組み合わせられた糸の配置の第1例を示す説明図である。
同図において、包帯261(繊維シート)は、包帯261自らの中央に縦に編み込まれた糸262を含んで構成されている。糸262は、互いに接触しないように組み合わせられた2つの導電体を含んで構成されている。包帯261は、繊維シート200の例に該当し、糸262に含まれる2つの導電体が、第一導電体210および第二導電体220の例に該当する。
なお、1本の糸に含まれる2つの導電体の配置は、図9および図10の例に示されるものに限らない。
例えば、図49に示すように、導電性糸233を絶縁用木綿236で被覆することなく、絶縁用木綿232で被覆された導電性糸231に巻き付け、これらを絶縁用木綿236B(第三絶縁部)で被覆する構成としてもよい。
また、図9に示すセンサ繊維230を更に図49に示す絶縁用木綿236Bで被覆してもよい。
例えば、図49に示すように、導電性糸233を絶縁用木綿236で被覆することなく、絶縁用木綿232で被覆された導電性糸231に巻き付け、これらを絶縁用木綿236B(第三絶縁部)で被覆する構成としてもよい。
また、図9に示すセンサ繊維230を更に図49に示す絶縁用木綿236Bで被覆してもよい。
また、図50に示すように、絶縁用木綿232の外周に巻き付けられた導電性糸233及び絶縁用木綿236が導電性糸231の延在方向に移動するのを抑制するために、絶縁用木綿236を絶縁用木綿232とを互いに編んでもよい。即ち、絶縁用木綿232の外表面にループ239を形成して、導電性糸233及び絶縁用木綿236をループ239にくぐらせてもよい。
図51は、1本の糸に含まれる2つの導電体の配置のもう1つの例を示す説明図である。同図において、糸280は、互いに接触しないように撚り合わせられた2本の導電性糸281および282を含んで構成される。
例えば、導電性糸281および282をゴムなど伸縮性のある素材によって被覆し、これをねじって図51のような配置にする。これにより、導電性糸281と282とを比較的狭い間隔で配置することができ、かつ、糸280に伸縮性を持たせることができる。
導電性糸281と導電性糸282のそれぞれを絶縁用木綿で被覆してもよいし、図51に示すように、撚り合せた導電性糸281と導電性糸282とを絶縁用木綿236Cで被覆してもよい。
例えば、導電性糸281および282をゴムなど伸縮性のある素材によって被覆し、これをねじって図51のような配置にする。これにより、導電性糸281と282とを比較的狭い間隔で配置することができ、かつ、糸280に伸縮性を持たせることができる。
導電性糸281と導電性糸282のそれぞれを絶縁用木綿で被覆してもよいし、図51に示すように、撚り合せた導電性糸281と導電性糸282とを絶縁用木綿236Cで被覆してもよい。
なお、図49、図50、及び図51に示す何れの形態においても、その外周側に吸水性を有する絶縁素材(例えば、絶縁用木綿)で覆われた導電性糸からなるシールド層を設けてよい。
例えば、図49に示す形態の導電性糸233の外周側、又は絶縁用木綿236Bの外周側に、更に、絶縁用木綿で覆われた導電性糸を巻き付けたり、編み込んだりした上で、導電性糸をアース接地させてよい。
シールド層を設けることによって、ノイズや外乱の影響を少なくすることができる。
例えば、図49に示す形態の導電性糸233の外周側、又は絶縁用木綿236Bの外周側に、更に、絶縁用木綿で覆われた導電性糸を巻き付けたり、編み込んだりした上で、導電性糸をアース接地させてよい。
シールド層を設けることによって、ノイズや外乱の影響を少なくすることができる。
図52は、1本の糸に含まれる2つの導電体の配置のさらにもう1つの例を示す説明図である。
図53は、図52に例示される糸の断面における2つの導電体の配置例を示す説明図である。
図52および図53に例示される糸280では、2本の導電性糸281および282が平行に配置され、それら2本の導電性糸が絶縁用木綿232など吸水性のある絶縁素材で覆われた構造となっている。この構造では、導電性糸を撚り合わせる必要がなく、この点において、比較的容易に糸を生成し得る。
図53は、図52に例示される糸の断面における2つの導電体の配置例を示す説明図である。
図52および図53に例示される糸280では、2本の導電性糸281および282が平行に配置され、それら2本の導電性糸が絶縁用木綿232など吸水性のある絶縁素材で覆われた構造となっている。この構造では、導電性糸を撚り合わせる必要がなく、この点において、比較的容易に糸を生成し得る。
図52に示す形態においても、絶縁用木綿232の外周側に、更に、絶縁用木綿で覆われた導電性糸を巻き付けたり、編み込んだりした上で、導電性糸をアース接地させてよい。
以上のように、周波数特性取得部120は、繊維シートに設けられた少なくとも2つの導電体に交流信号を入力した場合の周波数特性を取得する。また、検知信号出力部191は、周波数特性取得部120が所定の周波数特性を取得した場合に検知信号を出力する。
これにより、検知装置100では、周波数特性の違いに基づいて他の液体と区別して特定の液体の付着を検知可能である。
かつ、検知装置100では、少なくとも2つの導電体(第一導電体210および第二導電体220)が設けられた繊維シートを使用可能である。当該繊維シートとして、例えば、複数の導電性糸が編み込まれた繊維シートを用いることができ、繊維シート構造を簡単にできる。これにより、繊維シートの製造コストを低減させ、当該繊維シート(液体の付着する部分)を使い捨てにし得る。
これにより、検知装置100では、周波数特性の違いに基づいて他の液体と区別して特定の液体の付着を検知可能である。
かつ、検知装置100では、少なくとも2つの導電体(第一導電体210および第二導電体220)が設けられた繊維シートを使用可能である。当該繊維シートとして、例えば、複数の導電性糸が編み込まれた繊維シートを用いることができ、繊維シート構造を簡単にできる。これにより、繊維シートの製造コストを低減させ、当該繊維シート(液体の付着する部分)を使い捨てにし得る。
また、周波数特性取得部120は、第一周波数の交流信号、第二周波数の交流信号それぞれを少なくとも2つの導電体(第一導電体210および第二導電体220)に入力した場合の周波数特性を取得する。そして、検知信号出力部191は、第一周波数の交流信号を導電体に入力した場合の周波数特性と、第二周波数の交流信号を導電体に入力した場合の周波数特性との相違が所定の相違である場合に検知信号を出力する。
ここで、上述したように、汗と血液とでは、周波数の変化に対する周波数特性の変化の割合が異なる。このため、検知信号出力部191は、複数の周波数における周波数特性の違いに基づいて、汗と区別して血液を検知することができ、抜針の誤検知を低減させることができる。
このように、検知信号出力部191は、複数の周波数における周波数特性の違いに基づいて、特定の液体と他の液体と区別して検知し得る。
ここで、上述したように、汗と血液とでは、周波数の変化に対する周波数特性の変化の割合が異なる。このため、検知信号出力部191は、複数の周波数における周波数特性の違いに基づいて、汗と区別して血液を検知することができ、抜針の誤検知を低減させることができる。
このように、検知信号出力部191は、複数の周波数における周波数特性の違いに基づいて、特定の液体と他の液体と区別して検知し得る。
また、繊維シート200は、互いに接触しないように組み合わせられた少なくとも2つの導電体210および220を含む導電性糸231、233(糸262または糸280)を含む。
これにより、2つの導電体210および220を比較的狭い間隔で配置することができ、液体が繊維シート200に染み込んだ際に、検知信号出力部191の検知精度を高めることができる。
これにより、2つの導電体210および220を比較的狭い間隔で配置することができ、液体が繊維シート200に染み込んだ際に、検知信号出力部191の検知精度を高めることができる。
なお、検知信号出力部191の機能を実現するためのプログラムをコンピュータ読み取り可能な記録媒体に記録して、この記録媒体に記録されたプログラムをコンピュータシステムに読み込ませ、実行することで各部の処理を行ってもよい。なお、ここでいう「コンピュータシステム」とは、OSや周辺機器等のハードウェアを含むものとする。
また、「コンピュータシステム」は、WWWシステムを利用している場合であれば、ホームページ提供環境(あるいは表示環境)も含むものとする。
また、「コンピュータ読み取り可能な記録媒体」とは、フレキシブルディスク、光磁気ディスク、ROM、CD-ROM等の可搬媒体、コンピュータシステムに内蔵されるハードディスク等の記憶装置のことをいう。さらに「コンピュータ読み取り可能な記録媒体」とは、インターネット等のネットワークや電話回線等の通信回線を介してプログラムを送信する場合の通信線のように、短時間の間、動的にプログラムを保持するもの、その場合のサーバやクライアントとなるコンピュータシステム内部の揮発性メモリのように、一定時間プログラムを保持しているものも含むものとする。また上記プログラムは、前述した機能の一部を実現するためのものであっても良く、さらに前述した機能をコンピュータシステムにすでに記録されているプログラムとの組み合わせで実現できるものであっても良い。
以上、本発明の実施形態を図面を参照して詳述してきたが、具体的な構成はこの実施形態に限られるものではなく、この発明の要旨を逸脱しない範囲の設計変更等も含まれる。
この糸、検知システム、繊維シート、コネクタ、検知装置および液体種類推定方法によれば、繊維シートに垂れた液体が所定の液体(例えば血液)か否かを高精度に判定することができ、検知信号を誤って出力する可能性を低減させることができる。
1 検知システム
60 第一コネクタ
69 凹溝(溝)
70 中心導体用端子
71 外部導体用端子
75 第二コネクタ
90 第三コネクタ
95 第四コネクタ
100 検知装置
110 交流信号出力部
120 周波数特性取得部
130 警報出力部
180 記憶部
181 検知条件記憶部
190 制御部
191 検知信号出力部
200、271 繊維シート
201 繊維シート本体
210 第一導電体
220 第二導電体
230 センサ繊維(糸)
231、233、281、282 導電性糸
232 絶縁用木綿(第一絶縁部)
236 絶縁用木綿(第二絶縁部)
241、242、243、251、252、253 シート
261 包帯
262、280 糸
Claims (12)
- 導電性を有する第一導電性糸と、前記第一導電性糸を覆い、吸水性を有する絶縁素材によって形成されている第一絶縁部と、前記第一絶縁部の外周側に配置されている導電性を有する第二導電性糸と、を有する糸。
- 前記第二導電性糸は、前記第一絶縁部の外周面に螺旋状に巻かれている請求項1に記載の糸。
- 前記第二導電性糸は、吸水性を有する絶縁素材によって形成されている第二絶縁部によって覆われている請求項1に記載の糸。
- 吸水性を有する絶縁素材によって形成されている第三絶縁部によって覆われている請求項1から請求項3のいずれか一項に記載の糸。
- 絶縁素材は木綿である請求項1から請求項4のいずれか一項に記載の糸。
- 繊維シートと検知装置とを備え、
前記繊維シートは、
絶縁素材によって形成されている繊維シート本体と、
互いに接触しないように組み合わされた少なくとも2つの導電体を含むセンサ繊維と、を備え、
前記センサ繊維は、
導電性を有する第一導電性糸と、前記第一導電性糸を覆い、吸水性を有する絶縁素材によって形成されている絶縁部と、前記絶縁部の外周側に配置されている導電性を有する第二導電性糸と、を有し、
前記検知装置は、
前記繊維シートに設けられた少なくとも2つの前記導電体間に交流信号を入力する交流信号出力部と、
前記交流信号出力部が前記導電体間に交流信号を入力した場合の当該導電体間の周波数特性を取得する周波数特性取得部と、
前記交流信号出力部が前記導電体間に周波数の異なる複数の交流信号を入力して前記周波数特性取得部が取得した周波数特性が、前記交流信号出力部からの交流信号の周波数の相違に応じて所定の相違を示し、かつ、前記交流信号出力部が前記導電体間に同一周波数の交流信号を入力して前記周波数特性取得部が取得した異なる時刻における周波数特性が、時間経過に応じて所定の変化を示す場合に、検知信号を出力する検知信号出力部と、
を備える検知システム。 - 前記交流信号出力部は、繊維シートに設けられた複数の導電体間に周波数の異なる少なくとも3つの交流信号を入力し、
前記周波数特性取得部は、前記交流信号出力部が入力した交流信号毎に前記導電体間のインピーダンス測定値を取得し、
前記検知信号出力部は、前記周波数特性取得部が取得したインピーダンス測定値を円弧の一部で近似するCole-Cole軌跡を求め、膜を有する液体のインピーダンスを模擬する所定の等価回路モデルにおける回路パラメータの値を前記Cole-Cole軌跡に基づいて求め、得られた回路パラメータの値に基づいて液体の種類を推定することで、前記交流信号出力部が前記導電体間に周波数の異なる複数の交流信号を入力して前記周波数特性取得部が取得した周波数特性が、前記交流信号出力部からの交流信号の周波数の相違に応じて所定の相違を示すか否かの判定を行う、請求項6に記載の検知システム。 - 絶縁素材によって形成されている繊維シート本体と、
互いに接触しないように組み合わされた少なくとも2つの導電体を含むセンサ繊維と、を備え、
前記センサ繊維は、
導電性を有する第一導電性糸と、前記第一導電性糸を覆い、吸水性を有する絶縁素材によって形成されている絶縁部と、前記絶縁部の外周側に配置されている導電性を有する第二導電性糸と、を有する繊維シート。 - 前記繊維シート本体は、少なくとも一方向に伸縮性を有し、
前記センサ繊維は、前記繊維シート本体の延在方向に沿って波状に配置されている請求項8に記載の繊維シート。 - 請求項6又は請求項7に記載の検知システムにおいて、前記第一導電性糸及び前記第二導電性糸と、前記検知装置とを接続するコネクタであって、
前記センサ繊維が嵌るとともに、一方向に延在する溝と、
前記溝の幅方向の中央近傍に突出して、前記第一導電性糸と前記検知装置とを接続する中心導体用端子と、
前記溝の幅方向の端部近傍に突出して、前記第二導電性糸と前記検知装置とを接続する外部導体用端子と、を有するコネクタ。 - 繊維シートに設けられた複数の導電体間に交流信号を入力する交流信号出力部と、
前記交流信号出力部が前記導電体間に交流信号を入力した場合の当該導電体間の周波数特性を取得する周波数特性取得部と、
前記交流信号出力部が前記導電体間に周波数の異なる複数の交流信号を入力して前記周波数特性取得部が取得した周波数特性が、前記交流信号出力部からの交流信号の周波数の相違に応じて所定の相違を示し、かつ、前記交流信号出力部が前記導電体間に同一周波数の交流信号を入力して前記周波数特性取得部が取得した異なる時刻における周波数特性が、時間経過に応じて所定の変化を示す場合に、検知信号を出力する検知信号出力部と、
を備える検知装置。 - 繊維シートに設けられた複数の導電体間に周波数の異なる少なくとも3つの交流信号を入力する交流信号入力ステップと、
前記交流信号入力ステップで入力した交流信号毎に前記導電体間のインピーダンス測定値を取得するインピーダンス測定値取得ステップと、
前記インピーダンス測定値取得ステップで得られたインピーダンス測定値を円弧の一部で近似するCole-Cole軌跡を求めるCole-Cole軌跡取得ステップと、
膜を有する液体のインピーダンスを模擬する所定の等価回路モデルにおける回路パラメータの値を前記Cole-Cole軌跡に基づいて求めるキャパシタンス取得ステップと、
得られた回路パラメータの値に基づいて液体の種類を推定する液体種類推定ステップと、
を含む液体種類推定方法。
Priority Applications (4)
| Application Number | Priority Date | Filing Date | Title |
|---|---|---|---|
| JP2017525783A JP6663611B2 (ja) | 2015-06-30 | 2015-10-06 | 糸、検知システム、繊維シート、コネクタ、検知装置および液体種類推定方法 |
| EP19192944.7A EP3633089B1 (en) | 2015-06-30 | 2015-10-06 | Detection device and liquid type estimation method |
| US15/740,087 US11614418B2 (en) | 2015-06-30 | 2015-10-06 | Yarn, detection system, fiber sheet, connector, detection device, and liquid type estimation method |
| EP15897201.8A EP3318664A4 (en) | 2015-06-30 | 2015-10-06 | WIRE, DETECTION SYSTEM, FIBER SHEET, CONNECTOR, DETECTION DEVICE, AND LIQUID TYPE ESTIMATING METHOD |
Applications Claiming Priority (2)
| Application Number | Priority Date | Filing Date | Title |
|---|---|---|---|
| JP2015-132024 | 2015-06-30 | ||
| JP2015132024 | 2015-06-30 |
Publications (1)
| Publication Number | Publication Date |
|---|---|
| WO2017002274A1 true WO2017002274A1 (ja) | 2017-01-05 |
Family
ID=57608124
Family Applications (1)
| Application Number | Title | Priority Date | Filing Date |
|---|---|---|---|
| PCT/JP2015/078337 WO2017002274A1 (ja) | 2015-06-30 | 2015-10-06 | 糸、検知システム、繊維シート、コネクタ、検知装置および液体種類推定方法 |
Country Status (4)
| Country | Link |
|---|---|
| US (1) | US11614418B2 (ja) |
| EP (2) | EP3318664A4 (ja) |
| JP (1) | JP6663611B2 (ja) |
| WO (1) | WO2017002274A1 (ja) |
Cited By (4)
| Publication number | Priority date | Publication date | Assignee | Title |
|---|---|---|---|---|
| CN109239139A (zh) * | 2018-09-29 | 2019-01-18 | 厦门大学 | 一种纱线状湿度传感器 |
| JP2019039091A (ja) * | 2017-08-23 | 2019-03-14 | 住江織物株式会社 | 布帛 |
| JP2020105651A (ja) * | 2018-12-27 | 2020-07-09 | 住江織物株式会社 | 布帛 |
| JP2021121697A (ja) * | 2020-01-31 | 2021-08-26 | 住江織物株式会社 | 水油判断布 |
Families Citing this family (5)
| Publication number | Priority date | Publication date | Assignee | Title |
|---|---|---|---|---|
| EP3716803B1 (en) * | 2017-12-01 | 2023-07-12 | MAS Innovation (Private) Limited | Textile and manufacturing method thereof |
| TW201935939A (zh) * | 2018-02-06 | 2019-09-01 | 智能紡織科技股份有限公司 | 線材裝置 |
| WO2020210646A1 (en) | 2019-04-10 | 2020-10-15 | Propel, LLC | Systems for maintaining moisture in a textile electrode |
| KR102492323B1 (ko) * | 2020-12-16 | 2023-01-30 | 주식회사 소프트로닉스 | 자가 측정이 가능한 직물지 |
| US20240008913A1 (en) * | 2022-07-11 | 2024-01-11 | Verb Surgical Inc. | Method and system for detecting liquid immersion of an end effector of an ultrasonic instrument |
Citations (3)
| Publication number | Priority date | Publication date | Assignee | Title |
|---|---|---|---|---|
| JPH02280039A (ja) * | 1989-04-20 | 1990-11-16 | Junkosha Co Ltd | 液体識別装置 |
| JP2004533103A (ja) * | 2001-06-19 | 2004-10-28 | コーニンクレッカ フィリップス エレクトロニクス エヌ ヴィ | ケーブル |
| JP2011106084A (ja) * | 2009-11-12 | 2011-06-02 | Kunert Fashion Gmbh & Co Kg | 湿度センサを備えたメリヤス製品 |
Family Cites Families (14)
| Publication number | Priority date | Publication date | Assignee | Title |
|---|---|---|---|---|
| US3864676A (en) | 1973-09-10 | 1975-02-04 | Helene Macias | Moisture detector |
| EP0145407B1 (en) * | 1983-11-28 | 1991-01-23 | Ing. C. Olivetti & C., S.p.A. | Device for connecting a logic circuit to a coaxial cable |
| JP2001070273A (ja) * | 1999-09-03 | 2001-03-21 | Tanita Corp | 生体電気インピーダンス測定方法および身体組成測定装置 |
| US7801598B2 (en) * | 2000-08-14 | 2010-09-21 | Fresenius Medical Care Holdings, Inc. | Device and method for the determination of dry weight by continuous measurement of resistance and calculation of circumference in a body segment using segmental bioimpedance analysis |
| GB0114978D0 (en) * | 2001-06-19 | 2001-08-08 | Koninkl Philips Electronics Nv | Cable |
| US7559902B2 (en) * | 2003-08-22 | 2009-07-14 | Foster-Miller, Inc. | Physiological monitoring garment |
| US20100271212A1 (en) * | 2007-12-12 | 2010-10-28 | Robin WHALLEY | Device and apparatus for detecting bodily fluids |
| JP5203306B2 (ja) * | 2009-06-30 | 2013-06-05 | タツタ電線株式会社 | 漏液検知線 |
| JP5587817B2 (ja) | 2011-03-21 | 2014-09-10 | 株式会社アワジテック | 人工透析用血液検知装置 |
| JP5912751B2 (ja) * | 2012-03-28 | 2016-04-27 | タツタ電線株式会社 | 液体検知線 |
| DE102012013473B4 (de) * | 2012-07-09 | 2018-02-22 | Fresenius Medical Care Deutschland Gmbh | Vorrichtung zur Erkennung von Feuchtigkeit für eine Vorrichtung zur Überwachung eines Zugangs zu einem Patienten |
| JP2015132024A (ja) | 2014-01-10 | 2015-07-23 | 東レ株式会社 | 衣料用織物 |
| JP5791132B1 (ja) * | 2014-04-07 | 2015-10-07 | 学校法人北里研究所 | 検知装置、検知システム、検知方法およびプログラム |
| WO2016119211A1 (en) * | 2015-01-30 | 2016-08-04 | National Taipei University Of Technology | Sensor patch, system, and method for detecting fluid leakage |
-
2015
- 2015-10-06 EP EP15897201.8A patent/EP3318664A4/en active Pending
- 2015-10-06 US US15/740,087 patent/US11614418B2/en active Active
- 2015-10-06 EP EP19192944.7A patent/EP3633089B1/en active Active
- 2015-10-06 WO PCT/JP2015/078337 patent/WO2017002274A1/ja active Application Filing
- 2015-10-06 JP JP2017525783A patent/JP6663611B2/ja active Active
Patent Citations (3)
| Publication number | Priority date | Publication date | Assignee | Title |
|---|---|---|---|---|
| JPH02280039A (ja) * | 1989-04-20 | 1990-11-16 | Junkosha Co Ltd | 液体識別装置 |
| JP2004533103A (ja) * | 2001-06-19 | 2004-10-28 | コーニンクレッカ フィリップス エレクトロニクス エヌ ヴィ | ケーブル |
| JP2011106084A (ja) * | 2009-11-12 | 2011-06-02 | Kunert Fashion Gmbh & Co Kg | 湿度センサを備えたメリヤス製品 |
Non-Patent Citations (1)
| Title |
|---|
| SATORU NEBUYA ET AL.: "An Optically Isolated Impedance Measurement System", BPES 2001 DAI 16 KAI PROCEEDING OF THE SYMPOSIUM ON BIOLOGICAL AND PHYSIOLOGICAL ENGINEERING, 2001, pages 71 - 72, XP009504685 * |
Cited By (8)
| Publication number | Priority date | Publication date | Assignee | Title |
|---|---|---|---|---|
| JP2019039091A (ja) * | 2017-08-23 | 2019-03-14 | 住江織物株式会社 | 布帛 |
| JP7011123B2 (ja) | 2017-08-23 | 2022-01-26 | 住江織物株式会社 | 布帛 |
| CN109239139A (zh) * | 2018-09-29 | 2019-01-18 | 厦门大学 | 一种纱线状湿度传感器 |
| CN109239139B (zh) * | 2018-09-29 | 2021-02-02 | 厦门大学 | 一种纱线状湿度传感器 |
| JP2020105651A (ja) * | 2018-12-27 | 2020-07-09 | 住江織物株式会社 | 布帛 |
| JP7289440B2 (ja) | 2018-12-27 | 2023-06-12 | 住江織物株式会社 | 布帛 |
| JP2021121697A (ja) * | 2020-01-31 | 2021-08-26 | 住江織物株式会社 | 水油判断布 |
| JP7422379B2 (ja) | 2020-01-31 | 2024-01-26 | 住江織物株式会社 | 水油判断布 |
Also Published As
| Publication number | Publication date |
|---|---|
| JP6663611B2 (ja) | 2020-03-13 |
| JPWO2017002274A1 (ja) | 2018-04-19 |
| US20180195985A1 (en) | 2018-07-12 |
| EP3318664A1 (en) | 2018-05-09 |
| EP3633089B1 (en) | 2021-04-21 |
| EP3633089A1 (en) | 2020-04-08 |
| US11614418B2 (en) | 2023-03-28 |
| EP3318664A4 (en) | 2019-10-09 |
Similar Documents
| Publication | Publication Date | Title |
|---|---|---|
| WO2017002274A1 (ja) | 糸、検知システム、繊維シート、コネクタ、検知装置および液体種類推定方法 | |
| JP5791132B1 (ja) | 検知装置、検知システム、検知方法およびプログラム | |
| KR101823070B1 (ko) | 환자 액세스 감시 장치에 사용하기 위한 수분 검출 디바이스 | |
| US10046120B2 (en) | Device for detecting moisture for an arrangement for monitoring an access to a patient | |
| CN108348675A (zh) | 用于医疗器械的漏液检测装置 | |
| AU2016231255B2 (en) | Device in the form of a garment for monitoring a physiological parameter of a user | |
| Gaubert et al. | Smart underwear, incorporating textrodes, to estimate the bladder volume: Proof of concept on a test bench | |
| JP6207028B2 (ja) | 検知装置、検知システム、検知方法およびプログラム | |
| US20230173157A1 (en) | Medical wetness sensing devices and related systems and methods | |
| Park et al. | A multi-pair electrode based impedance sensing biopsy needle for tissue discrimination during biopsy process |
Legal Events
| Date | Code | Title | Description |
|---|---|---|---|
| 121 | Ep: the epo has been informed by wipo that ep was designated in this application |
Ref document number: 15897201 Country of ref document: EP Kind code of ref document: A1 |
|
| ENP | Entry into the national phase |
Ref document number: 2017525783 Country of ref document: JP Kind code of ref document: A |
|
| NENP | Non-entry into the national phase |
Ref country code: DE |
|
| WWE | Wipo information: entry into national phase |
Ref document number: 2015897201 Country of ref document: EP |