WO2017002274A1 - Fil, système de détection, feuille de fibres, connecteur, dispositif de détection, et procédé d'estimation de type de liquide - Google Patents
Fil, système de détection, feuille de fibres, connecteur, dispositif de détection, et procédé d'estimation de type de liquide Download PDFInfo
- Publication number
- WO2017002274A1 WO2017002274A1 PCT/JP2015/078337 JP2015078337W WO2017002274A1 WO 2017002274 A1 WO2017002274 A1 WO 2017002274A1 JP 2015078337 W JP2015078337 W JP 2015078337W WO 2017002274 A1 WO2017002274 A1 WO 2017002274A1
- Authority
- WO
- WIPO (PCT)
- Prior art keywords
- output unit
- signal output
- fiber sheet
- frequency
- conductor
- Prior art date
Links
Images


Classifications
-
- G—PHYSICS
- G01—MEASURING; TESTING
- G01N—INVESTIGATING OR ANALYSING MATERIALS BY DETERMINING THEIR CHEMICAL OR PHYSICAL PROPERTIES
- G01N27/00—Investigating or analysing materials by the use of electric, electrochemical, or magnetic means
- G01N27/02—Investigating or analysing materials by the use of electric, electrochemical, or magnetic means by investigating impedance
-
- A—HUMAN NECESSITIES
- A61—MEDICAL OR VETERINARY SCIENCE; HYGIENE
- A61B—DIAGNOSIS; SURGERY; IDENTIFICATION
- A61B5/00—Measuring for diagnostic purposes; Identification of persons
- A61B5/02—Detecting, measuring or recording pulse, heart rate, blood pressure or blood flow; Combined pulse/heart-rate/blood pressure determination; Evaluating a cardiovascular condition not otherwise provided for, e.g. using combinations of techniques provided for in this group with electrocardiography or electroauscultation; Heart catheters for measuring blood pressure
- A61B5/02042—Determining blood loss or bleeding, e.g. during a surgical procedure
-
- A—HUMAN NECESSITIES
- A61—MEDICAL OR VETERINARY SCIENCE; HYGIENE
- A61M—DEVICES FOR INTRODUCING MEDIA INTO, OR ONTO, THE BODY; DEVICES FOR TRANSDUCING BODY MEDIA OR FOR TAKING MEDIA FROM THE BODY; DEVICES FOR PRODUCING OR ENDING SLEEP OR STUPOR
- A61M1/00—Suction or pumping devices for medical purposes; Devices for carrying-off, for treatment of, or for carrying-over, body-liquids; Drainage systems
- A61M1/36—Other treatment of blood in a by-pass of the natural circulatory system, e.g. temperature adaptation, irradiation ; Extra-corporeal blood circuits
- A61M1/3621—Extra-corporeal blood circuits
- A61M1/3653—Interfaces between patient blood circulation and extra-corporal blood circuit
- A61M1/3656—Monitoring patency or flow at connection sites; Detecting disconnections
-
- D—TEXTILES; PAPER
- D02—YARNS; MECHANICAL FINISHING OF YARNS OR ROPES; WARPING OR BEAMING
- D02G—CRIMPING OR CURLING FIBRES, FILAMENTS, THREADS, OR YARNS; YARNS OR THREADS
- D02G3/00—Yarns or threads, e.g. fancy yarns; Processes or apparatus for the production thereof, not otherwise provided for
- D02G3/02—Yarns or threads characterised by the material or by the materials from which they are made
- D02G3/04—Blended or other yarns or threads containing components made from different materials
-
- D—TEXTILES; PAPER
- D02—YARNS; MECHANICAL FINISHING OF YARNS OR ROPES; WARPING OR BEAMING
- D02G—CRIMPING OR CURLING FIBRES, FILAMENTS, THREADS, OR YARNS; YARNS OR THREADS
- D02G3/00—Yarns or threads, e.g. fancy yarns; Processes or apparatus for the production thereof, not otherwise provided for
- D02G3/22—Yarns or threads characterised by constructional features, e.g. blending, filament/fibre
- D02G3/38—Threads in which fibres, filaments, or yarns are wound with other yarns or filaments, e.g. wrap yarns, i.e. strands of filaments or staple fibres are wrapped by a helically wound binder yarn
-
- D—TEXTILES; PAPER
- D02—YARNS; MECHANICAL FINISHING OF YARNS OR ROPES; WARPING OR BEAMING
- D02G—CRIMPING OR CURLING FIBRES, FILAMENTS, THREADS, OR YARNS; YARNS OR THREADS
- D02G3/00—Yarns or threads, e.g. fancy yarns; Processes or apparatus for the production thereof, not otherwise provided for
- D02G3/44—Yarns or threads characterised by the purpose for which they are designed
- D02G3/441—Yarns or threads with antistatic, conductive or radiation-shielding properties
-
- G—PHYSICS
- G01—MEASURING; TESTING
- G01N—INVESTIGATING OR ANALYSING MATERIALS BY DETERMINING THEIR CHEMICAL OR PHYSICAL PROPERTIES
- G01N27/00—Investigating or analysing materials by the use of electric, electrochemical, or magnetic means
- G01N27/02—Investigating or analysing materials by the use of electric, electrochemical, or magnetic means by investigating impedance
- G01N27/04—Investigating or analysing materials by the use of electric, electrochemical, or magnetic means by investigating impedance by investigating resistance
- G01N27/06—Investigating or analysing materials by the use of electric, electrochemical, or magnetic means by investigating impedance by investigating resistance of a liquid
-
- G—PHYSICS
- G01—MEASURING; TESTING
- G01N—INVESTIGATING OR ANALYSING MATERIALS BY DETERMINING THEIR CHEMICAL OR PHYSICAL PROPERTIES
- G01N33/00—Investigating or analysing materials by specific methods not covered by groups G01N1/00 - G01N31/00
- G01N33/48—Biological material, e.g. blood, urine; Haemocytometers
- G01N33/483—Physical analysis of biological material
- G01N33/487—Physical analysis of biological material of liquid biological material
- G01N33/48785—Electrical and electronic details of measuring devices for physical analysis of liquid biological material not specific to a particular test method, e.g. user interface or power supply
-
- A—HUMAN NECESSITIES
- A61—MEDICAL OR VETERINARY SCIENCE; HYGIENE
- A61M—DEVICES FOR INTRODUCING MEDIA INTO, OR ONTO, THE BODY; DEVICES FOR TRANSDUCING BODY MEDIA OR FOR TAKING MEDIA FROM THE BODY; DEVICES FOR PRODUCING OR ENDING SLEEP OR STUPOR
- A61M2205/00—General characteristics of the apparatus
- A61M2205/15—Detection of leaks
-
- A—HUMAN NECESSITIES
- A61—MEDICAL OR VETERINARY SCIENCE; HYGIENE
- A61M—DEVICES FOR INTRODUCING MEDIA INTO, OR ONTO, THE BODY; DEVICES FOR TRANSDUCING BODY MEDIA OR FOR TAKING MEDIA FROM THE BODY; DEVICES FOR PRODUCING OR ENDING SLEEP OR STUPOR
- A61M2205/00—General characteristics of the apparatus
- A61M2205/33—Controlling, regulating or measuring
- A61M2205/3317—Electromagnetic, inductive or dielectric measuring means
-
- D—TEXTILES; PAPER
- D02—YARNS; MECHANICAL FINISHING OF YARNS OR ROPES; WARPING OR BEAMING
- D02G—CRIMPING OR CURLING FIBRES, FILAMENTS, THREADS, OR YARNS; YARNS OR THREADS
- D02G3/00—Yarns or threads, e.g. fancy yarns; Processes or apparatus for the production thereof, not otherwise provided for
- D02G3/22—Yarns or threads characterised by constructional features, e.g. blending, filament/fibre
- D02G3/36—Cored or coated yarns or threads
-
- D—TEXTILES; PAPER
- D10—INDEXING SCHEME ASSOCIATED WITH SUBLASSES OF SECTION D, RELATING TO TEXTILES
- D10B—INDEXING SCHEME ASSOCIATED WITH SUBLASSES OF SECTION D, RELATING TO TEXTILES
- D10B2401/00—Physical properties
- D10B2401/16—Physical properties antistatic; conductive
-
- D—TEXTILES; PAPER
- D10—INDEXING SCHEME ASSOCIATED WITH SUBLASSES OF SECTION D, RELATING TO TEXTILES
- D10B—INDEXING SCHEME ASSOCIATED WITH SUBLASSES OF SECTION D, RELATING TO TEXTILES
- D10B2509/00—Medical; Hygiene
-
- D—TEXTILES; PAPER
- D10—INDEXING SCHEME ASSOCIATED WITH SUBLASSES OF SECTION D, RELATING TO TEXTILES
- D10B—INDEXING SCHEME ASSOCIATED WITH SUBLASSES OF SECTION D, RELATING TO TEXTILES
- D10B2509/00—Medical; Hygiene
- D10B2509/02—Bandages, dressings or absorbent pads
Definitions
- the present invention relates to a yarn, a detection system, a fiber sheet, a connector, a detection device, and a liquid type estimation method.
- Needle extraction during artificial dialysis may lead to a serious accident due to sudden bleeding, and therefore prompt detection is required when the needle is removed.
- a method for detecting the withdrawal of needles by detecting bleeding has been proposed. In this method, it is desired to detect blood separately from sweat in order to prevent erroneous detection. In this way, it may be required to detect the adhesion of a specific liquid in distinction from the adhesion of other liquids to the sensor.
- the moisture sensor includes an electrode sheet, a filter sheet, and a water-permeable sheet.
- the electrode sheet has a three-layer base sheet and includes a reinforcing sheet.
- the reinforcing sheet has a large number of fine holes and has air permeability that allows water vapor to pass therethrough but also has waterproof properties that prevent passage of water droplets.
- the connector includes a lever and a clip. The lever and the clip sandwich one end and the other end of the moisture sensor, respectively.
- the clip includes a normally closed switch. The switch is turned off when the clip holds the moisture sensor, and the switch is turned on when the clip is detached from the moisture sensor. According to Patent Document 1, it is thereby possible to reliably detect bleeding due to withdrawal and the probability of withdrawal without causing malfunction due to sweat.
- a moisture sensor to which blood adheres during bleeding has a complicated structure as described above. For this reason, manufacturing a moisture sensor requires a great deal of cost, and the moisture sensor may not be disposable. On the other hand, from the viewpoint of more surely preventing sick blood infection, it is preferable to dispose a portion to which blood may adhere. In this way, it may be desirable to be able to detect the attachment of a specific liquid such as blood while distinguishing it from other liquids such as sweat, and to make the part to which the liquid adheres disposable.
- the present invention is capable of detecting the adhesion of a specific liquid in distinction from other liquids, and is optimal for a detection system that can make the portion to which the liquid adheres disposable, thread, detection system, fiber sheet, connector, and detection device And a liquid type estimation method.
- the yarn includes a first conductive yarn having conductivity, and a first insulating portion that covers the first conductive yarn and is formed of an insulating material having water absorption properties. And a second conductive yarn having conductivity disposed on the outer peripheral side of the first insulating portion.
- the second conductive yarn may be spirally wound around the outer peripheral surface of the first insulating portion.
- the second conductive yarn may be formed of an insulating material having water absorption.
- the yarn may be covered with a third insulating portion formed of an insulating material having water absorption.
- the insulating material may be cotton.
- the detection system includes a fiber sheet and a detection device, and the fiber sheet is combined with a fiber sheet main body formed of an insulating material so as not to contact each other. And a sensor fiber including two conductors, the sensor fiber covering the first conductive thread and the insulating material formed by an insulating material that absorbs water.
- An AC signal output unit that inputs a signal
- a frequency characteristic acquisition unit that acquires a frequency characteristic between the conductors when the AC signal output unit inputs an AC signal between the conductors
- the AC signal output unit The frequency characteristic acquired by the frequency characteristic acquisition unit by inputting a plurality of AC signals having different frequencies between the conductors shows a predetermined difference according to the frequency difference of the AC signal from the AC signal output unit, And, when the frequency characteristics at different times acquired by the frequency characteristics acquisition unit by inputting the AC signal of the same frequency between the conductors, the AC signal output unit shows a predetermined change over time,
- a detection signal output unit that outputs a detection signal.
- the AC signal output unit inputs at least three AC signals having different frequencies between a plurality of conductors provided on the fiber sheet, and the frequency characteristic acquisition unit receives the AC signal output unit.
- the impedance measurement value between the conductors is acquired for each AC signal, and the detection signal output unit obtains a Cole-Cole locus that approximates the impedance measurement value acquired by the frequency characteristic acquisition unit with a part of an arc,
- a circuit parameter value in a predetermined equivalent circuit model simulating the impedance of the liquid having a film is obtained based on the Cole-Cole locus, and the type of the liquid is estimated based on the obtained circuit parameter value.
- the AC signal output unit inputs a plurality of AC signals having different frequencies between the conductors, and the frequency characteristic acquisition unit acquires the frequency. Number characteristics, it is determined whether or not showing a predetermined difference in accordance with the difference in frequency of the AC signal from the AC signal output unit may be so.
- a fiber sheet includes a fiber sheet body formed of an insulating material and sensor fibers including at least two conductors combined so as not to contact each other,
- the sensor fiber is disposed on the outer peripheral side of the insulating portion, the first conductive yarn having conductivity, the insulating portion that covers the first conductive yarn and is formed of an insulating material having water absorption.
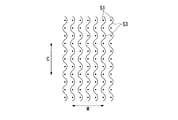
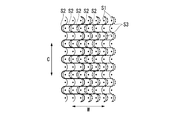
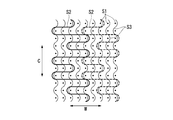
- the fiber sheet body may be stretchable in at least one direction, and the sensor fibers may be arranged in a wave shape along the extending direction of the fiber sheet body.
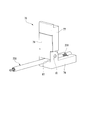
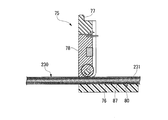
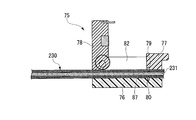
- the connector is a connector for connecting the first conductive yarn and the second conductive yarn and the detection device, and the sensor fiber is fitted and extends in one direction.
- the detection device includes an AC signal output unit that inputs an AC signal between a plurality of conductors provided in a fiber sheet, and the AC signal output unit is an AC between the conductors.
- a frequency characteristic acquisition unit that acquires a frequency characteristic between the conductors when a signal is input, and the AC signal output unit inputs a plurality of AC signals having different frequencies between the conductors, and the frequency characteristic acquisition unit
- the acquired frequency characteristic indicates a predetermined difference according to a difference in frequency of the AC signal from the AC signal output unit, and the AC signal output unit inputs an AC signal of the same frequency between the conductors.
- a detection signal output unit that outputs a detection signal when the frequency characteristics acquired at different times acquired by the frequency characteristic acquisition unit exhibit a predetermined change with time.
- the liquid type estimation method includes an AC signal input step of inputting at least three AC signals having different frequencies between a plurality of conductors provided on the fiber sheet, and the AC signal input.
- An impedance measurement value acquisition step for acquiring an impedance measurement value between the conductors for each AC signal input in the step, and a Cole-Cole that approximates the impedance measurement value obtained in the impedance measurement value acquisition step with a part of an arc.
- a Cole-Cole locus acquisition step for obtaining a locus a capacitance acquisition step for obtaining a value of a circuit parameter in a predetermined equivalent circuit model simulating the impedance of the liquid having a film based on the Cole-Cole locus, and the obtained circuit parameter Liquid type to estimate the liquid type based on the value of Including a constant step, the.
- the present invention it is possible to determine with high accuracy whether or not the liquid dripping on the fiber sheet is a predetermined liquid (for example, blood), and the possibility of erroneously outputting the detection signal can be reduced.
- a predetermined liquid for example, blood
- FIG. 3 is a structural diagram showing a schematic structure of a sensor fiber used in an experiment related to the embodiment. It is explanatory drawing which shows the layer structure of a sensor fiber in the experiment regarding the embodiment. It is the schematic which shows the manufacturing apparatus of a sensor fiber.
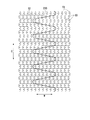
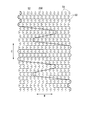
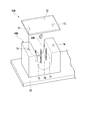
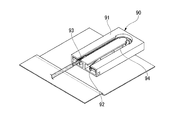
- FIG. 3 is a structural diagram showing a schematic structure of a fiber sheet in the same embodiment. It is a figure explaining the manufacturing method of the fiber sheet containing a sensor fiber, Comprising: It is the figure which showed the knitting structure of the warp.
- FIG. 10 is a structural diagram illustrating a schematic structure of another form of the sensor fiber illustrated in FIG. 9.
- FIG. 9 is a structural diagram illustrating a schematic structure of another form of the sensor fiber illustrated in FIG. 9.
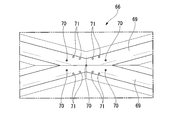
- FIG. 10 is a structural diagram illustrating a schematic structure of another form of the sensor fiber illustrated in FIG. 9. It is explanatory drawing which shows another example of arrangement
- FIG. 53 is an explanatory diagram illustrating an arrangement example of two conductors in the cross section of the yarn illustrated in FIG. 52.
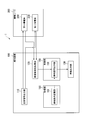
- FIG. 1 is a schematic block diagram showing a functional configuration of a frequency characteristic detection system according to an embodiment of the present invention.
- the detection system 1 includes a detection device 100 and a fiber sheet 200.
- the detection device 100 includes an AC signal output unit 110, a frequency characteristic acquisition unit 120, an alarm output unit 130, a storage unit 180, and a control unit 190.
- the storage unit 180 includes a detection condition storage unit 181.
- the control unit 190 includes a detection signal output unit 191.
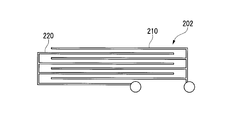
- the fiber sheet 200 includes a first conductor 210 and a second conductor 220.
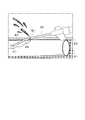
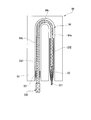
- FIG. 2 is an explanatory view showing an example of needle removal in artificial dialysis.
- a Teflon needle (Teflon is a registered trademark) 921 is inserted into a blood vessel 911, and the Teflon needle 921 is provided with a lateral groove H11.
- a Teflon needle 921 is inserted into the artery.
- a Teflon needle 921 is inserted into the vein on the blood return side from the artificial dialyzer to the body.
- a part of the Teflon needle 921 has slipped out of the body (outside the skin 912), and blood has leaked from the lateral groove H11 exposed outside the body.
- needle withdrawal is more likely to occur than on the blood collection side due to the effect of increasing blood pressure with an artificial dialyzer.
- the needle is likely to be removed.
- the fiber sheet 200 is a bandage wound around an arm that is punctured with a needle, that is, a site to be monitored for blood leakage, during artificial dialysis.
- a needle that is, a site to be monitored for blood leakage
- the fiber sheet 200 is wound around the patient's arm, and a Teflon needle 921 (FIG. 2) is punctured around the patient's arm around which the fiber sheet 200 is wound.
- the fiber sheet 200 has water absorption and prevents blood, sweat, etc. from leaking to the bed side.
- the fiber sheet 200 may be waterproof in addition to or instead of water absorption. Thereby, it can prevent more reliably that blood, sweat, etc. leak to the bed side.
- the fiber sheet 200 When the patient moves greatly, such as turning over, the fiber sheet 200 is laid on the bed and the patient's arm is placed on the bed. Depending on the size of the fiber sheet 200, blood can leak outside the fiber sheet 200. There is sex. On the other hand, by wrapping the fiber sheet 200 configured as a bandage around the site to be monitored for blood leakage, the possibility of the fiber sheet 200 being detached from the site to be monitored for blood leakage can be reduced and more reliably. Blood leakage can be detected.
- the detection device 100 may not be able to detect blood leakage inside the bandage.
- the detection apparatus 100 can detect blood leakage inside the bandage more reliably by winding and fixing the puncture site with the fiber sheet 200 configured as a bandage.
- the fiber sheet 200 may be placed under the patient's arm when the patient is not moving for a short time.
- the fiber sheet 200 comprised as a gauze can be applied to a blood leak monitoring object site
- the first conductor 210 and the second conductor 220 are conductors provided on the fiber sheet 200, respectively, and an AC signal from the AC signal output unit 110 is input thereto.
- the first conductor 210 and the second conductor 220 are not in contact.
- the main body of the fiber sheet 200 (the portion serving as a base on which the first conductor 210 and the second conductor 220 are provided) is made of insulating fibers. For this reason, in the state where the liquid is not attached to the fiber sheet 200, the first conductor 210 and the second conductor 220 are insulated or only a minute alternating current due to the capacitor effect or the like flows. On the other hand, when a liquid drips between the first conductor 210 and the second conductor 220, the first conductor 210 and the second conductor 220 are energized with frequency characteristics corresponding to the dripping liquid.
- the fiber sheet 200 absorbs water and diffuses the liquid, so that even if the liquid hangs at a position other than between the first conductor 210 and the second conductor 220, the first conductor 210 and the second conductor
- the possibility that the two conductors 220 are energized can be increased.
- the possibility that the detection system 1 can detect blood leakage can be increased.
- the patient's arm is directly attached to the first conductor 210 or the second conductor 220, such as a structure in which an insulating layer having water absorbency is provided on the surfaces of the first conductor 210 and the second conductor 220. It is good also as a structure which does not contact.
- the detection system 1 may detect blood leakage by detecting a current-carrying characteristic (frequency characteristic) that can be distinguished from contact with the patient's arm.
- conductive yarn may be used as the first conductor 210 or the second conductor 220 and may be knitted when the fiber sheet 200 is manufactured. Or you may make it sew on the fiber sheet 200 main body after manufacture using a conductive thread as the 1st conductor 210 or the 2nd conductor 220.
- FIG. By using conductive yarns as the first conductor 210 and the second conductor 220, the touch of the fiber sheet 200 can be improved. Thereby, it is not necessary to give discomfort when the patient puts his arm on the fiber sheet 200.
- the detection device 100 inputs an AC signal to the fiber sheet 200, acquires frequency characteristics on the fiber sheet 200 side, and determines the presence or absence of blood leakage.
- the AC signal input to the fiber sheet 200 by the detection device 100 various signals whose voltages change (that is, various signals having frequencies) can be used.
- the detection apparatus 100 may input a sine wave to the fiber sheet 200, may input a triangular wave, or may input a rectangular wave.
- the frequency characteristic which the detection apparatus 100 acquires can be various data measured according to the frequency of the alternating current signal input.
- the detection apparatus 100 measures the magnitude of impedance (Impedance) and its phase rotation as frequency characteristics will be described as an example, but the present invention is not limited to this.
- the impedance measurement will be described using the two-electrode method as an example, but a four-electrode method or the like may be used.
- the detection device 100 includes, for example, a microcomputer. Or it is good also as structures other than the structure containing a microcomputer, such as each part of the detection apparatus 100 comprised by a dedicated circuit, or using a smart phone or a personal computer.
- the AC signal output unit 110 outputs an AC signal for input to the fiber sheet 200. Specifically, the AC signal output unit 110 inputs an AC signal between a plurality of conductors provided in the fiber sheet 200 (between the first conductor 210 and the second conductor 220 in this embodiment). As described above, various signals whose voltage changes can be used as the AC signal output from the AC signal output unit 110.
- the frequency characteristic acquisition unit 120 acquires frequency characteristics between the conductors when the AC signal output unit 110 inputs an AC signal between the plurality of conductors provided in the fiber sheet 200.
- the frequency characteristic acquisition unit 120 may measure the impedance of the fiber sheet 200 at the frequency of the AC signal output from the AC signal output unit 110 or the AC signal in the fiber sheet 200 with respect to the AC signal output from the AC signal output unit 110. Measure phase rotation. Furthermore, for example, the frequency characteristic acquisition unit 120 outputs an AC signal of an impedance between the first conductor 210 and the second conductor 220 or an electric current flowing between the first conductor 210 and the second conductor 220. The phase rotation with respect to the AC signal output from the unit 110 is measured.
- the frequency characteristic acquisition unit 120 acquires frequency characteristics when the first frequency AC signal and the second frequency AC signal are input to the first conductor 210 and the second conductor 220, respectively.
- the frequency characteristic acquisition unit 120 measures the frequency characteristics when each AC signal having a different frequency is input to the first conductor 210 and the second conductor 220.
- the detection device 100 detects blood leakage based on the frequency characteristics of each of the AC signals having different frequencies, so that blood and sweat can be distinguished. Thereby, the erroneous detection of the needle removal can be reduced.
- the alarm output unit 130 outputs an alarm when the detection device 100 (detection signal output unit 191) detects blood leakage based on the frequency characteristic acquired by the frequency characteristic acquisition unit 120.
- the alarm output unit 130 includes a speaker and outputs an alarm sound according to the detection signal output from the detection signal output unit 191.
- the alarm output unit 130 may include a lamp in addition to or instead of the speaker, and output an alarm when the lamp emits light. Or you may make it the alarm output part 130 transmit an alarm signal to other apparatuses, such as transmitting an alarm signal to the personal computer (PC) installed in the nurse center.
- PC personal computer
- the storage unit 180 includes, for example, a storage device included in the detection apparatus 100 and stores various data.
- the detection condition storage unit 181 stores a determination threshold value as to whether or not the detection signal output unit 191 outputs a detection signal. That is, the threshold value is used as a detection condition when the detection signal output unit 191 determines whether or not blood leakage has been detected.
- the control unit 190 controls each unit of the detection device 100 to execute various functions.
- the control unit 190 is realized by, for example, a CPU (Central Processing Unit) included in the detection device 100 reading out a program from the storage unit 180 and executing the program.
- the detection signal output unit 191 outputs a detection signal when the frequency characteristic acquisition unit 120 acquires a predetermined frequency characteristic. More specifically, the detection signal output unit 191 determines whether or not the frequency characteristic acquired by the frequency characteristic acquisition unit 120 satisfies the detection condition stored in the detection condition storage unit 181. When the detection signal output unit 191 determines that the detection condition is satisfied, the detection signal output unit 191 outputs a detection signal to the alarm output unit 130.
- a CPU Central Processing Unit
- the detection signal output unit 191 has a frequency characteristic acquisition unit in which the AC signal output unit 110 inputs a plurality of AC signals having different frequencies between conductors (between the first conductor 210 and the second conductor 220).
- the frequency characteristic acquired by 120 indicates a predetermined difference according to the difference in the frequency of the AC signal from the AC signal output unit 110, and the AC signal output unit 110 inputs an AC signal having the same frequency between the conductors.
- a detection signal is output.
- the AC signal output unit 110 inputs an AC signal a plurality of times while changing the frequency between the first conductor 210 and the second conductor 220.
- the frequency characteristic acquisition unit 120 measures the frequency characteristic (for example, impedance or phase) between the first conductor 210 and the second conductor 220 every time the AC signal output unit 110 inputs an AC signal.
- the detection signal output unit 191 has a frequency characteristic between the first conductor 210 and the second conductor 220 that is greater than or equal to a predetermined magnitude according to a change in the frequency of the AC signal from the AC signal output unit 110. Determine if it has changed.
- the AC signal output unit 110 inputs an AC signal between the first conductor 210 and the second conductor 220, and inputs an AC current having the same frequency again after a predetermined time has elapsed.
- the number of times the AC signal output unit 110 inputs the AC signal may be two times or three or more times.
- the AC signal output unit 110 may continuously input an AC signal having the same frequency between the first conductor 210 and the second conductor 220 for a predetermined time.
- the frequency characteristic acquisition part 120 measures the frequency characteristic between the 1st conductor 210 and the 2nd conductor 220 in multiple times, when the alternating current signal output part 110 is inputting the alternating current signal of the same frequency. .
- the detection signal output unit 191 determines whether the first conductor 210 and the second conductor 220 correspond to the passage of time from when the frequency characteristic acquisition unit 120 measures the frequency characteristic to when the frequency characteristic is acquired. It is determined whether or not the frequency characteristic between them changes beyond a predetermined magnitude.
- the detection signal output unit 191 has a frequency characteristic between the first conductor 210 and the second conductor 220 that is greater than or equal to a predetermined magnitude according to a change in the frequency of the AC signal from the AC signal output unit 110. And the time between the frequency characteristic acquisition unit 120 measuring the frequency characteristic and the next acquisition of the frequency characteristic, between the first conductor 210 and the second conductor 220. When it is determined that the frequency characteristic has changed to a predetermined magnitude or more, a detection signal is output to the alarm output unit 130. As described above, whether the detection signal output unit 191 determines both the difference in the frequency characteristics based on the difference in the input frequency and the change in the frequency characteristics based on the passage of time, and whether or not blood has dripped on the fiber sheet 200. Can be determined with higher accuracy.
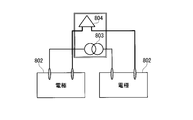
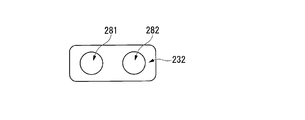
- FIG. 3 is an external view showing an outline of the outer shape of the container and measurement electrode used in the experiment.
- electrodes 802 were inserted into both ends of the acrylic container 801, and blood and saline were placed in the container.
- the acrylic container 801 was placed in a thermostatic bath, and an experiment was conducted at a temperature close to body temperature (37 degrees (° C.)).
- each of the electrodes 802 was connected to a constant current source 803 to pass an AC signal.
- Each of the electrodes 802 is connected to a voltmeter 804, and the voltage between the electrodes 802 was measured with the voltmeter 804.
- the electrode 802 simulates the first conductor 210 and the second conductor 220.
- the constant current source 803 simulates the AC signal output unit 110.
- the voltmeter 804 simulates the frequency characteristic acquisition unit 120.
- FIG. 4 is an explanatory diagram showing an outline of a circuit in the experiment.
- the constant current source 803 is connected between the two electrodes 802 and inputs an AC signal to the two electrodes 802.
- a voltmeter 804 is connected between the two electrodes 802 and measures the voltage between the two electrodes 802.
- Hct hematocrit value
- FIG. 5 is a graph showing the measurement result of the impedance magnitude Z in the state in which the saline solution is contained in the acrylic container 801.
- the magnitude of the impedance is also simply expressed as impedance.
- the horizontal axis of the graph shown in the figure represents the frequency, and the vertical axis represents the impedance.
- saline was placed in three acrylic containers 801 (hereinafter referred to as container A, container B, and container C) having different sizes, and impedance was measured.
- container A, container B, and container C acrylic containers 801 having different sizes, and impedance was measured.
- the frequency characteristic in the state where the saline is contained in the acrylic container 801 indicates the frequency characteristic of the acrylic container 801 itself. Further, the frequency characteristic in a state where the saline solution enters the acrylic container 801 simulates the frequency characteristic of sweat.
- Lines L11, L12, and L13 indicate impedance measurement values in the container A, the container B, and the container C, respectively.
- Each of the lines L11, L12, and L13 shows an approximately constant impedance in the range of about 3 kilohertz (kHz) to about 2 megahertz (MHz). In other frequency ranges, the influence of the contact impedance of the electrode and the measurement cable is considered to have occurred.
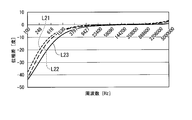
- FIG. 6 is a graph showing the measurement result of the phase difference (phase rotation) in a state in which saline is contained in the acrylic container 801.
- the phase difference here is a difference between the phase of the AC signal output from the constant current source 803 and the phase of the AC signal between the electrodes 802 whose voltage is measured by the voltmeter 804.
- the horizontal axis of the graph shown in FIG. 6 indicates the frequency, and the vertical axis indicates the phase difference.
- Lines L21, L22, and L23 indicate the phase differences in the container A, the container B, and the container C, respectively.
- All of the lines L11, L12, and L13 show a substantially constant phase difference (approximately zero phase difference) in the range of about 40 kilohertz to about 2 megahertz. From the measurement results of FIGS. 5 and 6, in the saline solution, both the amplitude and the phase are approximately constant in the range from about 40 kilohertz to about 2 megahertz. In other frequency ranges, the influence of the contact impedance of the electrode and the measurement cable is considered to have occurred.
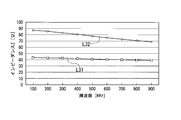
- FIG. 7 is a graph showing the measurement result of the impedance magnitude Z in the state in which porcine blood enters the acrylic container 801.
- the horizontal axis of the graph shown in the figure represents the frequency, and the vertical axis represents the impedance.
- the frequency characteristic in the state where porcine blood is contained in the acrylic container 801 simulates the frequency characteristic of human blood.
- Line L31 indicates the impedance of non-coagulated blood.
- Line L32 represents the impedance of the coagulated blood.
- the impedance decreases as the frequency increases from 100 kilohertz to 900 kilohertz.
- the impedance is larger than that in the case of non-coagulated blood, and the rate of decrease in impedance with respect to the increase in frequency is larger.
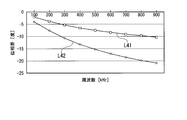
- FIG. 8 is a graph showing the measurement result of the phase difference (phase rotation) in a state where porcine blood is in the acrylic container 801.
- the phase difference in FIG. 8 is the difference between the phase of the AC signal output from the constant current source 803 and the phase of the AC signal between the electrodes 802 whose voltage is measured by the voltmeter 804.
- the horizontal axis of the graph shown in FIG. 8 indicates the frequency, and the vertical axis indicates the phase difference.
- a line L41 indicates a phase difference in non-coagulated blood.
- a line L42 indicates the phase difference in the coagulated blood.
- the phase difference increases as the frequency increases from 100 kilohertz to 900 kilohertz.
- the phase difference is larger than that in the case of non-coagulated blood, and the rate of increase in the phase delay with respect to the increase in frequency is also increased.
- the saline solution (sweat) and the blood are distinguished by comparing the amplitude and / or phase in the case of relatively low frequency and in the case of relatively high frequency. It is possible. Specifically, when the change according to the change in frequency is relatively small, it is determined as saline or sweat, and when it is relatively large, it is determined as blood.
- a relatively low frequency case for example, an AC signal of 100 kilohertz or less is used.
- a relatively high frequency for example, an AC signal of 900 kHz or higher is used.
- the AC signal output unit 110 inputs an AC signal of 100 kHz as an AC signal having a first frequency to the first conductor 210 and the second conductor 220.
- the AC signal output unit 110 inputs an AC signal of 900 kHz as the AC signal of the second frequency to the first conductor 210 and the second conductor 220.
- the frequency characteristic acquisition part 120 is the impedance between the 1st conductor 210 and the 2nd conductor 220, and the 1st conductor 210 and the 2nd in each case in the case of the 1st frequency and the 2nd frequency. The phase delay of the current between the conductor 220 and the current output from the AC signal output unit 110 is measured.
- the detection signal output part 191 outputs a detection signal, for example, when the measured value by the frequency characteristic acquisition part 120 satisfy
- the magnitude of impedance in the case of the second frequency is 95% or less with respect to the magnitude of impedance in the case of the first frequency. (In other words, it is smaller than 5 percent.)
- the magnitude of the phase delay in the case of the second frequency is more than twice the magnitude of the phase delay in the case of the first frequency.
- both the condition (1) and the condition (2) are satisfied.
- the conditions (1) and (2) are not satisfied. Therefore, the outflow of blood can be detected by the condition (1) or the condition (2) or a combination of these conditions, and erroneous detection due to sweat or the like can be reduced.
- the detection signal output unit 191 detects so as to distinguish between coagulated blood and non-coagulated blood.
- the fiber sheet 200 may be used for a gauze or bandage applied to a wound after surgery or the like, and the detection signal output unit 191 may detect a change in state where blood leakage coagulates with time. More specifically, when the detection signal output unit 191 includes a timer and detects that a predetermined time has elapsed since the end of the operation, the presence / absence of blood coagulation is determined.
- the detection device 100 When it is determined that there is no blood coagulation, the detection device 100 outputs an alarm for prompting confirmation of hemostasis. Further, after the bleeding from the wound stops, when the detection signal output unit 191 detects non-coagulated blood, the detection device 100 may output an alarm indicating the possibility that the wound has opened.
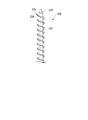
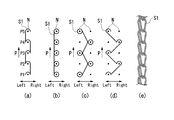
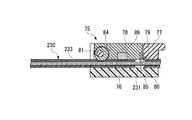
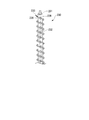
- 9 and 10 are structural views showing a schematic structure of the sensor fiber.
- the sensor fiber 230 shown in the figure has conductive yarns 231 and 233 each having a core 234 formed of an organic fiber and a copper foil 235 that covers the core 234.
- the conductive yarn 231 and the conductive yarn 233 are respectively covered with insulating cotton 232 (first insulating portion) and second insulating cotton 236 (second insulating portion), which are insulating materials having water absorption.
- the sensor fiber 230 covers a conductive yarn group composed of a plurality of first conductive yarns 231 (functioning as the first conductor 210) with insulating cotton 232 and insulates the outer periphery of the insulating cotton 232.
- the second conductive yarn 233 (functioning as the second conductor 220) covered with the conductive cotton 236 is spirally wound. That is, the second conductive thread 233 is disposed on the outer peripheral side of the second insulating portion 236. Since the first conductive yarn 231 is covered with the insulating cotton 232 and the second conductive yarn 233 is covered with the insulating cotton 236, the insulating yarns 231 and 233 can directly touch the body surface or the like. Disappear.
- the insulating material covering the conductive yarns 232 and 233 is not limited to cotton, and any insulating material having water absorption can be used. For example, rayon or silk can be used.
- FIG. 10 is an explanatory diagram showing the layer structure of the sensor fiber 230.
- FIG. 10 shows a layer structure in a cross section of the sensor fiber 230.
- insulating cotton 232 and insulating cotton 236 are interposed between the conductive yarn 231 and the conductive yarn 233.
- the main reason for such a coaxial structure is to reduce noise due to body movement or lap winding on the arm.
- the current density between the conductive yarn 231 and the conductive yarn 233 is maximized, and the influence of noise from the outside of the sensor fiber can be reduced.
- the measurement value hardly fluctuates.
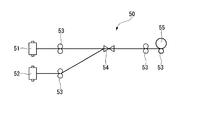
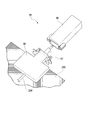
- FIG. 11 is a schematic view of a sensor fiber manufacturing apparatus 50.
- the sensor fiber manufacturing apparatus 50 includes a first supply reel 51 that supplies a core wire, a second supply reel 52 that supplies a covering yarn, a plurality of feed rollers 53, and a false twisting apparatus 54.
- a take-up roller 55 The manufacturing apparatus 50 can arbitrarily change the pitch of the covered wire to be coated (pitch in the longitudinal direction of the yarn) by adjusting the false twisting apparatus 54.
- the conductive yarn 231 (conductive yarn group) is set as the core wire on the first supply reel 51, and the insulating cotton 232 is set as the covering yarn, and the conductive material covered (covered) by the insulating cotton 232 is covered.
- a yarn 231 (hereinafter referred to as a first processed yarn) is manufactured.
- the first processed yarn is taken up by the take-up roller 55.
- the conductive yarn 233 covered with the insulating cotton 236 is manufactured.
- the first processed yarn is set on the first supply reel 51, the conductive yarn 233 is set on the second supply reel 52, and the first processed yarn (hereinafter referred to as the second processed yarn) around which the conductive yarn 233 is wound. Called process yarn).
- the sensor fiber 230 can be manufactured more easily. That is, by using the cover ring, the sensor fiber 230 can be manufactured using an existing manufacturing apparatus.
- the manufacturing method of the sensor fiber 230 is not limited to this, and may be manufactured, for example, by knitting a conductive thread that is a core wire and an insulating cotton that is a covered wire, such as a braid.
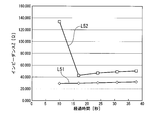
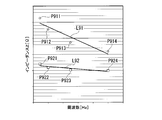
- FIG. 12 is a graph showing the change over time of the measured value of the magnitude Z of impedance in a state where saline or blood (pig blood) is dropped on the sensor fiber.
- the horizontal axis of the graph shown in the figure shows the elapsed time from the dropping, and the vertical axis shows the impedance.
- a line L51 indicates the impedance in a state where saline is dropped, and a line L52 indicates the impedance in a state where blood is dropped.
- an AC signal of 75 kilohertz is input to the sensor fiber 230 (conductive threads 231 and 233).
- the impedance In contrast to the dripping of the saline solution indicated by the line L51, the impedance hardly changes, whereas in the dripping of the blood indicated by the line L52, the impedance increases after decreasing once. Needless to say, the impedance is very high before the saline or blood is dropped on the sensor fiber.
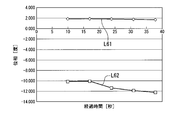
- FIG. 13 is a graph showing the change over time of the measured value of the phase difference in a state where saline solution or blood (pig blood) is dropped on the sensor fiber.
- the phase difference here is the phase difference (phase delay) of the AC signal flowing between the conductive yarns 231 and 233 with respect to the phase of the AC signal input to the conductive yarns 231 and 233.
- the horizontal axis of the graph shown in FIG. 13 indicates the elapsed time from the dropping, and the vertical axis indicates the phase difference.
- a line L61 indicates a phase difference in a state where saline is dropped, and a line L62 indicates a phase difference in a state where blood is dropped.
- an AC signal of 1 megahertz is input to the sensor fiber 230 (conductive threads 231 and 233).
- the phase difference is larger in the state where the blood indicated by the line L62 is dropped than in the state where the saline shown by the line L61 is dropped.
- the phase difference hardly changes in the dripping of the saline solution, whereas the phase is delayed with the passage of time in the dripping of the blood.
- FIG. 12 and FIG. 13 there is a difference in the time change of the frequency characteristics between saline and blood. Therefore, as a detection condition of the detection signal output unit 191, a condition regarding a change in the frequency characteristic over time may be used in addition to or instead of the difference in frequency characteristic due to the difference in frequency.
- the difference in frequency characteristics between saline and blood described with reference to FIGS. 3 to 13 is considered to be due to the structure of red blood cells in the blood. More specifically, it is considered that the impedance and the phase difference change depending on the frequency due to the dielectric caused by the red blood cell membrane. Therefore, the detection device 100 can detect blood by distinguishing it from various liquids that do not include structures such as red blood cell membranes, such as water and cola, as well as sweat. Therefore, in the detection apparatus 100, even when a patient spills a drink such as water or cola, the possibility of erroneous detection of the withdrawal of the needle can be reduced.
- FIG. 14 is an explanatory diagram showing an example of a change over time in the impedance ratio of blood and physiological saline.
- the horizontal axis of the graph of the figure shows the elapsed time from the dropping of the liquid, and the vertical axis shows the impedance ratio.
- an impedance signal is measured by inputting an AC signal of 5 MHz and an AC signal of 10 kHz between the first conductor 210 and the second conductor 220 at each sampling time. . Then, the impedance ratio is obtained by dividing the impedance when an AC signal of 5 MHz is input by the impedance when an AC signal of 10 kHz is input.
- Line L71 shows an example of the time change of the impedance ratio when physiological saline is dropped on the fiber sheet 200.
- Lines L72 to L76 show examples of changes in impedance ratio over time when blood with a hematocrit (Ht) value of 20%, 30%, 43%, 41%, and 44% is dropped on the fiber sheet 200, respectively.
- Ht hematocrit
- the impedance ratio is decreased both when the physiological saline (line L71) is dropped and when blood of any hematocrit value (lines L72 to L76) is dropped.
- the impedance ratio of blood (lines L72 to L76) is higher than that of physiological saline (line L71), blood and physiological saline (only when the impedance ratio threshold value is determined after 5 seconds of dripping). It can be seen that sweat can be separated. Furthermore, after the impedance ratio is lowered, the low impedance ratio is maintained in the case of the organized saline solution (line L71). On the other hand, in the case of blood (lines L72 to L76), the impedance ratio once increases and then increases.
- the detection device 100 detects that a liquid has dropped on the fiber sheet 200, and further determines whether or not the liquid is blood, thereby detecting leakage of liquid other than blood, such as infusion, in addition to leakage of blood. be able to.
- the leakage of the liquid can be detected by detecting the decrease in impedance.
- Determination of whether or not the liquid dripping on the fiber sheet 200 is blood can be performed by, for example, determining whether the time derivative of the impedance ratio is equal to or greater than a predetermined threshold. Specifically, when the liquid dripping on the fiber sheet 200 is blood, the impedance ratio between the first conductor 210 and the second conductor 220 decreases and then increases. This increase in impedance ratio can be detected by the value of the time derivative of the impedance ratio.
- the detection signal output unit 191 calculates the time derivative of the impedance ratio, and determines whether or not the obtained time derivative of the impedance ratio is equal to or greater than a predetermined threshold value. When the time derivative of the impedance ratio is equal to or greater than a predetermined threshold, the detection signal output unit 191 determines that blood has dripped on the fiber sheet 200. On the other hand, when the time derivative of the impedance ratio is less than the predetermined threshold, the detection signal output unit 191 determines that a liquid other than blood has dripped on the fiber sheet 200.
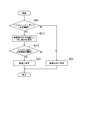
- FIG. 15 is a flowchart illustrating an example of a processing procedure in which the detection apparatus 100 detects that blood has dropped on the fiber sheet 200 and liquid other than blood has dropped.
- variable i is a variable that indicates the number of times that the frequency characteristic acquisition unit 120 measures the impedance between the first conductor 210 and the second conductor 220.
- variable j is a variable indicating the number of times that the detection signal output unit 191 calculates the impedance ratio based on the impedance measurement value.
- the frequency characteristic acquisition unit 120 acquires an impedance measurement value between the first conductor 210 and the second conductor 220 (step S102).
- the AC signal output unit 110 has an AC signal having a predetermined first frequency and a second frequency (a predetermined frequency different from the first frequency) between the first conductor 210 and the second conductor 220. Input AC signals.
- the frequency characteristic acquisition part 120 is the impedance between the 1st conductor 210 and the 2nd conductor 220 about each, when the alternating signal of a 1st frequency is input, and the alternating signal of a 2nd frequency is input. taking measurement. It is assumed that the first frequency is lower than the second frequency.
- the impedance measurement value when the AC signal output unit 110 inputs the first frequency AC signal in the i-th sampling is expressed as Za (i)
- the impedance when the second frequency AC signal is input is expressed as Zb (i).
- the frequency characteristic acquisition unit 120 causes the storage unit 180 to store the acquired impedance measurement values Za (i) and Zb (i).
- the detection signal output unit 191 determines whether i ⁇ N (step S103).
- the constant N (N is a positive integer of N ⁇ 1) is a constant set in advance as the number of data used by the detection signal output unit 191 to calculate the moving average of the impedance measurement values.
- the detection signal output unit 191 calculates a moving average of the impedance measurement values obtained in step S102 (step S104). Specifically, the detection signal output unit 191 obtains the latest N (Za (i ⁇ N + 1) to Za (i) among the impedance measurement values obtained by the frequency characteristic acquisition unit 120 at the first frequency AC signal input. )) Moving average Za_mean (i) is calculated. The detection signal output unit 191 also obtains the nearest N pieces (Zb (i ⁇ N + 1) to Zb (i)) of the impedance measurement values acquired by the frequency characteristic acquisition unit 120 at the second frequency AC signal input. The moving average Zb_mean (i) is calculated. The detection signal output unit 191 stores the calculated moving averages Za_mean (i) and Zb_mean (i) in the storage unit 180.
- the storage unit 180 does not have to store all the impedance measurement values acquired by the frequency characteristic acquisition unit 120 in step S102.
- the storage unit 180 includes the latest N impedance measurement values (Za (i ⁇ N + 1) to Za (i)) at the first frequency AC signal input and the impedance measurement value at the second frequency AC signal input. Of these, it is only necessary to memorize the latest N pieces (Zb (i ⁇ N + 1) to Zb (i)). Further, the storage unit 180 need not store all the moving averages calculated by the detection signal output unit 191 in step S104.
- the storage unit 180 includes Za_mean (i) for the latest one of the moving averages of the impedance measurement values at the first frequency AC signal input and the latest of the moving averages of the impedance measurement values at the second frequency AC signal input.
- One Zb_mean (i) may be stored.
- the detection signal output unit 191 calculates the impedance ratio Zmean (i) based on the moving averages Za_mean (i) and Zb_mean (i) of the impedance measurement values obtained in step S104, and stores them in Z (j). (Step S105). Specifically, the detection signal output unit 191 calculates the impedance ratio Zmean (i) by dividing the moving average Za_mean (i) of the impedance measurement value by the moving average Zb_mean (i) of the impedance measurement value. Then, the detection signal output unit 191 stores the calculated impedance ratio Zmean (i) in the storage unit 180 as the impedance ratio Z (j).
- the detection signal output unit 191 determines whether j ⁇ M (step S106).
- the constant M (M is a positive integer of M ⁇ 2) is a constant set in advance as the number of data used by the detection signal output unit 191 to determine whether or not the liquid is dripped onto the fiber sheet 200. is there.
- the storage unit 180 stores at least the latest M (Z (j ⁇ M + 1) to Z (j)) among the impedance ratios calculated by the detection signal output unit 191 in step S105.
- the storage unit 180 may store all the impedance ratios calculated by the detection signal output unit 191 in step S105 (Z (1) to Z (j)).
- step S106 NO
- step S106 determines whether or not all the latest M impedance ratios obtained in step S106 are equal to or less than the liquid detection threshold (step S106).
- step S107 the detection signal output unit 191 determines whether or not Z (j ⁇ M + 1) ⁇ the liquid detection determination threshold value, and Z (j) ⁇ the liquid detection determination threshold value (step S107).
- the detection signal output unit 191 performs blood determination processing (step S111).
- the blood determination process is a process for determining whether or not the liquid dripping on the fiber sheet 200 is blood.
- FIG. 16 is a flowchart illustrating a procedure in which the detection signal output unit 191 performs blood determination processing.
- the detection signal output unit 191 performs the process of FIG. 16 in step S111 of FIG.
- the detection signal output unit 191 determines whether or not the latest impedance ratio Z (j) obtained in step S105 of FIG. 15 is greater than or equal to a predetermined impedance ratio threshold (step S201).
- the detection signal output unit 191 determines the most recent M impedance ratios Z (step S105 in FIG. 15).
- An average value Z (j) div_mean of time differentiation is calculated from j ⁇ M + 1) to Z (j) (step S211).
- the detection signal output unit 191 uses the difference obtained by subtracting the impedance ratio Z (j ⁇ M + 1) from the impedance ratio Z (j ⁇ M + 2) as the time interval (sampling period) for impedance measurement in step S102 in FIG. To calculate the time derivative of the impedance ratio Z (j ⁇ M + 1).
- the detection signal output unit 191 divides the difference obtained by subtracting the impedance ratio Z (j ⁇ M + k) from the impedance ratio Z (j ⁇ M + k + 1) by the time interval of the impedance measurement in step S102 of FIG.
- the process of calculating the time derivative of the impedance ratio Z (j ⁇ M + k) is performed for all positive integers k satisfying 1 ⁇ k ⁇ M ⁇ 1.
- the detection signal output unit 191 calculates an average value of all obtained time derivatives (time derivative of impedance ratio Z (j ⁇ M + 1) to time derivative of impedance ratio Z (j ⁇ 1)) to An average value Z (j) div_mean of the differentiation is used.
- the detection signal output unit 191 determines whether or not the time differential Z (j) div_mean of the impedance ratio obtained in step S211 is equal to or greater than a predetermined time differential threshold (step S212). When it is determined that the time differential Z (j) div_mean of the impedance ratio is equal to or greater than the time differential threshold (step S212: YES), the detection signal output unit 191 determines that the liquid dripping on the fiber sheet 200 is blood ( Step S221). After step S221, the process of FIG. 16 is terminated, and the process returns to the process of FIG.
- step S221 when it is determined in step S221 that the time ratio Z (j) div_mean of the impedance ratio is less than the time differentiation threshold (step S212: NO), the detection signal output unit 191 indicates that the liquid dripping on the fiber sheet 200 is It is determined that the liquid is other than blood (step S231). After step S231, the process of FIG. 16 is terminated, and the process returns to the process of FIG. On the other hand, when it determines with impedance ratio Z (j) being less than an impedance ratio threshold value by step S201 (step S201: NO), it changes to step S231.
- the detection signal output unit 191 performs a conditional branch based on the determination result in step S111 (step S112). Specifically, the detection signal output unit 191 performs conditional branching based on whether or not it is determined that the liquid dripping on the fiber sheet 200 is blood. If it is determined that the liquid dripping on the fiber sheet 200 is blood (step S112: YES), the alarm output unit 130 outputs a blood leak detection alarm (step S121).
- the blood leak detection alarm here is an alarm indicating that blood has dropped on the fiber sheet 200.
- step S ⁇ b> 121 the detection signal output unit 191 outputs a detection signal indicating that blood has dropped on the fiber sheet 200 to the alarm output unit 130. Then, the alarm output unit 130 outputs a blood leak detection alarm according to the detection signal from the detection signal output unit 191.
- the alarm output unit 130 outputs a liquid detection preliminary alarm (step S131).
- the liquid detection preliminary alarm referred to here is an alarm indicating that liquid other than blood drips on the fiber sheet 200.
- the detection signal output unit 191 outputs a detection signal indicating that a liquid other than blood has dripped onto the fiber sheet 200 to the alarm output unit 130.
- the alarm output unit 130 outputs a liquid detection preliminary alarm according to the detection signal from the detection signal output unit 191.
- the detection apparatus 100 may repeatedly perform the process of FIG. Thereby, the detection apparatus 100 can detect that the blood has dripped when the liquid has dripped on the fiber sheet 200 after detecting that the liquid other than blood has dripped on the fiber sheet 200.
- the detection device 100 or a person may distinguish between blood and a liquid other than blood using a Cole-Cole locus.
- a Cole-Cole locus instead of the process in which the detection signal output unit 191 determines whether the liquid dripping on the fiber sheet 200 is blood in step S201 of FIG. 16 by comparing the average value of the impedance ratio with a threshold value, Cole The determination may be performed using a Cole locus. Processing for distinguishing blood and liquid other than blood using the Cole-Cole locus will be described with reference to FIGS. In the description of FIG. 17 and the description of FIG. 18, the impedance is represented by a complex number including resistance in the real part and reactance in the imaginary part.
- FIG. 17 is an explanatory diagram showing an example of a Cole-Cole locus obtained by impedance measurement.
- the horizontal axis of the graph shown in the figure represents the real part of the impedance, and the vertical axis represents the imaginary part of the impedance.
- a standardized impedance value (a value obtained by dividing the impedance value by a predetermined size (real number)) is used.
- the Cole-Cole locus may be obtained based on the impedance value itself without standardizing the impedance value.
- a line L81 in the figure shows the measured impedance value as a vector.
- the angle ⁇ indicates the phase difference between the input signal and the impedance measurement value.
- the measured impedance value can be plotted on the graph.
- a line L82 indicates a Cole-Cole locus.
- the Cole-Cole locus has a shape of a part of an arc. The Cole-Cole locus is obtained from the impedance measurement value.
- a Cole-Cole locus is obtained by approximating with a part (performing curve fitting).
- a method for performing curve fitting for example, a known approximation method such as a least square method can be used.
- the AC signal output unit 110 inputs at least three AC signals having different frequencies between the first conductor 210 and the second conductor 220, and the frequency characteristic acquisition unit 120 The frequency characteristic between the one conductor 210 and the second conductor 220 is acquired for each input AC signal.
- the point P11 indicates the center of an arc indicating the Cole-Cole locus (the center of a circle including the arc as a part of the circumference).
- Points P12 and P13 are intersections of the Cole-Cole locus and the horizontal axis, respectively. Of the two intersections, the point with the smaller real part of the impedance is designated as point P12, and the part with the larger real part of the impedance is designated as point P13.
- a point P14 is a midpoint of an arc indicating the Cole-Cole locus. Therefore, the line segment connecting the points P11 and P14 (line L84) is the angle formed by the line segment connecting the points P11 and P12 (line L83) and the line segment connecting the points P11 and P13. Is divided into two equal parts.
- the angle ⁇ / 2 is an angle formed by a line segment connecting the point P12 and the point P11 (line L83) and the horizontal axis.
- the Cole-Cole trajectory is expressed as in Equation (1)
- Z (f) represents the impedance when a signal of frequency f is input.
- R ⁇ represents resistance (real part of impedance) when a signal having an infinite frequency is input. Since it is impossible to actually measure the R ⁇ , Cole-Cole intersection of the trajectory with the horizontal axis (the two certain intersections, Resistance smaller) read from. In the example of FIG. 17, the resistance indicated by the point P12, used as R ⁇ .
- R 0 represents resistance when a signal having a frequency of 0, that is, a DC signal is input. R 0 may be actually measured, or may be read from the intersection of the Cole-Cole locus and the horizontal axis (the larger of the two intersections, the resistance is greater). In the example of FIG.
- the resistance indicated by the point P13 can be used as R0 .
- f c denotes a center frequency corresponding to the point P14 (input frequency point P14 is obtained impedance values indicate).
- J represents an imaginary unit.
- ⁇ represents a coefficient of a value obtained by dividing the angle ⁇ / 2 described above by ⁇ / 2.
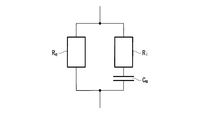
- FIG. 18 is an explanatory diagram showing an equivalent circuit model that simulates the impedance of a liquid having a film.
- R i denotes the resistance by the object with a film included in the liquid.
- C m represents the capacitance due to an object having a film contained in a liquid.
- the capacitance here can be regarded as the reactance in FIG. R e represents a resistance by an object other than an object having a film included in the liquid.
- plasma corresponds to an object other than an object having a membrane.
- the equivalent circuit model here is an electric circuit having an impedance that is equal to or approximately equal to the impedance of the modeling target (here, the liquid having a film).
- One or more of an electric resistance (resistor), a capacitor (capacitor), and a coil (reactor) are used as elements constituting the equivalent circuit.
- the equivalent circuit model shown in FIG. 18 the electrical resistance of the resistance R i, the capacitor capacitance C m, and are configured using the electrical resistance of the resistance R e.
- the resistance, capacitance, or impedance of the elements constituting the equivalent circuit model is referred to as a circuit parameter.
- a circuit parameter For example, in the equivalent circuit model shown in FIG. 18, resistance R i, a capacitance C m, each of resistance R e corresponds to the circuit parameters.
- the detection signal output unit 191 or the person calculates a circuit parameter value (circuit parameter value) in which the impedance of the equivalent circuit model is equal to or substantially equal to the impedance measurement value to be modeled.
- FIG. 18 shows an example of an equivalent circuit model, and the same method can be applied to an equivalent circuit model having a more complicated structure.
- the detection signal output unit 191 or a person may use a two dispersion model or a three dispersion model.
- the one-dispersion model here is a model constituted by an electric circuit in which one series connection of an electric resistance and a capacitor (or coil) and an electric resistance are connected in parallel.
- the two-dispersion model is a model configured by an electric circuit in which two series connections of an electric resistance and a capacitor (or a coil) and an electric resistance are connected in parallel.
- the 3-dispersion model is a model configured by an electric circuit in which three series connections of an electric resistance and a capacitor (or a coil) and an electric resistance are connected in parallel.
- the red blood cells have a single membrane structure, and therefore the impedance of the modeling target can be simulated using a single dispersion model.
- the modeled object is an animal cell
- the animal cell has a double membrane structure because it has a nucleus in the cell membrane.
- the impedance of the modeling target can be simulated using a two-dispersion model.
- the impedance can be simulated using a three-dispersion model.
- Detection signal output unit 191 or the person on the basis of the Cole-Cole trajectory obtained from impedance measurements determine the value of the model parameters (the value of resistance R i, a capacitance C m and resistance R e).
- resistance R 0 determined from Cole-Cole trajectory, using the resistance R ⁇ and center frequency f c can be obtained the value of resistance R i, a capacitance C m and resistance R e, as follows .
- the resistance Re is obtained as shown in Equation (2).
- Formula (4) is obtained by substituting Formula (2) into Formula (3).
- the center frequency f c is shown as Equation (5).
- Equation (5) can be transformed to obtain Equation (6).
- the detection signal output unit 191 or the person calculates the impedance R e , impedance R i , and capacitance C m using equations (1), (3), and (6), respectively.
- the values of the resistance R i , the capacitance C m , and the resistance R e vary depending on the film and the tissue structure contained in the liquid. Therefore, the type of liquid can be estimated from these values.
- the detection signal output unit 191 or the person compares the capacitance C m with a predetermined threshold value (blood detection threshold value), so that the liquid dripping on the fiber sheet 200 (the liquid to be measured) is blood. It is determined whether or not.
- the detection signal output unit 191 or a human If the capacitance C m is greater than the threshold value for detecting blood, the detection signal output unit 191 or a human, the liquid dripping into the fiber sheet 200 is determined to be blood. On the other hand, it is determined that if the capacitance C m is equal to or smaller than the threshold value for detecting blood, the detection signal output unit 191 or a human, the liquid dripping into the fiber sheet 200 is a liquid other than blood.
- the detection signal output unit 191 or a person may obtain the values of all model parameters included in the equivalent circuit model, or may obtain only the values of some model parameters. For example, in the example of FIG. 18, the detection signal output unit 191 or a person calculates impedance R e , impedance R i , and capacitance C m , compares each value with a threshold value, and hangs on the fiber sheet 200. It may be determined whether or not the liquid is blood.
- the detection signal output unit 191 or a person calculates only the capacitance C m among the impedance R e , the impedance R i , and the capacitance C m , and compares the capacitance C m with the threshold value as described above, and the fiber It may be determined whether the liquid dripping on the sheet 200 is blood.
- a pulse signal or a step signal may be input between conductors.
- impedance measurement values for different input frequencies can be obtained by Fourier transforming the impedance measurement values. Accordingly, the time required for inputting a signal between the conductors can be shortened compared with the case where an AC signal is input between the conductors while changing the frequency.
- a signal obtained by superimposing three or more sine waves having different frequencies may be input between the conductors.
- impedance measurement values for different input frequencies can be obtained by Fourier transforming the impedance measurement values. Accordingly, the time required for inputting a signal between the conductors can be shortened compared with the case where an AC signal is input between the conductors while changing the frequency.
- the AC signal output unit 110 executes the AC signal input step of inputting at least three AC signals having different frequencies between the plurality of conductors provided on the fiber sheet.
- a person may connect an AC signal output device (AC power supply) whose frequency is variable between a plurality of conductors to execute the AC signal input step.
- the frequency characteristic acquisition part 120 performs the impedance measurement value acquisition step which acquires the impedance measurement value between conductors for every alternating current signal input at the alternating current signal input step.
- a person may perform the impedance measurement value acquisition step using an impedance measurement device (for example, an oscilloscope).
- the detection signal output unit 191 executes a Cole-Cole locus acquisition step for obtaining a Cole-Cole locus that approximates the impedance measurement value obtained in the impedance measurement value acquisition step with a part of an arc.
- a person may execute the Cole-Cole locus acquisition step.
- the detection signal output unit 191 executes a capacitance acquisition step of obtaining the capacitance in a predetermined equivalent circuit model that simulates the impedance of the liquid having the film based on the Cole-Cole locus.
- a person may perform the capacitance acquisition step.
- the detection signal output part 191 performs the liquid kind estimation step which estimates the kind of liquid based on the acquired capacitance.
- a person may perform the liquid type estimation step. Thereby, the detection signal output unit 191 or the person can determine with high accuracy whether blood has dripped on the fiber sheet 200. Note that when the detection signal output unit 191 determines in the liquid type estimation step that blood has dropped on the fiber sheet 200, the alarm output unit 130 may output a blood leak detection alarm.
- the detection signal output unit 191 or a person may determine whether the liquid dripping on the fiber sheet 200 is a predetermined liquid other than blood. For example, if the milk is hanging in the fiber sheet 200, the capacitance C m is smaller than that of blood. Therefore, the detection signal output unit 191 or the person, in addition to comparing the blood detection threshold value and the capacitance C m , has a threshold value that is smaller than the blood detection threshold value set in advance as the milk detection threshold value. Compare the capacitance C m . When the capacitance C m is larger than the milk detection threshold and not more than the blood detection threshold, the detection signal output unit 191 or the person determines that the liquid dripping on the fiber sheet 200 is milk.
- the AC signal output unit 110 inputs a plurality of AC signals having different frequencies between the conductors (between the first conductor 210 and the second conductor 220), and the frequency characteristic acquisition unit 120 acquires the signals.
- the frequency characteristic obtained shows a predetermined difference according to the difference in the frequency of the AC signal from the AC signal output unit 110, and the AC signal output unit 110 inputs the AC signal multiple times between the conductors, and the frequency characteristic acquisition unit
- the detection signal output unit 191 outputs a detection signal (blood leakage detection alarm).
- the detection signal output unit 191 is used for both a difference in frequency characteristics between conductors due to a difference in frequency of an AC signal input between conductors, and a specific change in frequency between conductors over time. Based on this, by determining whether or not to output a detection signal, it is possible to determine with high accuracy whether or not the liquid dripping on the fiber sheet is a predetermined liquid (for example, blood), and erroneously output the detection signal The possibility of being reduced can be reduced.
- a predetermined liquid for example, blood
- the detection signal output unit 191 or a person obtains a Cole-Cole locus that approximates an impedance measurement value between conductors (between the first conductor 210 and the second conductor 220) with a part of an arc. Then, the detection signal output unit 191 or the person obtains the capacitance in a predetermined equivalent circuit model that simulates the impedance of the liquid having the film based on the Cole-Cole locus, and estimates the type of the liquid from the obtained capacitance.
- the detection signal output unit 191 or the person can determine whether the liquid dripping on the fiber sheet 200 is a predetermined liquid (for example, blood). The determination of whether or not can be performed with high accuracy.
- the detection device 100 or a person may distinguish between blood and a liquid other than blood based on the slope of a straight line that approximates the relationship between the frequency of the input signal and the impedance measurement value. For example, instead of the process in which the detection signal output unit 191 determines whether or not the liquid dripping on the fiber sheet 200 is blood in step S201 of FIG. 16 by comparing the average value of the impedance ratio and the threshold value, Based on the slope of the straight line, blood and liquid other than blood may be distinguished. A process for distinguishing between blood and a liquid other than blood based on the inclination of the straight line will be described with reference to FIG.
- FIG. 19 is an explanatory diagram showing an example of a straight line that approximates the relationship between the frequency of the input signal and the impedance measurement value in a certain frequency band.
- the horizontal axis of the graph shown in the figure represents the frequency of the input signal (input frequency), and the vertical axis represents the impedance (impedance magnitude).
- Line L91 shows an example of a straight line that approximates the relationship between the frequency of the input signal for blood and the impedance measurement value.
- points P911, P912, P913, and P914 indicate the relationship between the input frequency and the impedance at that frequency when an AC signal is input to the blood, respectively.
- a line L91 is a line obtained by linearly approximating the points P911, P912, P913, and P914.
- the line L92 shows an example of a straight line that approximates the relationship between the frequency of the input signal with respect to the saline solution and the impedance measurement value.
- points P921, P922, P923, and P924 indicate the relationship between the input frequency and the impedance at that frequency when an AC signal is input to the saline solution, respectively.
- a line L92 is a line obtained by linearly approximating the points P921, P922, P923, and P924.
- the slope of the approximate straight line has a negative value. That is, blood shows a smaller impedance as the input frequency is higher, so that the approximate straight line in the case of blood becomes lower right.
- the magnitude of the inclination of the approximate straight line is smaller than that in the case of blood. That is, in the case of saline, the magnitude of the change in impedance with respect to the change in input frequency is small, so that the approximate straight line in the case of saline is closer to the horizontal (parallel to the horizontal axis) than in the case of blood.
- the detection device 100 or a person distinguishes blood and liquid other than blood based on the slope of a straight line that approximates the relationship between the frequency of the input signal and the impedance measurement value.
- the storage unit 180 of the detection apparatus 100 stores in advance a threshold value of the slope of the approximate line as a negative real constant.
- the detection signal output part 191 of the detection apparatus 100 calculates
- a method of linear approximation for example, the least square method can be used, but is not limited thereto.
- the approximation formula is not limited to a linear function, and a curve approximation using a multi-order function, an exponential function, a logarithmic function, a logistic curve, or the like may be used. Then, the detection signal output unit 191 compares the obtained inclination with a threshold value, and determines that blood is detected when the inclination is smaller than the threshold value (that is, when the magnitude of the inclination is larger than the threshold value). To do. On the other hand, when the inclination is equal to or larger than the threshold value (that is, when the magnitude of the inclination is equal to or smaller than the threshold value), the detection signal output unit 191 determines that blood is not detected.
- the storage unit 180 stores the threshold value as ⁇ 0.000001 ( ⁇ 1 ⁇ 10 ⁇ 6 ).
- the detection signal output unit 191 outputs a detection signal indicating that blood has been detected. That is, the detection signal output unit 191 determines that blood has been detected.
- the detection signal output unit 191 suppresses the output of the detection signal. That is, the detection signal output unit 191 determines that blood is not detected.
- the detection signal output unit 191 obtains a slope of a straight line that approximates the relationship between the frequency of the input signal and the impedance measurement value, and compares the obtained slope with the threshold value in a relatively simple process. It can be determined whether or not a predetermined liquid is detected. In this respect, the load on the detection signal output unit 191 can be reduced. Furthermore, in steps S211 to S212 in FIG. 16, detection determination of blood or the like may be performed using a time change such as an approximate straight line or an inclination of an approximate curve.
- the structure will be described.
- the bandage-shaped fiber sheet 200 is used by being wrapped around a site for monitoring blood leakage such as an arm punctured with a needle during artificial dialysis, for example.
- the fiber sheet 200 can be cut to an arbitrary length, and by connecting the two conductive yarns 231 and 233 to one of the ends of the conductive yarns 231 and 233, respectively, to the AC signal output unit 110, It can be set as the structure of FIG.
- the detection apparatus 100 can detect blood leakage as described above.
- the fiber sheet 200 is configured such that the sensor fiber 230 meanders and is knitted (sewn) in a wavy manner to an insulating fiber sheet main body 201 having water absorption.
- the detection apparatus 100 can detect blood leakage as described above.
- the detection device 100 can detect liquid penetration such as blood leakage in various portions of the fiber sheet 200.
- the fiber sheet 200 can be configured.
- the two conductors can be arranged at a relatively narrow interval, and the detection accuracy of the detection signal output unit 191 can be increased when the liquid soaks into the fiber sheet 200.
- the fiber sheet 200 is easier than the case where the two conductors (the conductive threads 231 and 233) are knitted or sewn into a bandage or a fiber sheet or the like so as not to contact each other and at a relatively narrow interval. Can be generated. Thereby, the manufacturing cost of the fiber sheet 200 can be reduced.
- the fiber sheet 200 in which the sensor fiber 230 is knitted can be manufactured in the following three patterns.
- the fiber sheet 200 (bandage) of the pattern A has (1) warp, (2) elastic yarn, (3) weft, and (4) sensor fiber as constituent elements.
- a method for manufacturing the pattern A fiber sheet 200 will be described. First, we made stitches using elastic yarn (for example, covering yarn with polyurethane as a core material) as warp, and wefted weft while inserting elastic yarn (for example, covering yarn with polyurethane as core material) A thing is made into the fiber sheet main body 201 (elastic bandage) used as a base fabric. Sensor fibers are inserted and knitted into the fiber sheet main body 201 to obtain a pattern A fiber sheet 200.
- elastic yarn for example, covering yarn with polyurethane as a core material
- elastic yarn for example, covering yarn with polyurethane as core material
- the fiber sheet 200 of the pattern B has (1) warp, (2) elastic yarn, (3) weft, and (4) sensor fiber as constituent elements.
- the fiber sheet 200 of the pattern B has the same configuration as the fiber sheet 200 of the pattern B except that non-stretchable yarn is used as the warp.
- the fiber sheet 200 of the pattern C has (1) warp, (2) weft, and (3) sensor fiber as constituent elements. That is, the fiber sheet 200 of the pattern C is a fiber sheet 200 that does not use elastic yarn.
- the manufacturing method of the fiber sheet 200 of the pattern C is demonstrated. First, a yarn having a stretchability (for example, a covering yarn having polyurethane as a core material) is used as a warp, and a weave knitted fabric is used as a fiber sheet body 201 serving as a base fabric. Sensor fibers are inserted and knitted into the fiber sheet main body 201 to obtain a pattern C fiber sheet 200.
- a yarn having a stretchability for example, a covering yarn having polyurethane as a core material
- a weave knitted fabric is used as a fiber sheet body 201 serving as a base fabric.
- Sensor fibers are inserted and knitted into the fiber sheet main body 201 to obtain a pattern C fiber sheet 200.
- FIG. 21 is a view showing a warp knitting structure of a bandage-like fiber sheet 200.
- the warp knitting method includes an open crochet shown in FIG. 21 (a), a close crochet shown in FIG. 21 (b), a closed tricot shown in FIG. Any of the open tricots shown in FIG. Moreover, you may combine these.
- the tricot knitting as shown in FIG. 21, not only the knitting needles adjacent to each other but also one stitch skipping or two stitch skipping may be used.
- N indicates a knitting needle.
- FIG. 21A to FIG. 21D show that the knitting process proceeds from the lower side in the longitudinal direction P to the upper side in time series.
- a line S1 indicates the carrying of the warp yarn on the knitting needle N.
- the open crochet shown in FIG. 21A and the close crochet shown in FIG. 21B are knitted with one knitting needle N in the left-right direction.
- the warp S1 is applied from the left to the right at the main shaft first rotation P1 shown at the bottom, and the warp from the right to the left at the second main shaft second rotation P2. S1 takes.
- the warp S1 is applied from the left to the right, and the carrying of the warp S1 is repeated thereafter.
- the closed tricot shown in FIG. 21C and the open tricot shown in FIG. 21D are knitted by two knitting needles N adjacent in the left-right direction.
- one warp S1 is repeatedly knitted on the left knitting needle N or the right knitting needle N.
- the warp S1 is applied to the left needle N from the left to the right at the first rotation of the main shaft, and the right adjacent needle at the second rotation of the main shaft. N warps S1 from right to left.
- the carrying of the warp S1 is repeated.
- a knitted string as shown in FIG. 21 (e) can be formed.
- the braided string By connecting the braided string with wefts, for example, it can be formed into an 80 mm wide bag.
- the elastic yarn S3 is knitted. As shown in FIG. 22, the elastic yarn S3 is knitted by alternately inserting one stitch per stitch with respect to the course direction (stretching direction indicated by the arrow C direction, longitudinal direction of the fiber sheet 200).
- the first insertion method of the weft S2 is that the weft S2 forming the fiber sheet main body 201 (base fabric, see FIG. 20) of the fiber sheet 200 reciprocates at both ends of the fiber sheet 200 for each stitch.
- This is a method of knitting the fiber sheet main body 201 by inserting it as described above. By adopting such a method, the fiber sheet main body 201 that becomes the base fabric of the bandage can be knitted more easily.
- the second insertion method of the weft S2 is the weft S2 forming the fiber sheet body 201 in the wale direction of the fiber sheet 200 (the non-stretch direction indicated by the arrow W direction, the width direction of the fiber sheet 200).
- the fiber sheet main body 201 is knitted by arranging them side by side.
- a third insertion method of the weft S2 will be described.
- the third method of inserting the weft S2 is to insert the weft S2 forming the fiber sheet main body 201 so as to change the way of swinging for each arbitrary stitch, so that the fiber sheet main body 201 serving as a base is inserted.
- a special base fabric such as a mesh M is knitted in an arbitrary portion.
- the fourth method of inserting the weft S2 is to insert the weft S2 forming the fiber sheet main body 201 so as to change the way of swinging for each arbitrary stitch, and to select an arbitrary portion of the fiber sheet main body 201.
- This is a method of knitting a special base fabric such as buttonhole BH.
- the sensor fiber 230 is knitted.
- a method for weaving the sensor fiber 230 for example, the following two methods can be employed.
- a first weaving method of the sensor fiber 230 will be described.
- the first weaving method of the sensor fiber 230 is to insert the sensor fiber 230 into the central portion of the fiber sheet 200 at an arbitrary length and an arbitrary period so as to have a waveform (sine curve shape). It is a method of letting you organize.
- the sensor fibers 230 can be arranged with good balance.
- positioning shape of the sensor fiber 230 is not restricted to an above-described waveform, For example, it is good also as a rectangular wave shape.
- the second weaving method of the sensor fiber 230 includes inserting the sensor fiber 230 into, for example, one end of the fiber sheet 200 to increase the width in the wale direction W at a specific portion.
- the cycle in the course direction C (the interval between the sensor fibers 230 adjacent to each other in the extending direction of the fiber sheet 200) is reduced. That is, the amplitude and period of the waveform of the sensor fiber 230 may be arbitrarily changed.
- a connector is used to connect the first conductive thread 231 (first conductor 210) and the second conductive thread 233 (second conductor 220) of the sensor fiber 230 to the detection device 100.
- first connector 60 the second connector 75, the third connector 90, and the fourth connector 95 will be described.
- the first connector 60 includes a casing 61, a substrate 62 disposed inside the casing 61, and a connection unit 63 that connects the sensor fiber 230 and the substrate 62.
- the substrate 62 is connected to the detection device 100 (see FIG. 1) via a cable or the like.
- the connection unit 63 includes a base portion 64, a sensor guide 66 placed on the base portion 64 via a compression coil spring 65, a pushing member 67 that pushes the sensor fiber 230 into the sensor guide 66, and a pushing member 67. And a lock lever 68 to be pushed into the sensor guide 66.
- the first connector 60 pushes the sensor fiber 230 into the concave groove 69 formed in the sensor guide 66, and the sensor fiber 230 and the substrate 62 via the terminals 70 and 71 arranged in the concave groove 69 of the sensor guide 66. And connect.
- the sensor guide 66 is a block-shaped member formed of plastic such as polyacetal resin.
- On the upper surface of the sensor guide 66 at least one concave groove 69 is formed.
- the concave groove 69 is an end face U-shaped groove extending in one direction, and is formed in a straight line.
- two concave grooves 69 of the present embodiment are provided on the upper surface of the sensor guide 66 and intersect each other.
- the sensor fiber 230 when the sensor fiber 230 is woven into a bandage as shown in FIG. 20 and the connector is sandwiched from the lateral direction of the bandage cross section, the sensor fiber 230 may be “right diagonally upward. This is because the sensor guide 69 can correspond to either direction with a single connector.
- the concave groove 69 has a size corresponding to the thickness of the sensor fiber 230.
- the width W ⁇ b> 2 in the direction orthogonal to the longitudinal direction of the concave groove 69 is slightly smaller than the diameter of the sensor fiber 230. That is, the concave groove 69 is formed so that the sensor fiber 230 is fixed in the concave groove 69 by pushing the sensor fiber 230 from above.
- the lower surface of the sensor guide 66 is disposed in parallel with the substrate 62.
- a plurality of terminals 70 and 71 protrude from the substrate 62 upward in the vertical direction.
- the plurality of terminals 70 and 71 are composed of at least one central conductor terminal 70 and at least one external conductor terminal 71.
- the terminals 70 and 71 are disposed so as to protrude from the lower side of the sensor guide 66 into the inner space of the concave groove 69 through a through hole formed in the sensor guide 66.
- the sensor guide 66 is supported by a compression coil spring 65, and the terminals 70 and 71 protrude from the inner peripheral surface of the concave groove 69 by pressing the sensor guide 66 from above.
- the center conductor terminal 70 is disposed at the center of the groove 69 in the width direction.
- the center conductor terminal 70 inserts the sensor fiber 230 into the groove 69 and presses the sensor guide 66 from above so that the center conductor terminal 70 pierces the vicinity of the center of the sensor fiber 230.
- the first conductive yarn 231 (see FIGS. 9 and 10) of the sensor fiber 230 and the detection device 100 are connected.
- Insulating paint I is applied to a part of the center conductor terminal 70 so that the center conductor terminal 70 and the second conductive thread 233 of the sensor fiber 230 are not electrically connected. .
- the outer conductor terminal 71 is disposed on the outer side in the width direction from the center in the width direction of the concave groove 69.
- the outer conductor terminal 71 inserts the sensor fiber 230 into the concave groove 69 and presses the sensor guide 66 from above, so that the outer conductor terminal 71 is positioned on the outer peripheral side from the center of the sensor fiber 230. It is arranged to stab. As a result, the second conductive thread 233 of the sensor fiber 230 and the detection device 100 are connected.
- the conductive yarn and the detection device 100 can be easily attached by simply fitting the sensor fiber 230 into the groove 69 of the sensor guide 66 without peeling off the coating of the sensor fiber 230. Can be connected.
- the configuration of the terminals 70 and 71 is not limited to the configuration shown in FIG.
- the length of the center conductor terminal 70 may be shortened.
- the first conductive yarn 231 and the second conductive yarn 233 have a structure that is not electrically connected, but a unique impedance value can be given between both electrodes during manufacturing. For this reason, in the unlikely event that the center conductor terminal 70 and the outer conductor terminal 71 are not in good contact with the respective conductive yarns, values other than the specific impedance value are displayed, so that a contact failure accident can be prevented in advance. . Similarly, when the center conductor terminal 70 and the outer conductor terminal 71 are in contact with each other due to a manufacturing defect or the like, an extremely low impedance value is displayed, so that a detection error can be prevented.
- the first connector is not limited to the structure described above, and can be simplified.
- the first connector 60B shown in FIG. 34 it may be configured to include only a block-shaped sensor guide 66B in which a concave groove 69B having a U-shaped cross section is formed and a lid member 72.
- the concave groove 69 ⁇ / b> B has a shape corresponding to the thickness of the sensor fiber 230, and terminals 70 and 71 for connecting the sensor fiber 230 and the substrate 62 are disposed.
- the lid member 72 is a member that pushes the sensor fiber 230 into the concave groove 69B and fixes it.
- a protrusion 73 is formed which is inserted into a guide hole 74 formed on the upper surface of the sensor guide 66B.
- the second connector 75 includes a base portion 76, a wire stripper portion 77 that is rotatably attached to the base portion 76, and a terminal portion 78 that is rotatably attached to the base portion 76. ,have.
- the wire stripper part 77 is a part having a so-called wire stripper function.
- the wire stripper portion 77 includes a wire stripper portion main body 82 that can rotate around a rotation shaft 81, and a first round hole blade 79.
- the first round hole blade 79 is a semicircular groove-like blade that cuts into a portion of the sensor fiber 230 excluding the conductive thread 231 in cooperation with the second round hole blade 80 fixed to the base portion 76. .
- the terminal portion 78 includes a terminal portion main body 83 that can rotate around a rotation shaft 81, a central conductor terminal 85 that is connected to the first conductive thread 231, and an external that is connected to the second conductive thread 233. It has a conductor terminal 86 and a roller 84 attached integrally with the rotation shaft 81.
- the center conductor terminal 85 and the external conductor terminal 86 are connected to the detection device 100 (see FIG. 1) via a cable or the like.
- the external conductor terminal 86 is composed of a plurality of needles. By pressing the external conductor terminal 86 from the outer peripheral surface of the sensor fiber 230, the external conductor terminal 86 is connected to the second conductive thread 233.
- the roller 84 has a cylindrical shape and a plurality of fine irregularities are formed on the outer peripheral surface (knurling). The roller 84 is eccentrically attached to the rotation shaft 81. The terminal portion 78 is changed from the upright state shown in FIG. 35 to the tilted state shown in FIG.
- the sensor fiber 230 and the detection device 100 are connected using the second connector 75, first, the sensor fiber 230 is disposed in the fixing groove 87 of the base portion 76 as shown in FIG. As a result, the second round hole blade 80 is cut into a portion of the sensor fiber 230 excluding the first conductive thread 231.
- the wire stripper part 77 is tilted to make other cuts so as to leave the first conductive yarn 231 of the sensor fiber 230.
- the sensor fiber 230 is fixed by the wire stripper main body 82 by the wire stripper 77 being tilted down.
- the covering of the sensor fiber 230 can be peeled off by operating the wire stripper 77, and the conductive yarn and the detection device 100 can be easily connected.
- a mechanism equivalent to the roller 84 may be incorporated in the base portion 76 in order to make the coating easier to peel off.
- the third connector 90 includes a casing 91, a center conductor terminal 92 fixed to the casing 91, and an external conductor terminal 93.
- the center conductor terminal 92 and the external conductor terminal 93 are connected to the detection device 100 (see FIG. 1).
- the casing 91 has a box shape, and is formed with a wire receiving groove 94 extending in a U shape when viewed from above.
- the wire receiving groove 94 includes a first straight line portion 94a in which the center conductor terminal 92 is accommodated, a second straight line portion 94b in which the external conductor terminal 93 is accommodated, a first straight line portion 94a, and a first straight line portion 94a. It has a curved portion 94c that smoothly connects the two straight portions 94b.
- channel 94 does not need to be U shape seeing from upper direction, when it considers from a user's convenience, it is preferable that it is U shape.
- the center conductor terminal 92 is composed of a pair of terminals arranged so as to gradually approach one direction in the extending direction of the first straight portion 94a.
- the tip portions of the pair of terminals are in contact with each other, but the first conductive thread 231 can be sandwiched between the pair of terminals.
- the external conductor terminal 93 is also composed of a pair of terminals arranged so as to gradually approach one direction in the extending direction of the second linear portion 94b.
- the pair of terminals are arranged such that the distance between the tip portions of the pair of terminals is slightly smaller than the diameter of the sensor fiber 230.
- the first conductive yarn 231 and the second conductive yarn 233 are exposed to the wire receiving groove 94 with a wire stripper or a nipper.
- the first conductive thread 231 is connected to the center conductor terminal 92 and the second conductive thread 233 is connected to the outer conductor terminal 93 by accommodating the sensor fiber 230 in the wire accommodation groove 94. .
- the third connector 90 it is possible to connect the conductive yarn and the detection device 100 only by peeling off the covering of the sensor fiber 230.
- the fourth connector 95 is a connector using a general coaxial connector.
- the fourth connector 95 includes a female connector 96, a male connector 97 connected to the female connector 96, and a fixing folder 98 for fixing the male connector 97 to the fiber sheet 200.
- the female connector 96 has a plurality of terminals (not shown), and these terminals are connected to the detection device 100.
- the male connector 97 and the female connector 96 are coaxial cable connectors formed of resin.
- the user can perform terminal processing of the sensor fiber 230, connect the sensor fiber 230 to the male connector 97, and fix the male connector 97 to the fiber sheet 200 using the fixing folder 98. Then, by connecting the female connector 96 to the male connector 97, the conductive threads 231 and 233 and the detection device 100 can be connected.
- the price of the fiber sheet 200 which is a consumable, is increased, although the price of the connector becomes expensive. Can be suppressed.
- FIG. 43 is an explanatory view showing another first example of the arrangement of the first conductor 210 and the second conductor 220 on the fiber sheet 202.
- the first conductors 210 and the second conductors 220 are alternately arranged.
- the first conductor 210 and the second conductor 220 may be arranged with a certain width.
- FIG. 44 is an explanatory diagram showing another second example of the arrangement of the first conductor 210 and the second conductor 220. As in the example of FIG. 43, the first conductor 210 and the second conductor 220 are alternately arranged in the example of FIG. However, in the example of FIG. 44, the widths of the first conductor 210 and the second conductor 220 are thicker than in the case of FIG. Thereby, the space
- the detection device 100 can easily detect blood dripping.
- FIG. 45 is an explanatory view showing another third example of the arrangement of the first conductor 210 and the second conductor 220.
- the fiber sheet 202 has a three-layer structure in which a sheet 242 is sandwiched between a sheet 241 including the first conductor 210 and a sheet 243 including the second conductor 220.
- the first conductor 210 and the second conductor 220 may be arranged in different directions, or may be arranged in the same direction.
- the main body of the sheet 241, the main body of the sheet 243, and the sheet 242 are all insulating sheets having water absorption. By sandwiching the sheet 242, the first conductor 210 and the second conductor 220 are not in contact with each other. Further, when the sheet 242 absorbs moisture such as blood, impedance characteristics between the first conductor 210 and the second conductor 220 change. Thereby, the detection signal output unit 191 can detect leakage of blood into the fiber sheet 202.
- each line may constitute an independent channel.
- FIG. 46 is an explanatory diagram showing another fourth example of the arrangement of the first conductor 210 and the second conductor 220.
- the fiber sheet 202 is configured in a three-layer structure in which a sheet 252 is sandwiched between a sheet 251 including the first conductor 210 and a sheet 253 including the second conductor 220. Further, the first conductor 210 and the second conductor 220 are arranged in different directions. Further, the main body of the sheet 251, the main body of the sheet 253, and the sheet 252 are all insulating sheets having water absorption. Since the sheet 252 is sandwiched, the first conductor 210 and the second conductor 220 are not in contact with each other.
- each line of the first conductor 210 is not electrically connected, and each line constitutes channel 1 to channel 4. Further, each line of the second conductor 220 is not electrically connected, and each line constitutes channel 5 to channel 8.
- each channel of the first conductor 210 and each channel of the second conductor 220 are arranged orthogonal to each other. However, since the sheet 252 is sandwiched, each channel of the first conductor 210 and each channel of the second conductor 220 are not in contact with each other. When the liquid soaks into a part of the sheet 252, the frequency characteristics of the first conductor 210 and the second conductor 220 change in the channel corresponding to the soaked position. Thereby, the detection signal output unit 191 can detect the leaching position in addition to the presence or absence of the liquid leaching.
- the fiber sheet 202 is used as a carpet, and equipment is installed in each of the regions A11, A12, and A13 on the fiber sheet 202.
- the frequency characteristic between the channel 2 and the channel 5 changes, it is possible to detect the necessity of protecting the equipment installed in the region A11 from a failure due to liquid adhesion.
- the frequency characteristics between the channel 3 and the channel 7 change, it is necessary to protect the device installed in the region A12 and the device installed in the region A13 from a failure due to liquid adhesion. Can be detected.
- the detection system 1 can be applied not only to detection of the needle removal but also to detection of various liquids that change the frequency characteristics between the first conductor 210 and the second conductor 220.
- the position where the liquid is soaked into the fiber sheet 202 can be detected even if a direct current is applied to the channel instead of the alternating current signal.
- the presence or absence of liquid permeation into the region A11 can be determined by measuring the voltages of the channel 5 and the channel 6 in a state where a direct current is applied to the channel 1 and the channel 2.
- the conductivity of the liquid shows a sufficiently large value with respect to the conductivity of the air, and a measured value of a predetermined magnitude or less is obtained for the potential difference between the channel 5 and the channel 6, the liquid is present in the region A11.
- Judged to have soaked when the conductivity of the liquid shows a sufficiently large value with respect to the conductivity of the air, and a measured value of a predetermined magnitude or less is obtained for the potential difference between the channel 5 and the channel 6, the liquid is present in the region A11. Judged to have soaked.
- FIG. 48 is an explanatory diagram showing a first example of the arrangement of yarns combined so that two conductors do not contact each other.
- the bandage 261 (fiber sheet) is configured to include a thread 262 knitted vertically in the center of the bandage 261 itself.
- the thread 262 includes two conductors combined so as not to contact each other.
- the bandage 261 corresponds to the example of the fiber sheet 200, and the two conductors included in the thread 262 correspond to the example of the first conductor 210 and the second conductor 220.
- yarn is not restricted to what is shown by the example of FIG. 9 and FIG.
- the conductive yarn 233 is wrapped around the conductive yarn 231 covered with the insulating cotton 232, and these are wound around the insulating cotton 236B (third insulating portion).
- the sensor fiber 230 shown in FIG. 9 may be further covered with insulating cotton 236B shown in FIG.
- the insulating cotton 236 may be knitted together with insulating cotton 232. That is, the loop 239 may be formed on the outer surface of the insulating cotton 232 so that the conductive yarn 233 and the insulating cotton 236 pass through the loop 239.
- FIG. 51 is an explanatory diagram showing another example of the arrangement of two conductors included in one thread.
- the yarn 280 includes two conductive yarns 281 and 282 twisted so as not to contact each other.
- the conductive yarns 281 and 282 are covered with a stretchable material such as rubber, and are twisted into the arrangement as shown in FIG.
- the conductive yarns 281 and 282 can be disposed at a relatively narrow interval, and the yarn 280 can be stretched.
- Each of the conductive yarn 281 and the conductive yarn 282 may be covered with insulating cotton, or as shown in FIG. 51, the twisted conductive yarn 281 and conductive yarn 282 are covered with insulating cotton 236C. May be.
- a shield layer made of conductive yarn covered with an insulating material having water absorption (for example, insulating cotton) is provided on the outer peripheral side thereof.
- a conductive yarn covered with insulating cotton is further wound or knitted around the outer peripheral side of the conductive yarn 233 having the form shown in FIG. 49 or the outer peripheral side of the insulating cotton 236B.
- the yarn may be grounded.
- FIG. 52 is an explanatory view showing still another example of the arrangement of two conductors included in one thread.
- FIG. 53 is an explanatory diagram showing an arrangement example of two conductors in the cross section of the yarn illustrated in FIG. 52 and 53, two conductive yarns 281 and 282 are arranged in parallel, and these two conductive yarns are covered with a water-absorbing insulating material such as insulating cotton 232. It has a structure. With this structure, there is no need to twist the conductive yarns, and in this respect yarns can be produced relatively easily.
- the conductive yarn covered with insulating cotton may be further wound or knitted around the outer peripheral side of the insulating cotton 232, and the conductive yarn may be grounded.
- the frequency characteristic acquisition unit 120 acquires frequency characteristics when an AC signal is input to at least two conductors provided on the fiber sheet.
- the detection signal output unit 191 outputs a detection signal when the frequency characteristic acquisition unit 120 acquires a predetermined frequency characteristic.
- the detection apparatus 100 can detect adhesion of a specific liquid by distinguishing it from other liquids based on the difference in frequency characteristics.
- a fiber sheet provided with at least two conductors (first conductor 210 and second conductor 220) can be used.
- the fiber sheet for example, a fiber sheet in which a plurality of conductive yarns are knitted can be used, and the fiber sheet structure can be simplified. Thereby, the manufacturing cost of a fiber sheet can be reduced and the said fiber sheet (part to which a liquid adheres) can be made disposable.
- the frequency characteristic acquisition unit 120 obtains frequency characteristics when the AC signal of the first frequency and the AC signal of the second frequency are input to at least two conductors (the first conductor 210 and the second conductor 220). get.
- the detection signal output unit 191 has a predetermined difference between a frequency characteristic when an AC signal of the first frequency is input to the conductor and a frequency characteristic when an AC signal of the second frequency is input to the conductor. If it is, a detection signal is output.
- sweat and blood have different frequency characteristic change ratios with respect to frequency changes. For this reason, the detection signal output unit 191 can detect blood separately from sweat based on the difference in frequency characteristics at a plurality of frequencies, and can reduce false detection of needle removal.
- the detection signal output unit 191 can detect a specific liquid and another liquid based on the difference in frequency characteristics at a plurality of frequencies.
- the fiber sheet 200 also includes conductive yarns 231 and 233 (yarn 262 or yarn 280) including at least two conductors 210 and 220 that are combined so as not to contact each other. Thereby, the two conductors 210 and 220 can be arranged at a relatively narrow interval, and the detection accuracy of the detection signal output unit 191 can be increased when the liquid soaks into the fiber sheet 200.
- a program for realizing the function of the detection signal output unit 191 is recorded on a computer-readable recording medium, and the program recorded on the recording medium is read into a computer system and executed to execute the processing of each unit.
- the “computer system” includes an OS and hardware such as peripheral devices.
- the “computer system” includes a homepage providing environment (or display environment) if a WWW system is used.
- the “computer-readable recording medium” refers to a storage device such as a flexible medium, a magneto-optical disk, a portable medium such as a ROM or a CD-ROM, and a hard disk incorporated in a computer system.
- the “computer-readable recording medium” dynamically holds a program for a short time like a communication line when transmitting a program via a network such as the Internet or a communication line such as a telephone line.
- a volatile memory in a computer system serving as a server or a client in that case and a program that holds a program for a certain period of time are also included.
- the program may be a program for realizing a part of the functions described above, and may be a program capable of realizing the functions described above in combination with a program already recorded in a computer system.
- the detection system the fiber sheet, the connector, the detection device, and the liquid type estimation method, it is possible to accurately determine whether or not the liquid dripping on the fiber sheet is a predetermined liquid (for example, blood). The possibility of erroneously outputting a signal can be reduced.
- a predetermined liquid for example, blood
Landscapes
- Health & Medical Sciences (AREA)
- Engineering & Computer Science (AREA)
- Life Sciences & Earth Sciences (AREA)
- Chemical & Material Sciences (AREA)
- Physics & Mathematics (AREA)
- Biomedical Technology (AREA)
- General Health & Medical Sciences (AREA)
- Pathology (AREA)
- Biochemistry (AREA)
- Biophysics (AREA)
- Immunology (AREA)
- General Physics & Mathematics (AREA)
- Analytical Chemistry (AREA)
- Heart & Thoracic Surgery (AREA)
- Textile Engineering (AREA)
- Mechanical Engineering (AREA)
- Hematology (AREA)
- Vascular Medicine (AREA)
- Molecular Biology (AREA)
- Chemical Kinetics & Catalysis (AREA)
- Electrochemistry (AREA)
- Animal Behavior & Ethology (AREA)
- Public Health (AREA)
- Cardiology (AREA)
- Veterinary Medicine (AREA)
- Urology & Nephrology (AREA)
- Human Computer Interaction (AREA)
- Medicinal Chemistry (AREA)
- Food Science & Technology (AREA)
- Surgery (AREA)
- Anesthesiology (AREA)
- Nuclear Medicine, Radiotherapy & Molecular Imaging (AREA)
- Physiology (AREA)
- Medical Informatics (AREA)
- External Artificial Organs (AREA)
- Investigating Or Analyzing Materials By The Use Of Electric Means (AREA)
- Yarns And Mechanical Finishing Of Yarns Or Ropes (AREA)
Abstract
L'invention concerne un fil possédant : un premier fil conducteur (231) ayant une conductivité ; une première partie isolante (232) couvrant le premier fil conducteur (231) et formée d'un matériau isolant ayant des propriétés d'absorption d'eau ; et un second fil conducteur (233) ayant une conductivité et disposé sur le côté périphérique externe de la première partie isolante (232).
Priority Applications (4)
| Application Number | Priority Date | Filing Date | Title |
|---|---|---|---|
| EP19192944.7A EP3633089B1 (fr) | 2015-06-30 | 2015-10-06 | Dispositif de détection et procédé d'estimation de type de liquide |
| JP2017525783A JP6663611B2 (ja) | 2015-06-30 | 2015-10-06 | 糸、検知システム、繊維シート、コネクタ、検知装置および液体種類推定方法 |
| US15/740,087 US11614418B2 (en) | 2015-06-30 | 2015-10-06 | Yarn, detection system, fiber sheet, connector, detection device, and liquid type estimation method |
| EP15897201.8A EP3318664A4 (fr) | 2015-06-30 | 2015-10-06 | Fil, système de détection, feuille de fibres, connecteur, dispositif de détection, et procédé d'estimation de type de liquide |
Applications Claiming Priority (2)
| Application Number | Priority Date | Filing Date | Title |
|---|---|---|---|
| JP2015-132024 | 2015-06-30 | ||
| JP2015132024 | 2015-06-30 |
Publications (1)
| Publication Number | Publication Date |
|---|---|
| WO2017002274A1 true WO2017002274A1 (fr) | 2017-01-05 |
Family
ID=57608124
Family Applications (1)
| Application Number | Title | Priority Date | Filing Date |
|---|---|---|---|
| PCT/JP2015/078337 WO2017002274A1 (fr) | 2015-06-30 | 2015-10-06 | Fil, système de détection, feuille de fibres, connecteur, dispositif de détection, et procédé d'estimation de type de liquide |
Country Status (4)
| Country | Link |
|---|---|
| US (1) | US11614418B2 (fr) |
| EP (2) | EP3318664A4 (fr) |
| JP (1) | JP6663611B2 (fr) |
| WO (1) | WO2017002274A1 (fr) |
Cited By (4)
| Publication number | Priority date | Publication date | Assignee | Title |
|---|---|---|---|---|
| CN109239139A (zh) * | 2018-09-29 | 2019-01-18 | 厦门大学 | 一种纱线状湿度传感器 |
| JP2019039091A (ja) * | 2017-08-23 | 2019-03-14 | 住江織物株式会社 | 布帛 |
| JP2020105651A (ja) * | 2018-12-27 | 2020-07-09 | 住江織物株式会社 | 布帛 |
| JP2021121697A (ja) * | 2020-01-31 | 2021-08-26 | 住江織物株式会社 | 水油判断布 |
Families Citing this family (5)
| Publication number | Priority date | Publication date | Assignee | Title |
|---|---|---|---|---|
| WO2019108138A1 (fr) * | 2017-12-01 | 2019-06-06 | Mas Innovation (Private) Limited | Textile et son procédé de fabrication |
| TW201935939A (zh) * | 2018-02-06 | 2019-09-01 | 智能紡織科技股份有限公司 | 線材裝置 |
| US20200325603A1 (en) | 2019-04-10 | 2020-10-15 | Propel, LLC | Knitted textiles with conductive traces of a hybrid yarn and methods of knitting the same |
| KR102492323B1 (ko) * | 2020-12-16 | 2023-01-30 | 주식회사 소프트로닉스 | 자가 측정이 가능한 직물지 |
| US20240008913A1 (en) * | 2022-07-11 | 2024-01-11 | Verb Surgical Inc. | Method and system for detecting liquid immersion of an end effector of an ultrasonic instrument |
Citations (3)
| Publication number | Priority date | Publication date | Assignee | Title |
|---|---|---|---|---|
| JPH02280039A (ja) * | 1989-04-20 | 1990-11-16 | Junkosha Co Ltd | 液体識別装置 |
| JP2004533103A (ja) * | 2001-06-19 | 2004-10-28 | コーニンクレッカ フィリップス エレクトロニクス エヌ ヴィ | ケーブル |
| JP2011106084A (ja) * | 2009-11-12 | 2011-06-02 | Kunert Fashion Gmbh & Co Kg | 湿度センサを備えたメリヤス製品 |
Family Cites Families (14)
| Publication number | Priority date | Publication date | Assignee | Title |
|---|---|---|---|---|
| US3864676A (en) | 1973-09-10 | 1975-02-04 | Helene Macias | Moisture detector |
| EP0145407B1 (fr) * | 1983-11-28 | 1991-01-23 | Ing. C. Olivetti & C., S.p.A. | Dispositif pour connecter un circuit logique à un câble coaxial |
| JP2001070273A (ja) * | 1999-09-03 | 2001-03-21 | Tanita Corp | 生体電気インピーダンス測定方法および身体組成測定装置 |
| US7801598B2 (en) * | 2000-08-14 | 2010-09-21 | Fresenius Medical Care Holdings, Inc. | Device and method for the determination of dry weight by continuous measurement of resistance and calculation of circumference in a body segment using segmental bioimpedance analysis |
| GB0114978D0 (en) * | 2001-06-19 | 2001-08-08 | Koninkl Philips Electronics Nv | Cable |
| AU2004277381B2 (en) * | 2003-08-22 | 2008-04-24 | Foster-Miller, Inc. | Physiological monitoring garment |
| CA2708749A1 (fr) * | 2007-12-12 | 2009-06-18 | Whalley, Robin, As Trustee Of The Olfarse Trust | Dispositif et appareil de detection de fluides corporels |
| JP5203306B2 (ja) | 2009-06-30 | 2013-06-05 | タツタ電線株式会社 | 漏液検知線 |
| JP5587817B2 (ja) | 2011-03-21 | 2014-09-10 | 株式会社アワジテック | 人工透析用血液検知装置 |
| JP5912751B2 (ja) | 2012-03-28 | 2016-04-27 | タツタ電線株式会社 | 液体検知線 |
| DE102012013473B4 (de) * | 2012-07-09 | 2018-02-22 | Fresenius Medical Care Deutschland Gmbh | Vorrichtung zur Erkennung von Feuchtigkeit für eine Vorrichtung zur Überwachung eines Zugangs zu einem Patienten |
| JP2015132024A (ja) | 2014-01-10 | 2015-07-23 | 東レ株式会社 | 衣料用織物 |
| JP5791132B1 (ja) * | 2014-04-07 | 2015-10-07 | 学校法人北里研究所 | 検知装置、検知システム、検知方法およびプログラム |
| WO2016119211A1 (fr) * | 2015-01-30 | 2016-08-04 | National Taipei University Of Technology | Patch de capteur, système, et procédé de détection de fuite de fluide |
-
2015
- 2015-10-06 JP JP2017525783A patent/JP6663611B2/ja active Active
- 2015-10-06 WO PCT/JP2015/078337 patent/WO2017002274A1/fr active Application Filing
- 2015-10-06 EP EP15897201.8A patent/EP3318664A4/fr active Pending
- 2015-10-06 EP EP19192944.7A patent/EP3633089B1/fr active Active
- 2015-10-06 US US15/740,087 patent/US11614418B2/en active Active
Patent Citations (3)
| Publication number | Priority date | Publication date | Assignee | Title |
|---|---|---|---|---|
| JPH02280039A (ja) * | 1989-04-20 | 1990-11-16 | Junkosha Co Ltd | 液体識別装置 |
| JP2004533103A (ja) * | 2001-06-19 | 2004-10-28 | コーニンクレッカ フィリップス エレクトロニクス エヌ ヴィ | ケーブル |
| JP2011106084A (ja) * | 2009-11-12 | 2011-06-02 | Kunert Fashion Gmbh & Co Kg | 湿度センサを備えたメリヤス製品 |
Non-Patent Citations (1)
| Title |
|---|
| SATORU NEBUYA ET AL.: "An Optically Isolated Impedance Measurement System", BPES 2001 DAI 16 KAI PROCEEDING OF THE SYMPOSIUM ON BIOLOGICAL AND PHYSIOLOGICAL ENGINEERING, 2001, pages 71 - 72, XP009504685 * |
Cited By (8)
| Publication number | Priority date | Publication date | Assignee | Title |
|---|---|---|---|---|
| JP2019039091A (ja) * | 2017-08-23 | 2019-03-14 | 住江織物株式会社 | 布帛 |
| JP7011123B2 (ja) | 2017-08-23 | 2022-01-26 | 住江織物株式会社 | 布帛 |
| CN109239139A (zh) * | 2018-09-29 | 2019-01-18 | 厦门大学 | 一种纱线状湿度传感器 |
| CN109239139B (zh) * | 2018-09-29 | 2021-02-02 | 厦门大学 | 一种纱线状湿度传感器 |
| JP2020105651A (ja) * | 2018-12-27 | 2020-07-09 | 住江織物株式会社 | 布帛 |
| JP7289440B2 (ja) | 2018-12-27 | 2023-06-12 | 住江織物株式会社 | 布帛 |
| JP2021121697A (ja) * | 2020-01-31 | 2021-08-26 | 住江織物株式会社 | 水油判断布 |
| JP7422379B2 (ja) | 2020-01-31 | 2024-01-26 | 住江織物株式会社 | 水油判断布 |
Also Published As
| Publication number | Publication date |
|---|---|
| JP6663611B2 (ja) | 2020-03-13 |
| EP3318664A4 (fr) | 2019-10-09 |
| EP3633089A1 (fr) | 2020-04-08 |
| EP3633089B1 (fr) | 2021-04-21 |
| US11614418B2 (en) | 2023-03-28 |
| US20180195985A1 (en) | 2018-07-12 |
| JPWO2017002274A1 (ja) | 2018-04-19 |
| EP3318664A1 (fr) | 2018-05-09 |
Similar Documents
| Publication | Publication Date | Title |
|---|---|---|
| WO2017002274A1 (fr) | Fil, système de détection, feuille de fibres, connecteur, dispositif de détection, et procédé d'estimation de type de liquide | |
| JP5791132B1 (ja) | 検知装置、検知システム、検知方法およびプログラム | |
| KR101823070B1 (ko) | 환자 액세스 감시 장치에 사용하기 위한 수분 검출 디바이스 | |
| US10046120B2 (en) | Device for detecting moisture for an arrangement for monitoring an access to a patient | |
| CN108348675A (zh) | 用于医疗器械的漏液检测装置 | |
| US20100016809A1 (en) | Device and method for monitoring a vascular access, and device for creating a vascular access | |
| AU2016231255B2 (en) | Device in the form of a garment for monitoring a physiological parameter of a user | |
| EP3144023B1 (fr) | Système de détection et procédé de détection pour fuite d'injection intraveineuse | |
| Gaubert et al. | Smart underwear, incorporating textrodes, to estimate the bladder volume: Proof of concept on a test bench | |
| JP6207028B2 (ja) | 検知装置、検知システム、検知方法およびプログラム | |
| US20230173157A1 (en) | Medical wetness sensing devices and related systems and methods |
Legal Events
| Date | Code | Title | Description |
|---|---|---|---|
| 121 | Ep: the epo has been informed by wipo that ep was designated in this application |
Ref document number: 15897201 Country of ref document: EP Kind code of ref document: A1 |
|
| ENP | Entry into the national phase |
Ref document number: 2017525783 Country of ref document: JP Kind code of ref document: A |
|
| NENP | Non-entry into the national phase |
Ref country code: DE |
|
| WWE | Wipo information: entry into national phase |
Ref document number: 2015897201 Country of ref document: EP |