WO2016207951A1 - シャント音解析装置、シャント音解析方法、コンピュータプログラム及び記録媒体 - Google Patents
シャント音解析装置、シャント音解析方法、コンピュータプログラム及び記録媒体 Download PDFInfo
- Publication number
- WO2016207951A1 WO2016207951A1 PCT/JP2015/067877 JP2015067877W WO2016207951A1 WO 2016207951 A1 WO2016207951 A1 WO 2016207951A1 JP 2015067877 W JP2015067877 W JP 2015067877W WO 2016207951 A1 WO2016207951 A1 WO 2016207951A1
- Authority
- WO
- WIPO (PCT)
- Prior art keywords
- shunt
- shunt sound
- component
- value
- sound
- Prior art date
- Legal status (The legal status is an assumption and is not a legal conclusion. Google has not performed a legal analysis and makes no representation as to the accuracy of the status listed.)
- Ceased
Links
Images




Classifications
-
- A—HUMAN NECESSITIES
- A61—MEDICAL OR VETERINARY SCIENCE; HYGIENE
- A61M—DEVICES FOR INTRODUCING MEDIA INTO, OR ONTO, THE BODY; DEVICES FOR TRANSDUCING BODY MEDIA OR FOR TAKING MEDIA FROM THE BODY; DEVICES FOR PRODUCING OR ENDING SLEEP OR STUPOR
- A61M1/00—Suction or pumping devices for medical purposes; Devices for carrying-off, for treatment of, or for carrying-over, body-liquids; Drainage systems
- A61M1/14—Dialysis systems; Artificial kidneys; Blood oxygenators ; Reciprocating systems for treatment of body fluids, e.g. single needle systems for hemofiltration or pheresis
-
- G—PHYSICS
- G10—MUSICAL INSTRUMENTS; ACOUSTICS
- G10L—SPEECH ANALYSIS TECHNIQUES OR SPEECH SYNTHESIS; SPEECH RECOGNITION; SPEECH OR VOICE PROCESSING TECHNIQUES; SPEECH OR AUDIO CODING OR DECODING
- G10L21/00—Speech or voice signal processing techniques to produce another audible or non-audible signal, e.g. visual or tactile, in order to modify its quality or its intelligibility
- G10L21/06—Transformation of speech into a non-audible representation, e.g. speech visualisation or speech processing for tactile aids
- G10L21/10—Transforming into visible information
- G10L21/12—Transforming into visible information by displaying time domain information
-
- G—PHYSICS
- G10—MUSICAL INSTRUMENTS; ACOUSTICS
- G10L—SPEECH ANALYSIS TECHNIQUES OR SPEECH SYNTHESIS; SPEECH RECOGNITION; SPEECH OR VOICE PROCESSING TECHNIQUES; SPEECH OR AUDIO CODING OR DECODING
- G10L21/00—Speech or voice signal processing techniques to produce another audible or non-audible signal, e.g. visual or tactile, in order to modify its quality or its intelligibility
- G10L21/06—Transformation of speech into a non-audible representation, e.g. speech visualisation or speech processing for tactile aids
- G10L21/10—Transforming into visible information
- G10L21/14—Transforming into visible information by displaying frequency domain information
Definitions
- the present invention relates to a technical field of a shunt sound analysis device, a shunt sound analysis method, a computer program, and a recording medium that analyze a shunt sound acquired from a measurement subject.
- Patent Document 1 describes a technique for presenting a degree of stenosis corresponding to a peak position of an envelope component from which a fine component has been removed by utilizing the fact that the position of a peak of frequency characteristics corresponds to the degree of stenosis.
- the degree of stenosis of a blood vessel is determined using a high-frequency component of a shunt sound (that is, a component having a relatively high frequency).
- a characteristic timbre for example, wind noise, etc.
- a timbre component is also generated by factors other than stenosis, such as a temporary thrombus and the influence of a venous valve. Therefore, the technique of Patent Document 1 that does not take into account characteristic timbre components causes a technical problem that the degree of stenosis cannot be accurately evaluated.
- the characteristic timbre component depends on the degree of stenosis.
- a harmonic peak appears superimposed on the envelope component of the frequency characteristic and fluctuates with time.
- Such a characteristic cannot be expressed by the method using the frequency characteristic peak of Patent Document 1, so even if the above-described timbre component is considered, it is easily used in the conventional method. I can't.
- the present invention provides a shunt sound analysis apparatus, a shunt sound analysis method, a computer program, and a recording medium that can suitably support a diagnosis of stenosis at a shunt formation site by analyzing a shunt sound acquired from a measurement subject. This is the issue.
- a shunt sound analyzing apparatus for solving the above-described problems is caused by stenosis of a blood vessel of the measurement subject from the acquisition means for acquiring shunt sound information related to the shunt formation site of the measurement subject and a shunt sound information of the measurement subject.
- Extraction means for extracting a characteristic component indicating the characteristic of the shunt sound, and output means for outputting evaluation information related to the evaluation of the shunt sound based on the characteristic component.
- a shunt sound analysis method for solving the above-described problem is caused by acquiring a shunt sound information relating to a shunt sound of a shunt formation site of the measurement subject and by narrowing of the blood vessel of the measurement subject from the shunt sound information.
- a computer program for solving the above-described problems includes an acquisition step of acquiring shunt sound information related to a shunt formation site of a measurement subject, and the shunt generated by stenosis of the measurement subject's blood vessel from the shunt sound information.
- the computer executes an extraction step of extracting a feature component indicating a feature of the sound and an output step of outputting evaluation information related to the evaluation of the shunt sound based on the feature component.
- the recording medium for solving the above problem is recorded with the computer program described above.
- the shunt sound analysis apparatus includes an acquisition unit that acquires shunt sound information related to a shunt formation site of the measurement subject, and the shunt generated by stenosis of the measurement subject's blood vessel from the shunt sound information. Extraction means for extracting a feature component indicating the feature of the sound, and output means for outputting evaluation information related to the evaluation of the shunt sound based on the feature component.
- shunt sound information related to the shunt sound is first acquired from the periphery of the measurement subject's shunt formation region by the acquisition means.
- the “shunt sound” is a blood flow sound acquired in the vicinity of a shunt formation site for taking blood out of the body, and is a sound synchronized with the pulse of the measurement subject.
- the acquisition of the shunt sound may be performed using various sensors, and the acquisition method is not particularly limited.
- the “shunt sound information” is information including various parameters related to the shunt sound, and includes, for example, temporal changes such as volume and frequency.
- the characteristic component is extracted from the shunt sound information by the extraction means.
- the characteristic component is a component indicating the characteristics of the shunt sound caused by the narrowing of the blood vessel of the measurement subject. For example, from the time frequency waveform indicating the shunt sound information, the frequency range of the envelope component of the frequency characteristics and the frequency range of the pitch component peculiar to the shunt sound This is a product obtained by removing fine components exceeding.
- evaluation information related to the evaluation of the shunt sound is output by the output means.
- the output unit generates evaluation information based on the extracted feature component, and outputs the generated evaluation information to an external monitor or the like.
- the “evaluation information” may be information indicating a result of evaluating the degree of stenosis at the shunt formation site or information for evaluating the degree of stenosis at the shunt formation site. More specifically, a numerical value or the like that directly indicates the degree of stenosis may be output as evaluation information, or one or more parameters for a doctor or the like to determine the degree of stenosis may be output as evaluation information. .
- the evaluation information according to the present embodiment is based on the characteristic component extracted from the shunt sound information as described above.
- the high frequency component of the shunt sound tends to be strong. It has been found that a timbre component also occurs.
- an acoustic component expressed by an artificial sound such as Hugh or view, or a component expressed by an artificial sound such as Shanshan or Shash.
- the evaluation information considering the characteristic timbre component described above is output. Therefore, for example, more accurate evaluation can be realized as compared with the case where the stenosis is evaluated only by the frequency of the shunt sound. Therefore, it is possible to favorably support the diagnosis of stenosis at the shunt formation site.
- the cepstrum conversion process is first performed.
- the cepstrum transformation process is realized, for example, by performing inverse Fourier transformation on a time frequency waveform indicating shunt sound information.
- the cefency below the first order and the cefency above the second order are removed.
- the “second order” is an order set for removing fine components exceeding the frequency of the pitch component peculiar to the shunt sound, and an optimum value is set by a prior simulation or the like.
- the “first order” is an order set to remove the envelope component of the frequency characteristic of the shunt sound (for example, the characteristic indicated by the waveform indicating the magnitude of the shunt sound for each frequency), Similar to the first order, the optimum value is set by a prior simulation or the like. Note that the optimum values of the “first order” and the “second order” may be values according to the sampling frequency and the frame length.
- the shunt sound information from which the quefrency corresponding to the first order and the second order has been removed is converted to the original frequency waveform by Fourier transform.
- the waveform obtained in this way is obtained by extracting a characteristic timbre component (that is, a characteristic component) generated when stenosis occurs.
- the characteristic component of the shunt sound information can be suitably extracted by using the cepstrum transformation and the predetermined order of quefrency removal.
- the output unit calculates a harmonic component value indicating a cross-correlation between adjacent frames on the time axis in the feature component, and outputs the calculated harmonic component value as the evaluation information. To do.
- the harmonics indicating the cross-correlation between frames adjacent to the feature component on the time axis are calculated.
- the harmonic component value calculated in this way is a parameter indicating a component amount that is sustained in the time direction in the shunt sound.
- the characteristic timbre generated when stenosis occurs has a continuous component in the time direction. Therefore, if the harmonic component value is calculated, the influence of the instantaneous (that is, non-sustaining) characteristic component is reduced, and a value corresponding to the characteristic tone color component magnitude (intensity) can be obtained. . Therefore, if the harmonic component value is output as evaluation information, the occurrence of stenosis can be suitably evaluated.
- the output means calculates a frequency centroid value of the feature component and outputs it as the evaluation information.
- the frequency centroid value of the feature component is calculated.
- the frequency centroid value is a value corresponding to the height of the characteristic timbre component, and is calculated as a value that varies depending on, for example, the degree of stenosis and other factors. Therefore, if the frequency centroid value is output as evaluation information, the occurrence of stenosis can be suitably evaluated.
- the output means calculates a timbre tendency value obtained by subtracting the average value of the feature component from the peak value of the feature component, and outputs it as the evaluation information.
- the characteristic component when the characteristic component is extracted from the shunt sound information, first, the peak value (maximum peak value of the predetermined time) and the average value (average value of the predetermined time) of the characteristic component are calculated. Then, the average value is subtracted from the peak value of the characteristic component, and calculated as a timbre tendency value.
- the timbre tendency value is a value indicating which tendency is strong, for example, an acoustic component such as hugh or a noisy component such as a shash. Specifically, when the timbre tendency value is high, it can be determined that the tendency of the acoustic component is strong, and when the timbre tendency value is low, it can be determined that the tendency of the noise component is strong. Therefore, if the timbre tendency value is output as evaluation information, the occurrence of stenosis can be suitably evaluated.
- the shunt sound analysis method includes an acquisition step of acquiring shunt sound information relating to a shunt formation site of a measurement subject's shunt formation, and the shunt caused by stenosis of the measurement subject's blood vessel from the shunt sound information.
- the evaluation information based on the characteristic component generated by the stenosis is output as in the shunt sound analysis apparatus according to the present embodiment described above. Therefore, it is possible to favorably support the diagnosis of stenosis at the shunt formation site.
- the computer program obtains shunt sound information related to the shunt sound of the measurement subject's shunt formation site, and the shunt sound generated by stenosis of the subject's blood vessel from the shunt sound information.
- the computer executes an extraction step of extracting a feature component indicating a feature and an output step of outputting evaluation information related to the evaluation of the shunt sound based on the feature component.
- the computer program according to the present embodiment can cause the computer to execute each step of the shunt sound analysis method according to the present embodiment described above. Therefore, it is possible to favorably support the diagnosis of stenosis at the shunt formation site.
- the recording medium according to the present embodiment records the above-described computer program.
- the recording medium it is possible to output evaluation information based on a characteristic component generated by stenosis by executing a recorded computer program. Therefore, it is possible to favorably support the diagnosis of stenosis at the shunt formation site.
- FIG. 1 is a block diagram illustrating the overall configuration of the shunt sound analysis apparatus according to the embodiment.
- the shunt sound analysis apparatus includes a shunt sound input unit 110, an audio signal analysis processing unit 120, a parameter calculation unit 130, an evaluation information calculation output unit 140, and a display unit 150. Configured.
- the shunt sound input unit 110 is a specific example of “acquisition means”.
- the shunt sound input from a vibration sensor or the like performs analog-digital conversion at a predetermined sampling frequency Fs, and outputs a shunt sound waveform.
- the shunt sound waveform generated by the shunt sound input unit 110 is output to the audio signal analysis processing unit 120.
- the audio signal analysis processing unit 120 performs various analysis processes (for example, short-time Fourier transform, logarithmic transformation, etc.) on the shunt sound waveform input from the shunt sound input unit 110, and outputs a time-frequency analysis waveform.
- the analysis result by the audio signal analysis processing unit 120 is output to the parameter calculation unit 130.
- the parameter calculation unit 130 is a specific example of “extraction means” and performs various calculation processes (for example, inverse Fourier transform, quefrency cut, Fourier transform) on the time-frequency analysis waveform input from the audio signal analysis processing unit 120. Etc.) to obtain a time characteristic component characteristic waveform.
- the parameter calculation unit 130 calculates a harmonic component value, a frequency centroid value, and a timbre tendency value from the time characteristic component characteristic waveform.
- the harmonic component value, the frequency centroid value, and the timbre tendency value calculated by the parameter calculation unit 130 are output to the evaluation information calculation output unit 140, respectively.
- the evaluation information calculation output unit 140 is a specific example of the “output unit”, and the degree of stenosis of the blood vessel of the measurement subject is determined using the output value of the parameter calculation unit 130 and the peak value or time average value of the output value. Calculate and output evaluation information for evaluation.
- the evaluation information calculated by the evaluation information calculation output unit 140 is output to the display unit 150.
- the display unit 150 is configured as a monitor, for example, and is configured to be able to visually present evaluation information input from the evaluation information calculation output unit 140 to a device user such as a doctor.
- FIG. 2 is a waveform diagram showing an example of a shunt sound waveform.
- FIG. 3 is a spectrogram showing an example of a time-frequency waveform.
- the shunt sound waveform generated by the shunt sound input unit 110 is input to the audio signal analysis processing unit 120.
- the shunt sound waveform is a waveform indicating the temporal variation of the amplitude of the voice acquired from the measurement subject's shunt sound part.
- the audio signal analysis processing unit 120 performs N-point short-time Fourier transform and logarithmic transformation on the value X (n) of the time n of the shunt sound waveform in units of length N frames, and generates a time-frequency analysis waveform Plog. [N, k] is calculated.
- the audio signal analysis processing unit 120 performs a short-time Fourier transform using the following formula (1).
- the audio signal analysis processing unit 120 performs logarithmic conversion using the following mathematical formula (2).
- w (k) is a window function of length N used when cutting out a frame.
- the time-frequency analysis waveform Plog [n, k] calculated by the audio signal analysis processing unit 120 is a waveform showing the temporal variation of the sound pressure corresponding to each frequency.
- FIG. 4 is a waveform diagram showing an example of a frequency waveform at time n
- FIG. 5 is a waveform diagram showing an example of a characteristic component characteristic waveform at time n
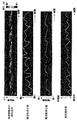
- FIG. 6 is a spectrogram showing an example of a time characteristic component characteristic waveform.
- the frequency waveform at time n of the time-frequency analysis waveform Plog [n, k] is represented as a waveform indicating the sound pressure for each frequency.
- the parameter calculation unit 130 performs various calculation processes on each frame of such a time-frequency analysis waveform Plog [n, k], and extracts feature components.
- the parameter calculation unit 130 performs inverse Fourier transform of the time-frequency analysis waveform Plog [n, k] using the following mathematical formula (3).
- the parameter calculation unit 130 uses the following formula (4) to cut the quefrencies below the lift_low order and above the lift_high order.
- the optimum values of the orders lift_low and lift_high are values determined according to the sampling frequency Fs and the frame length N, and the optimum values are set by a prior simulation or the like.
- the order lift_low is a specific example of “first order”
- the order lift_high is a specific example of “second order”.
- the parameter calculation unit 130 performs a Fourier transform using the following formula (5) to calculate a time characteristic component characteristic waveform FPeaks [n, k].
- the waveform at time n of the time feature component characteristic waveform FPeaks [n, k] is represented as a waveform obtained by extracting the feature component from the frequency waveform.
- the time characteristic component characteristic waveform FPeaks [n, k] is a waveform showing the temporal variation of the fine component of the sound pressure corresponding to each frequency.
- FIG. 7 is a block diagram showing a specific configuration of the parameter calculation unit.
- FIG. 8 is a time chart showing examples of harmonic component values, frequency centroid values, and timbre tendency values.
- the time characteristic component characteristic waveform FPeaks [n, k] is input to the harmonic component calculation unit 131, the frequency centroid calculation unit 132, and the timbre tendency calculation unit 133 of the parameter calculation unit 130, respectively.
- the harmonic component calculation unit 131 calculates a harmonic component value FPeaksValue [n], which is one of the characteristic component parameters, from the time characteristic component characteristic waveform FPeaks [n, k] using the following formula (6). calculate.
- the harmonic component value FPeaksValue [n] is a cross-correlation value between FPeaks [n ⁇ 1, k] and FPeaks [n, k], which are characteristic components of the previous and subsequent frames, and has a sustained component amount in the time direction. Show.
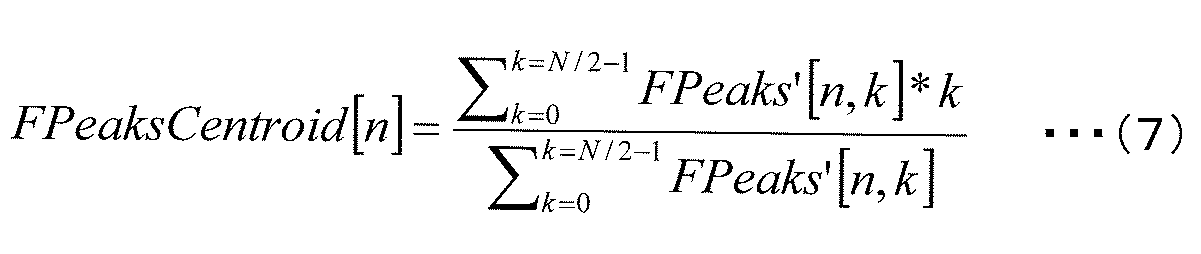
- the frequency centroid operation unit 132 calculates a frequency centroid value FPeaksCentroid [n], which is one of the feature component parameters, from the time feature component characteristic waveform FPeaks [n, k] using the following mathematical formula (7).
- the frequency centroid value FPpeaks Centroid [n] is calculated as a different value depending on the degree of stenosis and other factors.
- the timbre tendency calculating unit 133 calculates a timbre tendency value FPeaksSoundColor [n], which is one of the characteristic component parameters, from the temporal characteristic component characteristic waveform FPeaks [n, k] using the following formula (8).
- the timbre tendency value FPeaksSoundColor [n] is calculated by subtracting the average value of FPeaks [n, k] from the maximum peak of the characteristic component FPeaks [n, k].
- the harmonic component value FPpeaksValue [n] is calculated as a value corresponding to the characteristic tone color component size.
- the frequency centroid value FPpeaks Centroid [n] is calculated as a value corresponding to the height of the characteristic timbre component.
- the timbre tendency value FPpeaksSoundColor [n] is calculated as a value indicating the timbre tendency of the characteristic timbre component.
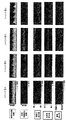
- FIG. 9 is a comparative list showing the calculation results in the parameter calculation unit for each of a plurality of shunt sounds.
- the shunt sound A is an example of a normal shunt sound.
- the shunt sound A does not show a characteristic characteristic as can be seen from the time characteristic component characteristic waveform FPeaks [n, k]. Therefore, all of the harmonic component value FPeaksValue [n], the frequency centroid value FPeaksCentroid [n], and the timbre tendency value FPeaksSoundColor [n] are stable at extremely low values. In this way, when the characteristic component parameter is stable at a low value, it can be evaluated that stenosis has not occurred (or the degree of stenosis is extremely small).
- the shunt sound B is an example of a shunt sound including a distinctive sound.
- the shunt sound B is calculated as a higher harmonic component value FPeaksValue [n].
- the frequency centroid value FPeaksCentroid [n] also changes at a high value, and it can be seen that the height fluctuates in synchronization with the heartbeat. From the timbre tendency value FPpeaksSoundColor [n], it can be seen that there is a strong noise tendency.
- the shunt sound B includes a noisy characteristic component, and it can be evaluated that there is a possibility that stenosis has occurred.
- the shunt sound C is an example of a shunt sound including a characteristic sound called view view.
- the shunt sound C is calculated as a harmonic component value FPeaksValue [n] having a very high value. Further, the frequency centroid value FPeaksCentroid [n] changes at an extremely high value. It can be seen from the timbre tendency value FPpeaksSoundColor [n] that the acoustic tendency is strong. As a result, it can be evaluated that the shunt sound C includes a lot of acoustic characteristic components and is highly likely to have stenosis.
- the shunt sound D is an example of a shunt sound including a characteristic sound such as a low sound.
- the shunt sound D is calculated with a high harmonic component value FPpeaksValue [n].
- the frequency centroid value FPeaksCentroid [n] changes intermittently and violently. It can be seen from the timbre tendency value FPpeaksSoundColor [n] that the acoustic tendency is strong.
- the shunt sound C includes an acoustic feature component, and it can be evaluated that there is a possibility that stenosis has occurred.
- evaluation method described above is merely an example, and different evaluations may be performed based on the same calculation result.
- the evaluation information calculation output unit 140 quantifies each of the harmonic component value FPeaksValue [n], the frequency centroid value FPeaksCentroid [n], and the timbre tendency value FPeaksSoundColor [n] calculated by the parameter calculation unit 130 to narrow the stenosis. Output as evaluation information for evaluating the degree (or indicating the degree of stenosis).
- the evaluation information calculation output unit 140 normalizes the harmonic component value FPeaksValue [n] to 0 to 100 in the range of 0 dB to 20 dB and outputs the normalized value. Further, the frequency centroid value FPeaks Centroid [n] is normalized to 0 to 100 in the range of 150 Hz to 2 kHz and output. Further, the evaluation information calculation output unit 140 calculates and outputs a peak value and a time average value for each of the harmonic component value FPeaksValue [n] and the frequency centroid value FPeaksCentroid [n].
- the evaluation information calculation output unit 140 normalizes the timbre tendency value FPeaksSoundColor [n] to 0 to 100 in the range of 0 dB to 10 dB, and outputs it. Further, the evaluation information calculation output unit 140 calculates and outputs a peak value and a time average value for the timbre tendency value FPpeaksSoundColor [n].
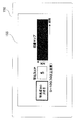
- FIGS. 10 to 13 are plan views showing display examples on the display unit.
- the display area 155 of the display unit 150 includes, for example, an average score (that is, normalized time) of the feature component size (that is, harmonic component value FPeaksValue [n]). Average value) and an impression map for the average score are displayed.
- the average score here is a parameter that can be evaluated as high possibility that stenosis has occurred when the average score is 30 or more.
- an average score “5” and an impression map in which almost no feature component appears are displayed. In this case, for example, it is unlikely that stenosis has occurred, and it can be determined that there is no problem with dialysis on the day.
- an average score “70” and an impression map in which feature components appear strongly are displayed. In this case, for example, it is highly possible that stenosis has occurred, and it can be determined that a doctor needs to be contacted.
- Such a relatively simple display mode is effective when it is difficult to determine how to hear the shunt sound during auscultation.
- the display area 155 of the display unit 150 includes, for example, each of the harmonic component value FPeaksValue [n], the frequency centroid value FPeaksCentroid [n], and the timbre tendency value FPeaksSoundColor [n].
- a peak value and an average score, and an analysis waveform may be displayed. If the evaluation information is displayed in detail in this way, a more accurate and detailed diagnosis (for example, diagnosis of whether the increase in score is caused by stenosis or the influence of other factors) can be performed.
- the characteristic timbre greatly fluctuates and is intermittent, so it can be determined that stenosis should be suspected. Further, in the example of FIG. 13, a characteristic sound is seen, but since the sound seems to be continuous, it can be determined that other findings should be diagnosed together.
- the display unit 150 may perform display in a mode other than the display example described above. Moreover, it may be configured such that the user of the apparatus can appropriately select an appropriate display mode.
- the shunt sound analysis apparatus As described above, according to the shunt sound analysis apparatus according to the present embodiment, appropriate evaluation information is output based on the acquired shunt sound information. Therefore, it is possible to favorably support the diagnosis of stenosis at the shunt formation site.
- the present invention is not limited to the above-described embodiments, and can be appropriately changed without departing from the spirit or idea of the invention that can be read from the claims and the entire specification, and shunt sound analysis accompanying such changes is possible.
- a device, a shunt sound analysis method, a computer program, and a recording medium are also included in the technical scope of the present invention.
Landscapes
- Engineering & Computer Science (AREA)
- Health & Medical Sciences (AREA)
- Data Mining & Analysis (AREA)
- Computational Linguistics (AREA)
- Quality & Reliability (AREA)
- Signal Processing (AREA)
- Audiology, Speech & Language Pathology (AREA)
- Human Computer Interaction (AREA)
- Physics & Mathematics (AREA)
- Acoustics & Sound (AREA)
- Multimedia (AREA)
- Heart & Thoracic Surgery (AREA)
- Urology & Nephrology (AREA)
- Emergency Medicine (AREA)
- Vascular Medicine (AREA)
- Anesthesiology (AREA)
- Biomedical Technology (AREA)
- Hematology (AREA)
- Life Sciences & Earth Sciences (AREA)
- Animal Behavior & Ethology (AREA)
- General Health & Medical Sciences (AREA)
- Public Health (AREA)
- Veterinary Medicine (AREA)
- External Artificial Organs (AREA)
Abstract
シャント音解析装置は、被測定者のシャント形成部位のシャント音に関するシャント音情報を取得する取得手段(110)と、シャント音情報から、被測定者の血管の狭窄によって生じるシャント音の特徴を示す特徴成分を抽出する抽出手段(130)と、特徴成分に基づいて、シャント音の評価に関連する評価情報を出力する出力手段(140)とを備える。これにより、シャント形成部位における狭窄診断を好適に支援することが可能である。
Description
本発明は、被測定者から取得したシャント音を解析するシャント音解析装置、シャント音解析方法、コンピュータプログラム及び記録媒体の技術分野に関する。
この種の装置として、被測定者から取得したシャント音を解析して、シャント狭窄等に関する医師の診断を支援する装置が知られている。例えば特許文献1では、周波数特性の山の位置が狭窄度合いに対応することを利用して、微細成分を除去した包絡成分のピーク位置に応じた狭窄度合いを提示する技術が記載されている。
上述した特許文献1に記載されている技術では、シャント音の高周波成分(即ち、比較的高い周波数の成分)を利用して血管の狭窄度合いを判定している。しかしながら、狭窄時には必ずしも周波数の高低によらない特徴的な音色(例えば、風切り音等)も発生する。そして特に、このような音色成分は、例えば一時的な血栓や、静脈弁の影響等、狭窄以外の要因でも発生することが知られている。よって、特徴的な音色成分を考慮しない特許文献1の技術では、狭窄度合いを正確に評価できないという技術的問題点が生ずる。
また、特徴的な音色成分は、狭窄の度合いによって。周波数特性の包絡成分上に調波性のピークが重畳して現れ、且つ時間的に変動する。このような特性は、特許文献1の周波数特性の山を利用する手法では表現できないため、仮に上述した音色成分を考慮しようと考えた場合であっても、従来の手法では簡単には利用することができない。
本発明が解決しようとする課題には上記のようなものが一例として挙げられる。本発明は、被測定者から取得したシャント音を解析して、シャント形成部位の狭窄診断を好適に支援することが可能なシャント音解析装置、シャント音解析方法、コンピュータプログラム及び記録媒体を提供することを課題とする。
上記課題を解決するためのシャント音解析装置は、被測定者のシャント形成部位のシャント音に関するシャント音情報を取得する取得手段と、前記シャント音情報から、前記被測定者の血管の狭窄によって生じる前記シャント音の特徴を示す特徴成分を抽出する抽出手段と、前記特徴成分に基づいて、前記シャント音の評価に関連する評価情報を出力する出力手段とを備える。
上記課題を解決するためのシャント音解析方法は、被測定者のシャント形成部位のシャント音に関するシャント音情報を取得する取得工程と、前記シャント音情報から、前記被測定者の血管の狭窄によって生じる前記シャント音の特徴を示す特徴成分を抽出する抽出工程と、前記特徴成分に基づいて、前記シャント音の評価に関連する評価情報を出力する出力工程とを備える。
上記課題を解決するためのコンピュータプログラムは、被測定者のシャント形成部位のシャント音に関するシャント音情報を取得する取得工程と、前記シャント音情報から、前記被測定者の血管の狭窄によって生じる前記シャント音の特徴を示す特徴成分を抽出する抽出工程と、前記特徴成分に基づいて、前記シャント音の評価に関連する評価情報を出力する出力工程とをコンピュータに実行させる。
上記課題を解決するための記録媒体は、上述したコンピュータプログラムが記録されている。
<1>
本実施形態に係るシャント音解析装置は、被測定者のシャント形成部位のシャント音に関するシャント音情報を取得する取得手段と、前記シャント音情報から、前記被測定者の血管の狭窄によって生じる前記シャント音の特徴を示す特徴成分を抽出する抽出手段と、前記特徴成分に基づいて、前記シャント音の評価に関連する評価情報を出力する出力手段とを備える。
本実施形態に係るシャント音解析装置は、被測定者のシャント形成部位のシャント音に関するシャント音情報を取得する取得手段と、前記シャント音情報から、前記被測定者の血管の狭窄によって生じる前記シャント音の特徴を示す特徴成分を抽出する抽出手段と、前記特徴成分に基づいて、前記シャント音の評価に関連する評価情報を出力する出力手段とを備える。
本実施形態に係る第1のシャント音解析装置の動作時には、先ず取得手段により、被測定者のシャント形成部位周辺から、シャント音に関するシャント音情報が取得される。なお、ここでの「シャント音」とは、血液を体外に取り出すためのシャント形成部位周辺において取得される血流音であり、被測定者の脈拍に同期した音である。シャント音の取得は各種センサを用いて行えばよく、その取得方法が特に限定されるものではない。また「シャント音情報」とは、シャント音に関する各種パラメータを含む情報であって、例えば音量や周波数等の時間変化などを含んでいる。
シャント音情報が取得されると、抽出手段により、シャント音情報から特徴成分が抽出される。特徴成分は、被測定者の血管の狭窄によって生じるシャント音の特徴を示す成分であり、例えばシャント音情報を示す時間周波数波形から、周波数特性の包絡成分と、シャント音特有のピッチ成分の周波数範囲を超えた微細成分を除去したものである。
特徴成分が抽出されると、出力手段により、シャント音の評価に関連する評価情報が出力される。具体的には、出力手段は、抽出された特徴成分に基づいて評価情報を生成し、生成した評価情報を外部のモニタ等に出力する。なお、ここでの「評価情報」は、シャント形成部位の狭窄度合いを評価した結果を示す情報であってもよいし、シャント形成部位の狭窄度合いを評価するための情報であってもよい。より具体的には、狭窄度合いを直接的に示す数値等が評価情報として出力されてもよいし、医師等が狭窄度合いを判断するための一又は複数のパラメータが評価情報として出力されてもよい。
本実施形態に係る評価情報は、上述したように、シャント音情報から抽出された特徴成分に基づくものである。ここで特に、シャント形成部位の血管に狭窄が発生した場合は、シャント音の高周波成分が強くなる傾向にあるが、本願発明者の研究するところによれば、周波数の高低によらない特徴的な音色成分も生じることが判明している。例えば、狭窄発生時には、ヒュー又はビューという擬音で表現される音響的な成分や、シャンシャン又はシャッシャッという擬音で表現される成分が生ずる。
本実施形態に係るシャント音解析装置によれば、上述した特徴的な音色成分を考慮した評価情報が出力される。よって、例えばシャント音の周波数の高低のみで狭窄を評価する場合と比べると、より正確な評価を実現できる。従って、シャント形成部位の狭窄診断を好適に支援することが可能である。
<2>
本実施形態に係るシャント音解析装置の一態様では、前記抽出手段は、前記シャント音情報に対しケプストラム変換処理を行い、第1の次数以下のケフレンシー及び第2の次数以上のケフレンシーを除去してフーリエ変換することで、前記特徴成分を抽出する。
本実施形態に係るシャント音解析装置の一態様では、前記抽出手段は、前記シャント音情報に対しケプストラム変換処理を行い、第1の次数以下のケフレンシー及び第2の次数以上のケフレンシーを除去してフーリエ変換することで、前記特徴成分を抽出する。
この態様によれば、シャント音情報が取得されると、先ずケプストラム変換処理が行われる。ケプストラム変換処理は、例えばシャント音情報を示す時間周波数波形に対して、逆フーリエ変換を行うことで実現される。
続いて、ケプストラム変換されたシャント音情報からは、第1の次数以下のケフレンシー及び第2の次数以上のケフレンシーが除去される。ここで、「第2の次数」とは、シャント音特有のピッチ成分の周波数を超えた微細成分を除去するために設定される次数であり、事前のシミュレーション等により最適値が設定されている。また、「第1の次数」とは、シャント音の周波数特性(例えば、周波数ごとのシャント音の大きさを示す波形によって示される特性)の包絡成分を除去するために設定される次数であり、第1の次数と同様に、事前のシミュレーション等により最適値が設定されている。なお、「第1の次数」及び「第2の次数」の最適値は、サンプリング周波数やフレーム長さに応じた値とすればよい。
第1の次数及び第2の次数に応じたケフレンシーが除去されたシャント音情報は、フーリエ変換されることで、元の周波数波形へと変換される。このようにして得られる波形は、狭窄発生時に生ずる特徴的な音色成分(即ち、特徴成分)を抽出したものとなる。
以上のように、ケプストラム変換及び所定次数のケフレンシー除去を利用すれば、シャント音情報の特徴成分を好適に抽出することが可能である。
<3>
本実施形態に係るシャント音解析装置の他の態様では、前記出力手段は、前記特徴成分における時間軸上で隣り合うフレームの相互相関を示す調波性成分値を算出し、前記評価情報として出力する。
本実施形態に係るシャント音解析装置の他の態様では、前記出力手段は、前記特徴成分における時間軸上で隣り合うフレームの相互相関を示す調波性成分値を算出し、前記評価情報として出力する。
この態様によれば、シャント音情報から特徴成分が抽出されると、特徴成分における時間軸上で隣り合うフレーム(例えば、時刻n-1のフレーム及び時刻nのフレーム)の相互相関を示す調波性成分値が算出される。このようにして算出される調波性成分値は、シャント音における時間方向に持続的な成分量を示すパラメータである。
本願発明者の研究するところによれば、狭窄発生時に生ずる特徴的な音色は、時間方向に連続した成分を有することが判明している。よって、調波性成分値を算出すれば、瞬間的な(即ち、持続しない)特徴成分の影響が軽減され、特徴的な音色成分の大きさ(強さ)に対応する値を得ることができる。従って、調波性成分値を評価情報として出力すれば、狭窄の発生を好適に評価することが可能である。
<4>
本実施形態に係るシャント音解析装置の他の態様では、前記出力手段は、前記特徴成分の周波数重心値を算出し、前記評価情報として出力する。
本実施形態に係るシャント音解析装置の他の態様では、前記出力手段は、前記特徴成分の周波数重心値を算出し、前記評価情報として出力する。
この態様によれば、シャント音情報から特徴成分が抽出されると、特徴成分の周波数重心値が算出される。周波数重心値は、特徴的な音色成分の高さに相当する値であり、例えば狭窄の度合いや、その他の要因によって異なる値として算出される。従って、周波数重心値を評価情報として出力すれば、狭窄の発生を好適に評価することが可能である。
<5>
本実施形態に係るシャント音解析装置の他の態様では、前記出力手段は、前記特徴成分のピーク値から前記特徴成分の平均値を差し引いた音色傾向値を算出し、前記評価情報として出力する。
本実施形態に係るシャント音解析装置の他の態様では、前記出力手段は、前記特徴成分のピーク値から前記特徴成分の平均値を差し引いた音色傾向値を算出し、前記評価情報として出力する。
この態様によれば、シャント音情報から特徴成分が抽出されると、先ず特徴成分のピーク値(所定時間の最大ピーク値)及び平均値(所定時間の平均値)が算出される。そして、特徴成分のピーク値から平均値が差し引かれ、音色傾向値として算出される。
音色傾向値は、例えばヒューヒュー等の音響的な成分と、シャッシャッ等の雑音的な成分とのいずれの傾向が強いかを示す値である。具体的には、音色傾向値が高い場合には、音響的な成分の傾向が強いと判定でき、音色傾向値が低い場合には、雑音的な成分の傾向が強いと判定できる。従って音色傾向値を評価情報として出力すれば、狭窄の発生を好適に評価することが可能である。
<6>
本実施形態に係るシャント音解析方法は、被測定者のシャント形成部位のシャント音に関するシャント音情報を取得する取得工程と、前記シャント音情報から、前記被測定者の血管の狭窄によって生じる前記シャント音の特徴を示す特徴成分を抽出する抽出工程と、前記特徴成分に基づいて、前記シャント音の評価に関連する評価情報を出力する出力工程とを備える。
本実施形態に係るシャント音解析方法は、被測定者のシャント形成部位のシャント音に関するシャント音情報を取得する取得工程と、前記シャント音情報から、前記被測定者の血管の狭窄によって生じる前記シャント音の特徴を示す特徴成分を抽出する抽出工程と、前記特徴成分に基づいて、前記シャント音の評価に関連する評価情報を出力する出力工程とを備える。
本実施形態に係るシャント音解析方法によれば、上述した本実施形態に係るシャント音解析装置と同様に、狭窄によって生じる特量成分に基づいた評価情報が出力される。従って、シャント形成部位の狭窄診断を好適に支援することが可能である。
<7>
本実施形態に係るコンピュータプログラムは、被測定者のシャント形成部位のシャント音に関するシャント音情報を取得する取得工程と、前記シャント音情報から、前記被測定者の血管の狭窄によって生じる前記シャント音の特徴を示す特徴成分を抽出する抽出工程と、前記特徴成分に基づいて、前記シャント音の評価に関連する評価情報を出力する出力工程とをコンピュータに実行させる。
本実施形態に係るコンピュータプログラムは、被測定者のシャント形成部位のシャント音に関するシャント音情報を取得する取得工程と、前記シャント音情報から、前記被測定者の血管の狭窄によって生じる前記シャント音の特徴を示す特徴成分を抽出する抽出工程と、前記特徴成分に基づいて、前記シャント音の評価に関連する評価情報を出力する出力工程とをコンピュータに実行させる。
本実施形態に係るコンピュータプログラムによれば、コンピュータに上述した本実施形態に係るシャント音解析方法の各工程を実行させることができる。従って、シャント形成部位の狭窄診断を好適に支援することが可能である。
<8>
本実施形態に係る記録媒体は、上述したコンピュータプログラムが記録されている。
本実施形態に係る記録媒体は、上述したコンピュータプログラムが記録されている。
本実施形態に係る記録媒体によれば、記録されたコンピュータプログラムを実行させることで、狭窄によって生じる特量成分に基づいた評価情報を出力させることが可能である。従って、シャント形成部位の狭窄診断を好適に支援することが可能である。
本実施形態に係るシャント音解析装置、シャント音解析方法、コンピュータプログラム及び記録媒体の作用及び他の利得については、以下に示す実施例において、より詳細に説明する。
以下では、図面を参照してシャント音解析装置の実施例について詳細に説明する。
<装置構成>
先ず、図1を参照して、本実施例に係るシャント音解析装置の全体構成について説明する。ここに図1は、実施例に係るシャント音解析装置の全体構成を示すブロック図である。
先ず、図1を参照して、本実施例に係るシャント音解析装置の全体構成について説明する。ここに図1は、実施例に係るシャント音解析装置の全体構成を示すブロック図である。
図1において、本実施例に係るシャント音解析装置は、シャント音入力部110と、音声信号解析処理部120と、パラメータ演算部130と、評価情報演算出力部140と、表示部150とを備えて構成されている。
シャント音入力部110は、「取得手段」の一具体例であり、例えば振動センサ等から入力されたシャント音に対し、所定のサンプリング周波数Fsでアナログデジタル変換を行い、シャント音波形を出力する。シャント音入力部110で生成されたシャント音波形は、音声信号解析処理部120へと出力される構成となっている。
音声信号解析処理部120は、シャント音入力部110から入力されたシャント音波形に対して各種解析処理(例えば、短時間フーリエ変換や対数変換等)を行い、時間周波数解析波形を出力する。音声信号解析処理部120による解析結果は、パラメータ演算部130に出力される構成となっている。
パラメータ演算部130は、「抽出手段」の一具体例であり、音声信号解析処理部120から入力された時間周波数解析波形に対して各種演算処理(例えば、逆フーリエ変換、ケフレンシーカット、フーリエ変換等)を行うことで、時間特徴成分特性波形を得る。またパラメータ演算部130は、時間特徴成分特性波形から、調波性成分値、周波数重心値、及び音色傾向値を算出する。パラメータ演算部130によって算出された調波性成分値、周波数重心値、及び音色傾向値は、評価情報演算出力部140に夫々出力される構成となっている。
評価情報演算出力部140は、「出力手段」の一具体例であり、パラメータ演算部130の出力値、及び出力値のピーク値や時間平均値を用いて、被測定者の血管の狭窄度合いを評価するための評価情報を演算し出力する。評価情報演算出力部140によって演算された評価情報は、表示部150に出力される構成となっている。
表示部150は、例えばモニタ等として構成されており、評価情報演算出力部140から入力された評価情報を、例えば医師等の装置使用者に視覚的に提示することが可能に構成されている。
<動作説明>
次に、本実施例に係るシャント音解析装置の具体的な動作について説明する。なお、以下では、本実施例に係るシャント音解析装置が有する各部位のうち、本実施例に特有な部位(具体的には、音声信号解析処理部120、パラメータ演算130、評価情報演算出力部140、及び表示部150)の動作について詳細に説明する。
次に、本実施例に係るシャント音解析装置の具体的な動作について説明する。なお、以下では、本実施例に係るシャント音解析装置が有する各部位のうち、本実施例に特有な部位(具体的には、音声信号解析処理部120、パラメータ演算130、評価情報演算出力部140、及び表示部150)の動作について詳細に説明する。
<音声信号解析処理部>
先ず、図2及び図3を参照して、音声信号解析処理部120の動作について詳細に説明する。ここに図2は、シャント音波形の一例を示す波形図である。また図3は、時間周波数波形の一例を示すスペクトログラムである。
先ず、図2及び図3を参照して、音声信号解析処理部120の動作について詳細に説明する。ここに図2は、シャント音波形の一例を示す波形図である。また図3は、時間周波数波形の一例を示すスペクトログラムである。
図2に示すように、音声信号解析処理部120には、シャント音入力部110で生成されたシャント音波形が入力される。なお、シャント音波形)は、図を見ても分かるように、被測定者のシャント音形性部位から取得された音声の振幅について、その時間変動を示す波形である。
音声信号解析処理部120は、シャント音波形の時刻nの値X(n)に対して、長さNフレーム単位で、Nポイント短時間フーリエ変換と、対数変換とを施し、時間周波数解析波形Plog[n,k]を算出する。
具体的には、音声信号解析処理部120は、以下の数式(1)を用いて、短時間フーリエ変換を行う。


図3に示すように、音声信号解析処理部120によって演算された時間周波数解析波形Plog[n,k]は、各周波数に対応する音圧の時間変動を示す波形である。
<パラメータ演算部>
次に、図4から図9を参照して、パラメータ演算部130の動作について詳細に説明する。
次に、図4から図9を参照して、パラメータ演算部130の動作について詳細に説明する。
<特徴成分の抽出>
先ず、図4から図6を参照して、パラメータ演算部130による特徴成分の抽出について詳細に説明する。ここに図4は、時刻nにおける周波数波形の一例を示す波形図であり、図5は、時刻nにおける特徴成分特性波形の一例を示す波形図である。また図6は、時間特徴成分特性波形の一例を示すスペクトログラムである。
先ず、図4から図6を参照して、パラメータ演算部130による特徴成分の抽出について詳細に説明する。ここに図4は、時刻nにおける周波数波形の一例を示す波形図であり、図5は、時刻nにおける特徴成分特性波形の一例を示す波形図である。また図6は、時間特徴成分特性波形の一例を示すスペクトログラムである。
図4に示すように、時間周波数解析波形Plog[n,k]の時刻nにおける周波数波形は、周波数毎の音圧を示す波形として表される。パラメータ演算部130は、このような時間周波数解析波形Plog[n,k]の各フレームに各種演算処理を行い、特徴成分を抽出する。
具体的には、パラメータ演算部130は、以下の数式(3)を用いて、時間周波数解析波形Plog[n,k]の逆フーリエ変換を行う。


なお、次数lift_low及びlift_highの最適値は、サンプリング周波数Fsやフレーム長さNに応じて定まる値であり、事前のシミュレーション等により最適値が設定されている。ここでの次数lift_lowは、「第1の次数」の一具体例であり、次数lift_highは、「第2の次数」の一具体例である。
次に、パラメータ演算部130は、以下の数式(5)を用いてフーリエ変換を行い、時間特徴成分特性波形FPeaks[n,k]を演算する。

図6に示すように、時間特徴成分特性波形FPeaks[n,k]は、各周波数に対応する音圧の微細成分の時間変動を示す波形である。
<特徴成分パラメータの演算>
次に、図7及び図8を参照して、パラメータ演算部130による特徴成分パラメータの演算について詳細に説明する。ここに図7は、パラメータ演算部の具体的な構成を示すブロック図である。また図8は、調波性成分値、周波数重心値及び音色傾向値の一例を示すタイムチャートである。
次に、図7及び図8を参照して、パラメータ演算部130による特徴成分パラメータの演算について詳細に説明する。ここに図7は、パラメータ演算部の具体的な構成を示すブロック図である。また図8は、調波性成分値、周波数重心値及び音色傾向値の一例を示すタイムチャートである。
図7において、時間特徴成分特性波形FPeaks[n,k]は、パラメータ演算部130の調波性成分演算部131、周波数重心演算部132、及び音色傾向演算部133に夫々入力される。
調波性成分演算部131は、以下の数式(6)を用いて、時間特徴成分特性波形FPeaks[n,k]から、特徴成分パラメータの1つである調波性成分値FPeaksValue[n]を算出する。

周波数重心演算部132は、以下の数式(7)を用いて、時間特徴成分特性波形FPeaks[n,k]から、特徴成分パラメータの1つである周波数重心値FPeaksCentroid[n]を算出する。
音色傾向演算部133は、以下の数式(8)を用いて、時間特徴成分特性波形FPeaks[n,k]から、特徴成分パラメータの1つである音色傾向値FPeaksSoundColor[n]を算出する。

図8に示すように、調波性成分値FPeaksValue[n]は、特徴的な音色成分の大きさに相当する値として算出される。周波数重心値FPeaksCentroid[n]は、特徴的な音色成分の高さに相当する値として算出される。音色傾向値FPeaksSoundColor[n]は、特徴的な音色成分の音色の傾向を示す値として算出される。
<演算結果を用いた評価>
次に、図9を参照して、上述した演算によって得られた各種パラメータを用いた狭窄度合いの評価方法について、具体的に説明する。ここに図9は、パラメータ演算部における演算結果を複数のシャント音毎に示す比較一覧図である。
次に、図9を参照して、上述した演算によって得られた各種パラメータを用いた狭窄度合いの評価方法について、具体的に説明する。ここに図9は、パラメータ演算部における演算結果を複数のシャント音毎に示す比較一覧図である。
図9において、シャント音Aは、正常なシャント音の一例である。シャント音Aは、時間特徴成分特性波形FPeaks[n,k]を見ても分かるように、特徴的な特性が現れない。このため、調波性成分値FPeaksValue[n]、周波数重心値FPeaksCentroid[n]、及び音色傾向値FPeaksSoundColor[n]のいずれも極めて低い値で安定している。このように、特徴成分パラメータが低い値で安定している場合には、狭窄は発生していない(或いは、極めて狭窄度合いが小さい)と評価することができる。
シャント音Bは、シャッシャッという特徴的な音を含むシャント音の一例である。シャント音Bは、シャント音Aと比べると、調波性成分値FPeaksValue[n]が高い値として算出されている。また、周波数重心値FPeaksCentroid[n]も高い値で推移しており、心拍に同期して高さが揺れ動く様子が分かる。音色傾向値FPeaksSoundColor[n]からは、雑音的な傾向が強いことが分かる。この結果、シャント音Bには、雑音的な特徴成分が含まれており、狭窄が発生している可能性があると評価できる。
シャント音Cは、ビュービューという特徴的な音を含むシャント音の一例である。シャント音Cは、調波性成分値FPeaksValue[n]が極めて高い値として算出されている。また、周波数重心値FPeaksCentroid[n]は極めて高い値で推移している。音色傾向値FPeaksSoundColor[n]からは、音響的な傾向が強いことが分かる。この結果、シャント音Cには音響的な特徴成分が多く含まれており、狭窄が発生している可能性が高いと評価できる。
シャント音Dは、低い唸りのような特徴的な音を含むシャント音の一例である。シャント音Dは、調波性成分値FPeaksValue[n]が高い値として算出されている。また、周波数重心値FPeaksCentroid[n]は断続的に激しく変化している。音色傾向値FPeaksSoundColor[n]からは、音響的な傾向が強いことが分かる。この結果、シャント音Cには音響的な特徴成分が含まれており、狭窄が発生している可能性があると評価できる。
なお、上述した評価方法はあくまで一例であり、同一の演算結果から異なる評価を行っても構わない。
<評価情報演算出力部>
次に、評価情報演算出力部140の動作について詳細に説明する。
次に、評価情報演算出力部140の動作について詳細に説明する。
評価情報演算出力部140は、パラメータ演算部130で算出された調波性成分値FPeaksValue[n]、周波数重心値FPeaksCentroid[n]、及び音色傾向値FPeaksSoundColor[n]の各々を数値化して、狭窄度合いを評価するための(或いは、狭窄度合いを示す)評価情報として出力する。
具体的には、評価情報演算出力部140は、調波性成分値FPeaksValue[n]を、0dB~20dBの範囲で0~100に正規化して出力する。また、周波数重心値FPeaksCentroid[n]を、150Hz~2kHzの範囲で0~100に正規化して出力する。また、評価情報演算出力部140は、調波性成分値FPeaksValue[n]及び周波数重心値FPeaksCentroid[n]の各々について、ピーク値及び時間平均値を演算して出力する。
評価情報演算出力部140は、音色傾向値FPeaksSoundColor[n]を、0dB~10dBの範囲で0~100に正規化して出力する。また、評価情報演算出力部140は、音色傾向値FPeaksSoundColor[n]について、ピーク値及び時間平均値を演算して出力する。
<表示部>
次に、図10から図13を参照して、表示部150の動作について詳細に説明する。ここに図10から図13は夫々、表示部における表示例を示す平面図である。
次に、図10から図13を参照して、表示部150の動作について詳細に説明する。ここに図10から図13は夫々、表示部における表示例を示す平面図である。
図10及び図11に示すように、表示部150の表示領域155には、例えば特徴成分の大きさ(即ち、調波性成分値FPeaksValue[n])の平均スコア(即ち、正規化された時間平均値)と、平均スコアについての印象マップが表示される。なお、ここでの平均スコアは、30以上の場合に狭窄が発生している可能性が高いと評価できるようなパラメータとなっている。
具体的には、図10の例では、平均スコア“5”と、特徴成分が殆ど現れていない印象マップが表示されている。この場合、例えば狭窄が発生している可能性は低く、当日の透析に問題はなさそうだと判断できる。一方、図11の例では、平均スコア“70”と、特徴成分が強く現れた印象マップが表示されている。この場合、例えば狭窄が発生している可能性が高く、医師に連絡が必要であると判断できる。このような比較的簡易な表示態様は、聴診時などにおいてシャント音の聞こえ方に対する判断が難しい場合に有効である。
図12及び図13に示すように、表示部150の表示領域155には、例えば調波性成分値FPeaksValue[n]、周波数重心値FPeaksCentroid[n]、及び音色傾向値FPeaksSoundColor[n]の各々のピーク値及び平均スコア、並びに解析波形が表示されてもよい。このように評価情報を詳細に表示すれば、より正確で細かな診断(例えば、スコアの上昇が狭窄による影響なのか、或いは他の要因による影響なのかの診断)を行うことも可能となる。
具体的には、図12の例では、特徴的な音色が大きく変動及び断続しているため、狭窄を疑うべきであると判断できる。また、図13の例では、特徴的な音が見られるが、音が連続しているようなので、他の所見を併せて診断すべきと判断できる。
なお、表示部150は、上述した表示例以外の態様で表示を行っても構わない。また、装置の使用者が適切な表示態様を適宜選択できるように構成されてもよい。
以上説明したように、本実施例に係るシャント音解析装置によれば、取得したシャント音情報に基づいて適切な評価情報が出力される。従って、シャント形成部位における狭窄診断を好適に支援することが可能である。
本発明は、上述した実施形態に限られるものではなく、特許請求の範囲及び明細書全体から読み取れる発明の要旨或いは思想に反しない範囲で適宜変更可能であり、そのような変更を伴うシャント音解析装置、シャント音解析方法、コンピュータプログラム及び記録媒体もまた本発明の技術的範囲に含まれるものである。
110 シャント音入力部
120 音声信号解析処理部
130 パラメータ演算部
131 調波性成分演算部
132 周波数重心演算部
133 音色傾向値演算部
140 評価情報演算出力部
150 表示部
155 表示領域
FPeaksValue[n] 調波性成分値
FPeaksCentroid[n] 周波数重心値
FPeaksSoundColor[n] 音色傾向値
120 音声信号解析処理部
130 パラメータ演算部
131 調波性成分演算部
132 周波数重心演算部
133 音色傾向値演算部
140 評価情報演算出力部
150 表示部
155 表示領域
FPeaksValue[n] 調波性成分値
FPeaksCentroid[n] 周波数重心値
FPeaksSoundColor[n] 音色傾向値
Claims (8)
- 被測定者のシャント形成部位のシャント音に関するシャント音情報を取得する取得手段と、
前記シャント音情報から、前記被測定者の血管の狭窄によって生じる前記シャント音の特徴を示す特徴成分を抽出する抽出手段と、
前記特徴成分に基づいて、前記シャント音の評価に関連する評価情報を出力する出力手段と
を備えることを特徴とするシャント音解析装置。 - 前記抽出手段は、前記シャント音情報に対しケプストラム変換処理を行い、第1の次数以下のケフレンシー及び第2の次数以上のケフレンシーを除去してフーリエ変換することで、前記特徴成分を抽出することを特徴とする請求項1に記載のシャント音解析装置。
- 前記出力手段は、前記特徴成分における時間軸上で隣り合うフレームの相互相関を示す調波性成分値を算出し、前記評価情報として出力することを特徴とする請求項1又は2に記載のシャント音解析装置。
- 前記出力手段は、前記特徴成分の周波数重心値を算出し、前記評価情報として出力することを特徴とする請求項1から3のいずれか一項に記載のシャント音解析装置。
- 前記出力手段は、前記特徴成分のピーク値から前記特徴成分の平均値を差し引いた音色傾向値を算出し、前記評価情報として出力することを特徴とする請求項1から4のいずれか一項に記載のシャント音解析装置。
- 被測定者のシャント形成部位のシャント音に関するシャント音情報を取得する取得工程と、
前記シャント音情報から、前記被測定者の血管の狭窄によって生じる前記シャント音の特徴を示す特徴成分を抽出する抽出工程と、
前記特徴成分に基づいて、前記シャント音の評価に関連する評価情報を出力する出力工程と
を備えることを特徴とするシャント音解析方法。 - 被測定者のシャント形成部位のシャント音に関するシャント音情報を取得する取得工程と、
前記シャント音情報から、前記被測定者の血管の狭窄によって生じる前記シャント音の特徴を示す特徴成分を抽出する抽出工程と、
前記特徴成分に基づいて、前記シャント音の評価に関連する評価情報を出力する出力工程と
をコンピュータに実行させることを特徴とするコンピュータプログラム。 - 請求項7に記載のコンピュータプログラムが記録されていることを特徴とする記録媒体。
Priority Applications (2)
| Application Number | Priority Date | Filing Date | Title |
|---|---|---|---|
| JP2017524292A JP6467044B2 (ja) | 2015-06-22 | 2015-06-22 | シャント音解析装置、シャント音解析方法、コンピュータプログラム及び記録媒体 |
| PCT/JP2015/067877 WO2016207951A1 (ja) | 2015-06-22 | 2015-06-22 | シャント音解析装置、シャント音解析方法、コンピュータプログラム及び記録媒体 |
Applications Claiming Priority (1)
| Application Number | Priority Date | Filing Date | Title |
|---|---|---|---|
| PCT/JP2015/067877 WO2016207951A1 (ja) | 2015-06-22 | 2015-06-22 | シャント音解析装置、シャント音解析方法、コンピュータプログラム及び記録媒体 |
Publications (1)
| Publication Number | Publication Date |
|---|---|
| WO2016207951A1 true WO2016207951A1 (ja) | 2016-12-29 |
Family
ID=57584859
Family Applications (1)
| Application Number | Title | Priority Date | Filing Date |
|---|---|---|---|
| PCT/JP2015/067877 Ceased WO2016207951A1 (ja) | 2015-06-22 | 2015-06-22 | シャント音解析装置、シャント音解析方法、コンピュータプログラム及び記録媒体 |
Country Status (2)
| Country | Link |
|---|---|
| JP (1) | JP6467044B2 (ja) |
| WO (1) | WO2016207951A1 (ja) |
Cited By (5)
| Publication number | Priority date | Publication date | Assignee | Title |
|---|---|---|---|---|
| CN108567421A (zh) * | 2017-03-08 | 2018-09-25 | 旭化成医疗株式会社 | 计算分流血管的狭窄指标的方法、装置以及存储介质 |
| CN112294253A (zh) * | 2019-07-26 | 2021-02-02 | 深圳百诺明医说科技有限公司 | 一种基于用户语音变化的疾病诊断系统及家庭智能机器人 |
| JPWO2022097573A1 (ja) * | 2020-11-04 | 2022-05-12 | ||
| CN116807509A (zh) * | 2023-06-29 | 2023-09-29 | 苏州盈迪信康科技股份有限公司 | 一种基于血管音的血管通路狭窄检测系统 |
| JP2024519336A (ja) * | 2021-05-13 | 2024-05-10 | 延世大学校 産学協力団 | 畳み込みニューラルネットワークを用いた透析接近路の狹窄予測方法および装置 |
Citations (2)
| Publication number | Priority date | Publication date | Assignee | Title |
|---|---|---|---|---|
| JP2010029434A (ja) * | 2008-07-29 | 2010-02-12 | Tom-Medic Co Ltd | 血管狭窄度合い判定プログラム、記録媒体、情報端末装置、血管狭窄度合い判定システムおよび血管狭窄度合い判定方法 |
| JP2014008263A (ja) * | 2012-06-29 | 2014-01-20 | Univ Of Yamanashi | シャント狭窄診断支援システムおよび方法,アレイ状採音センサ装置,ならびに逐次細分化自己組織化マップ作成装置,方法およびプログラム |
Family Cites Families (2)
| Publication number | Priority date | Publication date | Assignee | Title |
|---|---|---|---|---|
| US8105237B2 (en) * | 2008-05-30 | 2012-01-31 | Volcano Corporation | System and method for characterizing tissue based upon homomorphic deconvolution of backscattered ultrasound |
| JP6371516B2 (ja) * | 2013-11-15 | 2018-08-08 | キヤノン株式会社 | 音響信号処理装置および方法 |
-
2015
- 2015-06-22 WO PCT/JP2015/067877 patent/WO2016207951A1/ja not_active Ceased
- 2015-06-22 JP JP2017524292A patent/JP6467044B2/ja active Active
Patent Citations (2)
| Publication number | Priority date | Publication date | Assignee | Title |
|---|---|---|---|---|
| JP2010029434A (ja) * | 2008-07-29 | 2010-02-12 | Tom-Medic Co Ltd | 血管狭窄度合い判定プログラム、記録媒体、情報端末装置、血管狭窄度合い判定システムおよび血管狭窄度合い判定方法 |
| JP2014008263A (ja) * | 2012-06-29 | 2014-01-20 | Univ Of Yamanashi | シャント狭窄診断支援システムおよび方法,アレイ状採音センサ装置,ならびに逐次細分化自己組織化マップ作成装置,方法およびプログラム |
Cited By (9)
| Publication number | Priority date | Publication date | Assignee | Title |
|---|---|---|---|---|
| CN108567421A (zh) * | 2017-03-08 | 2018-09-25 | 旭化成医疗株式会社 | 计算分流血管的狭窄指标的方法、装置以及存储介质 |
| CN108567421B (zh) * | 2017-03-08 | 2020-12-08 | 旭化成医疗株式会社 | 计算分流血管的狭窄指标的方法、装置以及存储介质 |
| CN112294253A (zh) * | 2019-07-26 | 2021-02-02 | 深圳百诺明医说科技有限公司 | 一种基于用户语音变化的疾病诊断系统及家庭智能机器人 |
| JPWO2022097573A1 (ja) * | 2020-11-04 | 2022-05-12 | ||
| WO2022097573A1 (ja) | 2020-11-04 | 2022-05-12 | 株式会社 レイマック | 非接触血管解析装置 |
| JP7274803B2 (ja) | 2020-11-04 | 2023-05-17 | 株式会社レイマック | 非接触血管解析装置 |
| JP2024519336A (ja) * | 2021-05-13 | 2024-05-10 | 延世大学校 産学協力団 | 畳み込みニューラルネットワークを用いた透析接近路の狹窄予測方法および装置 |
| JP7745652B2 (ja) | 2021-05-13 | 2025-09-29 | 延世大学校 産学協力団 | 畳み込みニューラルネットワークを用いた透析接近路の狹窄予測方法および装置 |
| CN116807509A (zh) * | 2023-06-29 | 2023-09-29 | 苏州盈迪信康科技股份有限公司 | 一种基于血管音的血管通路狭窄检测系统 |
Also Published As
| Publication number | Publication date |
|---|---|
| JP6467044B2 (ja) | 2019-02-06 |
| JPWO2016207951A1 (ja) | 2018-06-14 |
Similar Documents
| Publication | Publication Date | Title |
|---|---|---|
| EP3678553B1 (en) | Diagnosis of pathologies using infrasonic signatures | |
| US11116478B2 (en) | Diagnosis of pathologies using infrasonic signatures | |
| JP6467044B2 (ja) | シャント音解析装置、シャント音解析方法、コンピュータプログラム及び記録媒体 | |
| WO2017218818A2 (en) | Method for eliminating noise in signal data from a piezoelectric device and detecting stenosis | |
| EP3526792A1 (en) | Voice activity detection method and apparatus | |
| JP2022091851A (ja) | 検出装置 | |
| JP2016182165A (ja) | 生体信号処理装置、生体信号処理プログラム、生体信号処理プログラムを記録したコンピュータ読み取り可能な記録媒体、生体信号処理方法 | |
| Mondal et al. | Boundary estimation of cardiac events S1 and S2 based on Hilbert transform and adaptive thresholding approach | |
| CN120458531A (zh) | 心脏健康状态检测方法、装置及电子设备 | |
| JP2019111347A (ja) | シャント音解析装置、シャント音解析方法、コンピュータプログラム及び記録媒体 | |
| JP6501917B2 (ja) | 生体音解析装置及び生体音解析方法、並びにコンピュータプログラム及び記録媒体 | |
| JP6298527B2 (ja) | 生体音解析装置及び生体音解析方法、並びにコンピュータプログラム及び記録媒体 | |
| JP7089648B2 (ja) | 生体音解析装置、プログラム、及び生体音解析方法 | |
| CN112614503B (zh) | 心音信号的处理方法、装置、电子设备及可读存储介质 | |
| Millette et al. | Signal processing of heart signals for the quantification of non-deterministic events | |
| Zhang et al. | Temporal analysis, manipulation, and resynthesis of musical vibrato | |
| WO2016207950A1 (ja) | シャント音解析装置、シャント音解析方法、コンピュータプログラム及び記録媒体 | |
| JP6630149B2 (ja) | 生体音解析装置及び生体音解析方法、並びにコンピュータプログラム及び記録媒体 | |
| WO2016139802A1 (ja) | シャント音解析装置、シャント音解析方法、コンピュータプログラム及び記録媒体 | |
| JP2020199293A (ja) | シャント音解析装置 | |
| JP6715529B2 (ja) | 生体音解析装置及び生体音解析方法、並びにコンピュータプログラム及び記録媒体 | |
| JP7001806B2 (ja) | 呼吸音解析装置、呼吸音解析方法、コンピュータプログラム及び記録媒体 | |
| WO2017130415A1 (ja) | 生体音解析装置及び生体音解析方法、並びにコンピュータプログラム及び記録媒体 | |
| JP2019150641A (ja) | 呼吸音解析装置 | |
| JP2015188601A (ja) | 呼吸音解析装置及び呼吸音解析方法、並びにコンピュータプログラム及び記録媒体 |
Legal Events
| Date | Code | Title | Description |
|---|---|---|---|
| 121 | Ep: the epo has been informed by wipo that ep was designated in this application |
Ref document number: 15896274 Country of ref document: EP Kind code of ref document: A1 |
|
| ENP | Entry into the national phase |
Ref document number: 2017524292 Country of ref document: JP Kind code of ref document: A |
|
| NENP | Non-entry into the national phase |
Ref country code: DE |
|
| 122 | Ep: pct application non-entry in european phase |
Ref document number: 15896274 Country of ref document: EP Kind code of ref document: A1 |