WO2016199890A1 - 配向同定装置、配向同定方法および分布同定装置 - Google Patents
配向同定装置、配向同定方法および分布同定装置 Download PDFInfo
- Publication number
- WO2016199890A1 WO2016199890A1 PCT/JP2016/067370 JP2016067370W WO2016199890A1 WO 2016199890 A1 WO2016199890 A1 WO 2016199890A1 JP 2016067370 W JP2016067370 W JP 2016067370W WO 2016199890 A1 WO2016199890 A1 WO 2016199890A1
- Authority
- WO
- WIPO (PCT)
- Prior art keywords
- sample
- orientation
- distribution
- measurement
- delay
- Prior art date
- Legal status (The legal status is an assumption and is not a legal conclusion. Google has not performed a legal analysis and makes no representation as to the accuracy of the status listed.)
- Ceased
Links
Images


Classifications
-
- G—PHYSICS
- G01—MEASURING; TESTING
- G01N—INVESTIGATING OR ANALYSING MATERIALS BY DETERMINING THEIR CHEMICAL OR PHYSICAL PROPERTIES
- G01N25/00—Investigating or analyzing materials by the use of thermal means
- G01N25/18—Investigating or analyzing materials by the use of thermal means by investigating thermal conductivity
-
- G—PHYSICS
- G01—MEASURING; TESTING
- G01B—MEASURING LENGTH, THICKNESS OR SIMILAR LINEAR DIMENSIONS; MEASURING ANGLES; MEASURING AREAS; MEASURING IRREGULARITIES OF SURFACES OR CONTOURS
- G01B21/00—Measuring arrangements or details thereof, where the measuring technique is not covered by the other groups of this subclass, unspecified or not relevant
-
- G—PHYSICS
- G01—MEASURING; TESTING
- G01N—INVESTIGATING OR ANALYSING MATERIALS BY DETERMINING THEIR CHEMICAL OR PHYSICAL PROPERTIES
- G01N25/00—Investigating or analyzing materials by the use of thermal means
- G01N25/72—Investigating presence of flaws
Definitions
- the present invention relates to an orientation identification device, an orientation identification method, and a distribution identification device.
- carbon fiber reinforced composite materials are widely used as materials with high thermal conductivity, anisotropy and high specific rigidity.
- a carbon fiber reinforced composite material there is a large difference in mechanical properties (strength, rigidity, etc.) and thermal properties (thermal diffusivity, thermal conductivity, etc.) due to the anisotropy caused by the orientation of the carbon fibers. Therefore, identification (measurement) of anisotropy is important.
- Patent Document 1 uses a power spectrum image obtained by binarizing a slice image of a resin molded product acquired by an X-ray CT method, and applying a Fourier transform to the binarized image, It is disclosed to analyze the tendency of the orientation state of the filler in a part of the resin molded product.
- the X-ray CT method and the tensile test were adopted as the method for identifying the orientation of the carbon fiber reinforced composite material, it was necessary to contact the measurement sample such as cutting out the measurement sample.
- the X-ray CT method and the tensile test described above are employed as, for example, an orientation identification method in the manufacturing process of a carbon fiber reinforced composite material, a long time may be required for measurement evaluation, and the apparatus may become large. It was.
- the X-ray CT method and the tensile test described above are difficult to use for in-line measurement.
- the present invention has been made to solve the above-described problems, and an object of the present invention is to provide an orientation identification device that can quickly identify the orientation of a sample in a non-contact manner.
- the invention according to claim 1 includes a heating unit that periodically irradiates light to a sample composed of a plurality of materials and heats the sample, and a portion heated by the heating unit of the sample.
- a detection unit that detects a delay in response to a change in temperature distribution in the region, and information indicating the orientation of at least one material constituting the sample is output based on the response delay detected by the detection unit.
- An orientation identification device including an output unit.
- the heating unit heats the sample from one side of the sample, and the detection unit changes a temperature distribution in the region from the side opposite to the heating unit with the sample interposed therebetween.
- the orientation identification device according to claim 1, wherein a delay in response is detected.
- the sample includes a reinforcing material formed in a fiber shape and a base material that supports the reinforcing material, and the output unit is information indicating a direction of the reinforcing material in the sample.
- the output unit outputs information on the thermal diffusivity of the sample together with information indicating the orientation of the sample, based on a delay in response detected by the detection unit.
- the orientation identification device according to any one of claims 1 to 3, wherein the orientation identification device is characterized.
- the invention according to claim 5 is characterized in that the output unit displays the orientation direction of the sample in polar coordinates based on a response delay detected by the detection unit. 1.
- the invention according to claim 6 further includes a moving mechanism for moving the heating unit, the detection unit, and the sample relative to each other, and the heating unit sequentially spots each portion of the sample divided into a plurality of portions.
- the detection unit sequentially detects the temperature distribution of the portions that are sequentially spot-cycle heated by the heating unit, and the output unit outputs information indicating the orientation of each part of the sample
- the orientation identification device according to any one of claims 1 to 5, wherein The invention according to claim 7 is characterized in that the heating unit includes a plurality of light irradiation units arranged in a row such that each irradiation position is a center position of each measurement region, and the detection unit includes It consists of a plurality of temperature detectors that detect the temperature distribution of the region to be measured.
- the orientation identification device according to any one of claims 1 to 6, further comprising a moving mechanism for relative movement.
- an orientation identification method comprising: detecting a response delay; and outputting information indicating the orientation of at least one material constituting the sample based on the detected response delay.
- a ninth aspect of the present invention in a region including a heating unit that periodically irradiates light to a sample composed of a plurality of materials and heats the sample, and a portion heated by the heating unit of the sample Based on a response delay detected by the detection unit and a response delay detected by the temperature distribution change, information indicating a distribution of at least one material constituting the material in the sample is output. And a distribution identification device including an output unit.
- the first aspect of the present invention it is possible to provide an orientation identification device that can quickly identify the orientation of a sample in a non-contact manner.
- the precision which identifies the orientation of a sample can be improved.
- the direction of the reinforcing material can be identified.
- the thermal characteristics of the sample can be grasped together with the orientation of the sample.
- the orientation of a sample can be grasped
- the orientation of a wider region in the sample can be identified.
- the orientation of a wider region in the sample can be identified in a short time.
- an orientation identification method capable of quickly identifying the orientation of a sample in a non-contact manner.
- the distribution identification method which can identify the distribution of a sample non-contactingly and rapidly can be provided.
- FIG. 1 It is a schematic block diagram which shows the orientation identification apparatus based on this Embodiment. It is a functional block diagram of a computer.
- (A) And (b) is explanatory drawing which shows the measurement principle of in-plane thermal diffusivity.
- (A) And (b) is explanatory drawing which shows the measurement principle of thickness direction thermal diffusivity.
- (A) shows the direction of thermal diffusion in the measurement sample, and
- (b) is a diagram showing the relationship between the angle of thermal diffusion, the thermal diffusivity, and the fiber orientation density. It is a flowchart explaining operation
- (A) And (b) is a figure which shows the measurement result 1 obtained by the orientation identification apparatus.
- (A) And (b) is a figure which shows the measurement result 2 obtained by the orientation identification apparatus.
- (A) And (b) is a figure which shows the measurement result 2 obtained by the orientation identification apparatus.
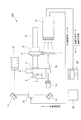
- FIG. 1 is a schematic configuration diagram showing an orientation identification apparatus 100 according to the present embodiment.
- an orientation identification apparatus 100 to which this embodiment is applied includes a holder 2 that supports a measurement sample 1 formed in a plate shape, a light-emitting diode 3 that outputs reference light, and a measurement sample 1.
- CCD image pickup device 4 for picking up one surface (front surface), rail 5 extending in one direction, first XYZ stage 6 provided on rail 5 for supporting holder 2, light emitting diode 3 provided on rail 5 and And a second XYZ stage 7 that supports the CCD image pickup device 4.
- the orientation identification device 100 includes a diode laser 10 that functions as a heating light source (an example of a heating unit), a first mirror 11 that reflects the laser light emitted from the diode laser 10, and the laser light as a periodic signal.
- the acousto-optic element 12 to be converted (pulsed) the second mirror 14 that reflects the laser beam from the acousto-optic element 12, the beam expander 15 that enlarges the beam diameter of the laser beam from the second mirror 14, and the measurement And a microscope 16 that adjusts (squeezes) the beam diameter of the laser light applied to the surface of the sample 1.
- the orientation identification apparatus 100 includes an infrared thermography (an example of a lock-in thermography, an example of a detection unit) 17 provided on the opposite side of the microscope 16 across the measurement sample 1 and a computer that receives a signal from the infrared thermography 17 ( An example of an output unit) 20, and a periodic signal generator 30 that generates a periodic signal and outputs the periodic signal to the acoustooptic device 12 and the infrared thermography 17.
- an infrared thermography an example of a lock-in thermography, an example of a detection unit
- a computer that receives a signal from the infrared thermography 17 ( An example of an output unit) 20, and a periodic signal generator 30 that generates a periodic signal and outputs the periodic signal to the acoustooptic device 12 and the infrared thermography 17.
- the laser light emitted from the diode laser 10 is converted into a periodic signal by the acoustooptic device 12, passed through the beam expander 15 and the microscope 16, and then measured.
- the sample 1 is irradiated.
- a portion (region) irradiated with laser light is periodically heated. That is, a specific point (position) on the surface of the measurement sample 1 is spot-periodically heated.
- the temperature of the measurement sample 1 heated by the laser beam of the diode laser 10 is measured by the infrared thermography 17 from the back side of the measurement sample 1.
- the infrared thermography 17 captures (measures) a predetermined range (area) including an area that is spot-periodically heated by the diode laser 10 as an infrared image. More specifically, for example, the size (diameter) of the region (substantially circular) to be heated by the spot period is 0.1 ⁇ m to 1 mm, whereas the size (substantially rectangular) of the region imaged by the infrared thermography 17 (substantially rectangular) One side) is 10 mm to 100 mm.
- a periodic signal is input from the periodic signal generator 30 to the infrared thermography 17. Further, temperature data (temperature distribution data) measured by the infrared thermography 17 is output to the computer 20 together with a periodic signal.
- the computer 20 continuously executes infrared image capturing and calculation based on a frame rate of a predetermined interval (fixed interval) arbitrarily set, and changes in temperature that change over time. Create an averaged image from the amount (lock-in method). More specifically, the data obtained by the infrared thermography 17 is processed by the computer 20, and the direction (angle), thermal diffusivity, and orientation from the heating region Hp (see FIG. 5A described later) are determined. Calculated.
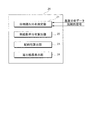
- FIG. 2 is a functional configuration diagram of the computer 20.
- the computer 20 to which the present embodiment is applied has a phase lag distribution that measures a phase lag distribution based on temperature distribution data and a periodic signal input from the infrared thermography 17 (see FIG. 1).
- Measurement unit 21 thermal diffusivity distribution calculation unit 22 that calculates thermal diffusivity distribution based on the measured phase delay, and orientation of measurement sample 1 (see FIG. 1) based on the calculated thermal diffusivity distribution
- An orientation calculation unit 23 that calculates (described later) and a calculation result display unit 24 that displays the calculation results of the thermal diffusivity distribution and the orientation are provided.
- the computer 20 includes a CPU that performs arithmetic processing, a ROM that stores programs executed by the CPU and various data, a RAM that is used as a working memory of the CPU, and an EEPROM. (Electrically Erasable & Programmable Read Only Memory). And each said function structure is performed by these structural members with which the computer 20 is provided.
- the computer 20 of the present embodiment identifies (specifies) the orientation of the measurement sample 1 based on the change in temperature distribution of the measurement sample 1 (see FIG. 1) detected by the infrared thermography 17. More specifically, the computer 20 specifies the orientation of the measurement sample 1 based on the response delay of the change in the temperature distribution of the measurement sample 1. In addition, here, the thermal characteristics of the measurement sample 1 are assumed as the orientation of the measurement sample 1.
- the measurement sample 1 in the illustrated example is a carbon-based composite material, more specifically, a carbon fiber reinforced resin (Carbon Fiber Reinforced Plastics (CFRP), carbon fiber reinforced plastic). More specifically, the measurement sample 1 is composed of a pitch-based carbon fiber reinforced resin in which a so-called pitch-based carbon fiber (reinforced material) manufactured from pitch is impregnated with a resin (base material) such as an epoxy resin.
- CFRP Carbon Fiber Reinforced Plastics
- the pitch-based carbon fiber has higher thermal conductivity than the resin impregnated in the pitch-based carbon fiber.
- the pitch-based carbon fiber is greatly different in thermal conductivity (thermal diffusivity) from a resin having relatively low thermal conductivity.
- the pitch-based carbon fiber reinforced resin is merely an example, and it is sufficient that there is a difference in the thermal conductivity (thermal diffusivity) between the carbon fiber and the resin.
- Carbon fiber reinforced resin may be used.
- the carbon fiber reinforced resin in the illustrated example is a so-called discontinuous fiber composite material.
- the length of the pitch-based carbon fiber is, for example, about 0.1 mm to 10 mm, and more specifically, about 1 mm to 5 mm.
- the discontinuous fiber composite material is merely an example, and may be a continuous fiber composite material.
- the measurement sample 1 may be a carbon fiber reinforced resin in which continuous fiber prepregs are laminated.
- the orientation of the measurement sample 1 is an index indicating the orientation distribution of the fibers (carbon fibers) contained in the measurement sample 1 that is an anisotropic material. In the present embodiment, this is indicated by the orientation angle (orientation direction) and the dispersion of orientation angles (variation in orientation angle). Further, the orientation angle is an angle indicating a direction in which the fibers are easily oriented in the measurement sample 1. In other words, the orientation angle is the preferential orientation degree of the fiber.
- FIGS. 3A and 3B are explanatory views showing the measurement principle of the in-plane thermal diffusivity.
- the surface of the measurement sample 1 is irradiated with heating light (laser light) having a constant frequency, and measurement is performed by the infrared thermography 17 from the back side of the measurement sample 1.
- heating light laser light
- the distance dependence of the phase delay is detected.
- T0 Constant (Km) f ... Heating frequency (Hz) t ... time (s) r ... Distance (m)
- phase difference ⁇ between the point heat source and the AC temperature Tac is expressed by the following equation (2).
- the in-plane thermal diffusivity D of the measurement sample 1 is expressed by the following equation (3).
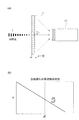
- 4A and 4B are explanatory views showing the measurement principle of the thickness direction thermal diffusivity.
- the measurement is performed while changing the frequency of the heating light applied to the measurement sample 1 having a constant thickness d. In other words, the frequency dependence of the phase delay is detected here.
- the thermal diffusivity D in the thickness direction of the measurement sample 1 is expressed by the following formula (4).
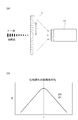
- FIGS. 5 (a) and 5 (b) show the measurement principle of the orientation distribution of the measurement sample 1
- FIG. 5B shows the relationship between the thermal diffusion angle, the thermal diffusivity, and the fiber orientation density.
- region Hp changes. That is, heat from the heating region Hp is easily transmitted in a direction along the direction of the carbon fiber included in the measurement sample 1, and heat from the heating region Hp is difficult to be transmitted in a direction crossing the direction of the carbon fiber.
- the speed of thermal diffusion varies depending on the angle around the heating region Hp in the measurement sample 1. In other words, the thermal diffusivity changes according to the angle around the heating region Hp in the measurement sample 1.
- the thermal diffusivity changes according to the angle. It was confirmed.
- the average and dispersion of the fiber orientation distribution are calculated based on the obtained thermal diffusivity angle distribution. More specifically, the average and dispersion of the fiber orientation distribution are calculated by the fiber orientation distribution density function obtained based on the obtained thermal diffusivity angle distribution.
- the fiber orientation distribution density function is obtained, for example, by dividing a thermal diffusivity angle distribution including a plurality of peaks into respective peak sections and fitting each peak using a least square method.
- the fiber orientation distribution density function is expressed by the following equation (5).
- the fiber orientation direction ⁇ 0 is obtained by the following equation (7). Note that the section including the peak in Expression (7) corresponds to the division angle.
- dispersion ⁇ 2 is also referred to as orientation strength (Degree of fiber orientation) because it represents the degree of concentration in the orientation direction.
- FIG. 6 is a flowchart for explaining the operation of the orientation identification apparatus 100 (see FIG. 1).
- the surface of the measurement sample 1 is spot-periodically heated by laser light emitted from the diode laser 10 in the orientation identification apparatus 100 (step 601).
- the phase lag distribution measuring unit 21 measures the phase lag distribution based on the temperature distribution measured by the infrared thermography 17 (step 602).
- the thermal diffusivity distribution calculator 22 calculates the thermal diffusivity angle distribution (step 603).
- the orientation calculation unit 23 calculates the orientation direction and dispersion (step 604).
- the calculation result display unit 24 displays the calculation result of the orientation direction and dispersion on the display means (not shown) (step 605).
- FIGS. 7A and 7B are diagrams showing the measurement result 1 obtained by the orientation identification apparatus 100.
- FIG. 7A is a diagram showing the direction (angle) of thermal diffusion in the measurement sample 101
- FIG. 7B shows the relationship between the direction of thermal diffusion and the fiber orientation distribution density function.
- FIG. 7A a description will be given of a result of using CFRP of a pitch-type unidirectional material as the measurement sample 101.
- the fiber direction in the measurement sample 101 is the vertical direction in the figure.
- the frequency distribution of the fiber orientation distribution density function (and the measured value of thermal diffusivity) is obtained when the angle around the heating region Hp in the measurement sample 101 is around 90 ° and ⁇ 90 °. Maximum. When the angle deviates from 90 ° and ⁇ 90 °, the frequency distribution of the fiber orientation distribution density function rapidly decreases. Thus, it is estimated that the measurement sample 101 has carbon fiber orientation angles of around 90 ° and ⁇ 90 °.
- the orientation angles are 90.6 ° and -89.9 °, and the standard deviation ⁇ is 0.057 and 0.056, respectively. Results were obtained.
- the average value ⁇ of the distribution was 0.500 and 0.497, respectively.
- the thermal diffusivity and the fiber orientation distribution density function were calculated. More specifically, the thermal diffusivity and the fiber orientation distribution density function were calculated without the need for comparative measurement with samples having known thermal diffusivity and fiber orientation distribution density function, that is, data learning. In the present embodiment, the thermal diffusivity and the fiber orientation distribution density function can be calculated in a shorter time than when the measurement sample 101 is rotated or when data learning is required.
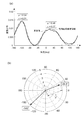
- FIGS. 8A and 8B, and FIGS. 9A and 9B are diagrams showing a measurement result 2 obtained by the orientation identification apparatus 100. More specifically, FIG. 8A is a diagram showing the measurement region in the measurement sample 103, and FIG. 8B is a diagram showing the relationship between the thermal diffusion angle and the thermal diffusivity. 9A is a diagram showing the relationship between the thermal diffusion angle and the fiber orientation density in the lower left region shown in FIG. 8A, and FIG. 9B is obtained from FIG. 9A. It is the figure which displayed the orientation direction and intensity
- a measurement sample 103 a result of using LFT-D (Long Fiber Thermoplastics-Direct) formed in a square shape with a side of 390 mm and a thickness of about 1.4 mm is used. Will be explained.
- LFT-D Long Fiber Thermoplastics-Direct
- measurement was performed at a plurality of locations (9 locations) in the measurement sample 103.
- the measurement sample 103 is divided into a total of nine regions (parts), upper left, middle upper, upper right, left middle, center, right middle, lower left, middle lower, and lower right, and measurement is performed for each region. went. Note that one side of each region is 130 mm. In addition, an area of 44 ⁇ 37 mm at the center of each area was measured by the infrared thermography 17. Further, the measurement sample 103 in the illustrated example is formed with the direction from the lower side to the upper side in the drawing as the extrusion direction.
- the measurement for each region can be performed by cutting the measurement sample 103 into a plurality of pieces, but each region is sequentially measured by moving the relative position between the apparatus and the measurement sample and scanning the measurement position. You can also. Further, as a method of scanning the measurement position, a method of moving the microscope 16 and the infrared thermography 17 and the measurement sample 103 relative to each other by, for example, the second XYZ stage 7 (an example of a moving mechanism) in FIG. it can.
- a plurality of pairs of the microscopes 16 and the infrared thermography 17 are arranged in a line so that each measurement position is a center position of the measurement target area, and the arrangement direction and For example, a method of relatively moving the plurality of pairs of the microscopes 16, the infrared thermography 17, and the measurement sample 103 in the intersecting direction (vertical direction) can be employed.
- each microscope 16 is an example of a light irradiation unit
- a group of the microscopes 16 including a plurality of microscopes 16 is an example of a heating unit
- each infrared thermography 17 is an example of a temperature detection unit
- a group of infrared thermography 17 including a plurality of infrared thermographys 17 is an example of a detection unit.
- thermography 17 may be arranged in a plurality of rows and the measurement may be performed without moving the relative position.
- the in-plane thermal diffusivity in the measurement region of each piece is different. That is, the angular distribution of the in-plane thermal diffusivity changes according to the position in the measurement sample 103. For example, it is confirmed that the orientation is relatively large in the upper left, middle upper, upper right, lower left, and lower right, and the orientation is relatively small in the left middle, center, right middle, and middle lower.
- the orientation identification device 100 can also function as a distribution identification device that identifies the distribution of carbon fibers.
- the orientation identification apparatus 100 may be used as an apparatus for identifying the dimensions of carbon fibers such as the fiber diameter (for example, average fiber diameter) and fiber length (for example, average fiber length, lateral length ratio) in addition to the distribution of carbon fibers. Can function.
- the frequency distribution of the fiber orientation distribution density function is maximum around 30 ° and ⁇ 140 °. Accordingly, it is estimated that the measurement sample 103 has carbon fiber orientation angles of around 30 ° and ⁇ 140 °.
- the standard deviation ⁇ was 0.27 and 0.21.
- the average value ⁇ of the distribution was 0.48 and 0.54, respectively.
- the calculation results of the orientation angle were 28.3 ° and ⁇ 140 °.
- the orientation strength of the measurement sample 103 is displayed by vector display (polar coordinate display) along with the orientation angle, with the reciprocal (1 / ⁇ ) of the standard deviation ⁇ as the length. Can be grasped visually.
- the calculation result display unit 24 displays (outputs) the calculation result of the orientation direction and dispersion on the display means (not shown), but the present invention is not limited to this.
- the orientation direction and the calculation result of the dispersion may be transmitted to another device or stored.
- distribution may be sufficient.
- distribution may be sufficient.
- the display as the orientation angle has been described.
- the information indicating the orientation is not limited to this. For example, even if the orientation angle is not directly indicated, the obtained orientation angle is compared with a threshold value, and when the threshold value is exceeded, information indicating that the orientation angle exceeds the threshold value may be output. Good. Moreover, you may output the information which shows thermal diffusivity distribution by a graph etc., for example.
- the present invention is not limited to this.
- the aspect which performs the heating of the measurement sample 1 by the diode laser 10, and the measurement of the measurement sample 1 by the infrared thermography 17 on the same surface may be sufficient.
- the heating by the diode laser 10 and the measurement by the infrared thermography 17 are measured on different surfaces as in the above embodiment, the influence of the heat reflection is suppressed as compared with the case of measuring on the same surface. Can do.
- the carbon fiber reinforced resin is used as the measurement samples 1, 101, 103.
- the present invention is not limited to this. That is, any sample may be used as long as it is made of a plurality of types of materials having different thermal conductivities.
- carbon fibers are used as the reinforcing material.
- the carbon fibers may be long in one direction, and may be long, rectangular, cylindrical, polygonal, elliptical spherical, etc. There may be.
- the shape of the reinforcing material may be a shape other than a shape that is long in one direction. For example, other shapes such as a particle shape, a spherical shape, and a pellet shape may be used.
Landscapes
- Physics & Mathematics (AREA)
- General Physics & Mathematics (AREA)
- Health & Medical Sciences (AREA)
- Life Sciences & Earth Sciences (AREA)
- Chemical & Material Sciences (AREA)
- Analytical Chemistry (AREA)
- Biochemistry (AREA)
- General Health & Medical Sciences (AREA)
- Immunology (AREA)
- Pathology (AREA)
- Investigating Or Analyzing Materials Using Thermal Means (AREA)
Abstract
本発明の配向同定装置は、炭素繊維強化樹脂により構成される試料に対して光を周期的に照射し試料を加熱するダイオードレーザと、試料のダイオードレーザによって加熱された箇所を含む領域における温度分布の変化の応答の遅れを検知する赤外線サーモグラフィと、赤外線サーモグラフィによって検知された応答の遅れに基づいて、試料の配向性を示す情報を出力するコンピュータとを備えることにより、試料の配向性を非接触でかつ迅速に同定可能な配向同定装置などを提供する。
Description
本発明は、配向同定装置、配向同定方法および分布同定装置に関する。
航空機器、電子機器などの先端機器においては、高熱伝導、異方性、高比剛性の素材として、炭素繊維強化複合材が広く採用されている。このような炭素繊維強化複合材においては、炭素繊維の配向により生じる異方性により、力学的特性(強度、剛性など)や熱的特性(熱拡散率、熱伝導率など)に大きな差異が生じるため、異方性の同定(測定)が重要である。
このような繊維配向同定方法としては、例えばX線CT法や引張試験などが使用されている。
例えば、特許文献1には、X線CT法により取得された樹脂成形品のスライス画像を二値化し、この二値化画像に対してフーリエ変換を施すことで得られるパワースペクトル画像を用いて、樹脂成形品内の一部における充填材の配向状態の傾向を解析することが開示されている。
例えば、特許文献1には、X線CT法により取得された樹脂成形品のスライス画像を二値化し、この二値化画像に対してフーリエ変換を施すことで得られるパワースペクトル画像を用いて、樹脂成形品内の一部における充填材の配向状態の傾向を解析することが開示されている。
上述のように、炭素繊維強化複合材の配向同定方法として、X線CT法および引張試験を採用した場合、測定試料を切り出し加工するなど、測定試料に接触することが必要であった。また、上記のX線CT法および引張試験を、例えば炭素繊維強化複合材の製造工程における配向同定方法として採用した場合、測定評価に長い時間が必要となることや装置が大がかりとなることがあった。付言すると、上記のX線CT法および引張試験は、インラインでの測定に用いることが困難であった。
本発明は、上記課題を解決するためになされたものであり、試料の配向性を非接触でかつ迅速に同定可能な配向同定装置などを提供することを目的とする。
上記目的を達成するため、上記課題を解決する手段として、以下に記載の発明が挙げられる。すなわち、請求項1記載の発明は、複数の材料により構成される試料に対して光を周期的に照射し当該試料を加熱する加熱部と、前記試料の前記加熱部によって加熱された箇所を含む領域における温度分布の変化の応答の遅れを検知する検知部と、前記検知部によって検知された応答の遅れに基づいて、前記試料を構成する少なくとも1種の材料の配向性を示す情報を出力する出力部とを備える配向同定装置である。
請求項2記載の発明は、前記加熱部は、前記試料の一方側から当該試料を加熱し、前記検知部は、前記試料を挟んで前記加熱部とは反対側から前記領域における温度分布の変化の応答の遅れを検知することを特徴とする請求項1記載の配向同定装置である。
請求項3記載の発明は、前記試料は、繊維状に形成された強化材と、当該強化材を支持する母材とを含み、前記出力部は、前記試料における前記強化材の向きを示す情報を出力することを特徴とする請求項1または2記載の配向同定装置である。
請求項4記載の発明は、前記出力部は、前記検知部によって検知された応答の遅れに基づいて、前記試料の配向性を示す情報とともに、前記試料の熱拡散率に関する情報を出力することを特徴とする請求項1乃至3のいずれか1項記載の配向同定装置である。
請求項5記載の発明は、前記出力部は、前記検知部によって検知された応答の遅れに基づいて、前記試料の配向方向を極座標により表示することを特徴とする請求項1乃至4のいずれか1項記載の配向同定装置である。
請求項6記載の発明は、前記加熱部および前記検知部と前記試料とを相対移動させる移動機構をさらに備え、前記加熱部は、前記試料を複数の部分に分けたうちの各部分を順次スポット周期加熱し、前記検知部は、前記加熱部により順次スポット周期加熱された前記各部分の温度分布を順次検知し、前記出力部は、前記試料の前記部分毎の配向性を示す情報を出力することを特徴とする請求項1乃至5のいずれか1項記載の配向同定装置である。
請求項7記載の発明は、前記加熱部は、各々の照射位置が各被測定領域の中心位置となるように一列に並べて配置された複数の光照射部を含み、前記検知部は、前記各被測定領域の温度分布を検知する複数の温度検知部からなり、前記複数の光照射部の配列方向と交差する方向に、当該複数の光照射部および前記複数の温度検知部と前記試料とを相対移動させる移動機構をさらに備えることを特徴とする請求項1乃至6のいずれか1項記載の配向同定装置である。
請求項8記載の発明は、複数の材料により構成される試料に対して光を周期的に照射し当該試料を加熱するステップと、前記試料の加熱された箇所を含む領域における温度分布の変化の応答の遅れを検知するステップと、検知された応答の遅れに基づいて、前記試料を構成する少なくとも1種の材料の配向性を示す情報を出力するステップとを備える配向同定方法である。
請求項9記載の発明は、複数の材料により構成される試料に対して光を周期的に照射し当該試料を加熱する加熱部と、前記試料の前記加熱部によって加熱された箇所を含む領域における温度分布の変化の応答の遅れを検知する検知部と、前記検知部によって検知された応答の遅れに基づいて、前記試料における前記材料を構成する少なくとも1種の材料の分布を示す情報を出力する出力部とを備える分布同定装置である。
請求項2記載の発明は、前記加熱部は、前記試料の一方側から当該試料を加熱し、前記検知部は、前記試料を挟んで前記加熱部とは反対側から前記領域における温度分布の変化の応答の遅れを検知することを特徴とする請求項1記載の配向同定装置である。
請求項3記載の発明は、前記試料は、繊維状に形成された強化材と、当該強化材を支持する母材とを含み、前記出力部は、前記試料における前記強化材の向きを示す情報を出力することを特徴とする請求項1または2記載の配向同定装置である。
請求項4記載の発明は、前記出力部は、前記検知部によって検知された応答の遅れに基づいて、前記試料の配向性を示す情報とともに、前記試料の熱拡散率に関する情報を出力することを特徴とする請求項1乃至3のいずれか1項記載の配向同定装置である。
請求項5記載の発明は、前記出力部は、前記検知部によって検知された応答の遅れに基づいて、前記試料の配向方向を極座標により表示することを特徴とする請求項1乃至4のいずれか1項記載の配向同定装置である。
請求項6記載の発明は、前記加熱部および前記検知部と前記試料とを相対移動させる移動機構をさらに備え、前記加熱部は、前記試料を複数の部分に分けたうちの各部分を順次スポット周期加熱し、前記検知部は、前記加熱部により順次スポット周期加熱された前記各部分の温度分布を順次検知し、前記出力部は、前記試料の前記部分毎の配向性を示す情報を出力することを特徴とする請求項1乃至5のいずれか1項記載の配向同定装置である。
請求項7記載の発明は、前記加熱部は、各々の照射位置が各被測定領域の中心位置となるように一列に並べて配置された複数の光照射部を含み、前記検知部は、前記各被測定領域の温度分布を検知する複数の温度検知部からなり、前記複数の光照射部の配列方向と交差する方向に、当該複数の光照射部および前記複数の温度検知部と前記試料とを相対移動させる移動機構をさらに備えることを特徴とする請求項1乃至6のいずれか1項記載の配向同定装置である。
請求項8記載の発明は、複数の材料により構成される試料に対して光を周期的に照射し当該試料を加熱するステップと、前記試料の加熱された箇所を含む領域における温度分布の変化の応答の遅れを検知するステップと、検知された応答の遅れに基づいて、前記試料を構成する少なくとも1種の材料の配向性を示す情報を出力するステップとを備える配向同定方法である。
請求項9記載の発明は、複数の材料により構成される試料に対して光を周期的に照射し当該試料を加熱する加熱部と、前記試料の前記加熱部によって加熱された箇所を含む領域における温度分布の変化の応答の遅れを検知する検知部と、前記検知部によって検知された応答の遅れに基づいて、前記試料における前記材料を構成する少なくとも1種の材料の分布を示す情報を出力する出力部とを備える分布同定装置である。
請求項1記載の発明によれば、試料の配向性を非接触でかつ迅速に同定可能な配向同定装置を提供することができる。
請求項2記載の発明によれば、試料の配向性を同定する精度を向上させることができる。
請求項3記載の発明によれば、強化材の向きを同定することができる。
請求項4記載の発明によれば、試料の配向性とともに試料の熱的特性を把握することができる。
請求項5記載の発明によれば、試料の配向性を視覚的に把握することができる。
請求項6記載の発明によれば、試料におけるより広い領域の配向性を同定することができる。
請求項7記載の発明によれば、試料におけるより広い領域の配向性を短時間で同定することができる。
請求項8記載の発明によれば、試料の配向性を非接触でかつ迅速に同定可能な配向同定方法を提供することができる。
請求項9記載の発明によれば、試料の分布を非接触でかつ迅速に同定可能な分布同定方法を提供することができる。
請求項2記載の発明によれば、試料の配向性を同定する精度を向上させることができる。
請求項3記載の発明によれば、強化材の向きを同定することができる。
請求項4記載の発明によれば、試料の配向性とともに試料の熱的特性を把握することができる。
請求項5記載の発明によれば、試料の配向性を視覚的に把握することができる。
請求項6記載の発明によれば、試料におけるより広い領域の配向性を同定することができる。
請求項7記載の発明によれば、試料におけるより広い領域の配向性を短時間で同定することができる。
請求項8記載の発明によれば、試料の配向性を非接触でかつ迅速に同定可能な配向同定方法を提供することができる。
請求項9記載の発明によれば、試料の分布を非接触でかつ迅速に同定可能な分布同定方法を提供することができる。
以下、添付図面を参照して、本実施の形態について詳細に説明する。
<配向同定装置100の構成>
まず、図1を参照して、本実施の形態が適用される配向同定装置100の構成を説明する。ここで、図1は、本実施の形態に係る配向同定装置100を示す概略構成図である。
図1に示すように、本実施の形態が適用される配向同定装置100は、板状に形成された測定試料1を支持するホルダ2と、参照光を出力する発光ダイオード3と、測定試料1の一方の面(表面)を撮像するCCD撮像素子4と、一方向に延びるレール5と、このレール5に設けられホルダ2を支持する第1XYZステージ6と、レール5に設けられ発光ダイオード3およびCCD撮像素子4を支持する第2XYZステージ7とを備える。
<配向同定装置100の構成>
まず、図1を参照して、本実施の形態が適用される配向同定装置100の構成を説明する。ここで、図1は、本実施の形態に係る配向同定装置100を示す概略構成図である。
図1に示すように、本実施の形態が適用される配向同定装置100は、板状に形成された測定試料1を支持するホルダ2と、参照光を出力する発光ダイオード3と、測定試料1の一方の面(表面)を撮像するCCD撮像素子4と、一方向に延びるレール5と、このレール5に設けられホルダ2を支持する第1XYZステージ6と、レール5に設けられ発光ダイオード3およびCCD撮像素子4を支持する第2XYZステージ7とを備える。
また、配向同定装置100は、加熱用光源(加熱部の一例)として機能するダイオードレーザ10と、ダイオードレーザ10から出射されたレーザ光を反射する第1ミラー11と、レーザ光を周期的信号に変換(パルス化)する音響光学素子12と、音響光学素子12からのレーザ光を反射する第2ミラー14と、第2ミラー14からのレーザ光のビーム径を拡大するビームエキスパンダ15と、測定試料1の表面に照射されるレーザ光のビーム径を調整する(絞る)マイクロスコープ16とを備える。
また、配向同定装置100は、測定試料1を挟んでマイクロスコープ16とは反対側に設けられた赤外線サーモグラフィ(ロックインサーモグラフィ、検知部の一例)17と、赤外線サーモグラフィ17からの信号を受けるコンピュータ(出力部の一例)20と、周期的信号を発生させ音響光学素子12および赤外線サーモグラフィ17へと出力する周期的信号発生器30とを備える。
このように構成された配向同定装置100においては、ダイオードレーザ10から出射されたレーザ光が、音響光学素子12にて周期的信号に変換され、ビームエキスパンダ15およびマイクロスコープ16を経た後に、測定試料1へと照射される。この測定試料1においては、レーザ光が照射される箇所(領域)が周期的に加熱される。すなわち、測定試料1の表面における特定の点(位置)が、スポット周期加熱される。
また、ダイオードレーザ10のレーザ光により加熱された測定試料1の温度は、測定試料1の裏面側から赤外線サーモグラフィ17によって測定される。なお、赤外線サーモグラフィ17は、ダイオードレーザ10によりスポット周期加熱される領域を含む予め定めた範囲(領域)を、赤外線画像として撮像(測定)する。さらに説明をすると、例えば、スポット周期加熱される領域(略円形)の寸法(直径)が0.1μm~1mmであるのに対して、赤外線サーモグラフィ17により撮像される領域(略長方形)の寸法(一辺)は10mm~100mmである。
この赤外線サーモグラフィ17には、周期的信号発生器30より周期的信号が入力される。また、赤外線サーモグラフィ17で測定された温度のデータ(温度分布データ)は、周期的信号とともにコンピュータ20へと出力される。
この赤外線サーモグラフィ17には、周期的信号発生器30より周期的信号が入力される。また、赤外線サーモグラフィ17で測定された温度のデータ(温度分布データ)は、周期的信号とともにコンピュータ20へと出力される。
コンピュータ20は、赤外線サーモグラフィ17とあわせて、任意に設定した所定間隔(一定間隔)のフレームレートに基づいて、赤外線画像の取り込みと演算とを連続的に実行し、時間の経過とともに変化する温度変化量から平均化した画像を作成する(ロックイン方式)。さらに説明をすると、赤外線サーモグラフィ17で得られたデータは、コンピュータ20により演算処理され、加熱領域Hp(後述する図5(a)参照)からの方向(角度)、熱拡散率、および配向性が算出される。
<コンピュータ20の機能構成>
次に、図2を参照して、本実施の形態が適用されるコンピュータ20の機能構成を説明する。ここで、図2は、コンピュータ20の機能構成図である。
図2に示すように、本実施の形態が適用されるコンピュータ20は、赤外線サーモグラフィ17(図1参照)から入力される温度分布データおよび周期的信号に基づいて位相遅れ分布を測定する位相遅れ分布測定部21と、測定された位相遅れに基づいて熱拡散率分布を算出する熱拡散率分布算出部22と、算出された熱拡散率分布に基づいて測定試料1(図1参照)の配向性(後述)を算出する配向性算出部23と、熱拡散率分布および配向性の算出結果を表示する算出結果表示部24とを備える。
次に、図2を参照して、本実施の形態が適用されるコンピュータ20の機能構成を説明する。ここで、図2は、コンピュータ20の機能構成図である。
図2に示すように、本実施の形態が適用されるコンピュータ20は、赤外線サーモグラフィ17(図1参照)から入力される温度分布データおよび周期的信号に基づいて位相遅れ分布を測定する位相遅れ分布測定部21と、測定された位相遅れに基づいて熱拡散率分布を算出する熱拡散率分布算出部22と、算出された熱拡散率分布に基づいて測定試料1(図1参照)の配向性(後述)を算出する配向性算出部23と、熱拡散率分布および配向性の算出結果を表示する算出結果表示部24とを備える。
なお、図示は省略するが、コンピュータ20は、演算処理を行うCPUと、CPUにて実行されるプログラムや各種データ等が記憶されたROMと、CPUの作業用メモリ等として用いられるRAMと、EEPROM(Electrically Erasable & Programmable Read Only Memory)と、を備えている。そして、コンピュータ20が備えるこれらの構成部材により、上記各機能構成が実行される。
さて、本実施の形態のコンピュータ20は、赤外線サーモグラフィ17により検出された測定試料1(図1参照)の温度分布の変化に基づいて、測定試料1の配向性を同定(特定)する。さらに説明をすると、コンピュータ20は、測定試料1の温度分布の変化の応答の遅れに基づいて、測定試料1の配向性を特定する。付言すると、ここでは、測定試料1の熱的特性を、測定試料1の配向性として擬制する。
図示の例における測定試料1は、炭素系複合材料、より具体的には、炭素繊維強化樹脂(Carbon Fiber Reinforced Plastics(CFRP)、炭素繊維強化プラスチック)である。さらに説明をすると、測定試料1は、ピッチから製造される所謂ピッチ系炭素繊維(強化材)にエポキシ樹脂等の樹脂(母材)を含浸させた、ピッチ系炭素繊維強化樹脂により構成される。
なお、ピッチ系炭素繊維は、このピッチ系炭素繊維に含浸される樹脂と比較して、高熱伝導性である。付言すると、ピッチ系炭素繊維は、相対的に低熱伝導性の樹脂とは、熱伝導率(熱拡散率)が大きく異なる。ここで、ピッチ系炭素繊維強化樹脂は単なる例示であり、炭素繊維および樹脂の熱伝導率(熱拡散率)に差があればよく、例えば熱拡散率が相対的に低いポリアクリロニトリル(PAN)系の炭素繊維強化樹脂を用いてもよい。
また、図示の例における炭素繊維強化樹脂は、所謂不連続繊維複合材料であり、例えばピッチ系炭素繊維の長さは、例えば0.1mm~10mm程度、より詳細には、1mm~5mm程度である。ここで、不連続繊維複合材料は、単なる例示であり、連続繊維複合材料であってもよい。例えば、連続繊維プリプレグを積層した、炭素繊維強化樹脂を測定試料1としてもよい。
また、図示の例における炭素繊維強化樹脂は、所謂不連続繊維複合材料であり、例えばピッチ系炭素繊維の長さは、例えば0.1mm~10mm程度、より詳細には、1mm~5mm程度である。ここで、不連続繊維複合材料は、単なる例示であり、連続繊維複合材料であってもよい。例えば、連続繊維プリプレグを積層した、炭素繊維強化樹脂を測定試料1としてもよい。
また、測定試料1の配向性とは、異方性材料である測定試料1に含まれる繊維(炭素繊維)の配向分布を示す指標である。本実施の形態においては、配向角(配向方向)および配向角の分散(配向角のばらつき)により示される。また、配向角とは、測定試料1において繊維が向きやすい方向を示す角度である。言い替えると、配向角は、繊維の優先配向度である。
<測定原理>
次に、本実施の形態における測定方法の原理を説明する。
まず、図3(a)および(b)を参照しながら、測定試料1の面内熱拡散率の測定原理について説明をする。なお、図3(a)および(b)は、面内熱拡散率の測定原理を示す説明図である。
次に、本実施の形態における測定方法の原理を説明する。
まず、図3(a)および(b)を参照しながら、測定試料1の面内熱拡散率の測定原理について説明をする。なお、図3(a)および(b)は、面内熱拡散率の測定原理を示す説明図である。
ここでは、測定試料1の表面に対して、一定の周波数の加熱光(レーザ光)を照射し、測定試料1の裏面側から赤外線サーモグラフィ17により測定する。付言すると、ここでは、位相遅れの距離依存性を検知する。
さて、加熱光により照射される領域を点熱源とすると、この点熱源から距離r離れた位置での交流温度Tacは、以下に示す式(1)で表わされる。
さて、加熱光により照射される領域を点熱源とすると、この点熱源から距離r離れた位置での交流温度Tacは、以下に示す式(1)で表わされる。

ここに、
T0・・・定数(Km)
f・・・加熱周波数(Hz)
t・・・時間(s)
r・・・距離(m)
T0・・・定数(Km)
f・・・加熱周波数(Hz)
t・・・時間(s)
r・・・距離(m)
また、点熱源と交流温度Tacとの位相差θは、以下に示す式(2)で表わされる。

ここに、
f1・・・加熱周波数(一定)(Hz)
D・・・熱拡散率(mm2/s)
f1・・・加熱周波数(一定)(Hz)
D・・・熱拡散率(mm2/s)
この測定試料1の面内熱拡散率Dは、以下に示す式(3)で表わされる。

次に、図4(a)および(b)を参照しながら、測定試料1の厚み方向熱拡散率の測定原理について説明をする。なお、図4(a)および(b)は、厚み方向熱拡散率の測定原理を示す説明図である。
ここでは、厚みdが一定の測定試料1に照射させる加熱光の周波数を変化させながら測定する。付言すると、ここでは位相遅れの周波数依存性を検知する。
ここでは、厚みdが一定の測定試料1に照射させる加熱光の周波数を変化させながら測定する。付言すると、ここでは位相遅れの周波数依存性を検知する。
この測定試料1の厚み方向の熱拡散率Dは、以下に示す式(4)で表わされる。

ここに、
d・・・測定対象物の厚み(一定)(mm)
d・・・測定対象物の厚み(一定)(mm)
次に、図5(a)および(b)を参照しながら、測定試料1の配向分布の測定原理について説明をする。なお、図5(a)は測定試料1における熱拡散の方向を示し、図5(b)は熱拡散の角度と熱拡散率と繊維配向密度との関係を示す図である。
さて、図5(a)に示すように、測定試料1に含まれる炭素繊維配向に応じて、加熱領域Hpからの熱拡散現象が変化する。すなわち、測定試料1に含まれる炭素繊維の向きに沿う方向においては加熱領域Hpからの熱が伝わりやすく、炭素繊維の向きと交差する向きには加熱領域Hpからの熱が伝わりにくい。このことにより、測定試料1における加熱領域Hpを中心とした角度に応じて、熱拡散の速さに違いが生じる。言い替えると、測定試料1における加熱領域Hpを中心とした角度に応じて、熱拡散率が変化する。
ここで、図5(b)に示すように、測定試料1において、加熱領域Hpから複数方向の熱拡散率の測定を配向同定装置100により行った結果、角度に応じて熱拡散率が変化することが確認された。
また、本実施の形態においては、得られた熱拡散率角度分布に基づいて、繊維配向分布の平均と分散とを算出する。さらに説明をすると、得られた熱拡散率角度分布に基づいて得られる繊維配向分布密度関数(Fiber Orientation Distribution density function)により、繊維配向分布の平均と分散とを算出する。なお、繊維配向分布密度関数は、例えば、複数のピークを含む熱拡散率角度分布を、各々のピーク区間に分割し、各ピークに対して最小二乗法を用いたフィッティングを行うことにより得られる。
また、本実施の形態においては、得られた熱拡散率角度分布に基づいて、繊維配向分布の平均と分散とを算出する。さらに説明をすると、得られた熱拡散率角度分布に基づいて得られる繊維配向分布密度関数(Fiber Orientation Distribution density function)により、繊維配向分布の平均と分散とを算出する。なお、繊維配向分布密度関数は、例えば、複数のピークを含む熱拡散率角度分布を、各々のピーク区間に分割し、各ピークに対して最小二乗法を用いたフィッティングを行うことにより得られる。
ここで、繊維配向分布密度関数は、以下に示す式(5)で表わされる。

ここに、
η・・・オフセット角(rad)
ξ・・・分布サイズを決定するパラメータ(無次元数)
P・・・第1フィッティングパラメータ
Q・・・第2フィッティングパラメータ
η・・・オフセット角(rad)
ξ・・・分布サイズを決定するパラメータ(無次元数)
P・・・第1フィッティングパラメータ
Q・・・第2フィッティングパラメータ
また、η≦θa≦θ≦θb≦180°であり、かつP≧1/2、Q≧1/2、ξ≧2、η≧0である。
そして、PおよびQに基づいて、分布の平均値μと分散σ2(標準偏差σ)が、以下に示す式(6)により求まる。
そして、PおよびQに基づいて、分布の平均値μと分散σ2(標準偏差σ)が、以下に示す式(6)により求まる。

そして、分布の平均値μに基づいて、繊維配向方向θ0が、以下に示す式(7)により求まる。なお、式(7)におけるピークを含む区間とは、分割角度に対応する。

また、分散σ2は、配向方向への集中度を表わすため配向強度(Degree of fiber orientation)とも言い替えられる。
<動作>
次に、図1および図6を参照して、本実施の形態における配向同定装置100の動作を説明する。図6は、配向同定装置100(図1参照)の動作を説明するフローチャートである。
次に、図1および図6を参照して、本実施の形態における配向同定装置100の動作を説明する。図6は、配向同定装置100(図1参照)の動作を説明するフローチャートである。
まず、配向同定装置100におけるダイオードレーザ10から出射されたレーザ光により、測定試料1の表面がスポット周期加熱される(ステップ601)。
そして、赤外線サーモグラフィ17により測定される温度分布により、位相遅れ分布測定部21が位相遅れ分布を測定する(ステップ602)。
そして、この測定された位相遅れ分布に基づき、熱拡散率分布算出部22が熱拡散率角度分布を算出する(ステップ603)。そして、この算出された熱拡散率角度分布に基づき、配向性算出部23が、配向方向および分散を算出する(ステップ604)。そして、算出結果表示部24が、配向方向および分散の算出結果を表示手段(不図示)に表示する(ステップ605)。
そして、赤外線サーモグラフィ17により測定される温度分布により、位相遅れ分布測定部21が位相遅れ分布を測定する(ステップ602)。
そして、この測定された位相遅れ分布に基づき、熱拡散率分布算出部22が熱拡散率角度分布を算出する(ステップ603)。そして、この算出された熱拡散率角度分布に基づき、配向性算出部23が、配向方向および分散を算出する(ステップ604)。そして、算出結果表示部24が、配向方向および分散の算出結果を表示手段(不図示)に表示する(ステップ605)。
<測定結果1>
次に、図7(a)および(b)を参照して、配向同定装置100により得られた測定結果1を説明する。図7(a)および(b)は、配向同定装置100により得られた測定結果1を示す図である。より具体的には、図7(a)は測定試料101における熱拡散の方向(角度)を示す図であり、図7(b)は熱拡散の方向と繊維配向分布密度関数との関係を示す図である。
また、ここでは、図7(a)に示すように、測定試料101として、ピッチ系1方向材のCFRPを用いた結果を説明する。また、この測定試料101における繊維方向は、図中上下方向である。
次に、図7(a)および(b)を参照して、配向同定装置100により得られた測定結果1を説明する。図7(a)および(b)は、配向同定装置100により得られた測定結果1を示す図である。より具体的には、図7(a)は測定試料101における熱拡散の方向(角度)を示す図であり、図7(b)は熱拡散の方向と繊維配向分布密度関数との関係を示す図である。
また、ここでは、図7(a)に示すように、測定試料101として、ピッチ系1方向材のCFRPを用いた結果を説明する。また、この測定試料101における繊維方向は、図中上下方向である。
図7(b)に示すように、測定試料101における加熱領域Hpを中心とした角度が90°および-90°付近で、繊維配向分布密度関数(および熱拡散率の測定値)の度数分布が最大となる。そして、90°および-90°から角度がずれると、急激に繊維配向分布密度関数の度数分布が減少する。このことにより、測定試料101は、炭素繊維の配向角が90°および-90°付近であることが推定される。
さらに説明をすると、図示の例においては、上述の測定原理を用いることにより、配向角は、90.6°および-89.9°となり、標準偏差σは、各々0.057および0.056という結果が得られた。なお、分布の平均値μは、各々0.500および0.497という結果であった。
付言すると、本測定結果1においては、測定試料101を回転させるなど、測定試料1の角度を変更しながら複数回測定することを必要とせずに、加熱領域Hpを中心とした任意の角度について、熱拡散率および繊維配向分布密度関数が算出された。さらに説明をすると、熱拡散率および繊維配向分布密度関数などが既知の試料との比較測定、すなわちデータ学習を必要とせずに熱拡散率および繊維配向分布密度関数が算出された。
なお、本実施の形態においては、測定試料101を回転させる場合や、データ学習を必要とする場合と比較して、熱拡散率および繊維配向分布密度関数がより短時間で算出され得る。
なお、本実施の形態においては、測定試料101を回転させる場合や、データ学習を必要とする場合と比較して、熱拡散率および繊維配向分布密度関数がより短時間で算出され得る。
<測定結果2>
次に、図8(a)および(b)、図9(a)および(b)を参照して、配向同定装置100により得られた測定結果2を説明する。
図8(a)および(b)、図9(a)および(b)は、配向同定装置100により得られた測定結果2を示す図である。より具体的には、図8(a)は測定試料103における測定領域を示す図であり、図8(b)は熱拡散の角度と熱拡散率との関係を示す図である。また、図9(a)は図8(a)に示す左下領域における熱拡散の角度と繊維配向密度との関係を示す図であり、図9(b)は図9(a)により得られた配向方向と強度とをベクトル表示した図である。
次に、図8(a)および(b)、図9(a)および(b)を参照して、配向同定装置100により得られた測定結果2を説明する。
図8(a)および(b)、図9(a)および(b)は、配向同定装置100により得られた測定結果2を示す図である。より具体的には、図8(a)は測定試料103における測定領域を示す図であり、図8(b)は熱拡散の角度と熱拡散率との関係を示す図である。また、図9(a)は図8(a)に示す左下領域における熱拡散の角度と繊維配向密度との関係を示す図であり、図9(b)は図9(a)により得られた配向方向と強度とをベクトル表示した図である。
また、ここでは、測定試料103として、不連続繊維CFRTPを用いた結果を説明する。付言すると、図示の例においては、測定試料103として、一辺が390mmの正方形状で、かつ厚みが約1.4mmの板状に形成されたLFT-D(Long Fiber Thermoplastics-Direct)を用いた結果を説明する。
また、図8(a)に示すように、測定試料103における複数箇所(9箇所)で測定を行った。図示の例では、測定試料103を、左上、中上、右上、左中、中央、右中、左下、中下、右下の計9個の領域(部分)に分割し、各領域について測定を行った。なお、前記各領域の一辺は130mmである。また、前記各領域の中心における44×37mmの領域を、赤外線サーモグラフィ17により測定した。また、図示の例における測定試料103は、図中下側から上側に向かう向きを押し出し方向として形成されている。
なお、領域毎の測定は、測定試料103を複数の片に切断して行うこともできるが、装置と測定試料との相対位置を移動させて測定位置をスキャンさせることにより各領域を順次測定することもできる。
また、測定位置をスキャンさせる方法としては、マイクロスコープ16および赤外線サーモグラフィ17と測定試料103とを、例えば図1の第2XYZステージ7(移動機構の一例)などにより相対移動させる方法を採用することができる。
また、測定位置をスキャンさせる方法としては、マイクロスコープ16および赤外線サーモグラフィ17と測定試料103とを、例えば図1の第2XYZステージ7(移動機構の一例)などにより相対移動させる方法を採用することができる。
測定位置をスキャンさせる他の方法としては、複数対のマイクロスコープ16および赤外線サーモグラフィ17を、各々の測定位置が被測定領域の各中心位置となるように一列に並べて配置するとともに、前記配列方向とは交差する方向(垂直の方向)に、前記複数対のマイクロスコープ16および赤外線サーモグラフィ17と測定試料103とを、相対移動させる方法などを採用することができる。
なお、例えば図1の第2XYZステージ7などにより、前記複数対のマイクロスコープ16および赤外線サーモグラフィ17と測定試料103とを、相対移動させ得る。また、この例における、個々のマイクロスコープ16は光照射部の一例であり、複数のマイクロスコープ16により構成されるマイクロスコープ16の群は加熱部の一例である。また、この例における、個々の赤外線サーモグラフィ17は温度検知部の一例であり、複数の赤外線サーモグラフィ17により構成される赤外線サーモグラフィ17の群は検知部の一例である。
さらに、ここでは、複数対のマイクロスコープ16および赤外線サーモグラフィ17を、各々の測定位置が被測定領域の各中心位置となるように一列に並べて配置する例を説明したが、複数対のマイクロスコープ16および赤外線サーモグラフィ17を複数列並べて配置し、上記相対位置を移動させずに測定を行う構成であってももちろんよい。
図8(b)に示すように、各片の測定領域における面内熱拡散率は、各々異なることが確認される。すなわち、測定試料103における位置に応じて、面内熱拡散率の角度分布が変化する。例えば、左上、中上、右上、左下、および右下においては、相対的に配向性が大きく、左中、中央、右中、および中下においては、相対的に配向性が小さいことが確認される。
このように、測定試料103の面内の複数箇所で測定することにより、熱伝導異方性分布が同定される。また、測定試料103の配向性の分布、あるいは測定試料103に含まれる炭素繊維の分布(分散)が同定される。付言すると、配向同定装置100は、炭素繊維の分布を同定する分布同定装置としても機能し得る。さらに、配向同定装置100は炭素繊維の分布の他に、炭素繊維の繊維径(例えば平均繊維径)や繊維長(例えば平均繊維長、横長比)など、炭素繊維の寸法を同定する装置としても機能し得る。
さて、図8(b)に示すように、左下領域における熱拡散率異方性は、他の領域と比較して最も高く、配向性が顕著であることが確認される。以下、この左下領域の測定結果についてさらに説明をする。
図9(a)に示すように、左下領域においては、30°および-140°付近で繊維配向分布密度関数の度数分布が最大である。このことにより、測定試料103は、炭素繊維の配向角が30°および-140°付近であることが推定される。また、標準偏差σは、0.27および0.21という結果が得られた。なお、分布の平均値μは、各々0.48および0.54という結果であった。
また、図9(b)に示すように、配向角の算出結果は、28.3°および-140°であった。ここで、図9(b)に示すように、配向強度を標準偏差σの逆数(1/σ)を長さとして、配向角とともにベクトル表示(極座標表示)することにより、測定試料103の配向性が視覚的に把握され得る。
<その他>
上記の説明においては、算出結果表示部24が、配向方向および分散の算出結果を表示手段(不図示)に表示(出力)することを説明したがこれに限定されない。例えば、配向方向および分散の算出結果を、他の装置に送信する態様や保存する態様であってもよい。
また、配向方向および分散の算出結果を算出する過程で得られる、熱拡散率についての情報を、配向方向および分散の算出結果とともに、表示、送信、記憶する態様であってもよい。あるいは、配向方向および分散の算出結果のいずれか一方に関する情報を、表示、送信、記憶する態様であってもよい。
上記の説明においては、算出結果表示部24が、配向方向および分散の算出結果を表示手段(不図示)に表示(出力)することを説明したがこれに限定されない。例えば、配向方向および分散の算出結果を、他の装置に送信する態様や保存する態様であってもよい。
また、配向方向および分散の算出結果を算出する過程で得られる、熱拡散率についての情報を、配向方向および分散の算出結果とともに、表示、送信、記憶する態様であってもよい。あるいは、配向方向および分散の算出結果のいずれか一方に関する情報を、表示、送信、記憶する態様であってもよい。
また、上記の説明においては、配向角として表示することを説明したが、配向性を示す情報としては、これに限定されない。例えば、配向角を直接示さずに、得られた配向角と閾値とを比較して、この閾値を超えた場合に、配向角が閾値を超えたことを示す情報を出力する態様であってもよい。また、熱拡散率分布を示す情報を例えばグラフなどにより出力してもよい。
また、配向方向および分散を出力する過程として、熱拡散率角度分布に最小二乗法を用いたフィッティングを行うことを説明した。この手法は特に限定されるものではなく、楕円分布を無次元化した熱拡散率分布に対して、最小二乗法を用いてフィッティングする楕円近似や、他の密度関数を用いてフィッティングを行ってもよい。
また、上記の説明においては、ダイオードレーザ10により測定試料1の表面を加熱し、赤外線サーモグラフィ17によって測定試料1の裏面を測定することを説明したが、これに限定されない。例えば、ダイオードレーザ10による測定試料1の加熱と、赤外線サーモグラフィ17による測定試料1の測定を、同一の面で行う態様であってもよい。なお、上記実施の形態のように、ダイオードレーザ10による加熱と、赤外線サーモグラフィ17による測定とを互いに異なる面で測定する場合は、同一面で測定する場合と比較して、熱反射の影響を抑制し得る。
また、上記の説明においては、測定試料1、101、103として、炭素繊維強化樹脂を用いることを説明したが、これに限定されない。すなわち、互いに熱伝導率が異なる複数の種類の材料から構成される試料であればよい。また、上記では、強化材として炭素繊維を用いることを説明したが、炭素繊維は、一方向に長い形状であればよく、長尺状、長方形状、円柱状、多角形状、長楕円球状などであってもよい。
さらに、上述のように配向同定装置100を分布同定装置としても機能させる場合には、強化材の形状は、一方向に長い形状以外の形状であってもよい。例えば、粒子状、球状、ペレット状など他の形状であってもよい。
さらに、上述のように配向同定装置100を分布同定装置としても機能させる場合には、強化材の形状は、一方向に長い形状以外の形状であってもよい。例えば、粒子状、球状、ペレット状など他の形状であってもよい。
さて、上記では種々の実施形態および変形例を説明したが、これらの実施形態や変形例同士を組み合わせて構成してももちろんよい。
また、本開示は上記の実施形態に何ら限定されるものではなく、本開示の要旨を逸脱しない範囲で種々の形態で実施することができる。
また、本開示は上記の実施形態に何ら限定されるものではなく、本開示の要旨を逸脱しない範囲で種々の形態で実施することができる。
1…測定試料、10…ダイオードレーザ、17…赤外線サーモグラフィ、20…コンピュータ、21…位相遅れ分布測定部、22…熱拡散率分布算出部、23…配向性算出部、24…算出結果表示部
Claims (9)
- 複数の材料により構成される試料に対して光を周期的に照射し当該試料を加熱する加熱部と、
前記試料の前記加熱部によって加熱された箇所を含む領域における温度分布の変化の応答の遅れを検知する検知部と、
前記検知部によって検知された応答の遅れに基づいて、前記試料を構成する少なくとも1種の材料の配向性を示す情報を出力する出力部と
を備える配向同定装置。 - 前記加熱部は、前記試料の一方側から当該試料を加熱し、
前記検知部は、前記試料を挟んで前記加熱部とは反対側から前記領域における温度分布の変化の応答の遅れを検知する
ことを特徴とする請求項1記載の配向同定装置。 - 前記試料は、繊維状に形成された強化材と、当該強化材を支持する母材とを含み、
前記出力部は、前記試料における前記強化材の向きを示す情報を出力する
ことを特徴とする請求項1または2記載の配向同定装置。 - 前記出力部は、前記検知部によって検知された応答の遅れに基づいて、前記試料の配向性を示す情報とともに、前記試料の熱拡散率に関する情報を出力する
ことを特徴とする請求項1乃至3のいずれか1項記載の配向同定装置。 - 前記出力部は、前記検知部によって検知された応答の遅れに基づいて、前記試料の配向方向を極座標により表示することを特徴とする請求項1乃至4のいずれか1項記載の配向同定装置。
- 前記加熱部および前記検知部と前記試料とを相対移動させる移動機構をさらに備え、
前記加熱部は、前記試料を複数の部分に分けたうちの各部分を順次スポット周期加熱し、
前記検知部は、前記加熱部により順次スポット周期加熱された前記各部分の温度分布を順次検知し、
前記出力部は、前記試料の前記部分毎の配向性を示す情報を出力することを特徴とする請求項1乃至5のいずれか1項記載の配向同定装置。 - 前記加熱部は、各々の照射位置が各被測定領域の中心位置となるように一列に並べて配置された複数の光照射部を含み、
前記検知部は、前記各被測定領域の温度分布を検知する複数の温度検知部からなり、
前記複数の光照射部の配列方向と交差する方向に、当該複数の光照射部および前記複数の温度検知部と前記試料とを相対移動させる移動機構をさらに備えることを特徴とする請求項1乃至6のいずれか1項記載の配向同定装置。 - 複数の材料により構成される試料に対して光を周期的に照射し当該試料を加熱するステップと、
前記試料の加熱された箇所を含む領域における温度分布の変化の応答の遅れを検知するステップと、
検知された応答の遅れに基づいて、前記試料を構成する少なくとも1種の材料の配向性を示す情報を出力するステップと
を備える配向同定方法。 - 複数の材料により構成される試料に対して光を周期的に照射し当該試料を加熱する加熱部と、
前記試料の前記加熱部によって加熱された箇所を含む領域における温度分布の変化の応答の遅れを検知する検知部と、
前記検知部によって検知された応答の遅れに基づいて、前記試料における前記材料を構成する少なくとも1種の材料の分布を示す情報を出力する出力部と
を備える分布同定装置。
Priority Applications (3)
| Application Number | Priority Date | Filing Date | Title |
|---|---|---|---|
| DE112016002600.5T DE112016002600B4 (de) | 2015-06-10 | 2016-06-10 | Orientierungsbewertungsvorrichtung, Orientierungsbewertungsverfahren |
| CN201680033243.2A CN107683409B (zh) | 2015-06-10 | 2016-06-10 | 取向鉴定装置、取向鉴定方法和分布鉴定装置 |
| US15/580,633 US10753895B2 (en) | 2015-06-10 | 2016-06-10 | Orientation evaluation device, orientation evaluation method, and distribution evaluation device |
Applications Claiming Priority (2)
| Application Number | Priority Date | Filing Date | Title |
|---|---|---|---|
| JP2015117288A JP6614813B2 (ja) | 2015-06-10 | 2015-06-10 | 配向同定装置、配向同定方法および分布同定装置 |
| JP2015-117288 | 2015-06-10 |
Publications (1)
| Publication Number | Publication Date |
|---|---|
| WO2016199890A1 true WO2016199890A1 (ja) | 2016-12-15 |
Family
ID=57504093
Family Applications (1)
| Application Number | Title | Priority Date | Filing Date |
|---|---|---|---|
| PCT/JP2016/067370 Ceased WO2016199890A1 (ja) | 2015-06-10 | 2016-06-10 | 配向同定装置、配向同定方法および分布同定装置 |
Country Status (5)
| Country | Link |
|---|---|
| US (1) | US10753895B2 (ja) |
| JP (1) | JP6614813B2 (ja) |
| CN (1) | CN107683409B (ja) |
| DE (1) | DE112016002600B4 (ja) |
| WO (1) | WO2016199890A1 (ja) |
Cited By (1)
| Publication number | Priority date | Publication date | Assignee | Title |
|---|---|---|---|---|
| CN114487014A (zh) * | 2022-01-26 | 2022-05-13 | 电子科技大学 | 一种红外无损检测的缺陷几何特征提取方法 |
Families Citing this family (10)
| Publication number | Priority date | Publication date | Assignee | Title |
|---|---|---|---|---|
| DE102014218136B4 (de) * | 2014-09-10 | 2019-07-18 | Fraunhofer-Gesellschaft zur Förderung der angewandten Forschung e.V. | Thermographische Untersuchungseinrichtung sowie Verfahren zur zerstörungsfreien Untersuchung einer oberflächennahen Struktur an einem Prüfobjekt |
| JP6955758B2 (ja) * | 2017-09-07 | 2021-10-27 | 国立大学法人東海国立大学機構 | 配向状態特定装置、配向状態特定方法およびプログラム |
| JP7100880B2 (ja) * | 2018-03-30 | 2022-07-14 | 国立大学法人東海国立大学機構 | 含有率情報取得装置、密度情報取得装置、含有率情報取得方法、密度情報取得方法、およびプログラム |
| JP7126200B2 (ja) * | 2018-09-28 | 2022-08-26 | 株式会社カネカ | 半導体関連部材の熱拡散性能の評価方法および評価装置並びに半導体関連部材の熱抵抗算出方法および算出装置 |
| JP7097067B2 (ja) * | 2018-10-10 | 2022-07-07 | 国立研究開発法人物質・材料研究機構 | カーボンファイバー応力測定方法 |
| EP3935358A1 (en) * | 2019-03-06 | 2022-01-12 | Electric Pocket Limited | Thermal quality mappings |
| CN109991264B (zh) * | 2019-04-30 | 2020-12-01 | 清华大学 | 二维各向异性纳米材料的热扩散率测定方法 |
| CN111025208B (zh) * | 2019-12-30 | 2022-04-26 | 中国计量大学 | 一种磁性材料取向测试方法 |
| JP7454541B2 (ja) | 2021-11-24 | 2024-03-22 | 株式会社リガク | 構造情報取得方法及び構造情報取得装置 |
| CN119382322A (zh) * | 2024-09-13 | 2025-01-28 | 南京华谱网络技术有限公司 | 一种基于红外成像技术的电力安全监测方法及系统 |
Citations (1)
| Publication number | Priority date | Publication date | Assignee | Title |
|---|---|---|---|---|
| JP2007178429A (ja) * | 2005-12-16 | 2007-07-12 | General Electric Co <Ge> | 絶縁塗膜の非破壊評価の装置 |
Family Cites Families (19)
| Publication number | Priority date | Publication date | Assignee | Title |
|---|---|---|---|---|
| US4373977A (en) * | 1981-06-25 | 1983-02-15 | The United States Of America As Represented By The Secretary Of The Army | Method of making a composite wire |
| US5344236A (en) * | 1992-01-23 | 1994-09-06 | Fishman Iiya M | Method for evaluation of quality of the interface between layer and substrate |
| US5863467A (en) * | 1996-05-03 | 1999-01-26 | Advanced Ceramics Corporation | High thermal conductivity composite and method |
| US6517238B2 (en) * | 2001-01-18 | 2003-02-11 | The United States Of America As Represented By The United States Department Of Energy | Thermal imaging measurement of lateral diffusivity and non-invasive material defect detection |
| EP1450155A1 (en) * | 2001-11-19 | 2004-08-25 | The Circle for the Promotion of Science and Engineering | Method for thermal analysis and system for thermal analysis |
| JP2005091119A (ja) * | 2003-09-17 | 2005-04-07 | Ricoh Co Ltd | 微小領域熱物性解析方法及び装置 |
| JP4171825B2 (ja) * | 2004-05-06 | 2008-10-29 | 学校法人慶應義塾 | 近接場光を用いた極微小領域熱物性測定法及び測定装置 |
| US7182510B2 (en) * | 2005-04-04 | 2007-02-27 | David Gerard Cahill | Apparatus and method for measuring thermal conductivity |
| JP4547551B2 (ja) * | 2005-04-13 | 2010-09-22 | 学校法人慶應義塾 | 断熱材の断熱特性リモートセンシング方法及び装置 |
| JP5288533B2 (ja) * | 2007-12-05 | 2013-09-11 | 株式会社ベテル | 周期加熱放射測温法熱物性測定装置およびそれを用いた熱物性測定方法 |
| CN101929968B (zh) * | 2009-10-30 | 2012-07-18 | 中国计量科学研究院 | 热扩散率测量装置 |
| JP5414058B2 (ja) * | 2010-03-10 | 2014-02-12 | 独立行政法人産業技術総合研究所 | 熱拡散率測定装置 |
| JP5475561B2 (ja) | 2010-06-14 | 2014-04-16 | ポリプラスチックス株式会社 | 充填材の配向解析方法 |
| US9784625B2 (en) * | 2010-11-30 | 2017-10-10 | Bloom Energy Corporation | Flaw detection method and apparatus for fuel cell components |
| TWI491868B (zh) * | 2012-04-09 | 2015-07-11 | Ind Tech Res Inst | 量測熱擴散係數的裝置以及量測熱擴散係數的方法 |
| JP2015108546A (ja) * | 2013-12-04 | 2015-06-11 | 国立大学法人名古屋大学 | 熱拡散率測定装置 |
| CN103884737A (zh) * | 2014-04-22 | 2014-06-25 | 哈尔滨工业大学 | 一种碳纤维束热扩散率的红外锁相热波检测方法与系统 |
| CN104155336B (zh) * | 2014-07-17 | 2016-08-24 | 清华大学 | 同时测定低维材料热导率、热扩散率和热容的方法及系统 |
| JP7266415B2 (ja) | 2019-01-31 | 2023-04-28 | 川崎重工業株式会社 | ガス用電磁弁 |
-
2015
- 2015-06-10 JP JP2015117288A patent/JP6614813B2/ja active Active
-
2016
- 2016-06-10 DE DE112016002600.5T patent/DE112016002600B4/de active Active
- 2016-06-10 WO PCT/JP2016/067370 patent/WO2016199890A1/ja not_active Ceased
- 2016-06-10 US US15/580,633 patent/US10753895B2/en active Active
- 2016-06-10 CN CN201680033243.2A patent/CN107683409B/zh active Active
Patent Citations (1)
| Publication number | Priority date | Publication date | Assignee | Title |
|---|---|---|---|---|
| JP2007178429A (ja) * | 2005-12-16 | 2007-07-12 | General Electric Co <Ge> | 絶縁塗膜の非破壊評価の装置 |
Non-Patent Citations (2)
| Title |
|---|
| HOSEI NAGANO: "CFRP no Sanjigen Netsu Dendo Ihosei o Hisesshoku de Keisoku Kano ni", OPTICAL ALLIANCE, vol. 24, no. 8, 1 August 2013 (2013-08-01), pages 53 - 57 * |
| MASAYA KURIBARA ET AL.: "Development of a Thermal Anisotropy Measurement Method for High-Thermal-Conductive Carbon Fiber Reinforced Plastic Composites Using a Lock-in Thermography", JAPAN JOURNAL OF THERMOPHYSICAL PROPERTIES, vol. 28, no. 2, 31 May 2014 (2014-05-31), pages 82 - 88, XP055333143 * |
Cited By (2)
| Publication number | Priority date | Publication date | Assignee | Title |
|---|---|---|---|---|
| CN114487014A (zh) * | 2022-01-26 | 2022-05-13 | 电子科技大学 | 一种红外无损检测的缺陷几何特征提取方法 |
| CN114487014B (zh) * | 2022-01-26 | 2023-05-09 | 电子科技大学 | 一种红外无损检测的缺陷几何特征提取方法 |
Also Published As
| Publication number | Publication date |
|---|---|
| CN107683409B (zh) | 2020-09-18 |
| US20180224383A1 (en) | 2018-08-09 |
| CN107683409A (zh) | 2018-02-09 |
| US10753895B2 (en) | 2020-08-25 |
| JP2017003409A (ja) | 2017-01-05 |
| JP6614813B2 (ja) | 2019-12-04 |
| DE112016002600T5 (de) | 2018-05-24 |
| DE112016002600B4 (de) | 2024-07-25 |
Similar Documents
| Publication | Publication Date | Title |
|---|---|---|
| JP6614813B2 (ja) | 配向同定装置、配向同定方法および分布同定装置 | |
| US11590578B2 (en) | Internal defect detection system, three-dimensional additive manufacturing device, internal defect detection method, method of manufacturing three-dimensional additive manufactured product, and three-dimensional | |
| JP7100880B2 (ja) | 含有率情報取得装置、密度情報取得装置、含有率情報取得方法、密度情報取得方法、およびプログラム | |
| JP2015108546A (ja) | 熱拡散率測定装置 | |
| US20150260667A1 (en) | Method of detecting defects in an object based on active thermography and a system thereof | |
| JP2018025560A (ja) | 熱拡散率測定装置 | |
| Hahn et al. | Infrared Microscopy Enhanced Ångström's Method for Thermal Diffusivity of Polymer Monofilaments and Films | |
| JP2012088226A (ja) | 非破壊検査方法及び非破壊検査装置 | |
| JP6620499B2 (ja) | 光学非破壊検査装置及び光学非破壊検査方法 | |
| Duhovic et al. | Quantitative fiber orientation analysis of carbon fiber sheet molding compounds using polarization imaging and X-ray computed tomography | |
| JP6730792B2 (ja) | 熱物性測定装置及び熱物性測定方法 | |
| JP2016003871A (ja) | 三次元形状測定装置、測定データ処理ユニット、測定データ処理方法、及びコンピュータプログラム | |
| JP2015132545A (ja) | 接合性検査方法及び装置 | |
| JP7762409B2 (ja) | 情報処理装置、情報処理システム、情報出力方法およびプログラム | |
| JP6955758B2 (ja) | 配向状態特定装置、配向状態特定方法およびプログラム | |
| JP2021181924A (ja) | 密度情報取得装置、含侵情報取得装置、密度情報取得方法、およびプログラム | |
| Nagata et al. | Thermal orientation evaluation for carbon-fiber-reinforced plastic by periodic heating method | |
| JP2012103176A (ja) | 検査装置 | |
| US11035809B2 (en) | Thermal diffusion factor measurement device, thermal diffusion factor measurement method and program | |
| Takiuti et al. | Development and characterization of an ITO nanocomposite film sensor for damage detection | |
| Addepalli et al. | Thermographic NDT for through-life inspection of high value components | |
| JP7762945B2 (ja) | 疲労情報取得装置、疲労情報取得方法、プログラム、疲労評価システム、および寿命評価方法 | |
| JP2014529086A (ja) | 線幅測定システム | |
| US9423239B2 (en) | Method to improve fiber length measurement using confocal laser scanning microscope images | |
| JP5606570B1 (ja) | 検査システム |
Legal Events
| Date | Code | Title | Description |
|---|---|---|---|
| 121 | Ep: the epo has been informed by wipo that ep was designated in this application |
Ref document number: 16807595 Country of ref document: EP Kind code of ref document: A1 |
|
| WWE | Wipo information: entry into national phase |
Ref document number: 15580633 Country of ref document: US |
|
| WWE | Wipo information: entry into national phase |
Ref document number: 112016002600 Country of ref document: DE |
|
| 122 | Ep: pct application non-entry in european phase |
Ref document number: 16807595 Country of ref document: EP Kind code of ref document: A1 |