WO2016120956A1 - 駆動制御装置、電子機器、駆動制御プログラム、及び駆動制御方法 - Google Patents
駆動制御装置、電子機器、駆動制御プログラム、及び駆動制御方法 Download PDFInfo
- Publication number
- WO2016120956A1 WO2016120956A1 PCT/JP2015/051964 JP2015051964W WO2016120956A1 WO 2016120956 A1 WO2016120956 A1 WO 2016120956A1 JP 2015051964 W JP2015051964 W JP 2015051964W WO 2016120956 A1 WO2016120956 A1 WO 2016120956A1
- Authority
- WO
- WIPO (PCT)
- Prior art keywords
- waveform
- data
- amplitude
- drive control
- frequency
- Prior art date
- Legal status (The legal status is an assumption and is not a legal conclusion. Google has not performed a legal analysis and makes no representation as to the accuracy of the status listed.)
- Ceased
Links
Images











Classifications
-
- G—PHYSICS
- G06—COMPUTING OR CALCULATING; COUNTING
- G06F—ELECTRIC DIGITAL DATA PROCESSING
- G06F3/00—Input arrangements for transferring data to be processed into a form capable of being handled by the computer; Output arrangements for transferring data from processing unit to output unit, e.g. interface arrangements
- G06F3/01—Input arrangements or combined input and output arrangements for interaction between user and computer
- G06F3/016—Input arrangements with force or tactile feedback as computer generated output to the user
Definitions
- the present invention relates to a drive control device, an electronic apparatus, a drive control program, and a drive control method.
- display means Conventionally, display means, contact detection means for detecting a contact state of a user's operation part to the display means, and tactile vibration that gives a predetermined tactile sensation to the operation part in contact with the display means.
- tactile sensation providing device including tactile sensation vibration generating means to be generated (for example, see Patent Document 1).
- the tactile sensation providing apparatus further includes vibration waveform data generation means for generating waveform data for generating the tactile vibration based on the detection result by the contact detection means.
- the tactile sensation providing apparatus further performs a modulation process on the waveform data generated by the vibration waveform data generation unit using an ultrasonic wave as a carrier wave, and converts the ultrasonic modulation signal generated by the modulation process into the tactile sensation.
- Ultrasonic modulation means for outputting to the tactile sensation vibration generating means as a signal for generating vibration.
- the ultrasonic modulation means performs either frequency modulation or phase modulation.
- the ultrasonic modulation means further performs amplitude modulation.
- the ultrasonic frequency of the conventional tactile sensation presenting device may be a frequency (approximately 20 kHz or higher) higher than the audible band, and the ultrasonic frequency itself is not particularly devised, so that a good tactile sensation may not be provided. There is.
- an object is to provide a drive control device, an electronic device, a drive control program, and a drive control method that can provide a good tactile sensation.
- a drive control device includes a display unit, a top panel provided on a display surface side of the display unit and having an operation surface, and coordinates for detecting coordinates of operation input performed on the operation surface.
- a drive control device for driving the vibration element of an electronic device including a detection unit and a vibration element that generates vibration on the operation surface, wherein the amplitude of a drive signal generates a natural vibration of an ultrasonic band on the operation surface
- a waveform generator that generates first waveform data representing a first waveform in which the waveform is changed, a first synthesized waveform obtained by synthesizing the basic waveform and the first waveform, or a plurality of the first waveforms.
- First synthesized waveform representing the first synthesized waveform A waveform synthesizer for generating an over data,
- FIG. 1 is a perspective view illustrating an electronic device according to a first embodiment.
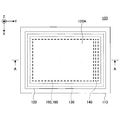
- FIG. 3 is a plan view showing the electronic device of the first embodiment.
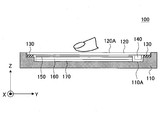
- FIG. 3 is a diagram illustrating a cross section taken along the line AA of the electronic device illustrated in FIG. 2. It is a figure which shows the wave front formed in parallel with the short side of a top panel among the standing waves which arise in a top panel by the natural vibration of an ultrasonic band. It is a figure explaining a mode that the dynamic friction force applied to the fingertip which performs operation input changes with the natural vibration of the ultrasonic band produced on the top panel of an electronic device.
- 1 is a diagram illustrating a configuration of an electronic device according to a first embodiment. It is a figure which shows the 1st data stored in memory.
- FIG. 4 is a flowchart illustrating processing executed by a drive control unit of the drive control device for an electronic device according to the first embodiment. It is a flowchart which shows the detailed process content of the process of FIG. It is a flowchart which shows the process by the modification of the flowchart shown in FIG. It is a figure explaining the process which produces
- FIG. 6 is a diagram illustrating a cross section of an electronic apparatus according to a modification of the first embodiment. 6 is a diagram illustrating an electronic apparatus according to a modification of the first embodiment.
- FIG. 6 is a diagram showing a cross section of a touch pad of an electronic apparatus according to a modification of the first embodiment.
- FIG. 11 is a plan view showing an operating state of an electronic device according to a modification of the first embodiment. It is a figure which shows the 2nd basic waveform used additionally in Embodiment 2.
- FIG. 6 is a diagram illustrating second data stored in a memory according to Embodiment 2.
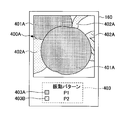
- FIG. 10 is a diagram illustrating third data stored in the memory according to the second embodiment. It is a figure which shows the state by which the dialog box used when setting a 1st frequency magnification and an amplitude multiplication factor was displayed on the display panel. It is a figure showing the image which the user selected as the setting object of amplitude data.
- FIG. 27 is a diagram showing a state of a display panel when setting amplitude data in the image shown in FIG. 26.
- FIG. 1 is a perspective view showing an electronic apparatus 100 according to the first embodiment.
- Electronic device 100 is, for example, a smart phone terminal, a tablet computer, or a game machine using a touch panel as an input operation unit.
- the electronic device 100 may be any device that uses a touch panel as an input operation unit.
- the electronic device 100 is a device that is installed and used in a specific place such as a portable information terminal or ATM (Automatic Teller Machine). May be.
- the input operation unit 101 of the electronic device 100 is provided with a display panel below the touch panel.
- Various buttons 102A or a slider 102B or the like (hereinafter referred to as GUI operation unit 102) using a GUI (Graphic User Interface) is provided on the display panel. Is displayed).
- a user of the electronic device 100 usually touches the input operation unit 101 with a fingertip in order to operate the GUI operation unit 102.
- FIG. 2 is a plan view showing electronic device 100 according to the first embodiment
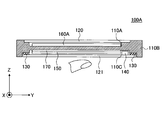
- FIG. 3 is a view showing a cross section taken along line AA of electronic device 100 shown in FIG. 2 and 3, an XYZ coordinate system that is an orthogonal coordinate system is defined as shown.
- the electronic device 100 includes a housing 110, a top panel 120, a double-sided tape 130, a vibration element 140, a touch panel 150, a display panel 160, and a substrate 170.
- the housing 110 is made of, for example, resin, and as shown in FIG. 3, the substrate 170, the display panel 160, and the touch panel 150 are disposed in the recess 110 ⁇ / b> A, and the top panel 120 is bonded by the double-sided tape 130. .
- the top panel 120 is a thin flat plate member that is rectangular in plan view, and is made of transparent glass or a reinforced plastic such as polycarbonate.
- a surface (surface on the Z-axis positive direction side) 120A of the top panel 120 is an example of an operation surface on which a user of the electronic device 100 performs operation input.
- the vibration element 140 is bonded to the surface in the negative direction of the Z axis, and four sides in a plan view are bonded to the housing 110 with a double-sided tape 130.
- the double-sided tape 130 only needs to be able to bond the four sides of the top panel 120 to the housing 110, and does not have to be a rectangular ring as shown in FIG.
- a touch panel 150 is disposed on the Z-axis negative direction side of the top panel 120.
- the top panel 120 is provided to protect the surface of the touch panel 150. Note that another surface or a protective film may be provided on the surface 120A of the top panel 120.
- the top panel 120 vibrates when the vibration element 140 is driven in a state where the vibration element 140 is bonded to the surface in the negative Z-axis direction.
- the top panel 120 is vibrated at the natural vibration frequency of the top panel 120 to generate a standing wave in the top panel 120.
- the vibration element 140 is bonded to the top panel 120, it is actually preferable to determine the natural vibration frequency in consideration of the weight of the vibration element 140 and the like.
- the vibration element 140 is bonded to the surface of the top panel 120 on the Z-axis negative direction side along the short side extending in the X-axis direction on the Y-axis positive direction side.
- the vibration element 140 may be an element that can generate vibrations in an ultrasonic band.
- an element including a piezoelectric element such as a piezoelectric element can be used.
- the vibration element 140 is driven by a drive signal output from a drive control unit described later.
- the amplitude (intensity) and frequency of vibration generated by the vibration element 140 are set by the drive signal. Further, on / off of the vibration element 140 is controlled by a drive signal.
- an ultrasonic band means a frequency band about 20 kHz or more, for example.
- the frequency at which the vibration element 140 vibrates is equal to the frequency of the top panel 120. Therefore, the vibration element 140 is driven by a drive signal so as to vibrate at the natural frequency of the top panel 120. Driven.
- the touch panel 150 is disposed on the display panel 160 (Z-axis positive direction side) and below the top panel 120 (Z-axis negative direction side).
- the touch panel 150 is an example of a coordinate detection unit that detects a position where the user of the electronic device 100 touches the top panel 120 (hereinafter referred to as an operation input position).
- GUI operation unit On the display panel 160 below the touch panel 150, various buttons and the like (hereinafter referred to as GUI operation unit) by GUI are displayed. For this reason, the user of the electronic device 100 usually touches the top panel 120 with a fingertip in order to operate the GUI operation unit.
- the touch panel 150 may be a coordinate detection unit that can detect the position of an operation input to the user's top panel 120, and may be, for example, a capacitance type or resistance film type coordinate detection unit.
- a mode in which the touch panel 150 is a capacitive coordinate detection unit will be described. Even if there is a gap between the touch panel 150 and the top panel 120, the capacitive touch panel 150 can detect an operation input to the top panel 120.
- the top panel 120 may be integrated with the touch panel 150.
- the surface of the touch panel 150 becomes the surface 120A of the top panel 120 shown in FIGS. 2 and 3, and an operation surface is constructed.
- the structure which excluded the top panel 120 shown in FIG.2 and FIG.3 may be sufficient.
- the surface of the touch panel 150 constructs the operation surface.
- the member having the operation surface may be vibrated by the natural vibration of the member.
- the touch panel 150 may be disposed on the top panel 120. Also in this case, the surface of the touch panel 150 constructs the operation surface. Moreover, when the touch panel 150 is a capacitance type, the structure which excluded the top panel 120 shown in FIG.2 and FIG.3 may be sufficient. Also in this case, the surface of the touch panel 150 constructs the operation surface. In this case, the member having the operation surface may be vibrated by the natural vibration of the member.
- the display panel 160 may be a display unit that can display an image, such as a liquid crystal display panel or an organic EL (Electroluminescence) panel.
- the display panel 160 is installed on the substrate 170 (Z-axis positive direction side) by a holder or the like (not shown) inside the recess 110A of the housing 110.
- the display panel 160 is driven and controlled by a driver IC (Integrated Circuit), which will be described later, and displays a GUI operation unit, images, characters, symbols, graphics, and the like according to the operation status of the electronic device 100.
- driver IC Integrated Circuit
- the substrate 170 is disposed inside the recess 110 ⁇ / b> A of the housing 110.
- a display panel 160 and a touch panel 150 are disposed on the substrate 170.
- the display panel 160 and the touch panel 150 are fixed to the substrate 170 and the housing 110 by a holder or the like (not shown).
- various circuits necessary for driving the electronic device 100 are mounted on the substrate 170.
- the drive control unit mounted on the substrate 170 drives the vibration element 140, and the top panel 120. Is vibrated at the frequency of the ultrasonic band.
- the frequency of this ultrasonic band is a resonance frequency of a resonance system including the top panel 120 and the vibration element 140 and causes the top panel 120 to generate a standing wave.
- the electronic device 100 provides a tactile sensation to the user through the top panel 120 by generating a standing wave in the ultrasonic band.
- FIG. 4 is a diagram showing a wave front formed in parallel to the short side of the top panel 120 among standing waves generated in the top panel 120 due to the natural vibration of the ultrasonic band
- FIG. 4A is a side view.
- (B) is a perspective view. 4A and 4B, XYZ coordinates similar to those in FIGS. 2 and 3 are defined.
- the amplitude of the standing wave is exaggerated for ease of understanding.
- the vibration element 140 is omitted.
- the standing waves shown in FIGS. 4A and 4B are waveforms when the number of periods k is 10, as an example.
- the period number k is 10.
- the natural frequency f is 33.5 [kHz].
- a drive signal having a frequency of 33.5 [kHz] may be used.
- the top panel 120 is a flat plate member.
- the vibration element 140 see FIGS. 2 and 3
- the top panel 120 is changed to (A) and (B) in FIG.
- a standing wave is generated on the surface 120A (see FIGS. 2 and 3).
- the two vibration elements 140 may be used.
- the other vibration element 140 is bonded to the surface of the top panel 120 on the Z-axis negative direction side along the short side extending in the X-axis direction on the Y-axis negative direction side. That's fine.
- the two vibration elements 140 may be arranged so as to be axially symmetric with respect to a center line parallel to the two short sides of the top panel 120 as a symmetry axis.
- the two vibrating elements 140 when the two vibrating elements 140 are driven, they may be driven in the same phase when the number of periods k is an integer, and in the opposite phase when the number of periods k is a decimal (a number including an integer part and a decimal part). What is necessary is just to drive.
- FIG. 5 is a diagram illustrating a state in which the dynamic friction force applied to the fingertip that performs the operation input changes due to the natural vibration of the ultrasonic band generated in the top panel 120 of the electronic device 100.
- the user performs an operation input to move the finger along the arrow from the back side of the top panel 120 to the near side while touching the top panel 120 with the fingertip.
- the vibration is turned on / off by turning on / off the vibration element 140 (see FIGS. 2 and 3).
- the natural vibration of the ultrasonic band occurs in the entire top panel 120 as shown in FIG. 4, but in FIGS. 5A and 5B, the user's finger is on the front side from the back side of the top panel 120.
- the operation pattern which switches on / off of a vibration during moving to is shown.
- the vibration is turned off when the user's finger is on the back side of the top panel 120, and the vibration is turned on in the middle of moving the finger to the near side.
- the vibration is turned on when the user's finger is on the back side of the top panel 120, and the vibration is turned off in the middle of moving the finger to the near side. Yes.
- the dynamic frictional force applied to the fingertip is large in the range indicated in gray on the back side of the top panel 120, and the dynamic frictional force applied to the fingertip is small in the range indicated in white on the near side of the top panel 120.
- the user who performs an operation input to the top panel 120 senses a decrease in the dynamic friction force applied to the fingertip and perceives the ease of slipping of the fingertip when the vibration is turned on. It will be. At this time, the user feels that there is a recess in the surface 120A of the top panel 120 when the dynamic friction force decreases due to the surface 120A of the top panel 120 becoming smoother.
- the dynamic friction force applied to the fingertip is small in the range shown in white on the front side of the top panel 120, and the dynamic friction force applied to the fingertip is large in the range shown in gray on the front side of the top panel 120.
- the user who performs an operation input to the top panel 120 senses an increase in the dynamic friction force applied to the fingertip when the vibration is turned off, You will perceive the feeling of being caught.
- the dynamic frictional force is increased due to the fingertip becoming less slippery, it feels as if a convex portion exists on the surface 120A of the top panel 120.
- FIG. 6 is a diagram illustrating a configuration of the electronic device 100 according to the first embodiment.
- the electronic device 100 includes a vibrating element 140, an amplifier 141, a touch panel 150, a driver IC (Integrated Circuit) 151, a display panel 160, a driver IC 161, a control unit 200, a sine wave generator 310, and an amplitude modulator 320.
- a vibrating element 140 an amplifier 141, a touch panel 150, a driver IC (Integrated Circuit) 151, a display panel 160, a driver IC 161, a control unit 200, a sine wave generator 310, and an amplitude modulator 320.
- the control unit 200 includes an application processor 220, a communication processor 230, a waveform generation unit 240A, a waveform synthesis unit 240B, a drive control unit 240C, a data generation unit 240D, and a memory 250.
- the control unit 200 is realized by an IC chip, for example.
- the waveform generation unit 240A, the waveform synthesis unit 240B, the drive control unit 240C, the data generation unit 240D, the memory 250, the sine wave generator 310, and the amplitude modulator 320 constitute the drive control device 300.
- the application processor 220, the communication processor 230, the waveform generation unit 240A, the waveform synthesis unit 240B, the drive control unit 240C, the data generation unit 240D, and the memory 250 will be described.
- the waveform generation unit 240A, the waveform synthesis unit 240B, the drive control unit 240C, and the data generation unit 240D may be provided outside the control unit 200 as separate IC chips or processors.
- the waveform generation unit 240A, the waveform synthesis unit 240B, the drive control unit 240C, and the data generation unit 240D may be realized by separate IC chips or processors. Further, any two or three of the waveform generation unit 240A, the waveform synthesis unit 240B, the drive control unit 240C, and the data generation unit 240D may be realized by the same IC chip or processor.
- the casing 110, the top panel 120, the double-sided tape 130, and the substrate 170 are omitted.
- the amplitude modulator 320 will be described.
- the amplifier 141 is disposed between the drive control device 300 and the vibration element 140 and amplifies the drive signal output from the drive control device 300 to drive the vibration element 140.
- the driver IC 151 is connected to the touch panel 150, detects position data indicating a position where an operation input to the touch panel 150 has been performed, and outputs the position data to the control unit 200. As a result, the position data is input to the application processor 220, the drive control unit 240C, and the data generation unit 240D. Note that inputting position data to the drive control unit 240 ⁇ / b> C is equivalent to inputting position data to the drive control device 300.
- the driver IC 151 when detecting the position data, the driver IC 151 outputs area data representing the area (contact area) of the fingertip touching the surface 120A of the top panel 120 by the operation input to the drive control unit 240C.
- the contact area changes according to the contact load of the operation input.
- the operation input contact load is a load applied to the top panel 120 when the fingertip presses the surface 120A. If the force with which the fingertip presses the top panel 120 is strong, the contact load increases and the amount of deformation of the fingertip increases, so the contact area increases. On the other hand, if the force with which the fingertip presses the top panel 120 is weak, the contact load becomes small and the amount of deformation of the fingertip decreases, so the contact area becomes small.
- the contact area may be detected by the capacitance detected by the driver IC 151. As the contact area increases, the capacitance increases, and as the contact area decreases, the capacitance decreases.
- the contact area may be detected based on the resistance value detected by the driver IC 151. As the contact area increases, the resistance value decreases, and as the contact area decreases, the resistance value increases.
- the driver IC 161 is connected to the display panel 160, inputs drawing data output from the drive control device 300 to the display panel 160, and causes the display panel 160 to display an image based on the drawing data. As a result, a GUI operation unit or an image based on the drawing data is displayed on the display panel 160.
- the application processor 220 performs processing for executing various applications of the electronic device 100.
- the communication processor 230 executes processing necessary for the electronic device 100 to perform communication such as 3G (Generation), 4G (Generation), LTE (Long Term Evolution), and WiFi.
- the waveform generator 240A generates first waveform data representing a first waveform in which the frequency or amplitude of the basic waveform represented by the basic waveform data stored in the memory 250 is changed when two predetermined conditions are met. . Two predetermined conditions will be described later.
- the basic waveform data is data representing a basic waveform.
- the basic waveform is a basic waveform used for temporally changing the amplitude of the drive signal that generates the natural vibration of the ultrasonic band on the surface 120A (operation surface) of the top panel 120.
- the basic waveform is represented by an envelope constructed by a predetermined number of amplitude values arranged in time series.
- the basic waveform data is basic amplitude values arranged in time series, and is constructed with basic amplitude values representing a predetermined number of amplitude values that construct the envelope of the basic waveform.
- the waveform generation unit 240A When generating the first waveform data of the first frequency higher than the frequency (basic frequency) of the basic waveform data, the waveform generation unit 240A is based on the ratio of the first frequency to the basic frequency (first frequency magnification). The first waveform data is generated by thinning out the waveform data to reduce the number of data points.
- the first waveform represented by the first waveform data generated by thinning the basic waveform data to reduce the number of data points is a waveform obtained by shortening the basic waveform in the time axis direction according to the first frequency magnification.
- the first waveform is represented by an envelope constructed by a predetermined number of amplitude values arranged in time series.
- the first waveform data is arranged in time series and is constructed with a predetermined number of first amplitude values that construct the envelope of the first waveform.
- the number of data points of the first amplitude value is smaller in accordance with the first frequency magnification than the number of data points of the basic amplitude value.
- the waveform generation unit 240A multiplies the basic amplitude value by a predetermined coefficient (amplitude multiplication coefficient).
- the waveform generation unit 240A changes the amplitude of the basic waveform data and generates the first waveform data in which the frequency is changed to the first frequency higher than the basic frequency.
- the first waveform data is generated by thinning out and reducing the number of data points and multiplying the amplitude by the amplitude multiplication factor.
- the first waveform is a waveform in which the basic waveform is shortened in the time axis direction according to the first frequency magnification and the amplitude is multiplied by the amplitude multiplication factor.
- the waveform synthesis unit 240B generates first synthesized waveform data representing a first synthesized waveform obtained by synthesizing the basic waveform and the first waveform, or a first synthesized waveform obtained by synthesizing the plurality of first waveforms.
- the synthesis of the waveform is performed by synthesizing a plurality of basic amplitude values representing the amplitude included in the basic waveform and a plurality of first amplitude values representing the amplitude included in the first waveform with matching temporal positions. .
- the first synthesized waveform data constructed by the first synthesized amplitude value is generated by synthesizing the basic amplitude value and the first amplitude value whose temporal positions are equal to each other.
- the synthesis of the basic amplitude value and the first amplitude value is performed by adding the amplitude values. For this reason, the first combined amplitude value is given as the sum of the basic amplitude value and the first amplitude value.
- the first synthesized waveform data is obtained as described above, the first synthesized waveform is represented by an envelope obtained by synthesizing the envelope representing the basic waveform and the envelope representing the first waveform.
- data of a plurality of first amplitude values may be synthesized by matching the temporal positions.
- the first waveform generated when the first frequency multiplication factor and the amplitude multiplication factor are both “1” has the same waveform as the basic waveform.
- combining such a 1st waveform with the 1st waveform which changed the frequency or amplitude of the basic waveform can be grasped as a synthesis
- the first synthesized waveform data is used to generate second synthesized waveform data and third synthesized waveform data, which will be described later.
- the second synthesized waveform data and the third synthesized waveform data are waveform data representing temporal changes in amplitude values for modulating the intensity (amplitude) of the drive signal used for driving the vibration element 140. Therefore, the first combined waveform data is data used to change the amplitude of the drive signal with time. The first combined waveform will be described later with reference to FIG.
- the drive control unit 240C When the two predetermined conditions are met, the drive control unit 240C generates third synthesized waveform data based on the first synthesized waveform data, and outputs the third synthesized waveform data to the amplitude modulator 320 as amplitude data. .
- the third combined waveform data is waveform data representing a temporal change in the amplitude value for modulating the intensity (amplitude) of the drive signal used for driving the vibration element 140.
- the drive control unit 240C outputs position data to the waveform generation unit 240A when two predetermined conditions are met.
- the third synthesized waveform data is generated by reducing the number of data points by thinning out the first synthesized waveform data in accordance with the temporal change degree of the position of the operation input, and the amplitude value of the second synthesized waveform data. Is generated according to the contact load of the operation input.
- a plurality of second composites included in the second composite waveform data generated by thinning out an interval in the time axis direction between a plurality of first composite amplitude values included in the first composite waveform data.
- the interval between the amplitude values in the time axis direction is made equal.
- reducing the number of data points as described above means generating second synthesized waveform data in which the frequency of the first synthesized waveform data is increased in accordance with the degree of temporal change.
- the third synthesized waveform data generates the second synthesized waveform data by increasing the frequency of the first synthesized waveform data in accordance with the temporal change degree of the position of the operation input, and the amplitude value of the second synthesized waveform data. Is generated according to the contact load of the operation input.
- the drive control unit 240C outputs position data to the waveform generation unit 240A when two predetermined conditions are met.
- the time required from when the position data is input to the waveform generation unit 240A until the drive control unit 240C calculates the drive signal based on the position data is ⁇ t. That is, during the required time ⁇ t, the waveform generation unit 240A generates first waveform data using the position data obtained from the drive control unit 240C, and the waveform synthesis unit 240B synthesizes a plurality of first waveforms to generate the first waveform data. One composite waveform data is generated, and the drive control unit 240C generates final amplitude data based on the first composite waveform data.
- the position data may be directly input from the driver IC 151 to the waveform generation unit 240A, and the waveform generation unit 240A may generate the first waveform data using the input position data.
- the data generation unit 240D generates first data and third data according to the content of the user's operation input. Further, in addition to the first data and the third data, the second data may be generated. The first data, the second data, and the third data are stored in the memory 250. The first data, the second data, and the third data will be described later with reference to FIGS.
- the speed at which the user's fingertip moves along the surface 120A of the top panel 120 is used as the temporal change degree of the position data used for the first predetermined condition of the two predetermined conditions.
- the drive control unit 240C calculates the moving speed of the user's fingertip based on the temporal change degree of the position data input from the driver IC 151.
- the drive control device 300 when the user's fingertip moves along the surface 120A of the top panel 120, the drive control device 300 according to the first embodiment vibrates the top panel 120 in order to change the dynamic friction force applied to the fingertip. Since the dynamic friction force is generated when the fingertip is moving, the drive control unit 240C vibrates the vibration element 140 when the moving speed becomes equal to or higher than a predetermined threshold speed. It is the first predetermined condition that the moving speed is equal to or higher than a predetermined threshold speed.
- the amplitude value represented by the amplitude data output by the drive control unit 240C is zero when the moving speed is less than the predetermined threshold speed, and when the moving speed becomes equal to or higher than the predetermined threshold speed, Set to the amplitude value.
- the threshold speed may be set as the minimum speed of the fingertip movement speed when the user performs an operation input while moving the fingertip touching the surface 120A of the top panel 120. Such a minimum speed may be set based on experimental results, or may be set according to the resolution of the touch panel 150 or the like.
- the drive control device 300 outputs amplitude data to the amplitude modulator 320 when the position of the fingertip that performs the operation input is within a predetermined region where vibration is to be generated.
- the second predetermined condition is that the position of the fingertip where the operation input is performed is within a predetermined region where vibration is to be generated.
- Whether or not the position of the fingertip that performs the operation input is within a predetermined region where the vibration is to be generated is based on whether or not the position of the fingertip that performs the operation input is within the predetermined region where the vibration is to be generated. Determined.
- the position on the display panel 160 such as a GUI operation unit to be displayed on the display panel 160, a region for displaying an image, or a region representing the entire page is specified by region data representing the region.
- region data representing the region.
- the area data exists for all GUI operation units displayed on the display panel 160, areas for displaying images, or areas representing the entire page.
- the application of the electronic device 100 running is determined.
- the type will be related. This is because the display on the display panel 160 differs depending on the type of application.
- the type of operation input for moving the fingertip touching the surface 120A of the top panel 120 differs depending on the type of application.
- a type of operation input for moving the fingertip touching the surface 120A of the top panel 120 for example, when operating the GUI operation unit, there is a so-called flick operation.
- the flick operation is an operation of moving the fingertip along a surface 120A of the top panel 120 for a relatively short distance so as to be repelled (snapped).
- a swipe operation is performed.
- the swipe operation is an operation of moving a fingertip relatively long distance so as to sweep along the surface 120A of the top panel 120.
- the swipe operation is performed, for example, when turning a photo in addition to turning the page.
- a drag operation for dragging the slider is performed.
- the operation input for moving the fingertip touching the surface 120A of the top panel 120 is selectively used depending on the type of display by the application. For this reason, when determining whether or not the position of the fingertip for performing the operation input is within a predetermined region where vibration is to be generated, the type of application in which the electronic device 100 is activated is related.
- the drive control unit 240C determines whether or not the position represented by the position data input from the driver IC 151 is within a predetermined region where vibration is to be generated.
- First data associating data representing the type of application, area data representing a GUI operation unit or the like on which an operation input is performed, and pattern data representing a vibration pattern is stored in the memory 250.
- the vibration pattern refers to an ultrasonic pattern generated in the top panel 120 by modulating the amplitude of the sine wave signal of the ultrasonic band output from the sine wave generator 310 by the amplitude data output from the drive control unit 240C. It is an envelope pattern of the time change of sound wave vibration.
- This vibration pattern is a vibration pattern that the user can actually feel with the fingertip.
- the frequency of the vibration by the vibration pattern is preferably set to 1 kHz or less, for example, so as to be in a frequency band sensed by a human fingertip.
- the drive control unit 240C calculates a change in the position of the fingertip during the required time from when the position data is input to the drive control device 300 from the driver IC 151 until the drive signal is calculated based on the position data. In order to interpolate, the following processing is performed.
- the drive control device 300 performs calculation every predetermined control cycle. The same applies to the drive control unit 240C. Therefore, if the required time from when the position data is input from the driver IC 151 to the drive control device 300 until the drive control unit 240C calculates the drive signal based on the position data is ⁇ t, the required time ⁇ t is the control time. Equal to the period.
- the moving speed of the fingertip starts from the point (x1, y1) represented by the position data input from the driver IC 151 to the drive control device 300, and the end point (x2, y1) after the required time ⁇ t has elapsed. It can be obtained as the velocity of the vector y2).
- the drive control unit 240C uses the point (x2, y2) represented by the position data input from the driver IC 151 to the drive control device 300 as the start point, and the position of the fingertip after the required time ⁇ t has passed as the end point (x3, y3).
- the coordinates (x3, y3) after the lapse of the required time ⁇ t are estimated by obtaining the vector to be used.
- the change in the position of the fingertip during the required time ⁇ t is interpolated by estimating the coordinates after the required time ⁇ t has elapsed as described above.
- the calculation for estimating the coordinates after the lapse of the required time ⁇ t is performed by the drive control unit 240C.
- the drive control unit 240C determines whether or not the estimated coordinates are inside a predetermined area where vibration is to be generated, and generates vibration if the estimated coordinate is inside the predetermined area where vibration is to be generated. Therefore, the second predetermined condition is that the estimated coordinates are inside a predetermined region where vibration is to be generated.
- the two predetermined conditions necessary for the drive control unit 240C to output the amplitude data to the amplitude modulator 320 are that the moving speed of the fingertip is equal to or higher than the predetermined threshold speed, and the estimated coordinates generate vibration. It is inside a predetermined area to be made.
- the drive control unit 240C When the moving speed of the fingertip is equal to or higher than a predetermined threshold speed and the estimated coordinates are within a predetermined area where vibration is to be generated, the drive control unit 240C generates third synthesized waveform data and uses it as amplitude data. Output to the amplitude modulator 320.
- the drive control unit 240C when the first composite waveform data is thinned out according to the degree of temporal change to reduce the number of data points, the drive control unit 240C performs the following process.
- v is a moving speed of the operation input
- v 0 is a reference speed.
- the reference speed v 0 may be a known speed that can be used as a reference for the movement speed v of the operation input.
- the above-described threshold speed may be used.
- Int ( ⁇ ) represents a function for converting the value of ⁇ into an integer.
- the integer value is derived by rounding down the decimal point or rounding off the first decimal place.
- the drive control unit 240C obtains the speed ratio ⁇ , the frequency shift amount s f , and the second frequency magnification a f from the moving speed v using the following equations (3), (4), and (5).
- Expression (3) is an expression for calculating the ratio of the moving speed v of the operation input with respect to the reference speed v 0 as a logarithm.
- Expression (4) is an expression for obtaining the frequency shift amount s f by converting the ratio obtained by Expression (3) into an integer. For this reason, the integer obtained by equation (4) represents the ratio of the moving speed v of the operation input to the reference speed v 0 as an integer.
- Equation (5) is an equation for obtaining as 2 s f-th power value second frequency magnification a f.
- Drive control section 240C generates the second composite waveform data obtained by the data points of the first composite amplitude values included in the first synthesized waveform data to 1 / a f. That is, the drive control section 240C, by extracting the data of the first composite amplitude value (a f -1) pieces every in the first time-axis direction, the second composite waveform data in which the data points to 1 / a f Is generated.
- first composite amplitude value (a f -1) pieces every extracted and the data points 1 / a f is thinned out first composite amplitude value depending on the value of the second frequency ratio a f data it is to reduce the number, and to generate a second composite waveform data of a frequency obtained by multiplying the second frequency ratio a f the frequency of the first composite amplitude value.
- the second synthesized amplitude value is generated from the first synthesized amplitude value.
- the drive control unit 240C generates the second synthesized waveform data from the first synthesized waveform data.
- the second synthesized waveform data is output as amplitude data from the drive control unit 240C to the amplitude modulator 320, and is used to modulate the amplitude of the sine wave signal of the ultrasonic band output from the sine wave generator 310. .
- the frequency band of the second composite waveform is preferably set to 1 kHz or less. Therefore, the frequency of the fundamental wave, taking into account the first frequency ratio and a second frequency ratio a f, for example, is preferably set to a frequency lower than 1 kHz.
- m is a natural number of 2 or more, or greater than one decimal
- n represents 0 or more is a natural number, representing the ratio of the moving velocity v of the operation input to the reference speed v 0.
- the value of m is a decimal number, it may be set to an integer value such that the number of data points of the first composite waveform is divisible by mn . Further, when the value of m is a decimal number, if the first synthesized amplitude value at the last data point of the first synthesized waveform data does not become zero, a process of setting to zero may be performed.
- the drive control unit 240C when generating the third composite waveform data by changing the amplitude value of the drive signal given by the second composite waveform data according to the contact load of the operation input, the drive control unit 240C performs the following operation. Perform the following process.
- the drive control unit 240C obtains the contact load of the operation input based on the contact area represented by the area data input from the driver IC 151 to the drive control unit 240C.
- Drive control section 240C includes the following equation (6), determine the amplitude ratio a a from the contact load, the amplitude of the third synthesis waveform data of the second combined amplitude values included in the second composite waveform data by the amplitude magnification a a fold The data is output to the amplitude modulator 320.
- w represents the contact load
- w max represents the value of the contact load that outputs the maximum amplitude
- the drive control section 240C includes an amplitude of the second composite waveform data to generate a third combined waveform data by the amplitude magnification a a fold.
- the memory 250 stores first data, second data, and third data.
- the first data, the second data, and the third data will be described later with reference to FIGS.
- the memory 250 stores data and programs necessary for the application processor 220 to execute an application, data and programs necessary for the communication processor 230 for communication processing, and the like.
- the memory 250 is an example of a data storage unit.
- the sine wave generator 310 generates a sine wave necessary for generating a drive signal for vibrating the top panel 120 at a natural frequency. For example, when the top panel 120 is vibrated at a natural frequency f of 33.5 [kHz], the frequency of the sine wave is 33.5 [kHz].
- the sine wave generator 310 inputs an ultrasonic band sine wave signal to the amplitude modulator 320.
- the sine wave output from the sine wave generator 310 is a drive signal before amplitude is modulated, and is a sine wave that generates a natural vibration of an ultrasonic band on the operation surface at a constant frequency and a constant phase.
- the amplitude modulator 320 modulates the amplitude of the sine wave signal input from the sine wave generator 310 using the amplitude data input from the drive control unit 240C to generate a drive signal.
- This drive signal has a predetermined vibration pattern.
- the amplitude modulator 320 modulates only the amplitude of the sine wave signal of the ultrasonic band input from the sine wave generator 310, and generates a drive signal having a predetermined vibration pattern without modulating the frequency and phase.
- the drive signal output from the amplitude modulator 320 is an ultrasonic band sine wave signal obtained by modulating only the amplitude of the ultrasonic band sine wave signal input from the sine wave generator 310.
- the pattern whose amplitude is modulated represents a predetermined vibration pattern. Note that when the amplitude data is zero, the amplitude of the drive signal is zero. This is equivalent to the amplitude modulator 320 not outputting a drive signal.
- FIG. 7 is a diagram illustrating the first data stored in the memory 250.
- the first data associates an application ID (Identification) representing the type of application, region data representing a coordinate value of a region where a GUI operation unit or the like where an operation input is performed, and pattern data representing a vibration pattern. It is data.
- application ID Identification
- region data representing a coordinate value of a region where a GUI operation unit or the like where an operation input is performed
- pattern data representing a vibration pattern. It is data.
- app_id1 is shown as the application ID.
- area data equations f1 to f4 representing coordinate values of an area where a GUI operation unit or the like where an operation input is performed are displayed are shown.
- P1 to P4 are shown as pattern data representing the vibration pattern.
- the application represented by the application ID included in the first data includes all applications that can be used in a smartphone terminal, a tablet computer, a game machine, and the like, and includes an email editing mode.
- FIG. 8 is a diagram showing the second data stored in the memory 250.
- the second data is data in which a basic waveform ID (Identification) indicating the type of basic waveform is associated with a waveform data string.
- the waveform data string is basic waveform data.
- FIG. 8 shows fw_id1 to fw_id3 as basic waveform IDs.
- [b1, b2, b3,..., B3072] [c1, c2, c3,. .
- the waveform data string [a1, a2, a3,..., A3072] includes 3072 basic amplitude values a1 to a3072.
- the waveform data strings [b1, b2, b3,..., B3072] and [c1, c2, c3,..., C1024] are 3072 basic amplitude values b1 to b3072 and 1024 basic amplitudes, respectively. Contains the values c1 to c1024.
- Waveform data strings [a1, a2, a3, ..., a3072], [b1, b2, b3, ..., b3072], [c1, c2, c3, ..., c1024] are the basic amplitudes. It represents an envelope constructed by values a1 to a3072, b1 to b3072, and c1 to c1024. The three envelopes represent basic waveforms whose basic waveform IDs are fw_id1 to fw_id3.
- FIG. 9 is a diagram illustrating third data stored in the memory 250.
- the third data is data in which the vibration pattern, the basic waveform ID, and the coefficient matrix are associated with each other.
- FIG. 9 shows P1 to P4 as pattern data representing the vibration pattern.
- Fw_id1 to fw_id3 are shown as basic waveform IDs.
- four matrices as shown in FIG. 9 are shown as coefficient matrices.
- the vibration pattern is the same as the vibration pattern shown in FIG. 7, and the basic waveform ID is the same as the basic waveform ID shown in FIG.
- the coefficient matrix is, for example, data in the form of a matrix of 3 rows and 8 columns or 3 rows and 6 columns in FIG.
- the coefficient matrix is information representing the ratio of the first frequency to the fundamental frequency (first frequency magnification), the number of periods of the first waveform, and the magnification of the amplitude of the first waveform relative to the amplitude of the basic waveform (amplification multiplication factor). including.
- the magnification of the first frequency with respect to the fundamental frequency is represented by the number of rows of the coefficient matrix.
- the magnification of the top row of the coefficient matrix is 1, the magnification of the second row from the top is 2 times, and the magnification of the fourth row from the top is 4 times.
- the number of periods of the first waveform is represented by the number of columns of the coefficient matrix.
- the coefficient matrix of 3 rows and 8 columns shown in FIG. 9 can define a first waveform with a maximum of 8 periods, and the coefficient matrix of 3 rows and 6 columns can define a first waveform with a maximum of 6 periods. it can.
- the magnification of the amplitude of the first waveform with respect to the amplitude of the basic waveform is a coefficient by which the basic amplitude value is multiplied when the amplitude of the basic waveform data is changed to generate the first waveform data.
- the amplitude multiplication coefficient is represented by a component included in the coefficient matrix.
- the coefficient matrix of the vibration pattern P1 whose basic waveform ID is fw_id1 includes a11, a12, 0, 0, 0, 0, 0, 0 as the amplitude multiplication coefficient whose first frequency multiplication factor is 1.
- a21, a22, a23, a24, 0, 0, 0, 0 are included as amplitude multiplication factors of which the first frequency magnification is twice.
- a31, a32, a33, a34, a35, a36, a37, a38 are included as amplitude multiplication factors with a first frequency magnification of 4 times.
- the amplitude of the fundamental waveform is a11 in the first to second periods, respectively. , A1 times the first waveform having the first amplitude.
- the first amplitude is set to 0. That is, it means that the first waveform is not generated in the third to eighth periods.
- the first waveform When the first frequency magnification is twice, the first waveform has a first frequency that is twice the fundamental frequency, and the amplitude of the fundamental waveform is a21, in the first to fourth periods, respectively. This means that a first waveform having a first amplitude multiplied by a22, a23, and a24 is generated. In addition, since the coefficients in the fifth to eighth periods are all 0, the first amplitude is set to 0. That is, it means that the first waveform is not generated in the fifth to eighth cycles.
- the first waveform When the first frequency magnification is four times, the first waveform has a first frequency that is four times the fundamental frequency, and the amplitude of the fundamental waveform is a31, This means that a first waveform having a first amplitude multiplied by a32, a33, a34, a35, a36, a37, and a38 is generated.
- the coefficient matrix of 3 rows 8 columns or 3 rows 6 columns was demonstrated here, as long as the number of rows of a coefficient matrix is 1 or more, it may be any number, and the number of columns is 1 or more. Any number of rows may be used.
- the multiplication factor of the first frequency represented by the number of rows of the coefficient matrix is 1 in the uppermost row, and the second and subsequent rows are represented by 2 ⁇ , where ⁇ is the number of rows.
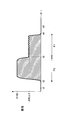
- FIG. 10 is a diagram showing a basic waveform.
- the basic waveform shown as an example in FIG. 10 is given as an envelope constructed by 3072 basic amplitude values.
- the amplitude has five peaks, with the 1536th amplitude being the maximum.
- the basic amplitude value representing such an amplitude is set by the waveform data string shown in FIG.
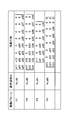
- FIG. 11 is a diagram showing the first frequency magnification and the amplitude multiplication coefficient included in the coefficient matrix in a tabular format.
- the first frequency multiplication factor and amplitude multiplication factor shown in FIG. 11 are constructed so as to be applicable to the basic waveform shown in FIG.
- the first frequency magnification is increased from 1 ⁇ , 2 ⁇ , and 4 ⁇ from the lower row to the upper row. Further, the range of data points is shown in the horizontal direction of the table.
- Each row of the table shown in FIG. 11 is divided into a number of columns equal to the number of periods of the basic waveform or the first waveform included in 3072 data points. For this reason, a row having a first frequency magnification of 1 is divided into 1 column, a row having a first frequency magnification of 2 is divided into 2 columns, and a row having a first frequency magnification of 4 is divided into 4 columns.
- surface shown in FIG. 11 shows an amplitude multiplication factor.
- the amplitude multiplication factor of the row where the first frequency magnification is 1 is “2”
- the 3072 first amplitude values are each obtained by doubling 3072 basic amplitude values.
- the amplitude multiplication factor of the row with the first frequency multiplication factor of 2 is “0.8” for data points 1 to 1536 and “0” for data points 1537 to 3072. Therefore, when the data points are from 1 to 1536, a first waveform having a first frequency that is twice the basic frequency and 0.8 times the amplitude of the basic waveform is obtained. The first amplitude value of the first waveform is obtained by extracting 3072 basic amplitude values every other (one in two) and multiplying the amplitude by 0.8. Since the data points from 1537 to 3072 are “0”, the first amplitude value of the first waveform is 0, and the first waveform is not generated.
- the amplitude multiplication factor of the row where the first frequency multiplication factor is 4 is “1” for data points 1 to 768, “0.5” for data points 769 to 1536, and 1537 data points. From 0 to 3072 is “0”.
- a first waveform having a first frequency that is four times the fundamental frequency and having an amplitude that is one time the fundamental waveform is obtained.
- a first waveform having an amplitude 0.5 times the basic waveform is obtained at a first frequency four times the basic frequency.
- the first amplitude value of the first waveform is obtained by extracting 3072 basic amplitude values every third (one out of four) and multiplying the amplitude by 1 and 0.5 times. Since the data points from 1537 to 3072 are “0”, the first amplitude value of the first waveform is 0, and the first waveform is not generated.
- FIG. 12 is a diagram in which the three first waveforms generated by the basic waveform shown in FIG. 10 and the first frequency multiplication factor and amplitude multiplication factor shown in FIG. 11 are superimposed.
- the first waveform is generated by the waveform generation unit 240A (see FIG. 6).
- FIG. 12 shows the three first waveforms generated by the waveform generation unit 240A in an overlapping manner.
- the waveform indicated by the solid line is the first waveform with the first frequency multiplication factor of 1
- the waveform indicated by the broken line is the first waveform with the first frequency multiplication factor of 2
- the waveform indicated by the alternate long and short dash line is the first frequency.
- the three first waveforms generated by the first frequency multiplication factor and the amplitude multiplication factor shown in FIG. 11 can be generated from the basic waveform shown in FIG.
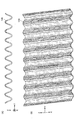
- FIG. 13 is a diagram showing a first combined waveform obtained by combining the three first waveforms shown in FIG.
- the first synthesized waveform is performed by the waveform synthesis unit 240B (see FIG. 6).
- the drive control section 240C includes a first combined amplitude values included in the first composite waveform data, depending on the value of the second frequency ratio a f by reducing the data points are thinned out, generating a second synthesized waveform data in the frequency obtained by multiplying the second frequency ratio a f the frequency of the first composite amplitude value.
- the drive control unit 240C generates the third composite waveform data by changing the amplitude value of the second composite waveform data according to the contact load of the operation input.
- the second frequency ratio a f which is obtained according to the moving speed of the position of the operation input is the '4', and, when the contact load increases in accordance with a change in the position of the operation input, in Figure 13
- the third synthesized waveform data obtained by amplifying the amplitude of the second synthesized waveform obtained by quadrupling the frequency of the first synthesized waveform shown as the contact load increases is generated as amplitude data.
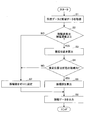
- FIG. 14 is a flowchart illustrating processing executed by the drive control unit 240C of the drive control device 300 of the electronic device 100 according to the first embodiment.
- An OS (Operating System) of the electronic device 100 executes control for driving the electronic device 100 every predetermined control cycle. For this reason, the drive control apparatus 300 performs a calculation for every predetermined control period. The same applies to the drive control unit 240C, and the drive control unit 240C repeatedly executes the flow shown in FIG. 14 at predetermined control cycles.
- the required time ⁇ t is the control time. Approximately equal to the period.
- One cycle time of the control cycle is handled as corresponding to a required time ⁇ t from when the position data is input from the driver IC 151 to the drive control device 300 until the drive signal is calculated based on the position data. it can.
- the drive control unit 240C starts processing when the power of the electronic device 100 is turned on.
- the drive control unit 240C acquires region data associated with the vibration pattern for the GUI operation unit on which the current operation input is performed according to the coordinates represented by the current position data and the type of the current application ( Step S1).
- the drive control unit 240C determines whether or not the moving speed is equal to or higher than a predetermined threshold speed (step S2).
- the moving speed may be calculated by vector calculation.
- the threshold speed may be set as the minimum speed of the fingertip movement speed when performing an operation input while moving the fingertip, such as a so-called flick operation, swipe operation, or drag operation.
- Such a minimum speed may be set based on experimental results, or may be set according to the resolution of the touch panel 150 or the like.
- step S2 If it is determined in step S2 that the moving speed is equal to or higher than the predetermined threshold speed, the drive control unit 240C calculates estimated coordinates after ⁇ t time based on the coordinates represented by the current position data and the moving speed ( Step S3).
- the drive control unit 240C determines whether or not the estimated coordinates after ⁇ t time are in the region St represented by the region data obtained in step S1 (step S4).
- step S5 the drive control unit 240C determines that the estimated coordinates after ⁇ t time are in the region St represented by the region data obtained in step S1
- the drive control unit 240C calculates an amplitude value (step S5).
- the drive control unit 240C obtains the amplitude value in step S5 according to the moving speed of the position of the operation input and the contact load using the first composite waveform data. This is a process for obtaining the amplitude value of the amplitude data to be output.
- step S5 is a process performed by the waveform generation unit 240A, the waveform synthesis unit 240B, and the drive control unit 240C.
- the drive control unit 240C outputs amplitude data (step S6).
- the amplitude modulator 320 modulates the amplitude of the sine wave output from the sine wave generator 310 to generate a drive signal and drive the vibration element 140.
- step S2 when it is determined in step S2 that the moving speed is not equal to or higher than the predetermined threshold speed (S2: NO), the estimated coordinates after ⁇ t time in step S4 are in the area St represented by the area data obtained in step S1. If it is determined that there is not, the drive control unit 240C sets the amplitude value to zero (step S7).
- the drive control unit 240C outputs amplitude data having an amplitude value of zero, and the amplitude modulator 320 generates a drive signal in which the amplitude of the sine wave output from the sine wave generator 310 is modulated to zero.
- the vibration element 140 is not driven.
- FIG. 15 is a flowchart showing detailed processing contents of the processing in step S5 shown in FIG.
- the process illustrated in FIG. 15 is a process executed by the waveform generation unit 240A, the waveform synthesis unit 240B, and the drive control unit 240C. 15 is performed when the electronic device 100 (see FIG. 6) is executing an application, the application ID illustrated in FIG. 7 is assumed to be specified.
- the waveform generation unit 240A refers to the region data of the first data (see FIG. 7), and determines a vibration pattern corresponding to the region data including the position data (step S51).
- the waveform generation unit 240A refers to the third data (see FIG. 9) and determines a basic waveform ID and a coefficient matrix corresponding to the vibration pattern (step S52). As a result, the first frequency magnification, the number of periods of the first waveform, and the amplitude multiplication factor are determined.
- the waveform generation unit 240A refers to the second data (see FIG. 8) and determines a waveform data string corresponding to the basic waveform ID acquired in Step S52 (Step S53). Thereby, a basic amplitude value is determined, and an envelope constructed by the basic amplitude value is determined. The envelope represents the basic waveform. In step S53, for example, a basic waveform as shown in FIG. 10 is determined.
- the waveform generation unit 240A generates first waveform data using the waveform data string and the coefficient matrix (step S54). For example, when the first frequency magnification and the amplitude multiplication coefficient as shown in FIG. 11 are used for the basic waveform as shown in FIG. 10, three first waveforms representing the three first waveforms as shown in FIG. Data is generated.
- the waveform synthesizer 240B synthesizes a plurality of first waveform data to generate first synthesized waveform data (step S55). For example, when three first waveforms as shown in FIG. 12 are synthesized, first synthesized waveform data representing the first synthesized waveform as shown in FIG. 13 is generated. One of the plurality of first waveform data may be the same as the basic waveform data.
- the drive control section 240C from the moving velocity v of the operation input, to calculate a second frequency ratio a f (step S56).
- the second frequency magnification af is obtained using equations (3), (4), and (5).
- the drive control section 240C generates the second composite waveform data obtained by the data points of the first composite amplitude values included in the first synthesized waveform data to 1 / a f (step S57). That is, the drive control section 240C, by extracting the first composite amplitude value (a f -1) pieces every in the first time-axis direction, generates a second composite waveform data in which the data points to 1 / a f To do.
- the drive control unit 240C performs the first synthesis every other (one for every two).
- the amplitude value is extracted to generate second synthesized waveform data having 768 data points.
- the frequency of the second synthesized waveform data is twice the frequency of the first synthesized waveform data.
- Step S58 The Drive control section 240C calculates the amplitude ratio a a from the contact load (step S58).
- the contact load is obtained based on the contact area of the operation input as described above.
- Drive control section 240C generates the third synthesized waveform data by multiplying the amplitude ratio a a a second composite amplitude value included in the second composite waveform data generated in step S57 (step S59).
- the amplitude value of the third combined waveform data is finally output from the drive control unit 240C to the amplitude modulator 320 as amplitude data.
- the amplitude value of the amplitude data is set.
- the natural friction of the ultrasonic band of the top panel 120 is generated and the dynamic friction force applied to the user's fingertip is changed, so that a good tactile sensation is provided to the user. be able to.
- electronic device 100 of Embodiment 1 generates a drive signal by modulating only the amplitude of the sine wave of the ultrasonic band generated by sine wave generator 310 by amplitude modulator 320.
- the frequency of the sine wave of the ultrasonic band generated by the sine wave generator 310 is equal to the natural frequency of the top panel 120, and this natural frequency is set in consideration of the vibration element 140.
- the drive signal is generated by modulating only the amplitude by the amplitude modulator 320 without modulating the frequency or phase of the sine wave of the ultrasonic band generated by the sine wave generator 310.
- the natural vibration of the ultrasonic band of the top panel 120 can be generated in the top panel 120, and the coefficient of dynamic friction when the finger traces the surface 120A of the top panel 120 with the use of the air layer due to the squeeze effect. Can be reliably reduced. Further, the sticky-band illusion effect or the Fishbone Tactile Illusion effect can provide the user with a good tactile sensation such that the surface 120A of the top panel 120 is uneven.
- the vibration is generated. Further, vibration can be generated while the fingertip is touching a predetermined GUI operation unit or the like.
- the mode in which the vibration element 140 is switched on / off in order to provide the user with a tactile sensation such that the top panel 120 has unevenness has been described.
- To turn off the vibrating element 140 is to set the amplitude value represented by the drive signal for driving the vibrating element 140 to zero.
- the vibration element 140 does not necessarily have to be turned off from on.
- a state in which the vibration element 140 is driven with a small amplitude may be used.
- the user may be provided with a tactile sensation such that the top panel 120 has irregularities as in the case where the vibration element 140 is turned off.
- the vibration element 140 is driven with a drive signal that switches the strength of vibration of the vibration element 140.
- the strength of the natural vibration generated in the top panel 120 is switched, and it is possible to provide a tactile sensation such that the user's fingertip has unevenness.
- the vibration element 140 is turned off when the vibration is weakened to switch the vibration strength of the vibration element 140, the vibration element 140 is turned on / off. Switching the vibration element 140 on / off is to drive the vibration element 140 intermittently.
- the drive control device 300 As described above, according to the first embodiment, it is possible to provide the drive control device 300, the electronic device 100, and the drive control method that can provide a good tactile sensation.
- the basic waveform data is stored in the memory 250, the first waveform is obtained based on the basic waveform data and the first frequency multiplication factor and the amplitude multiplication factor included in the coefficient matrix, and a plurality of first waveforms are obtained.
- a first synthesized waveform is obtained based on the waveform.
- a second synthesized waveform can be obtained based on the first synthesized waveform, and further, a third synthesized waveform used as amplitude data can be obtained based on the second synthesized waveform.
- the data representing the waveform stored in the memory 250 need only be the basic waveform data. There may be one type of basic waveform data. Even when only one type of basic waveform data is stored in the memory 250, various first waveforms can be obtained by setting the first frequency multiplication factor and the amplitude multiplication factor included in the coefficient matrix to various values. The first waveform data representing can be generated, and various amplitude data can be generated.
- the amount of data stored in the memory 250 can be significantly reduced. This means that, for example, in order to output a plurality of types of amplitude data, the amount of data is greatly reduced compared to the case where it is necessary to hold waveform data corresponding to each amplitude data.
- the third synthesis waveform data increases the amplitude by using the amplitude ratio a a a second composite waveform data, the amplitude value of the third combined waveform data in accordance with an increase in the contact load from the second synthesized wave data Therefore, the operability can be further improved.
- the second synthesized waveform data does not generate a third combined waveform data increases the amplitude by using the amplitude ratio a a would drive the vibrating element 140 by using the second synthesis waveform data as the amplitude data .
- the vibration element 140 is used using the 1st synthetic
- the first waveform data representing may be generated.
- the drive control unit 240C generates the second combined waveform data based on the first combined waveform data generated by the waveform combining unit 240B, and further uses the third combined waveform data generated as the amplitude data, so that the vibration element is used.
- the mode of adjusting the intensity of the drive signal used for driving 140 has been described.
- the third synthesized waveform data generates the second synthesized waveform data by thinning out and reducing the number of data points of the first synthesized waveform data according to the degree of temporal change in the position of the operation input, and the second synthesized waveform data. It is generated by changing the composite amplitude value according to the contact load of the operation input.
- the drive control unit 240C may not reduce the number of data points of the first combined waveform data according to the degree of temporal change in the position of the operation input. In addition, the drive control unit 240C may not change the second composite amplitude value of the second composite waveform data according to the contact load of the operation input.
- the drive control unit 240C uses the first composite amplitude value of the first composite waveform data as the contact load of the operation input without reducing the number of data points of the first composite waveform data according to the degree of temporal change in the position of the operation input. You may change according to.
- the drive control unit 240C does not reduce the number of data points of the first synthesized waveform data in accordance with the temporal change degree of the position of the operation input, and inputs the second synthesized amplitude value of the second synthesized waveform data. It is not necessary to change according to the contact load. In this case, the amplitude data output by the drive control unit 240C as the amplitude data is equal to the first combined waveform data generated by the waveform combining unit 240B.
- the second data is stored in the memory 250 in advance, and the first data and the third data are selected according to the content of the user's operation input.
- the form in which data is generated by the data generation unit 240D has been described.
- the second data may also be generated by the data generation unit 240D according to the content of the user's operation input.
- one of the first data and the third data is stored in the memory 250 in advance, and the user generates the other of the first data and the third data. You may do it.
- the drive control device 300 includes the data generation unit 240D.
- the data generation unit 240D generates the first data and the third data, or the first data, the second data, and the third data according to the content of the user's operation input.
- the drive control apparatus 300 may not include the data generation unit 240D.
- the drive control device 300 generates ultrasonic vibration generated based on the first data, the second data, and the third data stored in advance in the memory 250 in response to a user's operation input.
- the waveform generation unit 240A generates the first waveform data
- the waveform synthesis unit 240B generates the first synthesized waveform data by synthesizing the basic waveform data and the first waveform data, and the first synthesized waveform data is generated.
- the drive control unit 240C generates the second combined waveform data and the third combined waveform data.
- the processing of the waveform generation unit 240A, the waveform synthesis unit 240B, and the drive control unit 240C may be modified as follows.
- FIG. 16 is a flowchart showing processing according to a modification of the flowchart shown in FIG.
- the process illustrated in FIG. 16 is a process executed by the waveform generation unit 240A, the waveform synthesis unit 240B, and the drive control unit 240C. 16 is performed when the electronic device 100 (see FIG. 6) is executing an application, the application ID illustrated in FIG. 7 will be described as being specified.
- steps S51 to S53 is the same as that of steps S51 to S53 shown in FIG.
- the waveform generation unit 240A determines the waveform data string in step S53, the waveform generation unit 240A calculates the frequency shift amount s f from the moving speed v of the operation input (step S154).
- the frequency shift amount s f is obtained by Expression (4).
- the waveform generation unit 240A generates a shift coefficient matrix in which the coefficient matrix components are shifted to the higher frequency side row by the frequency shift amount s f (step S155).
- the coefficient matrix is a 3 ⁇ 8 coefficient matrix corresponding to the vibration pattern P1 shown in FIG. 9 and the frequency shift amount s f is “2”
- the components of the 3 ⁇ 8 coefficient matrix are Shifted down 2 rows (high frequency side), the top row where the frequency magnification is 1 and the second row from the top (components of 2 rows and 8 columns) are all '0'.
- a 5-by-8 shift coefficient matrix is generated. This process will be described later with reference to FIG.
- Waveform generating unit 240A calculates the amplitude ratio a a from the contact load (step S156).
- the contact load is obtained based on the contact area of the operation input as described above.
- the waveform generation unit 240A calculates the contact load of the operation input based on the contact area represented by the area data input from the drive control unit 240C. Note that position data and data representing the contact area may be directly input from the driver IC 151 to the waveform generation unit 240A.
- the waveform generating unit 240A to all the components of the shift coefficient matrix generated in step S155, generates a multiplication coefficient matrix obtained by multiplying the amplitude ratio a a calculated in step S156 (step S157).
- the waveform synthesizer 240B synthesizes a plurality of first waveform data obtained from the waveform data string determined in step S53 and the multiplication coefficient matrix, and generates first synthesized waveform data (step S158).
- the amplitude value of the amplitude data is set.
- the first combined waveform data generated in step S158 is output to the amplitude modulator 320 (see FIG. 6) as amplitude data by the drive control unit 240C.
- FIG. 17 is a diagram illustrating the process of generating the shift coefficient matrix in step S155.
- the amplitude multiplication factor is set to a21, a22, a23, a24, 0, 0, 0, 0.
- the amplitude multiplication coefficient is set to a31, a32, a33, a34, a35, a36, a37, a38.
- the waveform generation unit 240A shifts the components of the coefficient matrix of 3 rows and 8 columns downward (high frequency side) by the amount of the frequency shift amount s f , and shifts the row to the blank. Set all components to '0'.
- the frequency shift amount s f is “2”
- the component of the coefficient matrix of 3 rows and 8 columns shown in the upper side of FIG. 17 is shifted downward by 2 rows (high frequency side), and the frequency multiplication factor is 1 ⁇ .
- the components in the top row and the second row from the top are all set to “0”.
- the waveform generation unit 240A generates a shift coefficient matrix of 5 rows and 8 columns shown on the lower side of FIG.
- the waveform generating unit 240A generates a multiplication coefficient matrix obtained by multiplying the amplitude ratio a a to all components of the shift coefficient matrix, the waveform synthesis section 240B includes a plurality of determined and waveform data sequence, by the multiplication coefficient matrix first One waveform data is synthesized to generate first synthesized waveform data.
- the first combined waveform data generated by the processing shown in FIG. 16 is output to the amplitude modulator 320 (see FIG. 6) as amplitude data by the drive control unit 240C.
- FIG. 18 is a diagram illustrating a cross section of an electronic device 100A according to a modification of the first embodiment.
- the cross section shown in FIG. 18 corresponds to the cross section taken along the line AA shown in FIG.
- an XYZ coordinate system which is an orthogonal coordinate system is defined as in FIG.
- the electronic device 100A includes a housing 110B, a top panel 120, a panel 121, a double-sided tape 130, a vibration element 140, a touch panel 150, a display panel 160A, and a substrate 170.
- the electronic device 100A has a configuration in which the touch panel 150 of the electronic device 100 illustrated in FIG. 3 is provided on the back surface side (Z-axis negative direction side). Therefore, as compared with the electronic device 100 shown in FIG. 3, the double-sided tape 130, the vibration element 140, the touch panel 150, and the substrate 170 are disposed on the back side.
- the housing 110B is formed with a recess 110A on the Z-axis positive direction side and a recess 110C on the Z-axis negative direction side.
- a display panel 160A is disposed inside the recess 110A and is covered with the top panel 120.
- a substrate 170 and a touch panel 150 are provided inside the recess 110 ⁇ / b> C, the panel 121 is fixed to the housing 110 ⁇ / b> B with a double-sided tape 130, and the vibrating element 140 is provided on the surface of the panel 121 on the Z axis positive direction side. Is provided.
- the electronic device 100A shown in FIG. 18 if the natural vibration of the ultrasonic band is generated in the panel 120A by switching on / off the vibration element 140 in response to an operation input to the panel 120A, the electronic device shown in FIG. Similar to the device 100, it is possible to provide the electronic device 100A that allows the user to perceive a tactile sensation corresponding to an image displayed on the display panel 160 with the sense of a fingertip.
- Touch panel 150 is provided on the front side and the back side in combination with the structure shown in FIG. 3 and the structure shown in FIG. May be.
- FIG. 19 is a diagram illustrating an electronic apparatus 100B according to a modification of the first embodiment.
- the electronic device 100B is a notebook PC (Personal Computer).
- the PC 100B includes a display panel 160B1 and a touch pad 160B2.
- FIG. 20 is a diagram illustrating a cross-section of the touch pad 160B2 of the electronic device 100B according to the modification of the first embodiment.
- the cross section shown in FIG. 20 corresponds to the cross section taken along the line AA shown in FIG.
- an XYZ coordinate system which is an orthogonal coordinate system is defined as in FIG.
- the touch pad 160B2 has a configuration in which the display panel 160 is removed from the electronic device 100 illustrated in FIG.
- the natural vibration of the ultrasonic band can be generated in the top panel 120 by switching on / off the vibration element 140 in accordance with an operation input to the touch pad 160B2.
- an operational feeling can be provided to the user's fingertip through a tactile sensation according to the amount of operation input to the touch pad 160B2.
- the vibration element 140 is provided on the back surface of the display panel 160B1, the user can operate the fingertip of the user through the tactile sensation according to the amount of operation input to the display panel 160B1 as in the electronic device 100 shown in FIG. A feeling can be provided.
- the electronic device 100 illustrated in FIG. 3 may be provided instead of the display panel 160B1.
- FIG. 21 is a plan view showing an operating state of an electronic device 100C according to a modification of the first embodiment.
- the electronic device 100C includes a housing 110, a top panel 120C, a double-sided tape 130, a vibration element 140, a touch panel 150, a display panel 160, and a substrate 170.
- Electronic device 100C shown in FIG. 21 has the same configuration as that of educational tactile sensation providing device 100 of Embodiment 1 shown in FIG. 3 except that top panel 120C is curved glass.
- FIG. 21 shows the cross-sectional shape of the top panel 120C in the YZ plane, and the cross-sectional shape in the XZ plane is the same.
- a good tactile sensation can be provided by using the curved glass top panel 120C. This is particularly effective when the actual shape of an object displayed as an image is curved.
- the drive control device and electronic device of the second embodiment have the same configurations as the drive control device 300 and electronic device 100 of the first embodiment, respectively.
- the drive control apparatus and electronic device of the second embodiment are different from the structure of the first embodiment in the structure of the second data and the third data stored in the memory 250.
- FIG. 22 is a diagram showing a second basic waveform additionally used in the second embodiment.
- the second basic waveform shown as an example in FIG. 22 is given as an envelope constructed by 2048 basic amplitude values.
- the amplitude has five peaks, and the 1024th amplitude is the maximum.
- the basic amplitude value representing such amplitude is set by the waveform data string shown in FIG.
- the basic waveform shown in FIG. 10 is used as the first basic waveform, and the amplitude data is generated using the second basic waveform shown in FIG.
- the second basic waveform is an example of a sub basic waveform.
- the second basic waveform shown in FIG. 22 has a second basic frequency that is 1.5 times the basic frequency of the basic waveform shown in FIG.
- the second fundamental frequency is not limited to 1.5 times the fundamental frequency, but may be any numerical value as long as it is not an integral multiple of the fundamental frequency but a decimal (a number including an integer part and a decimal part) multiple. It's okay.
- FIG. 23 is a diagram illustrating second data stored in the memory 250 according to the second embodiment.
- the second data of the second embodiment has a data format in which [ ⁇ 1, ⁇ 2, ⁇ 3,..., ⁇ 2048] is added to the waveform data string whose basic waveform ID is fw_id1 shown in FIG.
- the waveform data string [ ⁇ 1, ⁇ 2, ⁇ 3,..., ⁇ 2048] includes 2048 basic amplitude values ⁇ 1 to ⁇ 2048.
- the waveform data string [ ⁇ 1, ⁇ 2, ⁇ 3,..., ⁇ 2048] represents an envelope constructed by the basic amplitude values ⁇ 1 to ⁇ 2048.
- This envelope represents the second basic waveform having the basic waveform ID fw_id1 shown in FIG.
- FIG. 24 is a diagram illustrating third data stored in the memory 250 according to the second embodiment.
- the third data in the second embodiment has a structure in which a coefficient matrix corresponding to the second basic waveform is added to the third data shown in FIG.
- FIG. 24 illustrates a coefficient matrix having a vibration pattern P1 and a basic waveform ID fw_id21.
- This coefficient matrix includes a coefficient matrix whose basic waveform ID is fw_id1 in the vibration pattern P1 shown in FIG. 9 as a first coefficient matrix, and adds the following second coefficient matrix.
- the second coefficient matrix includes ⁇ 11, ⁇ 12, ⁇ 13, 0, 0, 0, 0, 0, 0, 0, 0 as the amplitude multiplication coefficients with the first frequency multiplication factor of 1.
- ⁇ 21, ⁇ 22, ⁇ 23, ⁇ 24, ⁇ 25, ⁇ 26, 0, 0, 0, 0, 0, 0 are included as amplitude multiplication factors of which the first frequency magnification is twice.
- ⁇ 31, ⁇ 32, ⁇ 33, ⁇ 34, ⁇ 35, ⁇ 36, ⁇ 37, ⁇ 38, ⁇ 39, ⁇ 310, ⁇ 311, and ⁇ 312 are included as amplitude multiplication factors with a first frequency multiplication factor of 4.
- the first coefficient matrix of the coefficient matrix shown in FIG. 24 is used to generate the first waveform from the first basic waveform shown in FIG. 23, and the second coefficient matrix is the first from the second basic waveform shown in FIG. Used to generate a waveform.
- the first waveform generated from the second basic waveform is an example of the first sub waveform.
- the first waveform generated from the first basic waveform and the first waveform generated from the second basic waveform are synthesized by the waveform synthesizer 240B to generate the first synthesized waveform. Thereafter, as in the first embodiment, the second synthesized waveform is generated based on the first synthesized waveform.
- the basic waveform shown in FIG. 10 is used as the first basic waveform, and amplitude data is generated using the second basic waveform shown in FIG.
- the second basic waveform shown in FIG. 22 has a second basic frequency that is 1.5 times the basic frequency of the basic waveform shown in FIG.
- the user activates an ultrasonic vibration setting application installed in the electronic device 100 (see FIGS. 1 and 6), and performs the following processing to set the preferred ultrasonic vibration in a favorite image or the like. be able to.
- the ultrasonic vibration setting application is executed by the data generation unit 240D (see FIG. 6).
- FIG. 25 is a diagram showing a state in which a dialog box 161 used when setting the first frequency magnification and the amplitude multiplication factor is displayed on the display panel 160.
- the dialog box 161 is displayed on the display panel 160 when the ultrasonic vibration setting application is activated and a mode for setting the first frequency magnification and the amplitude multiplication coefficient is selected.
- the dialog box 161 can set a first frequency magnification and an amplitude multiplication factor used for setting the first waveform.
- a mode in which the first frequency multiplication factor and the amplitude multiplication factor are set using two basic waveforms having basic frequencies A and B will be described.
- the display of the dialog box 161 is the same as the display of the first frequency multiplication factor and the amplitude multiplication factor included in the coefficient matrix shown in the table format in FIG.
- the dialog box 161 displays text boxes 161A, 161A2, 161A4, 161A8, 161B, 161B2, 161B4, 161B8, an end button 161C, a data initialization button 161D, and a drop-down list 161E for selecting a vibration pattern.
- the text boxes 161A, 161A2, 161A4, 161A8, 161B, 161B2, 161B4, and 161B8 are input areas or input units for inputting amplitude multiplication factors.
- a state in which the amplitude multiplication factors of all the text boxes are “0” is shown, but the user can input an arbitrary value into each text box.
- the text box 161A is an input unit for inputting an amplitude multiplication factor for a first waveform having a first frequency multiplication factor of 1 with respect to the first basic waveform of the fundamental frequency A.
- the first basic waveform of the fundamental frequency A is a fundamental waveform having a fundamental amplitude value of 3072 data points.
- the first frequency magnification is obtained using two text boxes 161A. As for the first waveform of 1 times, the amplitude multiplication coefficient for two periods can be input.
- the text boxes 161A2, 161A4, 161A8 are input units for inputting the amplitude multiplication factors of the first waveform with the frequency of the first frequency multiplication factor of 2, 4, and 8 times the fundamental frequency A, respectively. Therefore, FIG. 25 shows four text boxes 161A2, eight text boxes 161A4, and sixteen text boxes 161A8.
- the text box 161B is an input unit for inputting an amplitude multiplication coefficient for the first waveform having a first frequency multiplication factor of 1 with respect to the second basic waveform of the fundamental frequency B.
- the fundamental frequency B is 1.5 times the fundamental frequency A.
- the second basic waveform of the basic frequency B is a basic waveform having a basic amplitude value of 2048 data points.
- the first frequency magnification is 1 ⁇ using three text boxes 161B. For the waveform, an amplitude multiplication factor for three cycles can be input.
- the text boxes 161B2, 161B4, and 161B8 are input units for inputting the first waveform amplitude multiplication coefficient of the first frequency with a frequency of 2 times, 4 times, and 8 times the basic frequency B, respectively. For this reason, FIG. 25 shows six text boxes 161B2, twelve text boxes 161B4, and twenty-four text boxes 161B8.
- the user can set the amplitude multiplication factor and the first frequency magnification to arbitrary values using the dialog box 161 shown in FIG.
- the vibration pattern P1 and the vibration pattern P2 based on the first basic waveform of the basic frequency A and the second basic waveform of the basic frequency B are obtained. Suppose that it was generated.
- the vibration patterns P1 and P2 are different from each other. The vibration generated in the top panel 120 by the vibration patterns P1 and P2 will be described later with reference to FIG.
- the data generation unit 240D When the user performs the processing as described above, the data generation unit 240D generates the third data including the vibration pattern, the basic waveform ID, and the coefficient matrix. The data generation unit 240D stores the third data in the memory 250.
- the vibration patterns are the vibration patterns P1 and P2
- the basic waveform ID is the basic waveform ID of the basic waveforms of the basic frequencies A and B. Note that the basic waveform IDs of the basic waveforms of the basic frequencies A and B are stored in advance in the memory 250 as second data in association with the basic waveform data (waveform data string).
- the coefficient matrix is a coefficient matrix including amplitude multiplication coefficients set in the text boxes 161A, 161A2, 161A4, 161A8, 161B, 161B2, 161B4, and 161B8.
- FIG. 26 is a diagram illustrating an image selected by a user as a setting target of amplitude data.
- FIG. 27 is a diagram illustrating a state of the display panel 160 when amplitude data is set in the image illustrated in FIG.
- the user sets the amplitude multiplication factor or the first frequency magnification as shown in FIG. 25 with the ultrasonic vibration setting application activated in the electronic device 100 (see FIGS. 1 and 6), and the vibration patterns P1 and P2 are set. Then, the image 400 can be displayed on the display panel 160 as shown in FIG.
- the image 400 includes images of peach fruit 401 and leaves 402.
- the ultrasonic vibration setting application activates a graphic design tool so that the user can set ultrasonic vibration in the image 400.
- a graphic design tool for example, the outline of the real 401 and the leaf 402 included in the image 400 is recognized and displayed on the canvas 400A, and the user can paint freely. As long as the vibration pattern can be freely set.
- a palette 403 is displayed on the lower side of the canvas 400A, and the interior of the canvas 400A can be freely painted using dark gray paint and light gray paint. If the button 403A displayed in dark gray is pressed to designate the area to be painted, the designated area is painted in dark gray. If the button 403B displayed in light gray is pressed to designate the area to be painted, the designated area is painted in light gray.
- the vibration pattern P1 is set in an area painted with dark gray paint, and the vibration pattern P2 is set in an area painted with light gray paint.
- dark gray paint and light gray paint are shown, but actually, for example, dark gray paint is red paint and light gray paint is green paint. Also, here, two-color paint is shown as an example, but paint of three or more colors may be prepared.
- the user paints the real 401A with dark gray and the leaves 402A with light gray along the outline of the real 401A and the leaf 402A displayed on the canvas 400A.
- the ultrasonic vibration setting application associates the area data of the area painted in dark gray with the vibration pattern P1, and the area data of the area painted in light gray.
- the first data is created by associating the vibration pattern P2.
- the first data created by the data generation unit 240D in this way is the same as the first data shown in FIG.
- the data generation unit 240D stores the first data in the memory 250.
- the canvas 400A shown in FIG. 27 may be displayed simultaneously with the image 400 shown in FIG. In this way, the user can paint on the canvas 400 ⁇ / b> A while viewing the image 400.
- the area is automatically divided by image processing to generate a default state in which each area is provisionally painted, and painting is started from the default state. You may make it do.
- FIG. 28 is a diagram illustrating vibration patterns P ⁇ b> 1 and P ⁇ b> 2 generated on the top panel 120.
- the horizontal axis represents the time axis
- the vertical axis represents the amplitude value of the amplitude data output from the drive control unit 240.
- the vibration patterns P1 and P2 shown in FIG. 28 are the first frequency magnifications that the user prefers in the dialog box 161 shown in FIG. 25 in order to realize the simulated feel of the peach fruit 401 and the leaf 402 shown in FIG. In the following description, it is assumed that the amplitude multiplication coefficient is set.
- third data including vibration patterns P1 and P2 for realizing a simulated tactile sensation of peach fruit 401 and leaf 402 shown in FIG. 26, and peach as shown in FIG. It is assumed that the first data (see FIG. 7) in which the region data representing the region of the real 401 and the leaf 402 are associated with the vibration patterns P1 and P2 is generated.
- Point A is a point other than peach fruit 401 and leaf 402
- point B is the edge of leaf 402
- point C is the boundary between leaf 402 and fruit 401
- point D is the edge of fruit 401
- E is a point other than peach fruit 401 and leaf 402.
- the drive control device 300 drives the vibration element 140 as shown in FIG.
- the point A is a point other than the peach fruit 401 and the leaf 402, and the vibration patterns P1 and P2 are not set. Do not drive. For this reason, the amplitude is zero.
- the amplitude A100 by the vibration pattern P2 is set to a relatively large value in order to express the smooth feel of the peach leaf 402. This is because, if the amplitude is large, the dynamic friction force applied to the fingertip is reduced due to the squeeze effect, and it becomes easy to slip.
- the vibration pattern P ⁇ b> 1 is set to have an amplitude value smaller than the amplitude A ⁇ b> 100 by the vibration pattern P ⁇ b> 2 in order to express a tactile sensation that combines a slightly rough feeling on the surface of the actual 401 and a smooth feeling. Yes.
- the vibration pattern P1 is set so that the amplitude varies in order to give the surface of the actual 401 a slightly rough feeling.
- the vibration pattern P1 is set to have an amplitude A50 ⁇ 3.
- the amplitude A50 ⁇ 3 means that the center of fluctuation is A50 which is half of the amplitude A100, and the fluctuation width is 3/50 of A50 in the positive and negative directions.
- the user can set the amplitude A50 ⁇ 3 of the vibration pattern P1 assigned to the fruit 401 from the amplitude A100 of the vibration pattern P2 assigned to the leaf 402. Is also set smaller.
- the vibration due to the vibration pattern P ⁇ b> 1 is generated in the top panel 120 until reaching the point D, so that the user can sense the smoothness and roughness of the surface of the peach fruit 401 through the fingertips.
- the point D is a boundary between the peach fruit 401 and a point other than the peach fruit 401 and the leaf 402. Therefore, when the point D is passed, The driving by P1 ends and the amplitude becomes zero.
- the user can set the tactile sensation of the favorite vibration patterns P1 and P2 on the favorite image 400.
- the top panel 120 when the user touches the image 400 after setting, the top panel 120 generates vibrations according to the user's favorite vibration patterns P1 and P2 set according to the position touching the image 400.
- the user's favorite vibration patterns P1, P2 can be freely set in the favorite image 400.
- FIG. 29 is a flowchart illustrating processing executed by the data generation unit 240D of the drive control device 300 when the user sets ultrasonic vibration in an image using the ultrasonic vibration setting application.
- the data generation unit 240D starts the process.
- the data generation unit 240D activates an ultrasonic vibration setting application (step S101). As a result, the user can display a favorite image 400 (see FIG. 26) on the display panel 160.
- the data generation unit 240D recognizes the image 400 selected by the user and displays it on the canvas, and displays the palette 403 below the canvas 400A (step S102).
- the data generation unit 240D determines whether or not the button 403A or the button 403B inside the palette 403 is double-clicked (step S103).
- double-clicking the button 403A or 403B is a command for displaying a dialog box 161 for setting the first frequency magnification and the amplitude multiplication factor.
- the data generation unit 240D determines that the button 403A or the button 403B has been double-clicked (S103: YES)
- the data generation unit 240D displays a dialog box 161 on the display panel 160 (step S104).
- the user can set the amplitude multiplication factor in the text box in the dialog box 161.
- the data generation unit 240D holds the numerical value input in each text box in the memory 250 (step S105).
- the data generation unit 240D determines whether or not the end button 161C has been pressed (step S106).
- step S107 If the data generation unit 240D determines that the end button 161C has been pressed (S106: YES), the data generation unit 240D generates third data based on the amplitude multiplication coefficient input in the text box in step S105 (step S107). If the data generation unit 240D determines that the end button 161C has not been pressed (S106: NO), the flow returns to step S105.
- step S107 When the process of step S107 ends, the data generation unit 240D hides the dialog box 161 (step S108). When the process of step S108 ends, the data generation unit 240D returns the flow to step S103.
- step S103 determines in step S103 that the button 403A or the button 403B inside the palette 403 is not double-clicked (S103: NO), the flow proceeds to step S109.
- the data generation unit 240D activates a graphic design tool (step S109). As a result, the user can freely paint on the canvas 400A.
- a region to be painted on the canvas 400A is designated after a single click on the button 403A, the designated region is painted in dark gray. If a region to be painted on the canvas 400A is designated after single-clicking the button 403B displayed in light gray, the designated region is painted in light gray.
- the data generation unit 240D sets the vibration pattern P1 in an area painted with dark gray paint, and sets the vibration pattern P2 in an area painted with light gray paint.
- the data generation unit 240D determines whether an end command has been input (step S110).
- the end command may be any command as long as it is set in advance. For example, an operation of double-clicking an area other than the canvas 400A and the palette 403 may be set as the end command of the graphic design tool.
- region data representing coordinates of regions painted in dark gray and light gray based on the color data painted on the canvas 400A Further, the first data is generated based on the region data and the vibration pattern (step S111).
- step S111 When the data generation unit 240D generates the first data in step S111, the ultrasonic vibration setting application is terminated (step S112).
- step S110 If the data generation unit 240D determines in step S110 that an end command has not been input (S110: NO), the flow returns to step S103.
- the first data and the third data set as described above and the second data stored in advance in the memory 250 are used, it is used when the fingertip touches the image of the real 401 and the leaf 402 shown in FIG. It is possible to generate ultrasonic vibrations representing the user's favorite tactile sensation.
- the drive control apparatus 300 can freely set the user's favorite vibration patterns P1 and P2 in the favorite image 400.
Landscapes
- Engineering & Computer Science (AREA)
- General Engineering & Computer Science (AREA)
- Theoretical Computer Science (AREA)
- Human Computer Interaction (AREA)
- Physics & Mathematics (AREA)
- General Physics & Mathematics (AREA)
- User Interface Of Digital Computer (AREA)
Abstract
良好な触感を提供できる駆動制御装置、電子機器、駆動制御プログラム、及び駆動制御方法を提供する。 駆動制御装置は、表示部と、表示部の表示面側に配設され、操作面を有するトップパネルと、操作面に行われる操作入力の座標を検出する座標検出部と、操作面に振動を発生させる振動素子とを含む電子機器の振動素子を駆動する駆動制御装置であって、操作面に超音波帯の固有振動を発生させる駆動信号の振幅の時間変化を表す基本波形であって、時系列的に配列される所定の数の振幅値で構築される基本波形を表す基本波形データを格納するデータ格納部と、基本波形データの周波数又は振幅を変化させた第1波形を表す第1波形データを生成する波形生成部と、基本波形と、第1波形とを合成した合成波形を表す第1合成波形データを生成する波形合成部と、第1合成波形データに基づいて駆動信号の振幅を変化させることにより、振動素子を駆動する駆動制御部とを含む。
Description
本発明は、駆動制御装置、電子機器、駆動制御プログラム、及び駆動制御方法に関する。
従来より、表示手段と、使用者の操作部位の前記表示手段への接触状態を検出する接触検出手段と、前記表示手段に接触している前記操作部位に対し、所定の触感を与える触感振動を発生させる触感振動発生手段とを備える触感呈示装置がある(例えば、特許文献1参照)。
この触感呈示装置は、さらに、前記接触検出手段による検出結果に基づいて、前記触感振動を発生させるための波形データを生成する振動波形データ生成手段を備える。また、この触感呈示装置は、さらに、前記振動波形データ生成手段により生成された前記波形データに対し超音波を搬送波として変調処理を行い、該変調処理により生成された超音波変調信号を、前記触感振動を発生させるための信号として前記触感振動発生手段に出力する超音波変調手段とを備える。
また、前記超音波変調手段は、周波数変調又は位相変調のどちらか一方を行う。また、前記超音波変調手段は、更に振幅変調を行う。
ところで、従来の触感呈示装置の超音波の周波数は、可聴帯域より高い周波数(およそ20kHz以上)であればよく、超音波の周波数自体に特に工夫はなされていないため、良好な触感を提供できないおそれがある。
そこで、良好な触感を提供できる駆動制御装置、電子機器、駆動制御プログラム、及び駆動制御方法を提供することを目的とする。
本発明の実施の形態の駆動制御装置は、表示部と、前記表示部の表示面側に配設され、操作面を有するトップパネルと、前記操作面に行われる操作入力の座標を検出する座標検出部と、前記操作面に振動を発生させる振動素子とを含む電子機器の前記振動素子を駆動する駆動制御装置であって、前記操作面に超音波帯の固有振動を発生させる駆動信号の振幅の時間変化を表す基本波形であって、時系列的に配列される所定の数の振幅値で構築される基本波形を表す基本波形データを格納するデータ格納部と、前記基本波形の周波数又は振幅を変化させた第1波形を表す第1波形データを生成する波形生成部と、前記基本波形と、前記第1波形とを合成した第1合成波形、又は、複数の前記第1波形を合成した第1合成波形を表す第1合成波形データを生成する波形合成部と、前記第1合成波形データに基づいて前記駆動信号の振幅を変化させることにより、前記振動素子を駆動する駆動制御部とを含む。
良好な触感を提供できる駆動制御装置、電子機器、駆動制御プログラム、及び駆動制御方法を提供することができる。
以下、本発明の駆動制御装置、電子機器、駆動制御プログラム、及び駆動制御方法を適用した実施の形態について説明する。
<実施の形態1>
図1は、実施の形態1の電子機器100を示す斜視図である。
図1は、実施の形態1の電子機器100を示す斜視図である。
電子機器100は、一例として、タッチパネルを入力操作部とする、スマートフォン端末機、タブレット型コンピュータ、又はゲーム機等である。電子機器100は、タッチパネルを入力操作部とする機器であればよいため、例えば、携帯情報端末機、又は、ATM(Automatic Teller Machine)のように特定の場所に設置されて利用される機器であってもよい。
電子機器100の入力操作部101は、タッチパネルの下にディスプレイパネルが配設されており、ディスプレイパネルにGUI(Graphic User Interface)による様々なボタン102A、又は、スライダー102B等(以下、GUI操作部102と称す)が表示される。
電子機器100の利用者は、通常、GUI操作部102を操作するために、指先で入力操作部101に触れる。
次に、図2を用いて、電子機器100の具体的な構成について説明する。
図2は、実施の形態1の電子機器100を示す平面図であり、図3は、図2に示す電子機器100のA-A矢視断面を示す図である。なお、図2及び図3では、図示するように直交座標系であるXYZ座標系を定義する。
電子機器100は、筐体110、トップパネル120、両面テープ130、振動素子140、タッチパネル150、ディスプレイパネル160、及び基板170を含む。
筐体110は、例えば、樹脂製であり、図3に示すように凹部110Aに基板170、ディスプレイパネル160、及びタッチパネル150が配設されるとともに、両面テープ130によってトップパネル120が接着されている。
トップパネル120は、平面視で長方形の薄い平板状の部材であり、透明なガラス、又は、ポリカーボネートのような強化プラスティックで作製される。トップパネル120の表面(Z軸正方向側の面)120Aは、電子機器100の利用者が操作入力を行う操作面の一例である。
トップパネル120は、Z軸負方向側の面に振動素子140が接着され、平面視における四辺が両面テープ130によって筐体110に接着されている。なお、両面テープ130は、トップパネル120の四辺を筐体110に接着できればよく、図3に示すように矩形環状である必要はない。
トップパネル120のZ軸負方向側にはタッチパネル150が配設される。トップパネル120は、タッチパネル150の表面を保護するために設けられている。なお、トップパネル120の表面120Aに、さらに別なパネル又は保護膜等が設けられていてもよい。
トップパネル120は、Z軸負方向側の面に振動素子140が接着された状態で、振動素子140が駆動されることによって振動する。実施の形態1では、トップパネル120の固有振動周波数でトップパネル120を振動させて、トップパネル120に定在波を生じさせる。ただし、トップパネル120には振動素子140が接着されているため、実際には、振動素子140の重さ等を考慮した上で、固有振動周波数を決めることが好ましい。
振動素子140は、トップパネル120のZ軸負方向側の面において、Y軸正方向側において、X軸方向に伸延する短辺に沿って接着されている。振動素子140は、超音波帯の振動を発生できる素子であればよく、例えば、ピエゾ素子のような圧電素子を含むものを用いることができる。
振動素子140は、後述する駆動制御部から出力される駆動信号によって駆動される。振動素子140が発生する振動の振幅(強度)及び周波数は駆動信号によって設定される。また、振動素子140のオン/オフは駆動信号によって制御される。
なお、超音波帯とは、例えば、約20kHz以上の周波数帯をいう。実施の形態1の電子機器100では、振動素子140が振動する周波数は、トップパネル120の振動数と等しくなるため、振動素子140は、トップパネル120の固有振動数で振動するように駆動信号によって駆動される。
タッチパネル150は、ディスプレイパネル160の上(Z軸正方向側)で、トップパネル120の下(Z軸負方向側)に配設されている。タッチパネル150は、電子機器100の利用者がトップパネル120に触れる位置(以下、操作入力の位置と称す)を検出する座標検出部の一例である。
タッチパネル150の下にあるディスプレイパネル160には、GUIによる様々なボタン等(以下、GUI操作部と称す)が表示される。このため、電子機器100の利用者は、通常、GUI操作部を操作するために、指先でトップパネル120に触れる。
タッチパネル150は、利用者のトップパネル120への操作入力の位置を検出できる座標検出部であればよく、例えば、静電容量型又は抵抗膜型の座標検出部であればよい。ここでは、タッチパネル150が静電容量型の座標検出部である形態について説明する。タッチパネル150とトップパネル120との間に隙間があっても、静電容量型のタッチパネル150は、トップパネル120への操作入力を検出できる。
また、ここでは、タッチパネル150の入力面側にトップパネル120が配設される形態について説明するが、トップパネル120はタッチパネル150と一体的であってもよい。この場合、タッチパネル150の表面が図2及び図3に示すトップパネル120の表面120Aになり、操作面を構築する。また、図2及び図3に示すトップパネル120を省いた構成であってもよい。この場合も、タッチパネル150の表面が操作面を構築する。また、この場合には、操作面を有する部材を、当該部材の固有振動で振動させればよい。
また、タッチパネル150が静電容量型の場合は、トップパネル120の上にタッチパネル150が配設されていてもよい。この場合も、タッチパネル150の表面が操作面を構築する。また、タッチパネル150が静電容量型の場合は、図2及び図3に示すトップパネル120を省いた構成であってもよい。この場合も、タッチパネル150の表面が操作面を構築する。また、この場合には、操作面を有する部材を、当該部材の固有振動で振動させればよい。
ディスプレイパネル160は、例えば、液晶ディスプレイパネル又は有機EL(Electroluminescence)パネル等の画像を表示できる表示部であればよい。ディスプレイパネル160は、筐体110の凹部110Aの内部で、図示を省略するホルダ等によって基板170の上(Z軸正方向側)に設置される。
ディスプレイパネル160は、後述するドライバIC(Integrated Circuit)によって駆動制御が行われ、電子機器100の動作状況に応じて、GUI操作部、画像、文字、記号、図形等を表示する。
基板170は、筐体110の凹部110Aの内部に配設される。基板170の上には、ディスプレイパネル160及びタッチパネル150が配設される。ディスプレイパネル160及びタッチパネル150は、図示を省略するホルダ等によって基板170及び筐体110に固定されている。
基板170には、後述する駆動制御装置の他に、電子機器100の駆動に必要な種々の回路等が実装される。
以上のような構成の電子機器100は、トップパネル120に利用者の指が接触し、指先の移動を検出すると、基板170に実装される駆動制御部が振動素子140を駆動し、トップパネル120を超音波帯の周波数で振動させる。この超音波帯の周波数は、トップパネル120と振動素子140とを含む共振系の共振周波数であり、トップパネル120に定在波を発生させる。
電子機器100は、超音波帯の定在波を発生させることにより、トップパネル120を通じて利用者に触感を提供する。
次に、図4を用いて、トップパネル120に発生させる定在波について説明する。
図4は、超音波帯の固有振動によってトップパネル120に生じる定在波のうち、トップパネル120の短辺に平行に形成される波頭を示す図であり、図4の(A)は側面図、(B)は斜視図である。図4の(A)、(B)では、図2及び図3と同様のXYZ座標を定義する。なお、図4の(A)、(B)では、理解しやすさのために、定在波の振幅を誇張して示す。また、図4の(A)、(B)では振動素子140を省略する。
トップパネル120のヤング率E、密度ρ、ポアソン比δ、長辺寸法l、厚さtと、長辺方向に存在する定在波の周期数kとを用いると、トップパネル120の固有振動数(共振周波数)fは次式(1)、(2)で表される。定在波は1/2周期単位で同じ波形を有するため、周期数kは、0.5刻みの値を取り、0.5、1、1.5、2・・・となる。

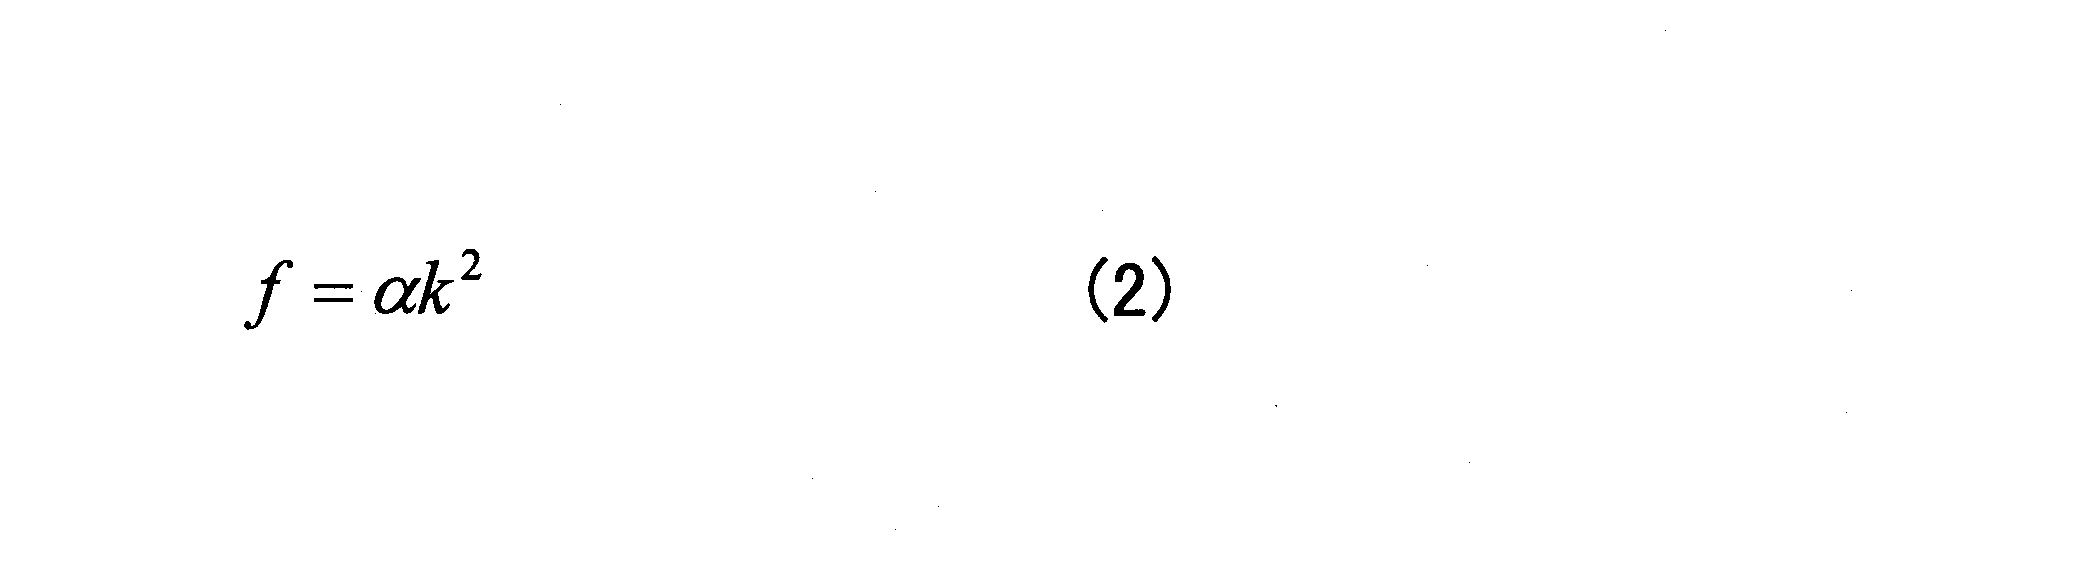
なお、式(2)の係数αは、式(1)におけるk2以外の係数をまとめて表したものである。
図4の(A)、(B)に示す定在波は、一例として、周期数kが10の場合の波形である。例えば、トップパネル120として、長辺の長さlが140mm、短辺の長さが80mm、厚さtが0.7mmのGorilla(登録商標)ガラスを用いる場合には、周期数kが10の場合に、固有振動数fは33.5[kHz]となる。この場合は、周波数が33.5[kHz]の駆動信号を用いればよい。
トップパネル120は、平板状の部材であるが、振動素子140(図2及び図3参照)を駆動して超音波帯の固有振動を発生させると、図4の(A)、(B)に示すように撓むことにより、表面120A(図2及び図3参照)に定在波が生じる。
なお、ここでは、1つの振動素子140がトップパネル120のZ軸負方向側の面において、Y軸正方向側において、X軸方向に伸延する短辺に沿って接着される形態について説明するが、振動素子140を2つ用いてもよい。2つの振動素子140を用いる場合は、もう1つの振動素子140をトップパネル120のZ軸負方向側の面において、Y軸負方向側において、X軸方向に伸延する短辺に沿って接着すればよい。この場合に、2つの振動素子140は、トップパネル120の2つの短辺に平行な中心線を対称軸として、軸対称になるように配設すればよい。
また、2つの振動素子140を駆動する場合は、周期数kが整数の場合は同一位相で駆動すればよく、周期数kが小数(整数部と小数部を含む数)の場合は逆位相で駆動すればよい。
次に、図5を用いて、電子機器100のトップパネル120に生じさせる超音波帯の固有振動について説明する。
図5は、電子機器100のトップパネル120に生じさせる超音波帯の固有振動により、操作入力を行う指先に掛かる動摩擦力が変化する様子を説明する図である。図5の(A)、(B)では、利用者が指先でトップパネル120に触れながら、指をトップパネル120の奥側から手前側に矢印に沿って移動する操作入力を行っている。なお、振動のオン/オフは、振動素子140(図2及び図3参照)をオン/オフすることによって行われる。
また、図5の(A)、(B)では、トップパネル120の奥行き方向において、振動がオフの間に指が触れる範囲をグレーで示し、振動がオンの間に指が触れる範囲を白く示す。
超音波帯の固有振動は、図4に示すようにトップパネル120の全体に生じるが、図5の(A)、(B)には、利用者の指がトップパネル120の奥側から手前側に移動する間に振動のオン/オフを切り替える動作パターンを示す。
このため、図5の(A)、(B)では、トップパネル120の奥行き方向において、振動がオフの間に指が触れる範囲をグレーで示し、振動がオンの間に指が触れる範囲を白く示す。
図5の(A)に示す動作パターンでは、利用者の指がトップパネル120の奥側にあるときに振動がオフであり、指を手前側に移動させる途中で振動がオンになっている。
一方、図5の(B)に示す動作パターンでは、利用者の指がトップパネル120の奥側にあるときに振動がオンであり、指を手前側に移動させる途中で振動がオフになっている。
ここで、トップパネル120に超音波帯の固有振動を生じさせると、トップパネル120の表面120Aと指との間にスクイーズ効果による空気層が介在し、指でトップパネル120の表面120Aをなぞったときの動摩擦係数が低下する。
従って、図5の(A)では、トップパネル120の奥側にグレーで示す範囲では、指先に掛かる動摩擦力は大きく、トップパネル120の手前側に白く示す範囲では、指先に掛かる動摩擦力は小さくなる。
このため、図5の(A)に示すようにトップパネル120に操作入力を行う利用者は、振動がオンになると、指先に掛かる動摩擦力の低下を感知し、指先の滑り易さを知覚することになる。このとき、利用者はトップパネル120の表面120Aがより滑らかになることにより、動摩擦力が低下するときに、トップパネル120の表面120Aに凹部が存在するように感じる。
一方、図5の(B)では、トップパネル120の奥前側に白く示す範囲では、指先に掛かる動摩擦力は小さく、トップパネル120の手前側にグレーで示す範囲では、指先に掛かる動摩擦力は大きくなる。
このため、図5の(B)に示すようにトップパネル120に操作入力を行う利用者は、振動がオフになると、指先に掛かる動摩擦力の増大を感知し、指先の滑り難さ、あるいは、引っ掛かる感じを知覚することになる。そして、指先が滑りにくくなることにより、動摩擦力が高くなるときに、トップパネル120の表面120Aに凸部が存在するように感じる。
以上より、図5の(A)と(B)の場合は、利用者は指先で凹凸を感じ取ることができる。このように人間が凹凸の知覚することは、例えば、"触感デザインのための印刷物転写法とSticky-band Illusion"(第11回計測自動制御学会システムインテグレーション部門講演会論文集 (SI2010, 仙台)____174-177, 2010-12)に記載されている。また、"Fishbone Tactile Illusion"(日本バーチャルリアリティ学会第10 回大会論文集(2005 年9 月))にも記載されている。
なお、ここでは、振動のオン/オフを切り替える場合の動摩擦力の変化について説明したが、これは、振動素子140の振幅(強度)を変化させた場合も同様である。
次に、図6を用いて、実施の形態1の電子機器100の構成について説明する。
図6は、実施の形態1の電子機器100の構成を示す図である。
電子機器100は、振動素子140、アンプ141、タッチパネル150、ドライバIC(Integrated Circuit)151、ディスプレイパネル160、ドライバIC161、制御部200、正弦波発生器310、及び振幅変調器320を含む。
制御部200は、アプリケーションプロセッサ220、通信プロセッサ230、波形生成部240A、波形合成部240B、駆動制御部240C、データ生成部240D、及びメモリ250を有する。制御部200は、例えば、ICチップで実現される。
また、波形生成部240A、波形合成部240B、駆動制御部240C、データ生成部240D、メモリ250、正弦波発生器310、及び振幅変調器320は、駆動制御装置300を構築する。なお、ここでは、アプリケーションプロセッサ220、通信プロセッサ230、波形生成部240A、波形合成部240B、駆動制御部240C、データ生成部240D、及びメモリ250が1つの制御部200によって実現される形態について説明するが、波形生成部240A、波形合成部240B、駆動制御部240C、及びデータ生成部240Dは、制御部200の外部に別のICチップ又はプロセッサとして設けられていてもよい。
この場合には、メモリ250に格納されているデータのうち、駆動制御部240Cの駆動制御に必要なデータは、メモリ250とは別のメモリに格納して、駆動制御装置300の内部に設ければよい。また、波形生成部240A、波形合成部240B、駆動制御部240C、及びデータ生成部240Dが別々のICチップ又はプロセッサによって実現されてもよい。また、波形生成部240A、波形合成部240B、駆動制御部240C、及びデータ生成部240Dのうちのいずれか2つ又は3つが同一のICチップ又はプロセッサによって実現されてもよい。
図6では、筐体110、トップパネル120、両面テープ130、及び基板170(図2参照)は省略する。また、ここでは、アンプ141、ドライバIC151、ドライバIC161、アプリケーションプロセッサ220、通信プロセッサ230、波形生成部240A、波形合成部240B、駆動制御部240C、データ生成部240D、メモリ250、正弦波発生器310、及び振幅変調器320について説明する。
アンプ141は、駆動制御装置300と振動素子140との間に配設されており、駆動制御装置300から出力される駆動信号を増幅して振動素子140を駆動する。
ドライバIC151は、タッチパネル150に接続されており、タッチパネル150への操作入力があった位置を表す位置データを検出し、位置データを制御部200に出力する。この結果、位置データは、アプリケーションプロセッサ220、駆動制御部240C、及びデータ生成部240Dに入力される。なお、位置データが駆動制御部240Cに入力されることは、位置データが駆動制御装置300に入力されることと等価である。
また、ドライバIC151は、位置データを検出する際に、操作入力によってトップパネル120の表面120Aに触れている指先の面積(接触面積)を表す面積データを駆動制御部240Cに出力する。接触面積は、操作入力の接触荷重に応じて変化する。
操作入力の接触荷重とは、指先が表面120Aを押圧する際に、トップパネル120にかかる荷重である。指先がトップパネル120を押圧する力が強ければ、接触荷重は大きくなり、指先の変形量が増えるため、接触面積は大きくなる。一方、指先がトップパネル120を押圧する力が弱ければ、接触荷重は小さくなり、指先の変形量が減るため、接触面積は小さくなる。
なお、タッチパネル150が静電容量型である場合は、ドライバIC151が検出する静電容量によって接触面積を検出すればよい。接触面積が大きくなれば、静電容量は増大し、接触面積が小さくなれば、静電容量は低下する。また、タッチパネル150が抵抗膜型である場合は、ドライバIC151が検出する抵抗値によって接触面積を検出すればよい。接触面積が大きくなれば、抵抗値は低下し、接触面積が小さくなれば、抵抗値は増大する。
ドライバIC161は、ディスプレイパネル160に接続されており、駆動制御装置300から出力される描画データをディスプレイパネル160に入力し、描画データに基づく画像をディスプレイパネル160に表示させる。これにより、ディスプレイパネル160には、描画データに基づくGUI操作部又は画像等が表示される。
アプリケーションプロセッサ220は、電子機器100の種々のアプリケーションを実行する処理を行う。
通信プロセッサ230は、電子機器100が3G(Generation)、4G(Generation)、LTE(Long Term Evolution)、WiFi等の通信を行うために必要な処理を実行する。
波形生成部240Aは、2つの所定の条件が揃った場合に、メモリ250に格納される基本波形データが表す基本波形の周波数又は振幅を変化させた第1波形を表す第1波形データを生成する。なお、2つの所定の条件については後述する。
基本波形データは、基本波形を表すデータである。基本波形は、トップパネル120の表面120A(操作面)に超音波帯の固有振動を発生させる駆動信号の振幅を時間的に変化させるために用いられる基本的な波形である。基本波形は、時系列的に配列される所定の数の振幅値によって構築される包絡線によって表される。基本波形データは、時系列的に配列される基本振幅値であって、基本波形の包絡線を構築する所定の数の振幅値を表す基本振幅値で構築される。
波形生成部240Aは、基本波形データの周波数(基本周波数)よりも高い第1周波数の第1波形データを生成する場合は、基本周波数に対する第1周波数の比(第1周波数倍率)に応じて基本波形データを間引いてデータ点数を減らすことによって、第1波形データを生成する。
基本波形データに含まれる複数の基本振幅値同士の時間軸方向における間隔と、データ点数が間引かれて生成される第1波形データに含まれる複数の第1振幅値同士の時間軸方向における間隔とは等しくされる。
このため、上述のようにデータ点数を減らすことは、第1周波数倍率に応じて基本波形データの周波数を増大させた第1波形データを生成することである。
すなわち、基本波形データを間引いてデータ点数を減らして生成される第1波形データが表す第1波形は、第1周波数倍率に応じて、基本波形を時間軸方向に短縮した波形になる。
第1波形は、時系列的に配列される所定の数の振幅値によって構築される包絡線によって表される。第1波形データは、時系列的に配列され、第1波形の包絡線を構築する所定の数の第1振幅値で構築される。第1振幅値のデータ点数は、基本振幅値のデータ点数に比べて、第1周波数倍率に応じて少なくなっている。
また、波形生成部240Aは、基本波形データの振幅を変化させる場合は、基本振幅値に所定の係数(振幅増倍係数)を乗算する。波形生成部240Aは、基本波形データの振幅を変化させるとともに、基本周波数よりも高い第1周波数に周波数を変化させた第1波形データを生成する場合は、第1周波数倍率に応じて基本波形データを間引いてデータ点数を減らすとともに、振幅を振幅増倍係数倍することによって、第1波形データを生成する。
この場合に、第1波形は、第1周波数倍率に応じて基本波形を時間軸方向に短縮するとともに、振幅が振幅増倍係数倍にされた波形になる。
なお、基本波形と第1波形については、図7乃至図9を用いて後述する。
波形合成部240Bは、基本波形と、第1波形とを合成した第1合成波形、又は、複数の前記第1波形を合成した第1合成波形を表す第1合成波形データを生成する。波形の合成は、基本波形に含まれる振幅を表す複数の基本振幅値と、第1波形に含まれる振幅を表す複数の第1振幅値とを時間的な位置を合わせて合成することによって行われる。
すなわち、時間的な位置が互いに等しい基本振幅値と第1振幅値とが合成されることにより、第1合成振幅値によって構築される第1合成波形データが生成される。基本振幅値と第1振幅値との合成は、振幅値同士を加算することによって行われる。このため、第1合成振幅値は、基本振幅値と、第1振幅値との和で与えられる。
第1合成波形データは、上述のようにして求められるため、第1合成波形は、基本波形を表す包絡線と、第1波形を表す包絡線とを合成した包絡線によって表される。
また、複数の第1波形を合成する場合は、複数の第1振幅値のデータを時間的な位置を合わせて合成すればよい。
なお、第1周波数倍率と振幅増倍係数がともに'1'である場合に生成される第1波形は、基本波形と同一の波形を有する。このような第1波形を、基本波形の周波数又は振幅を変化させた第1波形と合成することは、2つの第1波形を合成することとして捉えることができるとともに、基本波形と第1波形とを合成することとして捉えることができる。
第1合成波形データは、後述する第2合成波形データ及び第3合成波形データを生成するために用いられる。第2合成波形データ及び第3合成波形データは、振動素子140の駆動に用いる駆動信号の強度(振幅)を変調するための振幅値の時間的な変化を表す波形データである。このため、第1合成波形データは、駆動信号の振幅を時間的に変化させるために用いられるデータである。なお、第1合成波形については、図10を用いて後述する。
駆動制御部240Cは、2つの所定の条件が揃った場合に、第1合成波形データに基づいて第3合成波形データを生成し、振幅データとして第3合成波形データを振幅変調器320に出力する。第3合成波形データは、振動素子140の駆動に用いる駆動信号の強度(振幅)を変調するための振幅値の時間的な変化を表す波形データである。
また、駆動制御部240Cは、2つの所定の条件が揃った場合に、位置データを波形生成部240Aに出力する。
第3合成波形データは、操作入力の位置の時間的変化度合に応じて第1合成波形データを間引いてデータ点数を減らして第2合成波形データを生成するとともに、第2合成波形データの振幅値を操作入力の接触荷重に応じて変化させることによって生成される。
ここで、第1合成波形データに含まれる複数の第1合成振幅値同士の時間軸方向における間隔と、データ点数が間引かれて生成される第2合成波形データに含まれる複数の第2合成振幅値同士の時間軸方向における間隔とは等しくされる。
このため、上述のようにデータ点数を減らすことは、時間的変化度合に応じて第1合成波形データの周波数を増大させた第2合成波形データを生成することである。
従って、第3合成波形データは、操作入力の位置の時間的変化度合に応じて第1合成波形データの周波数を増大させて第2合成波形データを生成するとともに、第2合成波形データの振幅値を操作入力の接触荷重に応じて変化させることによって生成される。
なお、上述したように、駆動制御部240Cは、2つの所定の条件が揃った場合に、位置データを波形生成部240Aに出力する。
上述のように、波形生成部240Aに位置データが入力されてから、当該位置データに基づいて駆動制御部240Cが駆動信号を算出するまでの所要時間はΔtである。すなわち、所要時間Δtの間に、波形生成部240Aは、駆動制御部240Cから入手する位置データを用いて第1波形データを生成し、波形合成部240Bは複数の第1波形を合成して第1合成波形データを生成し、駆動制御部240Cは、第1合成波形データに基づいて、最終的な振幅データを生成する。
なお、ドライバIC151から波形生成部240Aに位置データが直接的に入力され、入力された位置データを用いて波形生成部240Aが第1波形データを生成するようにしてもよい。
データ生成部240Dは、利用者の操作入力の内容に応じて、第1データと第3データを生成する。また、第1データ及び第3データに加えて、第2データも生成するようにしてもよい。第1データ、第2データ、及び第3データは、メモリ250に格納される。第1データ、第2データ、及び第3データについては、図7乃至図9を用いて後述する。
ここで、第3合成波形データの生成処理について説明する前に、第3合成波形データの生成処理以外に駆動制御部240Cが実行する処理について説明する。
2つの所定の条件のうちの1つ目の所定の条件に用いる位置データの時間的変化度合としては、利用者の指先がトップパネル120の表面120Aに沿って移動する速度を用いる。利用者の指先の移動速度は、ドライバIC151から入力される位置データの時間的な変化度合に基づいて、駆動制御部240Cが算出する。
また、実施の形態1の駆動制御装置300は、利用者の指先がトップパネル120の表面120Aに沿って移動したときに、指先に掛かる動摩擦力を変化させるためにトップパネル120を振動させる。動摩擦力は、指先が移動しているときに発生するため、駆動制御部240Cは、移動速度が所定の閾値速度以上になったときに、振動素子140を振動させる。移動速度が所定の閾値速度以上になることは、1つ目の所定の条件である。
従って、駆動制御部240Cが出力する振幅データが表す振幅値は、移動速度が所定の閾値速度未満のときはゼロであり、移動速度が所定の閾値速度以上になると、移動速度に応じて所定の振幅値に設定される。
なお、閾値速度は、利用者がトップパネル120の表面120Aに触れた指先を移動させながら操作入力を行う際における指先の移動速度の最低速度として設定すればよい。このような最低速度は、実験結果に基づいて設定してもよく、タッチパネル150の分解能等に応じて設定してもよい。
また、実施の形態1の駆動制御装置300は、操作入力を行う指先の位置が、振動を発生させるべき所定の領域内にある場合に、振幅データを振幅変調器320に出力する。操作入力を行う指先の位置が、振動を発生させるべき所定の領域内にあることは、2つ目の所定条件である。
操作入力を行う指先の位置が振動を発生させるべき所定の領域内にあるかどうかは、操作入力を行う指先の位置が、振動を発生させるべき所定の領域の内部にあるか否かに基づいて判定される。
ここで、ディスプレイパネル160に表示するGUI操作部、画像を表示する領域、又は、ページ全体を表す領域等のディスプレイパネル160上における位置は、当該領域を表す領域データによって特定される。領域データは、すべてのアプリケーションにおいて、ディスプレイパネル160に表示されるすべてのGUI操作部、画像を表示する領域、又は、ページ全体を表す領域について存在する。
このため、2つ目の所定条件として、操作入力を行う指先の位置が、振動を発生させるべき所定の領域内にあるかどうかを判定する際には、電子機器100が起動しているアプリケーションの種類が関係することになる。アプリケーションの種類により、ディスプレイパネル160の表示が異なるからである。
また、アプリケーションの種類により、トップパネル120の表面120Aに触れた指先を移動させる操作入力の種類が異なるからである。トップパネル120の表面120Aに触れた指先を移動させる操作入力の種類としては、例えば、GUI操作部を操作する際には、所謂フリック操作がある。フリック操作は、指先をトップパネル120の表面120Aに沿って、はじく(スナップする)ように比較的短い距離移動させる操作である。
また、ページを捲る場合には、例えば、スワイプ操作を行う。スワイプ操作は、指先をトップパネル120の表面120Aに沿って掃くように比較的長い距離移動させる操作である。スワイプ操作は、ページを捲る場合の他に、例えば、写真を捲る場合に行われる。また、GUI操作部によるスライダー(図1のスライダー102B参照)をスライドさせる場合には、スライダーをドラッグするドラッグ操作が行われる。
ここで一例として挙げるフリック操作、スワイプ操作、及びドラッグ操作のように、トップパネル120の表面120Aに触れた指先を移動させる操作入力は、アプリケーションによる表示の種類によって使い分けられる。このため、操作入力を行う指先の位置が、振動を発生させるべき所定の領域内にあるかどうかを判定する際には、電子機器100が起動しているアプリケーションの種類が関係することになる。
駆動制御部240Cは、領域データを用いて、ドライバIC151から入力される位置データが表す位置が、振動を発生させるべき所定の領域の内部にあるか否かを判定する。
アプリケーションの種類を表すデータと、操作入力が行われるGUI操作部等を表す領域データと、振動パターンを表すパターンデータとを関連付けた第1データは、メモリ250に格納されている。
ここで、振動パターンとは、正弦波発生器310から出力される超音波帯の正弦波信号の振幅が、駆動制御部240Cが出力する振幅データによって変調されることにより、トップパネル120に生じる超音波振動の時間変化の包絡線のパターンである。この振動パターンは、利用者が指先で実際に感じ取ることのできる振動のパターンである。振動パターンによる振動の周波数は、人間の指先で感知される周波数帯域にあるようにするために、例えば、1kHz以下に設定することが好ましい。
また、駆動制御部240Cは、ドライバIC151から駆動制御装置300に位置データが入力されてから、当該位置データに基づいて駆動信号が算出されるまでの所要時間の間における指先の位置の変化分を補間するために、次の処理を行う。
駆動制御装置300は、所定の制御周期毎に演算を行う。これは駆動制御部240Cも同様である。このため、ドライバIC151から駆動制御装置300に位置データが入力されてから、当該位置データに基づいて駆動制御部240Cが駆動信号を算出するまでの所要時間をΔtとすると、所要時間Δtは、制御周期に等しい。
ここで、指先の移動速度は、ドライバIC151から駆動制御装置300に入力される位置データが表す点(x1、y1)を始点とし、所要時間Δtが経過した後の指先の位置を終点(x2、y2)とするベクトルの速度として求めることができる。
駆動制御部240Cは、ドライバIC151から駆動制御装置300に入力される位置データが表す点(x2、y2)を始点とし、所要時間Δtが経過した後の指先の位置を終点(x3、y3)とするベクトルを求めることにより、所要時間Δt経過後の座標(x3、y3)を推定する。
実施の形態1の電子機器100では、上述のようにして所要時間Δt経過後の座標を推定することにより、所要時間Δtの間における指先の位置の変化分を補間する。
このような所要時間Δt経過後の座標を推定する演算は、駆動制御部240Cが行う。駆動制御部240Cは、推定座標が振動を発生させるべき所定の領域の内部にあるか否かを判定し、振動を発生させるべき所定の領域の内部にある場合に振動を発生させる。従って、2つ目の所定の条件は、推定座標が振動を発生させるべき所定の領域の内部にあることである。
以上より、駆動制御部240Cが振幅データを振幅変調器320に出力するために必要な2つの所定の条件は、指先の移動速度が所定の閾値速度以上であることと、推定座標が振動を発生させるべき所定の領域の内部にあることである。
駆動制御部240Cは、指先の移動速度が所定の閾値速度以上であり、推定座標が振動を発生させるべき所定の領域の内部にある場合に、第3合成波形データを生成して、振幅データとして振幅変調器320に出力する。
次に、駆動制御部240Cが実行する第3合成波形データの生成処理について説明する。
実施の形態1では、時間的変化度合に応じて第1合成波形データを間引いてデータ点数を減らす際に、駆動制御部240Cは、次のような処理を行う。
ここで、vは操作入力の移動速度、v0は基準速度である。基準速度v0は、操作入力の移動速度vの基準として用いることができる既知の速度であればよく、例えば、上述した閾値速度を用いてもよい。
また、Int(γ)は、γの値を整数に変換する関数を表しており、例えば、小数点以下切り捨て、又は、小数点第一位を四捨五入等を行うことによって整数値を導出する。
駆動制御部240Cは、次式(3)、(4)、(5)を用いて、移動速度vから、速度比γ、周波数シフト量sf、第2周波数倍率afを求める。

式(3)は、基準速度v0に対する操作入力の移動速度vの比を対数で求める式である。式(4)は、式(3)で求まる比を整数化して周波数シフト量sfを求める式である。このため、式(4)によって求まる整数は、基準速度v0に対する操作入力の移動速度vの比を整数で表す。式(5)は、2のsf乗の値として第2周波数倍率afを求める式である。
駆動制御部240Cは、第1合成波形データに含まれる第1合成振幅値のデータ点数を1/afにした第2合成波形データを生成する。すなわち、駆動制御部240Cは、第1時間軸方向において第1合成振幅値のデータを(af-1)個おきに抽出することにより、データ点数を1/afにした第2合成波形データを生成する。
第1合成振幅値を(af-1)個おきに抽出してデータ点数を1/afにすることは、第2周波数倍率afの値に応じて第1合成振幅値を間引いてデータ点数を減らすことであり、第1合成振幅値の周波数に第2周波数倍率afを乗じた周波数の第2合成波形データを生成することである。
このようにして、第1合成振幅値から第2合成振幅値が生成される。
以上のようにして、駆動制御部240Cは、第1合成波形データから第2合成波形データを生成する。
なお、第2合成波形データは、振幅データとして駆動制御部240Cから振幅変調器320に出力され、正弦波発生器310から出力される超音波帯の正弦波信号の振幅を変調するために用いられる。
第2合成波形の振動は、人間の指先で感知される周波数帯域であるようにするために、例えば、第2合成波形の周波数帯域を1kHz以下に設定することが好ましい。このため、基本波形の周波数は、第1周波数倍率及び第2周波数倍率afを考慮して、例えば、1kHzよりも低い周波数に設定されることが好ましい。
なお、式(3)、(4)、(5)では、2のsf乗の値として第2周波数倍率afを求めているが、2よりも大きい自然数又は1より大きい小数(整数部と小数部とを含む数)を用いてもよい。すなわち、式(5)は一般式としてaf=mnであってもよい。ここで、mは2以上の自然数又は1より大きい小数であり、nは0以上の自然数であり、基準速度v0に対する操作入力の移動速度vの比を表す。mの値が小数である場合には、第1合成波形のデータ点数がmnで割り切れるような整数の値に設定すればよい。また、mの値が小数である場合に、第1合成波形データの最後のデータ点の第1合成振幅値がゼロにならない場合は、ゼロに設定するような処理を行うようにすればよい。
また、実施の形態1では、第2合成波形データによって与えられる駆動信号の振幅値を操作入力の接触荷重に応じて変化させて第3合成波形データを生成する際に、駆動制御部240Cは次のような処理を行う。ここで、駆動制御部240Cは、ドライバIC151から駆動制御部240Cに入力される面積データが表す接触面積に基づいて操作入力の接触荷重を求める。
駆動制御部240Cは、次式(6)により、接触荷重から振幅倍率aaを求め、第2合成波形データに含まれる第2合成振幅値を振幅倍率aa倍した第3合成波形データを振幅データとして振幅変調器320に出力する。
ここで、wは接触荷重、wmaxは最大振幅を出力する接触荷重の値を表す。
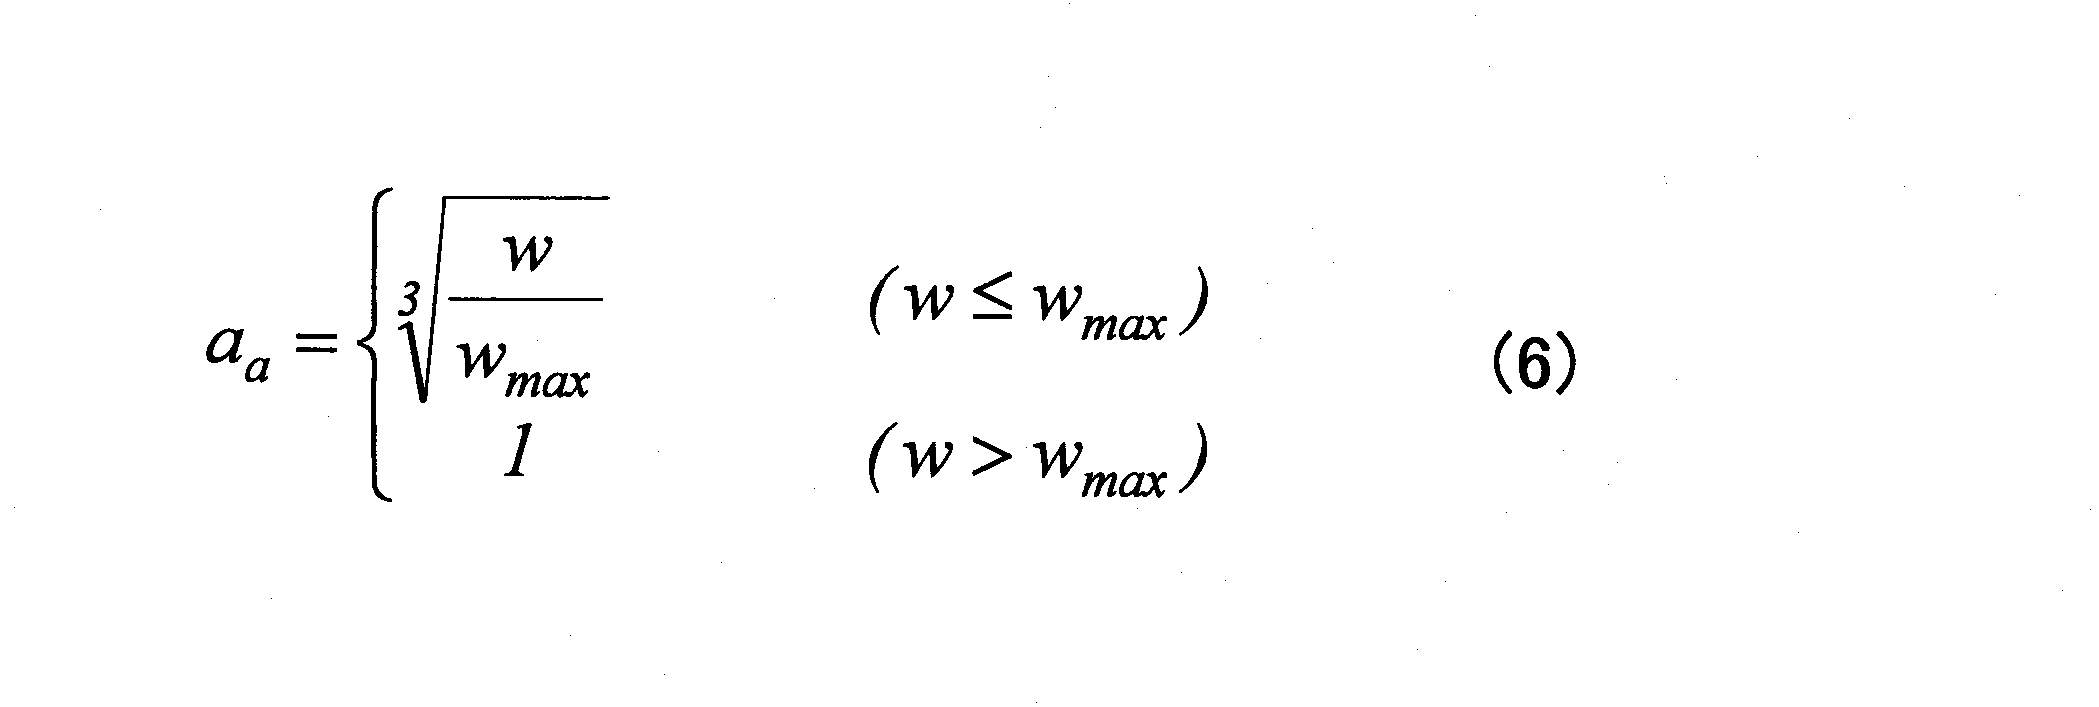
以上のようにして、駆動制御部240Cは、第2合成波形データの振幅を振幅倍率aa倍して第3合成波形データを生成する。
メモリ250は、第1データ、第2データ、及び第3データを格納する。第1データ、第2データ、及び第3データについては、図7乃至図9を用いて後述する。
また、メモリ250は、アプリケーションプロセッサ220がアプリケーションの実行に必要とするデータ及びプログラム、及び、通信プロセッサ230が通信処理に必要とするデータ及びプログラム等を格納する。メモリ250は、データ格納部の一例である。
正弦波発生器310は、トップパネル120を固有振動数で振動させるための駆動信号を生成するのに必要な正弦波を発生させる。例えば、トップパネル120を33.5[kHz]の固有振動数fで振動させる場合は、正弦波の周波数は、33.5[kHz]となる。正弦波発生器310は、超音波帯の正弦波信号を振幅変調器320に入力する。正弦波発生器310が出力する正弦波は、振幅が変調される前の駆動信号であり、一定の周波数と一定の位相で前記操作面に超音波帯の固有振動を発生させる正弦波である。
振幅変調器320は、駆動制御部240Cから入力される振幅データを用いて、正弦波発生器310から入力される正弦波信号の振幅を変調して駆動信号を生成する。この駆動信号は、所定の振動パターンを有する。振幅変調器320は、正弦波発生器310から入力される超音波帯の正弦波信号の振幅のみを変調し、周波数及び位相は変調せずに、所定の振動パターンの駆動信号を生成する。
このため、振幅変調器320が出力する駆動信号は、正弦波発生器310から入力される超音波帯の正弦波信号の振幅のみを変調した超音波帯の正弦波信号である。振幅が変調されるパターンは、所定の振動パターンを表す。なお、振幅データがゼロの場合は、駆動信号の振幅はゼロになる。これは、振幅変調器320が駆動信号を出力しないことと等しい。
次に、図7乃至図9を用いて、メモリ250に格納される、第1データ、第2データ、及び第3データについて説明する。
図7は、メモリ250に格納される第1データを示す図である。
第1データは、アプリケーションの種類を表すアプリケーションID(Identification)と、操作入力が行われるGUI操作部等が表示される領域の座標値を表す領域データと、振動パターンを表すパターンデータとを関連付けたデータである。
図7では、アプリケーションIDとして、app_id1を示す。また、領域データとして、操作入力が行われるGUI操作部等が表示される領域の座標値を表す式f1~f4を示す。また、振動パターンを表すパターンデータとして、P1~P4を示す。
なお、第1データに含まれるアプリケーションIDで表されるアプリケーションは、スマートフォン端末機、タブレット型コンピュータ、又は、ゲーム機等で利用可能なあらゆるアプリケーションを含み、電子メールの編集モードも含む。
図8は、メモリ250に格納される第2データを示す図である。
第2データは、基本波形の種類を表す基本波形ID(Identification)と、波形データ列とを関連付けたデータである。波形データ列は、基本波形データである。
図8には、基本波形IDとしてfw_id1~fw_id3を示す。また、波形データ列として、[a1, a2, a3,・・・, a3072]、[b1, b2, b3,・・・, b3072]、[c1, c2, c3,・・・, c1024]を示す。
波形データ列[a1, a2, a3,・・・, a3072]は、3072個の基本振幅値a1~a3072を含む。波形データ列[b1, b2, b3,・・・, b3072]と[c1, c2, c3,・・・, c1024]は、それぞれ、3072個の基本振幅値b1~b3072と、1024個の基本振幅値c1~c1024とを含む。
波形データ列[a1, a2, a3,・・・, a3072]、[b1, b2, b3,・・・, b3072]、[c1, c2, c3,・・・, c1024]は、それぞれ、基本振幅値a1~a3072、b1~b3072、c1~c1024によって構築される包絡線を表す。3つの包絡線は、基本波形IDがfw_id1~fw_id3の基本波形を表す。
図9は、メモリ250に格納される第3データを示す図である。
第3データは、振動パターンと、基本波形IDと、係数行列とを関連付けたデータである。図9には、振動パターンを表すパターンデータとして、P1~P4を示す。基本波形IDとしてfw_id1~fw_id3を示す。また、係数行列として、図9に示すような4つの行列を示す。なお、振動パターンは図7に示す振動パターンと同一であり、基本波形IDは、図8に示す基本波形IDと同一である。
係数行列は、図9では一例として、3行8列、又は、3行6列の行列の形式のデータである。係数行列は、基本周波数に対する第1周波数の比(第1周波数倍率)と、第1波形の周期数と、基本波形の振幅に対する第1波形の振幅の倍率(振幅増倍係数)とを表す情報を含む。
基本周波数に対する第1周波数の倍率は、係数行列の行数によって表される。係数行列の最も上の行の倍率は1倍であり、上から2行目の行の倍率は2倍であり、上から4行目の行の倍率は4倍である。
第1波形の周期数は、係数行列の列数によって表される。図9に示す3行8列の係数行列は、最大で8周期の第1波形を規定することができ、3行6列の係数行列は、最大で6周期の第1波形を規定することができる。
基本波形の振幅に対する第1波形の振幅の倍率(振幅増倍係数)は、基本波形データの振幅を変化させて第1波形データを生成する際に、基本振幅値に乗算する係数である。振幅増倍係数は、係数行列に含まれる成分によって表される。
図9において、振動パターンP1で基本波形IDがfw_id1の係数行列は、第1周波数倍率が1倍の振幅増倍係数としてa11、a12、0、0、0、0、0、0を含む。また、第1周波数倍率が2倍の振幅増倍係数としてa21、a22、a23、a24、0、0、0、0を含む。さらに、第1周波数倍率が4倍の振幅増倍係数としてa31、a32、a33、a34、a35、a36、a37、a38を含む。
これは、第1周波数倍率が1倍の場合には、基本周波数の1倍の第1周波数を有する第1波形であって、1周期目~2周期目に、それぞれ、基本波形の振幅をa11、a12倍した第1振幅を有する第1波形を生成することを意味する。また、3周期目~8周期目の係数はすべて0であるため、第1振幅は0に設定される。すなわち、3周期目~8周期目には、第1波形を生成しないことを意味する。
また、第1周波数倍率が2倍の場合には、基本周波数の2倍の第1周波数を有する第1波形であって、1周期目~4周期目に、それぞれ、基本波形の振幅をa21、a22、a23、a24倍した第1振幅を有する第1波形を生成することを意味する。また、5周期目~8周期目の係数はすべて0であるため、第1振幅は0に設定される。すなわち、5周期目~8周期目には、第1波形を生成しないことを意味する。
また、第1周波数倍率が4倍の場合には、基本周波数の4倍の第1周波数を有する第1波形であって、1周期目~8周期目に、それぞれ、基本波形の振幅をa31、a32、a33、a34、a35、a36、a37、a38倍した第1振幅を有する第1波形を生成することを意味する。
なお、ここでは、3行8列、又は、3行6列の係数行列について説明したが、係数行列の行数は1行以上であれば何行であってもよく、列数は1列以上であれば何列であってもよい。係数行列の行数によって表される第1周波数の倍率は、最も上の行で1倍であり、2行目以下は、行数をβとすると、2βで表される。
次に、図10乃至図13を用いて、基本波形、第1波形、及び第1合成波形の波形と、係数行列に含まれる第1周波数倍率及び振幅増倍係数とについて説明する。
図10は、基本波形を示す図である。図10に一例として示す基本波形は、3072個の基本振幅値によって構築される包絡線として与えられる。振幅は、5つのピークを有し、1536番目の振幅が最大になっている。このような振幅を表す基本振幅値は、図8に示す波形データ列によって設定される。
図11は、係数行列に含まれる第1周波数倍率及び振幅増倍係数とを表形式で示す図である。図11に示す第1周波数倍率及び振幅増倍係数は、図10に示す基本波形に適用できるように構築されている。
図11に示す表では、下側の行から上側の行に向かって第1周波数倍率が1倍、2倍、4倍と増大するように表されている。また、表の横方向にはデータ点の範囲を示す。
図11に示す表の各行は、3072個のデータ点に含まれる基本波形又は第1波形の周期数に等しい数の列に分けられている。このため、第1周波数倍率が1倍の行は1列、第1周波数倍率が2倍の行は2列、第1周波数倍率が4倍の行は4列に分けられている。
また、図11に示す表に記載されている数値は、振幅増倍係数を示す。例えば、第1周波数倍率が1倍の行の振幅増倍係数は'2'であるため、3072個の第1振幅値は、それぞれ、3072個の基本振幅値を2倍したものになる。
第1周波数倍率が2倍の行の振幅増倍係数は、データ点が1から1536までは'0.8'であり、データ点が1537から3072までは'0'である。このため、データ点が1から1536までは基本周波数の2倍の第1周波数で、基本波形の0.8倍の振幅を有する第1波形が得られる。なお、この第1波形の第1振幅値は、3072個の基本振幅値を1つおきに(2つに1つを)抽出し、振幅を0.8倍にしたものである。なお、データ点が1537から3072までは'0'であるため、第1波形の第1振幅値は、0であり、第1波形は生成されない。
第1周波数倍率が4倍の行の振幅増倍係数は、データ点が1から768までは'1'であり、データ点が769から1536までは'0.5'であり、データ点が1537から3072までは'0'である。
このため、データ点が1から768までは基本周波数の4倍の第1周波数で、基本波形の1倍の振幅を有する第1波形が得られる。また、データ点が769から1536までは基本周波数の4倍の第1周波数で、基本波形の0.5倍の振幅を有する第1波形が得られる。
なお、この第1波形の第1振幅値は、3072個の基本振幅値を3つおきに(4つに1つを)抽出し、振幅を1倍と0.5倍にしたものである。なお、データ点が1537から3072までは'0'であるため、第1波形の第1振幅値は、0であり、第1波形は生成されない。
図12は、図10に示す基本波形と、図11に示す第1周波数倍率及び振幅増倍係数とによって生成される3つの第1波形を重ねて示す図である。第1波形の生成は、波形生成部240A(図6参照)によって行われる。図12には、波形生成部240Aによって生成される3つの第1波形を重ねて示す。
実線で示す波形は、第1周波数倍率が1倍の第1波形であり、破線で示す波形は、第1周波数倍率が2倍の第1波形であり、一点鎖線で示す波形は、第1周波数倍率が4倍の第1波形である。
このように、図10に示す基本波形から、図11に示す第1周波数倍率及び振幅増倍係数とによって生成される3つの第1波形を生成することができる。
図13は、図12に示す3つの第1波形を合成して得る第1合成波形を示す図である。第1合成波形は、波形合成部240B(図6参照)によって行われる。
図11に示す第1周波数倍率及び振幅増倍係数を用いて、図10に示す基本波形の周波数及び振幅を変化させて生成される3つの第1波形(図12参照)を合成することにより、図13に示すようにランダムな振幅が変化する第1合成波形を生成することができる。これは、1つの基本波形から、様々な第1合成波形を生成できることを示している。
また、ここでは第2合成波形を示さないが、上述したように、駆動制御部240Cは、第1合成波形データに含まれる第1合成振幅値を、第2周波数倍率afの値に応じて間引いてデータ点数を減らすことにより、第1合成振幅値の周波数に第2周波数倍率afを乗じた周波数の第2合成波形データを生成する。
例えば、操作入力の位置の移動速度に応じて求まる第2周波数倍率afが'4'である場合は、図13に示す第1合成波形の周波数を4倍にした第2合成波形が生成される。
また、上述したように、駆動制御部240Cは、操作入力の接触荷重に応じて、第2合成波形データの振幅値を変化させて第3合成波形データを生成する。
従って、例えば、操作入力の位置の移動速度に応じて求まる第2周波数倍率afが'4'であり、かつ、接触荷重が操作入力の位置の変化に応じて増大する場合は、図13に示す第1合成波形の周波数を4倍にした第2合成波形の振幅を接触荷重の増大に伴って増幅した第3合成波形データが振幅データとして生成される。
次に、図14を用いて、実施の形態1の電子機器100の駆動制御装置300の駆動制御部240Cが実行する処理について説明する。
図14は、実施の形態1の電子機器100の駆動制御装置300の駆動制御部240Cが実行する処理を示すフローチャートである。
電子機器100のOS(Operating System)は、所定の制御周期毎に電子機器100を駆動するための制御を実行する。このため、駆動制御装置300は、所定の制御周期毎に演算を行う。これは駆動制御部240Cも同様であり、駆動制御部240Cは、図14に示すフローを所定の制御周期毎に繰り返し実行する。
ここで、ドライバIC151から駆動制御装置300に位置データが入力されてから、当該位置データに基づいて振幅変調器320が駆動信号を算出するまでの所要時間をΔtとすると、所要時間Δtは、制御周期に略等しい。
制御周期の1周期の時間は、ドライバIC151から駆動制御装置300に位置データが入力されてから、当該位置データに基づいて駆動信号が算出されるまでの所要時間Δtに相当するものとして取り扱うことができる。
駆動制御部240Cは、電子機器100の電源がオンにされることにより、処理をスタートさせる。
駆動制御部240Cは、現在の位置データが表す座標と、現在のアプリケーションの種類とに応じて、現在操作入力が行われているGUI操作部について、振動パターンと関連付けられた領域データを取得する(ステップS1)。
駆動制御部240Cは、移動速度が所定の閾値速度以上であるか否かを判定する(ステップS2)。移動速度は、ベクトル演算によって算出すればよい。なお、閾値速度は、所謂フリック操作、スワイプ操作、又はドラッグ操作等のように指先を移動させながら操作入力を行う際における指先の移動速度の最低速度として設定すればよい。このような最低速度は、実験結果に基づいて設定してもよく、タッチパネル150の分解能等に応じて設定してもよい。
駆動制御部240Cは、ステップS2で移動速度が所定の閾値速度以上であると判定した場合は、現在の位置データが表す座標と、移動速度とに基づき、Δt時間後の推定座標を演算する(ステップS3)。
駆動制御部240Cは、Δt時間後の推定座標が、ステップS1で求めた領域データが表す領域Stの中になるか否かを判定する(ステップS4)。
駆動制御部240Cは、Δt時間後の推定座標が、ステップS1で求めた領域データが表す領域Stの中にあると判定する場合は、振幅値を算出する(ステップS5)。ステップS5において駆動制御部240Cが振幅値を求める処理は、上述したように、駆動制御部240Cが、第1合成波形データを用いて、操作入力の位置の移動速度と接触荷重に応じて、最終的に出力する振幅データの振幅値を求める処理である。このため、ステップS5は、波形生成部240A、波形合成部240B、及び駆動制御部240Cによって行われる処理である。
駆動制御部240Cは、振幅データを出力する(ステップS6)。これにより、振幅変調器320において、正弦波発生器310から出力される正弦波の振幅が変調されることによって駆動信号が生成され、振動素子140が駆動される。
一方、ステップS2で移動速度が所定の閾値速度以上ではないと判定した場合(S2:NO)と、ステップS4でΔt時間後の推定座標が、ステップS1で求めた領域データが表す領域Stの中にないと判定した場合は、駆動制御部240Cは、振幅値をゼロに設定する(ステップS7)。
この結果、駆動制御部240Cは、振幅値がゼロの振幅データが出力され、振幅変調器320において、正弦波発生器310から出力される正弦波の振幅がゼロに変調された駆動信号が生成される。このため、この場合は、振動素子140は駆動されない。
図15は、図14に示すステップS5の処理の詳細な処理内容を示すフローチャートである。図15に示す処理は、波形生成部240A、波形合成部240B、及び駆動制御部240Cによって実行される処理である。なお、図15に示す処理は、電子機器100(図6参照)がアプリケーションを実行しているときに行われるため、図7に示すアプリケーションIDは、特定されているものとして説明する。
波形生成部240Aは、第1データ(図7参照)の領域データを参照し、位置データが含まれる領域データに対応する振動パターンを決定する(ステップS51)。
次に、波形生成部240Aは、第3データ(図9参照)を参照し、振動パターンに対応する基本波形IDと係数行列を決定する(ステップS52)。これにより、第1周波数倍率、第1波形の周期数、振幅増倍係数が決定する。
次に、波形生成部240Aは、第2データ(図8参照)を参照し、ステップS52で取得した基本波形IDに対応する波形データ列を決定する(ステップS53)。これにより、基本振幅値が決定し、基本振幅値によって構築される包絡線が定まる。包絡線は、基本波形を表す。ステップS53では、例えば、図10のような基本波形が決定する。
次に、波形生成部240Aは、波形データ列と係数行列を用いて、第1波形データを生成する(ステップS54)。例えば、図10のような基本波形に対して、図11に示すような第1周波数倍率と振幅増倍係数を用いると、図12に示すような3つの第1波形を表す3つの第1波形データが生成される。
次に、波形合成部240Bは、複数の第1波形データを合成し、第1合成波形データを生成する(ステップS55)。例えば、図12に示すような3つの第1波形が合成されると、図13に示すような第1合成波形を表す第1合成波形データを生成される。なお、複数の第1波形データのうちの1つは、基本波形データと同一であってもよい。
次に、駆動制御部240Cは、操作入力の移動速度vから、第2周波数倍率afを計算する(ステップS56)。第2周波数倍率afは、式(3)、(4)、(5)を用いて求められる。
次に、駆動制御部240Cは、第1合成波形データに含まれる第1合成振幅値のデータ点数を1/afにした第2合成波形データを生成する(ステップS57)。すなわち、駆動制御部240Cは、第1時間軸方向において第1合成振幅値を(af-1)個おきに抽出することにより、データ点数を1/afにした第2合成波形データを生成する。
例えば、第2周波数倍率afが'2'であり、第1合成波形データのデータ点数が1536である場合は、駆動制御部240Cは、1つおきに(2つにつき1つの)第1合成振幅値を抽出して、データ点数が768の第2合成波形データを生成する。この場合、第2合成波形データの周波数は、第1合成波形データの周波数の2倍である。
駆動制御部240Cは、接触荷重から振幅倍率aaを計算する(ステップS58)。接触荷重は、上述のように操作入力の接触面積に基づいて求められる。
駆動制御部240Cは、ステップS57で生成した第2合成波形データに含まれる第2合成振幅値に振幅倍率aaを乗算して第3合成波形データを生成する(ステップS59)。第3合成波形データの振幅値は、最終的に振幅データとして駆動制御部240Cから振幅変調器320に出力される。
以上により、振幅データの振幅値が設定される。
以上、実施の形態1の電子機器100によれば、トップパネル120の超音波帯の固有振動を発生させて利用者の指先に掛かる動摩擦力を変化させるので、利用者に良好な触感を提供することができる。
また、実施の形態1の電子機器100は、正弦波発生器310で発生される超音波帯の正弦波の振幅のみを振幅変調器320で変調することによって駆動信号を生成している。正弦波発生器310で発生される超音波帯の正弦波の周波数は、トップパネル120の固有振動数に等しく、また、この固有振動数は振動素子140を加味して設定している。
すなわち、正弦波発生器310で発生される超音波帯の正弦波の周波数又は位相を変調することなく、振幅のみを振幅変調器320で変調することによって駆動信号を生成している。
従って、トップパネル120の超音波帯の固有振動をトップパネル120に発生させることができ、スクイーズ効果による空気層の介在を利用して、指でトップパネル120の表面120Aをなぞったときの動摩擦係数を確実に低下させることができる。また、Sticky-band Illusion効果、又は、Fishbone Tactile Illusion効果により、トップパネル120の表面120Aに凹凸が存在するような良好な触感を利用者に提供することができる。
また、制御周期の1周期の時間に相当する所要時間Δtが経過した後の座標を推定して得る推定座標が振動を発生させるべき所定の領域の内部にある場合に振動を発生させるので、実際に指先が所定のGUI操作部等に触れている間に振動を発生させることができる。
なお、制御周期の1周期の時間に相当する所要時間Δt分の遅れが問題にならない場合は、推定座標の演算を行わなくてもよい。
また、以上では、トップパネル120に凹凸が存在するような触感を利用者に提供するために、振動素子140のオン/オフを切り替える形態について説明した。振動素子140をオフにするとは、振動素子140を駆動する駆動信号が表す振幅値をゼロにすることである。
しかしながら、このような触感を提供するために、必ずしも振動素子140をオンからオフにする必要はない。例えば、振動素子140のオフの状態の代わりに、振幅を小さくして振動素子140を駆動する状態を用いてもよい。例えば、振幅を1/5程度に小さくすることにより、振動素子140をオンからオフにする場合と同様に、トップパネル120に凹凸が存在するような触感を利用者に提供してもよい。
この場合は、振動素子140の振動の強弱を切り替えるような駆動信号で振動素子140を駆動することになる。この結果、トップパネル120に発生する固有振動の強弱が切り替えられ、利用者の指先に凹凸が存在するような触感を提供することができる。
振動素子140の振動の強弱を切り替えるために、振動を弱くする際に振動素子140をオフにすると、振動素子140のオン/オフを切り替えることになる。振動素子140のオン/オフを切り替えることは、振動素子140を断続的に駆動することである。
以上、実施の形態1によれば、良好な触感を提供できる駆動制御装置300、電子機器100、及び駆動制御方法を提供することができる。
また、以上では、基本波形データをメモリ250に格納しておき、基本波形データと、係数行列に含まれる第1周波数倍率及び振幅増倍係数とに基づいて第1波形を求め、複数の第1波形に基づいて第1合成波形を求める。また、第1合成波形に基づいて、第2合成波形を求め、さらに、第2合成波形に基づいて、振幅データとして用いる第3合成波形を求めることができる。
このため、メモリ250に格納しておく波形を表すデータは、基本波形データだけでよい。基本波形データは1種類であってもよい。1種類の基本波形データのみがメモリ250に格納されている場合であっても、係数行列に含まれる第1周波数倍率及び振幅増倍係数を様々な値に設定することにより、様々な第1波形を表す第1波形データを生成することができ、様々な振幅データを生成することができる。
従って、実施の形態1によれば、メモリ250に格納するデータ量を大幅に削減することができる。これは、例えば、複数種類の振幅データを出力するために、各振幅データに応じた波形データを保持する必要がある場合に比べて、データ量を大幅に削減することを意味する。
また、第2周波数倍率afを用いて第2合成波形データのデータ点数を第1合成波形データよりも減らせば、操作入力の速度の増加に応じて第2合成波形データの周波数を第1合成波形データよりも高くすることができるので、操作性をより向上させることができる。
また、第2合成波形データに振幅倍率aaを用いて振幅を増大した第3合成波形データを用いれば、接触荷重の増加に応じて第3合成波形データの振幅値を第2合成波形データよりも大きくすることができるので、操作性をより向上させることができる。
なお、第2合成波形データに振幅倍率aaを用いて振幅を増大した第3合成波形データを生成しない場合は、第2合成波形データを振幅データとして用いて振動素子140を駆動することになる。
さらに、第2周波数倍率afを用いて第1合成波形データよりもデータ点数を減らした第2合成波形データをも生成しない場合は、第1合成波形データを振幅データとして用いて振動素子140を駆動することになる。
また、第1合成波形データに振幅倍率aaを用いて振幅を増大した合成波形データを生成する場合は、振幅倍率aaを用いて振幅を増大した合成波形データを振幅データとして用いて振動素子140を駆動することになる。
なお、以上では、基本波形の周波数及び振幅を変化させた第1波形を表す第1波形データを生成する形態について説明したが、基本波形の周波数又は振幅のいずれか一方を変化させた第1波形を表す第1波形データを生成してもよい。
また、以上では、波形合成部240Bが生成する第1合成波形データに基づいて駆動制御部240Cが第2合成波形データを生成し、さらに振幅データとして生成する第3合成波形データを用いて振動素子140の駆動に用いる駆動信号の強度を調整する形態について説明した。
第3合成波形データは、操作入力の位置の時間的変化度合に応じて第1合成波形データのデータ点数を間引いて減らして第2合成波形データを生成するとともに、第2合成波形データの第2合成振幅値を操作入力の接触荷重に応じて変化させることによって生成される。
しかしながら、駆動制御部240Cは、操作入力の位置の時間的変化度合に応じて第1合成波形データのデータ点数を減らなくてもよい。また、駆動制御部240Cは、第2合成波形データの第2合成振幅値を操作入力の接触荷重に応じて変化させなくてもよい。
また、駆動制御部240Cは、操作入力の位置の時間的変化度合に応じて第1合成波形データのデータ点数を減らさずに、第1合成波形データの第1合成振幅値を操作入力の接触荷重に応じて変化させてもよい。
さらに、駆動制御部240Cは、操作入力の位置の時間的変化度合に応じて第1合成波形データのデータ点数を減らさずに、かつ、第2合成波形データの第2合成振幅値を操作入力の接触荷重に応じて変化させなくてもよい。この場合は、駆動制御部240Cが振幅データとして出力する振幅データは、波形合成部240Bによって生成される第1合成波形データと等しくなる。
また、以上では、第1データ、第2データ、及び第3データのうち、第2データは予めメモリ250に格納されており、利用者の操作入力の内容に応じて、第1データと第3データがデータ生成部240Dによって生成される形態について説明した。
しかしながら、第2データも利用者の操作入力の内容に応じてデータ生成部240Dによって生成されてもよい。
また、第2データに加えて第1データと第3データのうちのいずれか一方がメモリ250に予め格納されており、利用者が第1データと第3データのうちのいずれか他方を生成するようにしてもよい。
また、以上では、駆動制御装置300がデータ生成部240Dを含む形態について説明した。データ生成部240Dは、利用者の操作入力の内容に応じて、第1データと第3データ、又は、第1データ、第2データ、及び第3データを生成する。
しかしながら、駆動制御装置300は、データ生成部240Dを含まなくてもよい。この場合には、駆動制御装置300は、メモリ250に予め格納されている第1データ、第2データ、及び第3データに基づいて生成される超音波振動を利用者の操作入力に応じて発生させる。
また、以上では、波形生成部240Aが第1波形データを生成し、波形合成部240Bが基本波形データと第1波形データを合成して第1合成波形データを生成し、第1合成波形データに基づいて駆動制御部240Cが第2合成波形データ及び第3合成波形データを生成する形態について説明した。しかしながら、波形生成部240A、波形合成部240B、及び駆動制御部240Cの処理は、次のように変形してもよい。
図16は、図15に示すフローチャートの変形例による処理を示すフローチャートである。図16に示す処理は、波形生成部240A、波形合成部240B、及び駆動制御部240Cによって実行される処理である。なお、図16に示す処理は、電子機器100(図6参照)がアプリケーションを実行しているときに行われるため、図7に示すアプリケーションIDは、特定されているものとして説明する。
また、ステップS51~S53の処理は、図15に示すステップS51~S53と同一であるため、説明を省略する。
波形生成部240Aは、ステップS53で波形データ列を決定すると、操作入力の移動速度vから、周波数シフト量sfを計算する(ステップS154)。周波数シフト量sfは、式(4)によって求まる。
次に、波形生成部240Aは、係数行列の成分を周波数シフト量sfだけ高周波数側の行にシフトしたシフト係数行列を生成する(ステップS155)。
例えば、係数行列が図9に示す振動パターンP1に対応する3行8列の係数行列であり、周波数シフト量sfが'2'である場合には、3行8列の係数行列の成分を2行下側(高周波数側)にシフトし、周波数倍率が1倍である最も上の行と、上から2行目との成分(2行8列の成分)がすべて'0'である、5行8列のシフト係数行列を生成する。なお、この処理については、図17を用いて後述する。
波形生成部240Aは、接触荷重から振幅倍率aaを計算する(ステップS156)。接触荷重は、上述のように操作入力の接触面積に基づいて求められる。波形生成部240Aは、駆動制御部240Cから入力される面積データが表す接触面積に基づいて操作入力の接触荷重を求める。なお、ドライバIC151から波形生成部240Aに直接的に位置データと接触面積を表すデータとが入力されるようにしてもよい。
次に、波形生成部240Aは、ステップS155で生成したシフト係数行列のすべての成分に、ステップS156で計算した振幅倍率aaを乗算した乗算係数行列を生成する(ステップS157)。
次に、波形合成部240Bは、ステップS53で決定した波形データ列と、乗算係数行列とによって求まる複数の第1波形データを合成し、第1合成波形データを生成する(ステップS158)。
以上により、振幅データの振幅値が設定される。
ステップS158で生成された第1合成波形データは、駆動制御部240Cによって振幅データとして振幅変調器320(図6参照)に出力される。
図17は、ステップS155でシフト係数行列を生成する処理を説明する図である。
図17の上側に示すように、3行8列の係数行列があるとする。また、周波数シフト量sfが'2'であるとする。周波数シフト量sfが'2'であることは、第2周波数倍率afが4倍であることに対応する。
図17の上側に示す3行8列の係数行列では、最も上の行(第1周波数倍率は1倍)で、振幅増倍係数は、a11、a12、0、0、0、0、0、0に設定されている。また、上から2行目(第1周波数倍率は2倍)で、振幅増倍係数は、a21、a22、a23、a24、0、0、0、0に設定されている。また、上から3行目(第1周波数倍率は4倍)で、振幅増倍係数は、a31、a32、a33、a34、a35、a36、a37、a38に設定されている。
このような場合に、波形生成部240Aは、3行8列の係数行列の成分を周波数シフト量sfの分だけ下側(高周波数側)にシフトし、行のシフトによってブランクになる行の成分をすべて'0'に設定する。
ここでは、周波数シフト量sfは'2'であるため、図17の上側に示す3行8列の係数行列の成分を2行下側(高周波数側)にシフトし、周波数倍率が1倍である最も上の行と、上から2行目との成分(2行8列の成分)がすべて'0'に設定する。
このような処理により、波形生成部240Aは、図17の下側に示す5行8列のシフト係数行列を生成する。
そして、波形生成部240Aは、シフト係数行列のすべての成分に振幅倍率aaを乗算した乗算係数行列を生成し、波形合成部240Bは、波形データ列と、乗算係数行列とによって求まる複数の第1波形データを合成して、第1合成波形データを生成する。
図16に示す処理によって生成される第1合成波形データは、駆動制御部240Cによって振幅データとして振幅変調器320(図6参照)に出力される。
以上、図16の処理によれば、図15に示す処理のように第1合成波形データに含まれる第1合成振幅値のデータ点数を1/afにした第2合成波形データを生成する工程を含まない。
このため、図16のフローチャートに示す処理を用いて振幅データを生成すれば、図15に示す処理よりも計算量を減らすことができる。
ここで、図18乃至図22を用いて、実施の形態1の電子機器100の変形例について説明する。
図18は、実施の形態1の変形例の電子機器100Aの断面を示す図である。図18に示す断面は、図3に示すA-A矢視断面に対応する断面である。図18では図3と同様に直交座標系であるXYZ座標系を定義する。
電子機器100Aは、筐体110B、トップパネル120、パネル121、両面テープ130、振動素子140、タッチパネル150、ディスプレイパネル160A、及び基板170を含む。
電子機器100Aは、図3に示す電子機器100のタッチパネル150を裏面側(Z軸負方向側)に設けた構成を有する。このため、図3に示す電子機器100と比べると、両面テープ130、振動素子140、タッチパネル150、及び基板170が裏面側に配設されている。
筐体110Bには、Z軸正方向側の凹部110Aと、Z軸負方向側の凹部110Cとが形成されている。凹部110Aの内部には、ディスプレイパネル160Aが配設され、トップパネル120で覆われている。また、凹部110Cの内部には、基板170とタッチパネル150が重ねて設けられ、パネル121は両面テープ130で筐体110Bに固定され、パネル121のZ軸正方向側の面には、振動素子140が設けられている。
図18に示す電子機器100Aにおいて、パネル120Aへの操作入力に応じて、振動素子140のオン/オフを切り替えることによってパネル120Aに超音波帯の固有振動を発生させれば、図3に示す電子機器100と同様に、利用者が指先の感覚でディスプレイパネル160に表示される画像に対応した触感を知覚できる電子機器100Aを提供することができる。
なお、図18には、裏面側にタッチパネル150を設けた電子機器100Aを示すが、図3に示す構造と図18に示す構造とを合わせて、表面側と裏面側とにそれぞれタッチパネル150を設けてもよい。
図19は、実施の形態1の変形例の電子機器100Bを示す図である。電子機器100Bは、ノートブック型のPC(Personal Computer:パーソナルコンピュータ)である。
PC100Bは、ディスプレイパネル160B1とタッチパッド160B2を含む。
図20は、実施の形態1の変形例の電子機器100Bのタッチパッド160B2の断面を示す図である。図20に示す断面は、図3に示すA-A矢視断面に対応する断面である。図20では図3と同様に直交座標系であるXYZ座標系を定義する。
タッチパッド160B2は、図3に示す電子機器100から、ディスプレイパネル160を取り除いた構成を有する。
図19に示すようなPCとしての電子機器100Bにおいて、タッチパッド160B2への操作入力に応じて、振動素子140のオン/オフを切り替えることによってトップパネル120に超音波帯の固有振動を発生させれば、図3に示す電子機器100と同様に、タッチパッド160B2への操作入力の移動量に応じて、利用者の指先に触感を通じて操作感を提供することができる。
また、ディスプレイパネル160B1の裏面に振動素子140を設けておけば、図3に示す電子機器100と同様に、ディスプレイパネル160B1への操作入力の移動量に応じて、利用者の指先に触感を通じて操作感を提供することができる。この場合は、ディスプレイパネル160B1の代わりに、図3に示す電子機器100を設ければよい。
図21は、実施の形態1の変形例の電子機器100Cの動作状態を示す平面図である。
電子機器100Cは、筐体110、トップパネル120C、両面テープ130、振動素子140、タッチパネル150、ディスプレイパネル160、及び基板170を含む。
図21に示す電子機器100Cは、トップパネル120Cが曲面ガラスであること以外は、図3に示す実施の形態1の教育用触感提供装置100の構成と同様である。
トップパネル120Cは、平面視における中央部がZ軸正方向側に突出するように湾曲している。図21には、トップパネル120CのYZ平面における断面形状を示すが、XZ平面における断面形状も同様である。
このように、曲面ガラスのトップパネル120Cを用いることにより、良好な触感を提供できる。特に、画像として表示する物体の実物の形状が湾曲している場合に有効的である。
<実施の形態2>
実施の形態2の駆動制御装置及び電子機器は、それぞれ、実施の形態1の駆動制御装置300及び電子機器100と同様の構成を有する。実施の形態2の駆動制御装置及び電子機器は、メモリ250に格納される第2データ及び第3データの構造が実施の形態1の構造と異なる。
実施の形態2の駆動制御装置及び電子機器は、それぞれ、実施の形態1の駆動制御装置300及び電子機器100と同様の構成を有する。実施の形態2の駆動制御装置及び電子機器は、メモリ250に格納される第2データ及び第3データの構造が実施の形態1の構造と異なる。
図22は、実施の形態2で追加的に用いる第2基本波形を示す図である。図22に一例として示す第2基本波形は、2048個の基本振幅値によって構築される包絡線として与えられる。振幅は、5つのピークを有し、1024番目の振幅が最大になっている。このような振幅を表す基本振幅値は、図23に示す波形データ列によって設定される。
実施の形態2では、図10に示す基本波形を第1基本波形として用いるとともに、図22に示す第2基本波形を用いて、振幅データを生成する。第2基本波形は、サブ基本波形の一例である。
図22に示す第2基本波形は、図10に示す基本波形の基本周波数の1.5倍の第2基本周波数を有する。第2基本周波数は、基本周波数の1.5倍に限られるものではないが、基本周波数の整数倍ではなく、小数(整数部と小数部とを含む数)倍であれば任意の数値であってよい。
図23は、実施の形態2のメモリ250に格納される第2データを示す図である。
実施の形態2の第2データは、図8に示す基本波形IDがfw_id1の波形データ列に、[α1, α2, α3,・・・, α2048]を加えたデータ形式を有する。波形データ列[α1, α2, α3,・・・, α2048]は、2048個の基本振幅値α1~α2048を含む。
波形データ列[α1, α2, α3,・・・, α2048]は、基本振幅値α1~α2048によって構築される包絡線を表す。この包絡線は、図22に示す基本波形IDがfw_id1の第2基本波形を表す。
図24は、実施の形態2のメモリ250に格納される第3データを示す図である。
実施の形態2の第3データは、図9に示す第3データに対して、第2基本波形に対応する係数行列を追加した構造を有する。
図24には、一例として、振動パターンP1で基本波形IDがfw_id21の係数行列を示す。この係数行列は、図9に示す振動パターンP1で基本波形IDがfw_id1の係数行列を第1係数行列として含み、次のような第2係数行列を追加したものである。
第2係数行列は、第1周波数倍率が1倍の振幅増倍係数としてα11、α12、α13、0、0、0、0、0、0、0、0、0を含む。また、第1周波数倍率が2倍の振幅増倍係数としてα21、α22、α23、α24、α25、α26、0、0、0、0、0、0を含む。さらに、第1周波数倍率が4倍の振幅増倍係数としてα31、α32、α33、α34、α35、α36、α37、α38、α39、α310、α311、α312を含む。
図24に示す係数行列の第1係数行列は、図23に示す第1基本波形から第1波形を生成するために用いられ、第2係数行列は、図23に示す第2基本波形から第1波形を生成するために用いられる。第2基本波形から生成される第1波形は、第1サブ波形の一例である。
第1基本波形から生成される第1波形と、第2基本波形から生成される第1波形とは、波形合成部240Bによって合成され、第1合成波形が生成される。その後は、実施の形態1と同様に、第1合成波形に基づいて、第2合成波形が生成される。
実施の形態2では、上述のようにして、図10に示す基本波形を第1基本波形として用いるとともに、図22に示す第2基本波形を用いて、振幅データを生成する。
図22に示す第2基本波形は、図10に示す基本波形の基本周波数の1.5倍の第2基本周波数を有する。実施の形態2では、第1基本波形の小数倍の周波数を有する第2基本波形を追加的に用いることにより、実施の形態1よりもさらに様々な振幅データを生成するができる。
次に、図25乃至図29を用いて、利用者が振幅データを設定する方法について説明する。利用者は、電子機器100(図1及び図6参照)にインストールされた超音波振動設定アプリケーションを起動して、以下の処理を行うことにより、好みの画像等に好みの超音波振動を設定することができる。なお、超音波振動設定アプリケーションは、データ生成部240D(図6参照)が実行する。
図25は、第1周波数倍率と振幅増倍係数を設定する際に用いられるダイアログボックス161がディスプレイパネル160に表示された状態を示す図である。ダイアログボックス161は、超音波振動設定アプリケーションが起動され、第1周波数倍率と振幅増倍係数を設定するモードが選択されるとディスプレイパネル160に表示される。
ダイアログボックス161は、第1波形を設定するために用いる第1周波数倍率と振幅増倍係数を設定することができる。なお、ここでは、基本周波数A及びBを有する2個の基本波形を用いて第1周波数倍率と振幅増倍係数を設定する形態について説明する。
ダイアログボックス161の表示は、図11に表形式で示す係数行列に含まれる第1周波数倍率及び振幅増倍係数の表示と同様である。ダイアログボックス161には、テキストボックス161A、161A2、161A4、161A8、161B、161B2、161B4、161B8、終了ボタン161C、データ初期化ボタン161D、及び振動パターンを選択するドロップダウンリスト161Eが表示される。
テキストボックス161A、161A2、161A4、161A8、161B、161B2、161B4、161B8は、振幅増倍係数を入力する入力領域又は入力部である。ここではすべてのテキストボックスの振幅増倍係数が'0'である状態を示すが、利用者が任意の値を各テキストボックスに入力することができる。
テキストボックス161Aは、基本周波数Aの第1基本波形に対して、第1周波数倍率が1倍の第1波形について、振幅増倍係数を入力する入力部である。ここでは、一例として、基本周波数Aの第1基本波形は、データ点数が3072個の基本振幅値を有する基本波形であり、図25では、2個のテキストボックス161Aを用いて、第1周波数倍率が1倍の第1波形について、2周期分の振幅増倍係数を入力することができる。
テキストボックス161A2、161A4、161A8は、それぞれ、基本周波数Aに対して、第1周波数倍率が2倍、4倍、8倍の周波数の第1波形の振幅増倍係数を入力する入力部である。このため、図25には、4個のテキストボックス161A2、8個のテキストボックス161A4、16個のテキストボックス161A8を示す。
テキストボックス161Bは、基本周波数Bの第2基本波形に対して、第1周波数倍率が1倍の第1波形について、振幅増倍係数を入力する入力部である。ここでは、一例として、基本周波数Bは、基本周波数Aの1.5倍である。基本周波数Bの第2基本波形は、データ点数が2048個の基本振幅値を有する基本波形であり、図25では、3個のテキストボックス161Bを用いて、第1周波数倍率が1倍の第1波形について、3周期分の振幅増倍係数を入力することができる。
テキストボックス161B2、161B4、161B8は、それぞれ、基本周波数Bに対して、第1周波数倍率が2倍、4倍、8倍の周波数の第1波形の振幅増倍係数を入力する入力部である。このため、図25には、6個のテキストボックス161B2、12個のテキストボックス161B4、24個のテキストボックス161B8を示す。
利用者は、図25に示すダイアログボックス161を用いて、振幅増倍係数及び第1周波数倍率を任意の値に設定することができる。
以上のようなダイアログボックス161に利用者が振幅増倍係数を入力することにより、基本周波数Aの第1基本波形と基本周波数Bの第2基本波形に基づく、振動パターンP1と振動パターンP2とが生成されたこととする。振動パターンP1とP2は、互いに異なる。振動パターンP1、P2によってトップパネル120に生じる振動については、図28を用いて後述する。
なお、ここでは、共通の基本波形に基づいて、2つの振動パターンP1及びP2を生成する形態について説明するが、2つの振動パターンP1及びP2は、互いに異なる基本波形から生成することも可能である。
以上のような処理を利用者が行うことにより、振動パターン、基本波形ID、及び係数行列を含む第3データがデータ生成部240Dによって作成される。データ生成部240Dは、第3データをメモリ250に格納する。
上述のように利用者が振幅増倍係数を入力した場合には、振動パターンは、振動パターンP1及びP2であり、基本波形IDは、基本周波数A及びBの基本波形の基本波形IDである。なお、基本周波数A及びBの基本波形の基本波形IDは、基本波形データ(波形データ列)と関連付けられて第2データとして予めメモリ250に格納されている。
また、係数行列は、テキストボックス161A、161A2、161A4、161A8、161B、161B2、161B4、161B8に設定される振幅増倍係数を含む係数行列である。
図26は、利用者が振幅データの設定対象として選択した画像を表す図である。図27は、図26に示す画像に振幅データを設定する際のディスプレイパネル160の様子を示す図である。
利用者は、電子機器100(図1及び図6参照)で起動している超音波振動設定アプリケーションで図25に示すように振幅増倍係数又は第1周波数倍率を設定して振動パターンP1及びP2を作成した後に、図26に示すようにディスプレイパネル160に画像400を表示させることができる。画像400には、桃の実401と葉402の画像が含まれている。
ここでは、図26を用いて、画像400に超音波振動を設定する処理について説明する。
超音波振動設定アプリケーションは、利用者が画像400に超音波振動を設定できるようにするために、グラフィック用の設計ツールを起動する。グラフィック用の設計ツールとしては、例えば、画像400に含まれる実401と葉402の輪郭を認識してキャンバス400Aに表示し、利用者が自由にペイントすることができ、さらにペイントした領域に利用者が自由に振動パターンを設定できるものであればよい。
例えば、図27では、キャンバス400Aの下側にパレット403が表示され、濃いグレーのペイントと、薄いグレーのペイントを用いて、キャンバス400Aの内部を自由に塗り分けられるようになっている。濃いグレーで表示されるボタン403Aを押して、ペイントする領域を指定すれば、指定した領域が濃いグレーにペイントされる。また、薄いグレーで表示されるボタン403Bを押して、ペイントする領域を指定すれば、指定した領域が薄いグレーにペイントされる。
濃いグレーのペイントで塗られる領域には、振動パターンP1が設定され、薄いグレーのペイントで塗られる領域には、振動パターンP2が設定されるようになっている。
なお、ここでは、濃いグレーのペイントと薄いグレーのペイントを示すが、実際には、例えば、濃いグレーのペイントは赤色のペイントであり、薄いグレーのペイントは緑色のペイントであることとする。また、ここには、一例として2色のペイントを示すが、3色以上のペイントが用意されていてもよい。
利用者は、図27に示すように、キャンバス400Aに表示される実401Aと葉402Aの輪郭に沿って、実401Aを濃いグレーでペイントし、葉402Aを薄いグレーでペイントする。
このような処理を利用者が行うことにより、超音波振動設定アプリケーションは、濃いグレーでペイントされた領域の領域データと、振動パターンP1とを関連付けるとともに、薄いグレーでペイントされた領域の領域データと、振動パターンP2とを関連付けることにより、第1データを作成する。このようにしてデータ生成部240Dによって作成される第1データは、図7に示す第1データと同様である。データ生成部240Dは、第1データをメモリ250に格納する。
なお、図27に示すキャンバス400Aは、図26に示す画像400とレイヤーを分けて、同時に表示してもよい。このようにすれば、利用者は、画像400を見ながら、キャンバス400Aでペイントを行うことができる。
また、最初に画像400のデータを読み込んだ際に、画像処理によって自動的に領域分割を行い、各領域を暫定的に塗り分けたデフォルトの状態を生成するようにし、デフォルトの状態からペイントを開始するようにしてもよい。
図28は、トップパネル120に生じる振動パターンP1、P2を示す図である。図28において、横軸は時間軸を表し、縦軸は駆動制御部240から出力される振幅データの振幅値を表す。
図28に示す振動パターンP1及びP2は、図26に示す桃の実401及び葉402の模擬的な触感を実現するために、利用者が図25に示すダイアログボックス161に好みの第1周波数倍率及び振幅増倍係数を設定した場合に得られるものとして説明する。
前提条件として、図26に示す桃の実401及び葉402の模擬的な触感を実現するための振動パターンP1、P2を含む第3データ(図9参照)、及び、図27に示すように桃の実401と葉402との領域を表す領域データと振動パターンP1、P2とを関連付けた第1データ(図7参照)が生成されていることとする。
ここで、利用者が図26に示す点Aから点B、C、Dを経て点Eまで、桃の画像400に合わせてトップパネル120の表面120Aをなぞる操作入力を行ったとする。点Aは桃の実401及び葉402以外の点であり、点Bは葉402の端であり、点Cは葉402と実401の境界であり、点Dは実401の端であり、点Eは、桃の実401及び葉402以外の点である。
このような操作入力が行われると、駆動制御装置300は図28に示すように振動素子140を駆動する。
時刻t1において利用者の指先が点Aに触れると、点Aは桃の実401及び葉402以外の点であり、振動パターンP1及びP2は設定されていないため、駆動制御装置300は振動素子140を駆動しない。このため、振幅はゼロである。
時刻t2において利用者の指先が点Bに到達すると、葉402に対応する振動パターンP2による振動がトップパネル120に発生する。これにより利用者は指先を通じて桃の葉402に触れ始めたことを感知することができる。
その後、点Cに至るまで、振動パターンP2による振動がトップパネル120に生じるため、利用者は指先を通じて桃の葉402の表面の滑らかさを触感で感知することができる。振動パターンP2による振幅A100は、桃の葉402の滑らかな触感を表現するために、比較的大きな値に設定されている。振幅が大きければ、スクイーズ効果によって指先にかかる動摩擦力が小さくなり、滑りやすくなるからである。
時刻t3において利用者の指先が点Cに到達すると、実401に対応する振動パターンP1による振動がトップパネル120に発生する。すなわち、時刻t3において、振動パターンP2から振動パターンP1に切り替わる。これにより利用者は指先を通じて桃の実401に触れ始めたことを感知することができる。
振動パターンP1は、実401の表面の少しざらざらした感じと、滑らかな感じとを合わせたような触感を表現するために、振動パターンP2による振幅A100よりも小さな振幅値を有するように設定されている。また、振動パターンP1は、実401の表面の少しざらざら感を出すために、振幅が変動するように設定されている。
このような理由から、振動パターンP1は、振幅A50±3に設定されている。振幅A50±3は、変動の中心が振幅A100の半分のA50で、変動幅が正方向及び負方向にA50の3/50であることを意味する。
このため、時刻t3において利用者の指先が点Cに到達すると、振幅が小さくなることから、利用者の指先にかかる動摩擦力は大きくなり、利用者は指先で、凸な部分に接触したような触感を得る。
桃の実401よりも葉402の方が触り心地が滑らかであることから、利用者は、実401に割り当てる振動パターンP1の振幅A50±3を、葉402に割り当てられる振動パターンP2の振幅A100よりも小さく設定したものである。
その後、点Dに至るまで、振動パターンP1による振動がトップパネル120に生じるため、利用者は指先を通じて桃の実401の表面の滑らかさとざらざら感を触感で感知することができる。
時刻t4において利用者の指先が点Dに達すると、点Dは、桃の実401と、桃の実401及び葉402以外の点との境界であるため、点Dを過ぎた時点で振動パターンP1による駆動は終了し、振幅はゼロになる。
その後、時刻t5で利用者の指先が点Eに達した時点で、利用者は指先をトップパネル120から離す。
以上のように、利用者は、好みの画像400に好みの振動パターンP1、P2による触感を設定することができる。
そして、設定後に利用者が画像400に触れると、画像400に触れる位置に応じて、利用者が設定した好みの振動パターンP1、P2による振動がトップパネル120に発生する。
すなわち、実施の形態2の駆動制御装置300によれば、利用者の好みの振動パターンP1、P2を好みの画像400に自由に設定することができる。
図29は、利用者が超音波振動設定アプリケーションを利用して画像に超音波の振動を設定する際に、駆動制御装置300のデータ生成部240Dが実行する処理を示すフローチャートである。
データ生成部240Dは、利用者の操作入力によって超音波振動設定アプリケーションが選択されると、処理をスタートさせる。
まず、データ生成部240Dは、超音波振動設定アプリケーションを起動する(ステップS101)。これにより、利用者は、ディスプレイパネル160に好みの画像400(図26参照)を表示させることができるようになる。
次に、データ生成部240Dは、利用者によって選択された画像400を認識してキャンバスに表示し、キャンバス400Aの下側にパレット403を表示する(ステップS102)。
次に、データ生成部240Dは、パレット403の内部のボタン403A又はボタン403Bがダブルクリックされたかどうかを判定する(ステップS103)。ここで、ボタン403A又は403Bのダブルクリックは、第1周波数倍率と振幅増倍係数を設定するダイアログボックス161を表示するコマンドである。
データ生成部240Dは、ボタン403A又はボタン403Bがダブルクリックされた(S103:YES)と判定すると、ディスプレイパネル160にダイアログボックス161を表示する(ステップS104)。これにより、利用者は、ダイアログボックス161の中のテキストボックスに、振幅増倍係数を設定することができるようになる。
次に、データ生成部240Dは、各テキストボックスに入力された数値をメモリ250に保持する(ステップS105)。
次に、データ生成部240Dは、終了ボタン161Cが押されたかどうかを判定する(ステップS106)。
データ生成部240Dは、終了ボタン161Cが押された(S106:YES)と判定すると、ステップS105でテキストボックスに入力された振幅増倍係数に基づいて第3データを生成する(ステップS107)。なお、データ生成部240Dは、終了ボタン161Cが押されていない(S106:NO)と判定すると、フローをステップS105にリターンする。
ステップS107の処理が終了すると、データ生成部240Dは、ダイアログボックス161を非表示にする(ステップS108)。ステップS108の処理が終了すると、データ生成部240Dは、フローをステップS103にリターンする。
データ生成部240Dは、ステップS103において、パレット403の内部のボタン403A又はボタン403Bがダブルクリックされていない(S103:NO)と判定すると、フローをステップS109に進める。
データ生成部240Dは、グラフィック用の設計ツールを起動する(ステップS109)。これにより、利用者はキャンバス400Aに自由にペイントすることができるようになる。
例えば、図27では、ボタン403Aをシングルクリックした後、キャンバス400A上でペイントする領域を指定すれば、指定した領域が濃いグレーにペイントされる。また、薄いグレーで表示されるボタン403Bをシングルクリックした後、キャンバス400A上でペイントする領域を指定すれば、指定した領域が薄いグレーにペイントされる。
データ生成部240Dは、濃いグレーのペイントで塗られた領域に振動パターンP1を設定し、薄いグレーのペイントで塗られた領域に振動パターンP2を設定する。
データ生成部240Dは、終了コマンドが入力されたかどうかを判定する(ステップS110)。終了コマンドは、予め設定されていれば、どのようなコマンドでもよく、例えば、キャンバス400A及びパレット403以外の領域をダブルクリックする動作をグラフィック用の設計ツールの終了コマンドとして設定しておけばよい。
データ生成部240Dは、終了コマンドが入力された(S110:YES)と判定すると、キャンバス400Aにペイントされた色のデータに基づいて、濃いグレーと薄いグレーに塗られた領域の座標を表す領域データを生成し、さらに、領域データと振動パターンに基づいて第1データを生成する(ステップS111)。
データ生成部240Dは、ステップS111で第1データを生成すると、超音波振動設定アプリケーションを終了する(ステップS112)。
以上で、データ生成部240Dによる音波振動設定アプリケーションの実行処理が終了する(エンド)。
なお、データ生成部240Dは、ステップS110において、終了コマンドが入力されていない(S110:NO)と判定すると、フローをステップS103にリターンする。
以上のように設定した第1データ及び第3データと、メモリ250に予め格納されている第2データとを用いれば、図26に示す実401と葉402の画像に指先が触れるときに、利用者の好みの触感を表す超音波の振動を発生させることができる。
また、実施の形態2の駆動制御装置300は、図25乃至図29を用いて説明したように、利用者の好みの振動パターンP1、P2を好みの画像400に自由に設定することができる。
従って、利用者にとって非常に利用価値の高い駆動制御装置300及び電子機器100を提供することができる。 以上、本発明の例示的な実施の形態の駆動制御装置、電子機器、駆動制御プログラム、及び駆動制御方法について説明したが、本発明は、具体的に開示された実施の形態に限定されるものではなく、特許請求の範囲から逸脱することなく、種々の変形や変更が可能である。
100、100A、100B、100C 電子機器
110 筐体
120 トップパネル
130 両面テープ
140 振動素子
150 タッチパネル
160 ディスプレイパネル
170 基板
200 制御部
220 アプリケーションプロセッサ
230 通信プロセッサ
240A 波形生成部
240B 波形合成部
240C 駆動制御部
240 データ生成部
250 メモリ
300 駆動制御装置
310 正弦波発生器
320 振幅変調器
110 筐体
120 トップパネル
130 両面テープ
140 振動素子
150 タッチパネル
160 ディスプレイパネル
170 基板
200 制御部
220 アプリケーションプロセッサ
230 通信プロセッサ
240A 波形生成部
240B 波形合成部
240C 駆動制御部
240 データ生成部
250 メモリ
300 駆動制御装置
310 正弦波発生器
320 振幅変調器
Claims (16)
-
表示部と、前記表示部の表示面側に配設され、操作面を有するトップパネルと、前記操作面に行われる操作入力の座標を検出する座標検出部と、前記操作面に振動を発生させる振動素子とを含む電子機器の前記振動素子を駆動する駆動制御装置であって、
前記操作面に超音波帯の固有振動を発生させる駆動信号の振幅の時間変化を表す基本波形であって、時系列的に配列される所定の数の振幅値で構築される基本波形を表す基本波形データを格納するデータ格納部と、
前記基本波形の周波数又は振幅を変化させた第1波形を表す第1波形データを生成する波形生成部と、
前記基本波形と、前記第1波形とを合成した第1合成波形、又は、複数の前記第1波形を合成した第1合成波形を表す第1合成波形データを生成する波形合成部と、
前記第1合成波形データに基づいて前記駆動信号の振幅を変化させることにより、前記振動素子を駆動する駆動制御部と
を含む、駆動制御装置。
-
前記波形生成部は、前記基本波形データのデータ点数を前記基本周波数に対する前記第1波形の第1周波数の比に応じて減らすことによって、前記基本波形の基本周波数よりも高くされる第1周波数を有する前記第1波形を表す前記第1波形データを生成する、請求項1記載の駆動制御装置。
-
前記駆動制御部は、前記第1合成波形データのデータ点数を、前記操作面への操作入力の位置の時間的変化度合に応じて減らすことによって、前記第1合成波形の第2周波数よりも高くされる第3周波数を有する第2合成波形を表す第2合成波形データを生成し、前記第2合成波形データを用いて前記駆動信号の振幅を変化させることにより、前記振動素子を駆動する、請求項1又は2記載の駆動制御装置。
-
前記駆動制御部は、前記操作入力の位置の時間的変化度合の基本値に対する、前記操作入力の位置の時間的変化度合の比nを用いて、前記第1合成波形データのデータ点数を1/mn(mは2以上の自然数又は1より大きい小数、nは0以上の自然数)にすることにより、前記第2合成波形データを生成する、請求項3記載の駆動制御装置。
-
前記波形生成部は、前記基本波形データのデータ点数を、前記操作面への操作入力の位置の時間的変化度合に応じて減らすことによって、前記基本波形の基本周波数よりも高くされる第1周波数を有する前記第1波形を表す前記第1波形データを生成する、請求項1又は2記載の駆動制御装置。
-
前記波形生成部は、前記操作入力の位置の時間的変化度合の基本値に対する、前記操作入力の位置の時間的変化度合の比nを用いて、前記基本波形データのデータ点数を1/mn(mは2以上の自然数又は1より大きい小数、nは0以上の自然数)にすることにより、前記第1波形データを生成する、請求項5記載の駆動制御装置。
-
前記駆動制御部は、さらに、前記操作入力の接触荷重に応じて、前記駆動信号の振幅を変化させる、請求項1乃至6のいずれか一項記載の駆動制御装置。
-
前記データ格納部は、前記基本波形データのデータ点数の1/X(Xは任意の小数)のデータ点数と、前記基本波形の周波数のX倍の周波数とを有するサブ基本波形を表すサブ基本波形データをさらに格納しており、
前記波形生成部は、さらに、前記サブ基本波形の周波数又は振幅を変化させた第1サブ波形を表す第1サブ波形データを生成し、
前記波形合成部は、前記第1合成波形データが表す前記第1合成波形を、前記基本波形、前記第1波形、前記サブ基本波形、及び前記第1サブ波形を合成することによって、又は、複数の前記第1波形と複数の第1サブ波形とを合成することによって生成する、請求項1乃至7のいずれか一項記載の駆動制御装置。
-
前記駆動信号は、一定の周波数と一定の位相で前記操作面に超音波帯の固有振動を発生させる駆動信号である、請求項1乃至8のいずれか一項記載の駆動制御装置。
-
前記操作面は平面視で長辺と短辺を有する矩形状であり、前記駆動制御部が前記振動素子を振動させることにより、前記操作面の前記長辺又は前記短辺の方向に振幅が変化する定在波が生じる、請求項1乃至9のいずれか一項記載の駆動制御装置。
-
前記駆動制御部は、所定時間経過後の前記操作入力の位置を当該位置の時間的変化度合に応じて推定し、推定した操作入力の位置に応じて、前記固有振動の強度が変化するように前記振動素子を駆動する、請求項1乃至10のいずれか一項記載の駆動制御装置。
-
前記基本波形の周波数又は振幅を変化させる変化量が前記操作面への操作入力によって入力されると、前記変化量を表すデータを生成して前記データ格納部に格納するデータ生成部をさらに含み、
前記波形生成部は、前記データ格納部に格納された前記データに基づいて前記基本波形の周波数又は振幅を変化させた第1波形を表す第1波形データを生成する、請求項1乃至11のいずれか一項記載の駆動制御装置。
-
前記表示部と、
前記表示部の表示面側に配設され、操作面を有する前記トップパネルと、
前記操作面に行われる操作入力の座標を検出する前記座標検出部と、
前記操作面に振動を発生させる前記振動素子と、
請求項1乃至12のいずれか一項記載の駆動制御装置と
を含む電子機器。
-
表示部と、前記表示部の表示面側に配設され、操作面を有するトップパネルと、前記操作面に行われる操作入力の座標を検出する座標検出部と、前記操作面に振動を発生させる振動素子とを含む電子機器の前記振動素子を駆動する駆動制御プログラムであって、
前記操作面に超音波帯の固有振動を発生させる駆動信号の振幅の時間変化を表す基本波形であって、時系列的に配列される所定の数の振幅値で構築される基本波形を表す基本波形データを格納するデータ格納部を有するコンピュータに、
前記基本波形の周波数又は振幅を変化させる変化量が前記操作面への操作入力によって入力されると、前記変化量を表すデータを前記データ格納部に格納することと、
前記データ格納部に格納された前記データに基づいて前記基本波形の周波数又は振幅を変化させた第1波形を表す第1波形データを生成することと、
前記基本波形と、前記第1波形とを合成した第1合成波形、又は、複数の前記第1波形を合成した第1合成波形を表す第1合成波形データを生成することと、
前記第1合成波形データに基づいて前記駆動信号の振幅を変化させる振動パターンで前記振動素子を駆動することと
を実行させる駆動制御プログラム。
-
前記表示部に画像を表示させた状態で、前記操作面への操作入力によって前記画像の一部に対応する領域が指定されると、前記座標検出部によって検出される前記操作入力の座標に基づき、前記領域を表すデータを作成することと、
前記領域に関連付ける前記振動パターンが前記操作面への操作入力によって指定されると、前記領域を表すデータと前記振動パターンを表すデータとを関連付けることと、
前記表示部に画像を表示させた状態で、前記領域の内部で前記操作面への操作入力が行われると、前記領域を表すデータに関連付けられた前記振動パターンで前記駆動信号の振幅を変化させることと
をさらに含む、請求項14記載の駆動制御プログラム。
-
表示部と、前記表示部の表示面側に配設され、操作面を有するトップパネルと、前記操作面に行われる操作入力の座標を検出する座標検出部と、前記操作面に振動を発生させる振動素子とを含む電子機器の前記振動素子を駆動する駆動制御方法であって、
前記操作面に超音波帯の固有振動を発生させる駆動信号の振幅の時間変化を表す基本波形であって、時系列的に配列される所定の数の振幅値で構築される基本波形を表す基本波形データを格納するデータ格納部を有するコンピュータが、
前記基本波形の周波数又は振幅を変化させた第1波形を表す第1波形データを生成し、
前記基本波形と、前記第1波形とを合成した第1合成波形、又は、複数の前記第1波形を合成した第1合成波形を表す第1合成波形データを生成し、
前記第1合成波形データに基づいて前記駆動信号の振幅を変化させることにより、前記振動素子を駆動する、駆動制御方法。
Priority Applications (3)
| Application Number | Priority Date | Filing Date | Title |
|---|---|---|---|
| JP2016571509A JP6332476B2 (ja) | 2015-01-26 | 2015-01-26 | 駆動制御装置、電子機器、駆動制御プログラム、及び駆動制御方法 |
| PCT/JP2015/051964 WO2016120956A1 (ja) | 2015-01-26 | 2015-01-26 | 駆動制御装置、電子機器、駆動制御プログラム、及び駆動制御方法 |
| US15/644,259 US10564723B2 (en) | 2015-01-26 | 2017-07-07 | Drive controlling apparatus, electronic device, computer-readable recording medium, and drive controlling method |
Applications Claiming Priority (1)
| Application Number | Priority Date | Filing Date | Title |
|---|---|---|---|
| PCT/JP2015/051964 WO2016120956A1 (ja) | 2015-01-26 | 2015-01-26 | 駆動制御装置、電子機器、駆動制御プログラム、及び駆動制御方法 |
Related Child Applications (1)
| Application Number | Title | Priority Date | Filing Date |
|---|---|---|---|
| US15/644,259 Continuation US10564723B2 (en) | 2015-01-26 | 2017-07-07 | Drive controlling apparatus, electronic device, computer-readable recording medium, and drive controlling method |
Publications (1)
| Publication Number | Publication Date |
|---|---|
| WO2016120956A1 true WO2016120956A1 (ja) | 2016-08-04 |
Family
ID=56542616
Family Applications (1)
| Application Number | Title | Priority Date | Filing Date |
|---|---|---|---|
| PCT/JP2015/051964 Ceased WO2016120956A1 (ja) | 2015-01-26 | 2015-01-26 | 駆動制御装置、電子機器、駆動制御プログラム、及び駆動制御方法 |
Country Status (3)
| Country | Link |
|---|---|
| US (1) | US10564723B2 (ja) |
| JP (1) | JP6332476B2 (ja) |
| WO (1) | WO2016120956A1 (ja) |
Cited By (1)
| Publication number | Priority date | Publication date | Assignee | Title |
|---|---|---|---|---|
| JP2022061235A (ja) * | 2020-10-06 | 2022-04-18 | 株式会社デンソーテン | 触感制御装置及び触感制御方法 |
Families Citing this family (11)
| Publication number | Priority date | Publication date | Assignee | Title |
|---|---|---|---|---|
| JPWO2015121955A1 (ja) * | 2014-02-14 | 2017-03-30 | 富士通株式会社 | 電子機器、入力装置、及び駆動制御方法 |
| US10591993B2 (en) | 2016-09-21 | 2020-03-17 | Apple Inc. | Haptic structure for providing localized haptic output |
| US10416772B2 (en) | 2017-09-06 | 2019-09-17 | Apple Inc. | Electrical haptic output array |
| US10585482B2 (en) * | 2017-09-27 | 2020-03-10 | Apple Inc. | Electronic device having a hybrid conductive coating for electrostatic haptics |
| US10775890B2 (en) | 2017-09-27 | 2020-09-15 | Apple Inc. | Electronic device having a piezoelectric body for friction haptics |
| US10248211B1 (en) | 2017-09-28 | 2019-04-02 | Apple Inc. | Ground-shifted touch input sensor for capacitively driving an electrostatic plate |
| US10684734B2 (en) * | 2017-09-28 | 2020-06-16 | Apple Inc. | Transparent high-resistivity layer for electrostatic friction modulation over a capacitive input sensor |
| CN110597393B (zh) * | 2019-09-18 | 2023-05-05 | Oppo(重庆)智能科技有限公司 | 一种马达振动控制方法、装置及计算机可读存储介质 |
| US11711030B2 (en) * | 2020-05-27 | 2023-07-25 | Taiyo Yuden Co., Ltd. | Driving device, tactile sensation providing apparatus, and driving method |
| US12223110B1 (en) | 2021-09-23 | 2025-02-11 | Apple Inc. | Secure integrated circuit for smart haptics |
| CN115357124B (zh) * | 2022-09-20 | 2023-09-05 | 武汉市聚芯微电子有限责任公司 | 一种振动控制方法、装置、设备及存储介质 |
Citations (4)
| Publication number | Priority date | Publication date | Assignee | Title |
|---|---|---|---|---|
| JP2010238222A (ja) * | 2009-03-12 | 2010-10-21 | Ricoh Co Ltd | タッチパネル装置、これを含むタッチパネル付き表示装置、及びタッチパネル装置の制御方法 |
| JP2013200863A (ja) * | 2012-02-23 | 2013-10-03 | Panasonic Corp | 電子機器 |
| JP2014102648A (ja) * | 2012-11-19 | 2014-06-05 | Aisin Aw Co Ltd | 操作支援システム、操作支援方法及びコンピュータプログラム |
| JP2014130443A (ja) * | 2012-12-28 | 2014-07-10 | Kyocera Document Solutions Inc | タッチパネル装置 |
Family Cites Families (11)
| Publication number | Priority date | Publication date | Assignee | Title |
|---|---|---|---|---|
| JP3949912B2 (ja) * | 2000-08-08 | 2007-07-25 | 株式会社エヌ・ティ・ティ・ドコモ | 携帯型電子機器、電子機器、振動発生器、振動による報知方法および報知制御方法 |
| JP2006163579A (ja) | 2004-12-03 | 2006-06-22 | Sony Corp | 情報処理システム、情報処理装置及び情報処理方法 |
| US8780053B2 (en) * | 2007-03-21 | 2014-07-15 | Northwestern University | Vibrating substrate for haptic interface |
| US9874935B2 (en) | 2009-03-12 | 2018-01-23 | Immersion Corporation | Systems and methods for a texture engine |
| US9746923B2 (en) | 2009-03-12 | 2017-08-29 | Immersion Corporation | Systems and methods for providing features in a friction display wherein a haptic effect is configured to vary the coefficient of friction |
| US10007340B2 (en) | 2009-03-12 | 2018-06-26 | Immersion Corporation | Systems and methods for interfaces featuring surface-based haptic effects |
| US10564721B2 (en) | 2009-03-12 | 2020-02-18 | Immersion Corporation | Systems and methods for using multiple actuators to realize textures |
| US9696803B2 (en) | 2009-03-12 | 2017-07-04 | Immersion Corporation | Systems and methods for friction displays and additional haptic effects |
| CN102349039B (zh) | 2009-03-12 | 2016-07-13 | 意美森公司 | 用于在摩擦显示器中提供特征的系统和方法 |
| JP2010231609A (ja) | 2009-03-27 | 2010-10-14 | Hitachi Maxell Ltd | 触感呈示装置及び方法 |
| JP6445921B2 (ja) * | 2015-04-21 | 2018-12-26 | 任天堂株式会社 | 振動信号生成プログラム、振動信号生成システム、振動信号生成装置、振動信号生成方法、およびデータ出力プログラム |
-
2015
- 2015-01-26 JP JP2016571509A patent/JP6332476B2/ja not_active Expired - Fee Related
- 2015-01-26 WO PCT/JP2015/051964 patent/WO2016120956A1/ja not_active Ceased
-
2017
- 2017-07-07 US US15/644,259 patent/US10564723B2/en not_active Expired - Fee Related
Patent Citations (4)
| Publication number | Priority date | Publication date | Assignee | Title |
|---|---|---|---|---|
| JP2010238222A (ja) * | 2009-03-12 | 2010-10-21 | Ricoh Co Ltd | タッチパネル装置、これを含むタッチパネル付き表示装置、及びタッチパネル装置の制御方法 |
| JP2013200863A (ja) * | 2012-02-23 | 2013-10-03 | Panasonic Corp | 電子機器 |
| JP2014102648A (ja) * | 2012-11-19 | 2014-06-05 | Aisin Aw Co Ltd | 操作支援システム、操作支援方法及びコンピュータプログラム |
| JP2014130443A (ja) * | 2012-12-28 | 2014-07-10 | Kyocera Document Solutions Inc | タッチパネル装置 |
Cited By (2)
| Publication number | Priority date | Publication date | Assignee | Title |
|---|---|---|---|---|
| JP2022061235A (ja) * | 2020-10-06 | 2022-04-18 | 株式会社デンソーテン | 触感制御装置及び触感制御方法 |
| JP7497266B2 (ja) | 2020-10-06 | 2024-06-10 | 株式会社デンソーテン | 触感制御装置及び触感制御方法 |
Also Published As
| Publication number | Publication date |
|---|---|
| JP6332476B2 (ja) | 2018-05-30 |
| US20170308171A1 (en) | 2017-10-26 |
| US10564723B2 (en) | 2020-02-18 |
| JPWO2016120956A1 (ja) | 2017-11-02 |
Similar Documents
| Publication | Publication Date | Title |
|---|---|---|
| JP6332476B2 (ja) | 駆動制御装置、電子機器、駆動制御プログラム、及び駆動制御方法 | |
| JP5780368B1 (ja) | 駆動制御装置、電子機器、及び駆動制御方法 | |
| JP6183476B2 (ja) | 電子機器及び駆動制御方法 | |
| US20160349846A1 (en) | Electronic device, input apparatus, and drive controlling method | |
| US20180024638A1 (en) | Drive controlling apparatus, electronic device, computer-readable recording medium, and drive controlling method | |
| US11086435B2 (en) | Drive control device, electronic device, and drive control method | |
| US20180018022A1 (en) | Electronic device, coordinate detecting unit, and adhesive member | |
| JPWO2019092821A1 (ja) | 駆動制御装置、電子機器、及び、駆動制御方法 | |
| JP6123850B2 (ja) | 駆動制御装置、電子機器、及び駆動制御方法 | |
| JP6589995B2 (ja) | 電子機器、及び、電子機器の駆動制御方法 | |
| WO2015121972A1 (ja) | 駆動制御装置、電子機器、システム、及び駆動制御方法 | |
| WO2016092644A1 (ja) | 電子機器及び駆動制御方法 | |
| US20180067559A1 (en) | Electronic apparatus and non-transitory recording medium having stored therein | |
| WO2016174760A1 (ja) | 駆動制御装置、電子機器、駆動制御プログラム、及び駆動制御方法 | |
| JP6399216B2 (ja) | 駆動制御装置、電子機器、駆動制御プログラム、及び駆動制御方法 | |
| AU2015202408B2 (en) | Drive controlling apparatus, electronic device and drive controlling method | |
| JP6512299B2 (ja) | 駆動制御装置、電子機器、駆動制御プログラム、及び駆動制御方法 | |
| JP2016161953A (ja) | 電子機器及び接触座標決定プログラム |
Legal Events
| Date | Code | Title | Description |
|---|---|---|---|
| 121 | Ep: the epo has been informed by wipo that ep was designated in this application |
Ref document number: 15879854 Country of ref document: EP Kind code of ref document: A1 |
|
| ENP | Entry into the national phase |
Ref document number: 2016571509 Country of ref document: JP Kind code of ref document: A |
|
| NENP | Non-entry into the national phase |
Ref country code: DE |
|
| 122 | Ep: pct application non-entry in european phase |
Ref document number: 15879854 Country of ref document: EP Kind code of ref document: A1 |