WO2016088509A1 - 気象補正装置、空調管理システム及び気象補正方法 - Google Patents
気象補正装置、空調管理システム及び気象補正方法 Download PDFInfo
- Publication number
- WO2016088509A1 WO2016088509A1 PCT/JP2015/081340 JP2015081340W WO2016088509A1 WO 2016088509 A1 WO2016088509 A1 WO 2016088509A1 JP 2015081340 W JP2015081340 W JP 2015081340W WO 2016088509 A1 WO2016088509 A1 WO 2016088509A1
- Authority
- WO
- WIPO (PCT)
- Prior art keywords
- weather
- value
- correction
- air conditioning
- weather forecast
- Prior art date
- Legal status (The legal status is an assumption and is not a legal conclusion. Google has not performed a legal analysis and makes no representation as to the accuracy of the status listed.)
- Ceased
Links
Images


Classifications
-
- F—MECHANICAL ENGINEERING; LIGHTING; HEATING; WEAPONS; BLASTING
- F24—HEATING; RANGES; VENTILATING
- F24F—AIR-CONDITIONING; AIR-HUMIDIFICATION; VENTILATION; USE OF AIR CURRENTS FOR SCREENING
- F24F11/00—Control or safety arrangements
- F24F11/89—Arrangement or mounting of control or safety devices
-
- G—PHYSICS
- G01—MEASURING; TESTING
- G01W—METEOROLOGY
- G01W1/00—Meteorology
- G01W1/10—Devices for predicting weather conditions
-
- H—ELECTRICITY
- H02—GENERATION; CONVERSION OR DISTRIBUTION OF ELECTRIC POWER
- H02J—ELECTRIC POWER NETWORKS; CIRCUIT ARRANGEMENTS OR SYSTEMS FOR SUPPLYING OR DISTRIBUTING ELECTRIC POWER; SYSTEMS FOR STORING ELECTRIC ENERGY
- H02J3/00—Circuit arrangements for AC mains or AC distribution networks
Definitions
- the present invention relates to a weather correction device, an air conditioning management system, and a weather correction method for performing air conditioning management.
- the power consumption of buildings, etc. is predicted for the purpose of leveling the power load. As one of such power predictions, power consumption is predicted based on past power data and weather forecast values.
- the weather forecast value used at this time is data distributed from a weather forecast company or the Japan Meteorological Agency or the like for each region (for example, for each municipality).
- a weather forecast value is substituted into a regression equation including variables representing a weather condition factor and power consumption.
- the technique of patent document 1 calculates the predicted value of the power consumption of a prediction object period based on this substitution result.
- the technique described in Patent Literature 1 performs calculation of a predicted value of power consumption, and results data belonging to the same pattern as the predicted value among the measured data registered in advance for each pattern that can be divided into days of the week. The coefficient of the regression equation is changed so that the deviation between the load amount and the predicted value is minimized.
- the actual temperature and humidity may differ from the weather forecast value depending on the location of the building.
- the actual temperature and humidity may be different between the vicinity of a coastal building and a building located in the mountains even in the same municipality.
- the difference between the weather forecast value and the actual temperature and humidity occurs depending on the time of day, such as midnight, dawn, daytime, and night.
- Patent Document 1 uses weather forecast values without considering the location conditions of the building to be predicted. Therefore, since the weather conditions reflecting the location conditions are not used, it is impossible to calculate the accurate power consumption in the vicinity of the building to be predicted. In addition, because weather forecast values based on the day of the week pattern are used, changes in weather conditions due to time such as midnight, dawn, daytime, and night are not taken into account, so accurate power consumption at each time is calculated. I can't.
- Patent Document 1 since the technique described in Patent Document 1 directly calculates power consumption from weather information, the predicted weather information cannot be used as intermediate information, and a wide range of power consumption can be predicted. Impossible.
- the present invention has been made in view of such a background, and an object of the present invention is to improve the accuracy of forecasting weather values at predicted points and predicted times.
- the present invention corrects the weather forecast value to be predicted based on the past weather forecast value acquired at each time and the past actually measured weather value at the time. It is characterized by.
- Other solutions will be described in the embodiments.
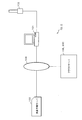
- FIG. 1 is a diagram illustrating a configuration example of a weather correction system according to the present embodiment.
- a computing device 101 a temperature / humidity sensor 102, and a weather forecast server 103 installed in a weather forecast center are connected to each other by a network 104.
- the network 104 is, for example, a WAN (Wide Area Network).
- the calculation device 101 is a correction device 200 described later in FIG. 3, and acquires the weather forecast data 221 (see FIG.
- the weather forecast server 103 calculates a correction coefficient for the weather forecast value included in the weather forecast data 221, and uses the correction coefficient. Calculate the weather correction values that were present.
- the temperature / humidity sensor 102 measures the outside air temperature humidity (actual measurement values of temperature and humidity: hereinafter referred to as meteorological measurement data 222 (see FIG. 3)).
- meteorological measurement data 222 hereinafter referred to as meteorological measurement data 222 (see FIG. 3).
- temperature refers to “dry bulb temperature”.
- the weather forecast server 103 performs a weather forecast using a weather forecast device installed therein, and distributes the weather forecast data 221 including weather forecast values such as forecast temperature and forecast humidity to the network 104.
- FIG. 2 is a diagram illustrating another configuration example of the weather correction system.
- the cloud server 105 is connected to the network 104 in the weather correction system Z1 of FIG.
- the cloud server 105 is a correction device 200 which will be described later with reference to FIG. 3, and acquires weather measurement data 222 measured by the temperature / humidity sensor 102 via the arithmetic device 101. Further, the cloud server 105 acquires weather forecast data 221 (see FIG. 3) including weather forecast values from the weather forecast server 103. And the cloud server 105 calculates a correction coefficient based on the acquired weather actual measurement value and a weather forecast value.
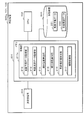
- FIG. 3 is a diagram illustrating a configuration example of the correction device.
- the correction device 200 corresponds to the arithmetic device 101 in the configuration shown in FIG. 1, and corresponds to the cloud server 105 in the configuration shown in FIG.
- the correction device 200 includes a memory 201 such as a RAM (Random Access Memory), a storage device 203 such as a CPU (Central Processing Unit) 202, an HD (Hard Disk), and a transmission / reception device 204 such as a NIC (Network Interface Card).
- a memory 201 such as a RAM (Random Access Memory)
- a storage device 203 such as a CPU (Central Processing Unit) 202, an HD (Hard Disk), and a transmission / reception device 204 such as a NIC (Network Interface Card).
- the program stored in the storage device 203 is expanded in the memory 201 and executed by the CPU 202, whereby the processing unit 211 is embodied, and the weather forecast data acquisition unit 212 that configures the processing unit 211, the weather measurement A data acquisition unit 213, an absolute humidity calculation unit 214, a correction coefficient calculation unit 215, and a weather correction value calculation unit 216 are embodied.
- the weather forecast data acquisition unit 212 acquires the weather forecast data 221 distributed from the weather forecast server 103 (see FIGS. 1 and 2) via the transmission / reception device 204.
- the weather forecast data 221 stores a plurality of weather forecast values such as forecast temperature and forecast humidity.
- the weather measurement data acquisition unit 213 acquires the weather measurement data 222 from the temperature / humidity sensor 102 (see FIGS. 1 and 2) via the transmission / reception device 204.
- the meteorological measurement data 222 stores a plurality of measured meteorological values such as measured temperature and measured humidity.
- the absolute humidity calculation unit 214 calculates the predicted absolute humidity from the predicted humidity included in the weather forecast data 221 and calculates the measured absolute humidity from the measured humidity included in the measured weather data 222.
- the correction coefficient calculation unit 215 calculates a correction coefficient for each time based on the weather forecast value for each time and the weather measured value for each time.
- the weather correction value calculation unit 216 calculates the weather correction value by applying the correction coefficient calculated by the correction coefficient calculation unit 215 to the weather forecast value at the time to be corrected. Further, the storage device 203 stores acquired weather forecast data 221, weather measurement data 222, and the like.
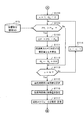
- FIG. 4 is a flowchart showing the overall processing procedure of the weather data correction processing.
- the correction device 200 acquires the weather forecast data 221 from the weather forecast server 103 by the weather forecast data acquisition unit 212.
- the correction device 200 calculates the predicted absolute humidity from the predicted humidity included in the weather forecast data 221 acquired by the absolute humidity calculation unit 214. Then, the correction device 200 stores the weather forecast data 221 including the calculated predicted absolute humidity in the storage device 203.
- step S ⁇ b> 311 the correction device 200 acquires the weather measurement data 222 from the temperature / humidity sensor 102 by the weather measurement data acquisition unit 213.
- step S ⁇ b> 312 the correction apparatus 200 calculates the measured absolute humidity from the measured humidity included in the measured weather data 222 acquired by the absolute humidity calculation unit 214. Thereafter, the correction device 200 stores the actually measured weather data 222 including the calculated actual measured absolute humidity in the storage device 203.
- step S ⁇ b> 321 the correction device 200 calculates a correction coefficient based on the weather forecast value included in the weather forecast data 221 and the weather actually measured value included in the weather actually measured data 222 by the correction coefficient calculating unit 215. The correction coefficient calculation process will be described later. Then, the correction coefficient calculation unit 215 stores the calculated correction coefficient in the storage device 203. Further, in step S322, the correction device 200 corrects the weather forecast value by applying the correction coefficient calculated in step S321 to the weather forecast value included in the weather forecast data 221 by the weather correction value calculation unit 216. Calculate the weather correction value. Thereafter, the correction device 200 stores the calculated weather correction value in the storage device 203 as weather correction data. The calculation of the weather correction value will be described later.
- FIG. 5 is a diagram showing an outline of data.
- the weather forecast data 221 and the actually measured weather data 222 have temperature (predicted temperature and actually measured temperature) and absolute humidity (predicted absolute humidity and actually measured absolute humidity), respectively.
- the absolute humidity is the predicted absolute humidity and the measured absolute humidity calculated in steps S302 and S312 of FIG.
- temperature data and absolute humidity data are stored every hour from 0:00 to 23:00.
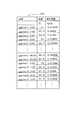
- 6A and 6B are diagrams showing actual data.
- 6A shows the weather forecast data 221
- FIG. 6B shows the weather measurement data 222.
- the weather forecast data 221 and the actually measured weather data 222 have date and time, temperature (predicted temperature, actually measured temperature), and absolute humidity (forecast absolute humidity, actually measured absolute humidity), respectively.
- the date and time is the date and time when the weather forecast data 221 and the weather measurement data 222 are acquired.
- the weather forecast data 221 and the actually measured weather data 222 are stored every hour from 0:00 to 23:00.
- the weather forecast data 221 and the meteorological measurement data 222 are stored every hour.
- the present invention is not limited to this, and may be every 30 minutes or every minute.
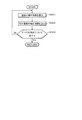
- FIG. 7 is a flowchart for calculating the correction coefficient. Note that the flowchart shown in FIG. 7 shows details of the processing in step S321 in FIG.
- the correction device 200 obtains the predicted temperature and the measured temperature at the processing target time from the weather forecast data 221 and the measured weather data 222 by the correction coefficient calculation unit 215.
- the correction device 200 calculates a correction coefficient for the temperature at the processing target time based on the predicted temperature and the actually measured temperature acquired by the correction coefficient calculation unit 215.
- the correction coefficient calculation unit 215 stores the calculated temperature correction coefficient in the storage device 203.
- the correction device 200 uses the correction coefficient calculation unit 215 to acquire the predicted absolute humidity and the measured absolute humidity at the time that is the processing target from the weather forecast data 221 and the measured weather data 222.
- the correction device 200 calculates a correction coefficient for the absolute humidity at the processing target time based on the predicted absolute humidity and the actual measurement absolute humidity acquired by the correction coefficient calculation unit 215.
- the correction device 200 stores the calculated absolute humidity correction coefficient in the storage device 203.
- step S ⁇ b> 403 the correction device 200 determines whether the correction coefficient calculation for the temperature and absolute humidity has been completed for all the times that are processed by the correction coefficient calculation unit 215.
- the processing target time is the time at which the weather correction value is calculated. If not completed (step S403 ⁇ No), the correction coefficient calculation unit 215 returns the process to step S401, and calculates the correction coefficient for temperature and absolute humidity for the next time. If it has been completed (step S403 ⁇ Yes), the correction coefficient calculation unit 215 returns the process to step S322 in FIG.
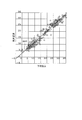
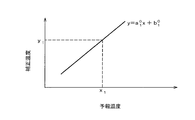
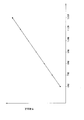
- FIGS. 8A to 10B are diagrams for explaining the calculation of the temperature correction coefficient.
- FIG. 8A is an example of a correction coefficient calculation graph at 0 o'clock in a certain place
- FIG. 8B is an example of a correction coefficient calculation graph at 13:00 in the same place as FIG. 8A.
- the horizontal axis is the predicted temperature
- the vertical axis is the actually measured temperature.
- the predicted temperature at the same time in the past and the actually measured temperature are plotted.
- FIG. 8A plots the predicted temperature at 0:00 and the actually measured temperature in the past year.
- FIG. 8B the predicted temperature at 13:00 in the past year and the actually measured temperature are associated with each other.
- the predicted temperature and the measured temperature in the past year are associated with each other, but the temperature is not limited to the past year as long as it is a fixed period. For example, the past six months may be used, but the past two weeks are desirable.
- the user may be able to change which period of weather forecast value and actually measured forecast value is used. By doing so, it is possible to reduce the number of weather forecast values and weather actually measured values used for the correction coefficient and reduce the processing load. Further, by not using data on the same month and day in the past, it is possible to make it less susceptible to the effects of weather fluctuations every year.
- the correction coefficient is set to the time based on the weather forecast data and weather measurement data for each of two weeks from 11/14 to 11/1. Calculate every time. Then, on the next day (11/16), the correction coefficient is calculated for each time based on the weather forecast data and meteorological observation data for each of two weeks from 11/15 to 11/2. Further, on the next day (11/17), a correction coefficient is calculated for each time based on weather forecast data and meteorological measurement data for two weeks from 11/16 to 11/3. By doing so, it is possible to make it less susceptible to the influence of seasonal fluctuations when calculating the correction coefficient.
- the correction coefficient calculation unit 215 calculates the following expression (1) at time i by applying the least square method to the points associated with the correction coefficient calculation graph.
- x indicates the predicted temperature
- y indicates the actually measured temperature.
- a 1 i and b 1 i are temperature correction coefficients at time i. That is, in the correction coefficient calculation graph in FIG. 8A, the slope a 1 0 and the y-intercept b 1 0 of the regression line 801 obtained by applying the least square method are temperature correction coefficients at 0:00. Similarly, in the correction coefficient calculation graph in FIG. 8B, the slope a 1 13 and the y-intercept b 1 13 of the regression line 802 obtained by applying the least square method are the temperature correction coefficients at 13:00.
- the correction coefficient calculation unit 215 calculates such a temperature correction coefficient for each processing target time.
- FIG. 10A and 10B are diagrams for explaining correction coefficient calculation of absolute humidity.
- FIG. 10A is an example of a correction coefficient calculation graph at 0 o'clock in a certain place
- FIG. 10B is an example of a correction coefficient calculation graph at 13:00 in the same place as FIG. 10A.
- the horizontal axis represents predicted absolute humidity
- the vertical axis represents measured absolute humidity.
- the predicted absolute humidity at the same time in the past and the measured absolute humidity are associated with each other.
- the predicted absolute humidity at 0:00 in the past year and the measured absolute humidity are associated with each other.
- the predicted absolute humidity at 13:00 and the measured absolute humidity in the past year are associated with each other.
- the predicted absolute humidity and the measured absolute humidity in the past year are associated with each other, but are not limited to the past year. Similar to the temperature, for example, the past half year may be used, but the past two weeks are desirable.
- the correction coefficient calculation unit 215 calculates the following expression (2) by applying the least square method to the points associated with the correction coefficient calculation graph.
- x represents the predicted absolute humidity
- y represents the measured absolute humidity
- a 2 i and b 2 i are absolute humidity correction coefficients at time i. That is, in the correction coefficient calculation graph in FIG. 10A, the slope a 2 0 and the y-intercept b 2 0 of the regression line 901 obtained by applying the least square method are absolute humidity correction coefficients at 0:00. Similarly, in the correction coefficient calculation graph in FIG. 10B, the slope a 2 13 and the y-intercept b 2 13 of the regression line 902 obtained by applying the least square method are correction coefficients for absolute humidity at 13:00.
- the correction coefficient calculation unit 215 calculates such an absolute humidity correction coefficient for each processing target time.
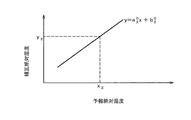
- 11A and 11B are diagrams for explaining a method for calculating a weather correction value.
- the weather correction value calculation unit 216 performs the same process for the absolute humidity at 0:00. That is, the weather correction value calculation unit 216 substitutes the predicted absolute humidity at 0:00 in the equation (2) at 0:00. That is, as shown in FIG. 11B, the absolute humidity forecast in 0:00 When x 2, the x 2, is y 2 obtained by substituting the equation (2) in 0:00, correction of the absolute humidity at time 0 Value.
- the weather correction value calculation unit 216 calculates the correction temperature and the correction absolute humidity at each time based on the correction coefficient at each time.
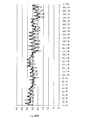
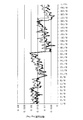
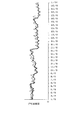
- FIG. 12 is a graph showing the relationship between the predicted temperature acquired from the weather forecast server and the measured temperature
- FIG. 13 is a graph showing the relationship between the corrected temperature corrected by the correction coefficient and the measured temperature.
- the solid line indicates the actually measured temperature
- the broken line indicates the predicted temperature
- the solid line indicates the actually measured temperature
- the broken line indicates the correction temperature.
- the corrected temperature in FIG. 13 is closer to the actually measured temperature than the predicted temperature in FIG.
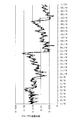
- FIG. 14 is a graph showing the relationship between the predicted absolute humidity calculated based on the value acquired from the weather forecast server and the measured absolute humidity.
- FIG. 15 shows the corrected absolute humidity and the measured absolute humidity corrected by the correction coefficient. It is a graph which shows the relationship.
- the solid line indicates the measured absolute humidity
- the broken line indicates the predicted absolute humidity.
- the solid line indicates the measured absolute humidity
- the broken line indicates the corrected absolute humidity.
- the corrected absolute humidity in FIG. 15 is closer to the actually measured absolute humidity than the predicted absolute humidity in FIG.
- the first embodiment it is possible to calculate a weather correction value that takes into account the weather information in the vicinity of the building to be applied (the vicinity of the temperature and humidity sensor 102). It is possible to calculate a weather correction value considering the above. Furthermore, by calculating the weather correction value for each time, it is possible to prevent a divergence between the weather forecast value in the morning, noon, evening, and the like and the weather measured value.
- a (linear) least square method is used to calculate the correction coefficient.
- the calculation of the correction coefficient is not limited to the (linear) least square method.
- the correction coefficient may be calculated by a nonlinear least square method or the like.
- the correction coefficient and the weather correction value are calculated for both the temperature and the absolute humidity which are greatly related to the thermal load fluctuation of the building, but either one of the correction coefficient and the weather correction value is calculated. You may make it do. For example, if the accuracy of the predicted temperature is relatively good, only the corrected absolute humidity may be calculated. Further, in the present embodiment, the weather correction value is calculated for the temperature and the absolute humidity.
- FIG. 16 is a diagram illustrating a configuration example of the correction apparatus according to the present embodiment.
- An interpolation processing unit 217 is added to the memory 201 of the correction apparatus 200a as a component of the processing unit 211a.
- the interpolation processing unit 217 is embodied by a program stored in the storage device 203 being expanded in the memory 201 and executed by the CPU 202.
- the interpolation processing unit 217 performs interpolation of weather forecast values.
- Other configurations are the same as those in FIG. 4, and thus the same reference numerals are given and description thereof is omitted.
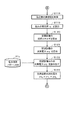
- FIG. 17 is a flowchart showing the overall processing procedure of the weather data correction processing.
- processes similar to those in FIG. 4 are denoted by the same step numbers and description thereof is omitted.
- the correction device 200a interpolates the weather forecast value by the interpolation processing unit 217.
- the interpolated weather forecast value is referred to as an interpolated weather forecast value.
- the correction device 200a adds the interpolated weather forecast value calculated to the weather forecast data 221.
- step S321 the correction device 200a corrects the correction coefficient based on the weather forecast value to which the interpolation weather forecast value is added by the correction coefficient calculation unit 215, the interpolated weather forecast value, and the weather measurement value. Is calculated.
- the subsequent processing is the same as in FIG.
- FIG. 18 is a diagram for explaining the interpolation of weather forecast values.
- the interpolation processing unit 217 interpolates the weather forecast value between 7 o'clock and 11 o'clock as shown in FIG. 18 based on the weather forecast values obtained at 6 o'clock and 12 o'clock (step of FIG. 17).
- a value obtained by dividing the weather forecast value at 6 o'clock (forecast temperature) and the weather forecast value at 12 o'clock (forecast temperature) into six equal parts is used as an interpolated weather forecast value (interpolated weather temperature).
- interpolated weather temperature an interpolated weather forecast value
- the interpolation value may be obtained from the change curve or the like.
- the correction coefficient calculation unit 215 calculates the correction coefficient at 6 o'clock and 12 o'clock by the method of the first embodiment (step of FIG. 4). S321). Further, the correction coefficient calculation unit 215 calculates a correction coefficient using the interpolated weather forecast value instead of the weather forecast value in the method of the first embodiment between 7:00 and 11:00 (step S321 in FIG. 17).
- an accurate weather correction value can be obtained in the same manner as in the first embodiment even in a place where a fine weather forecast value cannot be obtained, such as a developing country.
- the weather correction value calculation part 216 calculates a weather correction value by the method similar to 1st Embodiment (step S322 of FIG. 17).
- the thermal load of the air conditioning system S is estimated using the weather correction value calculated by the method in the first embodiment and the second embodiment, and the estimated thermal load A method for estimating power consumption in the air conditioning system S will be described.
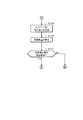
- FIG. 19 is a configuration diagram of an air conditioning system including an air conditioning management server according to the present embodiment.
- the solid line arrow shown in FIG. 19 represents the direction of the cold water etc. which flow through each piping, and the broken line arrow represents the signal line.
- the air conditioning system S includes an air conditioning facility A, a temperature / humidity sensor 30, a controller 40, a correction device 200, and an air conditioning management server 60.
- the air conditioning facility A is a facility that stores cold water cooled by the refrigerator 11 in the heat storage tank 14 and then circulates cold water from at least one of the refrigerator 11 and the heat storage tank 14 via the indoor unit 22. .
- the air conditioning facility A includes a primary side air conditioning facility 10 that generates and stores cold heat, and a secondary side air conditioning facility 20 that consumes cold heat.
- the primary side air conditioning equipment 10 includes a refrigerator 11, a cooling tower 12, a cooling water pump 13, a heat storage tank 14, and a primary side cold water pump 15.
- the refrigerator 11 is, for example, a turbo refrigerator, and is a cold heat source that cools cold water flowing in through the pipe q2.
- the cooling tower 12 is a facility that cools cooling water that has absorbed heat by a condenser (not shown) of the refrigerator 11, and has a blower 12 a that takes in outside air and blows it to the cooling water.
- the upstream end of the pipe p1 shown in FIG. 19 is connected to the refrigerator 11, and the downstream end is connected to the upper part of the cooling tower 12.
- the upstream end of the pipe p ⁇ b> 2 is connected to the lower part of the cooling tower 12, and the downstream end is connected to the refrigerator 11.
- the cooling water pump 13 is a pump that pumps the cooling water radiated and cooled by the cooling tower 12 toward the refrigerator 11 and is installed in the pipe p2.
- the heat storage tank 14 is, for example, a temperature stratified heat storage tank, and is equipment that stores cold heat by storing cold water cooled by an evaporator (not shown) of the refrigerator 11. Incidentally, the cold water is more likely to settle as the temperature is lower, so the cold water stored in the heat storage tank 14 becomes lower as it goes downward.
- the upstream end of the pipe q1 is connected to the refrigerator 11, and the downstream end faces the lower region of the heat storage tank 14.
- the upstream end of the pipe q ⁇ b> 2 faces the upper region of the heat storage tank 14, and the downstream end is connected to the refrigerator 11.
- the primary side cold water pump 15 is a pump that pumps cold water from the heat storage tank 14 toward the refrigerator 11 and is installed in the pipe q2.
- the secondary side air conditioning equipment 20 includes a secondary side cold water pump 21 and an indoor unit 22.
- the secondary side cold water pump 21 is a pump that pumps cold water from the heat storage tank 14 toward the indoor heat exchanger 22a, and is installed in the pipe q3.
- the upstream end of the pipe q3 faces the lower region of the heat storage tank 14, and the downstream end of the pipe q3 is connected to the upstream end of the heat transfer pipe r included in the indoor heat exchanger 22a.
- the upstream end of the pipe q4 is connected to the downstream end of the heat transfer pipe r, and the downstream end of the pipe q4 faces the upper region of the heat storage tank 14.
- the indoor unit 22 (FCU: Fan Coil Unit) cools indoor air by heat exchange with cold water, and is installed in the room of the facility K.
- the indoor unit 22 includes an indoor heat exchanger 22a and an indoor fan 22b.
- the indoor air is cooled by exchanging heat between the low-temperature cold water flowing through the heat transfer tube r and the high-temperature air sent from the indoor fan 22b.
- the refrigerator 11, the blower 12 a of the cooling tower 12, the cooling water pump 13, the primary side cold water pump 15, the secondary side cold water pump 21, and the indoor fan 22 b are electric power supplied from an electric power system (not shown). The operation is controlled by the controller 40.
- a plurality of devices including a lighting device R1 and a business personal computer R2 are installed in the room of the facility (air conditioning target area) K. Since the lighting device R1 and the like are operated / stopped regardless of changes in weather conditions, the power consumption varies in a substantially determined pattern depending on the date, day of the week, time zone, and the like.
- the power consumption pattern of the lighting device R1 and the like is stored in a power consumption pattern DB 61a (see FIG. 20) of the air conditioning management server 60 described later.
- a device such as the refrigerator 11 included in the air conditioning facility A and a device (such as the lighting device R1) not included in the air conditioning facility A are collectively referred to as a “load device”.
- the temperature / humidity sensor 30 is a sensor that measures the temperature and humidity of the outside air, and is installed near the facility K. The temperature / humidity actually measured by the temperature / humidity sensor 30 is output to the controller 40.
- the controller 40 controls each device of the air conditioning equipment A, and includes electronic circuits such as a CPU, a ROM (Read Only Memory), a RAM, and various interfaces. As shown in FIG. 19, the controller 40 is connected to the air conditioning management server 60 via the network N. The temperature / humidity near the facility K measured by the temperature / humidity sensor 30 is transmitted from the controller 40 to the air conditioning management server 60 via the network N.
- Information including the operation schedule of the air conditioning equipment A is transmitted from the air conditioning management server 60 to the controller 40 via the network N.
- the controller 40 switches the operation mode of the air conditioning equipment A according to the information received from the air conditioning management server 60.
- the controller 40 may display information including an operation schedule on a display (not shown), and the operation mode of the air conditioning equipment A may be switched by an operation of an administrator who has seen this information.
- the above-described operation modes include a heat storage operation, a follow-up operation, and a heat radiation operation.
- the “heat storage operation” is an operation mode in which cold water is cooled by the refrigerator 11 and the cooled cold water is stored in the heat storage tank 14.
- “Catch-up operation” is an operation mode in which the cold water cooled by the refrigerator 11 is supplied to the indoor unit 22 as it is.
- the “heat radiation operation” is an operation mode in which low-temperature cold water stored in the heat storage tank 14 is circulated through the indoor unit 22.
- the power consumption of the air conditioning equipment A is significantly smaller than during execution of other operation modes.
- FIG. 19 one air conditioning facility A, one temperature / humidity sensor 30 and one controller 40 are shown, but in reality, a plurality of air conditioning facilities A and the like are installed at each site.
- the controller 40 at each site is a cloud computing system in which information is exchanged with the air conditioning management server 60 via the network N.
- the correction device 200 is the correction device 200 in the first embodiment.
- the correction device 200a in the second embodiment may be used.
- a temperature / humidity sensor 102 and a weather forecast server 103 are connected to the correction device 200 as shown in FIGS. 1 and 2, but the temperature / humidity sensor 102 and the weather forecast server 103 are not shown here.
- the air conditioning management server 60 (air conditioning management device) creates an operation schedule of the air conditioning equipment A based on the weather correction value received from the correction device 200, or performs the heat radiation operation according to the measured temperature and humidity values received from the controller 40. This is a server that generates a command signal as to whether or not to start.
- the air conditioning management server 60 is configured to collectively manage an operation schedule and the like of the air conditioning equipment A installed at each base.
- FIG. 20 is a configuration diagram of an air conditioning management server according to the present embodiment.
- the air-conditioning management server 60 includes a storage unit 61 that stores information related to setting of an operation schedule, and an arithmetic processing unit 62 that executes various arithmetic processes.
- a power consumption pattern DB (Data Base) 61a and a power consumption threshold DB 61b are stored as a database.
- the power consumption pattern DB 61a stores power consumption patterns of the lighting device R1 and the like that are not included in the air conditioning equipment A among the above-described “load devices”. That is, the power consumption pattern DB 61a stores predicted values of power consumption of the lighting device R1 and the like in association with the date, day of the week, time, and the like.
- the power consumption threshold DB 61b stores information on the power consumption threshold P M (predetermined threshold) of the load device.
- the threshold P M is a threshold value serving as a criterion for determining whether performing radiating operation is previously set for each air-conditioning equipment A of each site.
- the threshold P M is set to a value smaller than the contracted power P C is the upper limit threshold of the power purchase power.
- the arithmetic processing unit 62 includes a weather correction value acquisition unit 62a, a thermal load prediction unit 62b, a consumption energy prediction unit 62c, a power consumption prediction unit 62d, a schedule setting unit 62e, and an actual measurement value.
- the acquisition unit 62f, the thermal load calculation unit 62g, the energy consumption calculation unit 62h, the power consumption calculation unit 62i, the command signal generation unit 62j, and the command signal transmission unit 62k are provided.
- the weather correction value acquisition unit 62a periodically acquires the weather correction value of the area including the facility K from the correction device 200.
- the thermal load prediction unit 62b predicts the thermal load in the facility K based on the weather correction value acquired by the weather correction value acquisition unit 62a.
- This thermal load is an air conditioning load (cooling load) for keeping the inside of the facility K at a predetermined temperature.
- the thermal load predicting unit 62b calculates the thermal load in the facility K based on the weather correction value, the set temperature in the facility K, the structure of the casing constituting the facility K, and the like.
- the energy consumption predicting unit 62c supplies the cold energy from the refrigerator 11 to the facility K based on the thermal load predicted by the thermal load predicting unit 62b (cools the facility K in the follow-up operation). Predict energy consumption.
- the energy consumption prediction unit 62c calculates the energy consumption of the air conditioning equipment A based on the heat load, the weather correction value of the outdoor air wet bulb temperature on the next day, the specification information of the air conditioning equipment A, and the like.
- the power consumption prediction unit 62d predicts the power consumption of the load device including the air conditioning equipment A based on the energy consumption predicted by the energy consumption prediction unit 62c. This power consumption corresponds to the power consumption when the facility K is cooled in the follow-up operation (that is, the heat dissipation operation is not performed).
- the schedule setting unit 62e sets the operation schedule of the air conditioning equipment A based on the power consumption predicted by the power consumption prediction unit 62d. Then, the schedule setting unit 62e transmits the set operation schedule to the controller 40 via the network N (see FIG. 19). Details of the process executed by the schedule setting unit 62e will be described later.
- the actual measurement value acquisition unit 62f acquires the current actual measurement value of the temperature and humidity near the facility K from the controller 40 via the network N (see FIG. 19) every predetermined time (for example, every five minutes).
- the above “present” includes minutes before the time when the actual measurement value acquisition unit 62f acquires the actual measurement value of temperature and humidity, tens of minutes before, and the like.
- the thermal load calculation unit 62g calculates the current thermal load in the facility K based on the actual temperature / humidity value acquired by the actual value acquisition unit 62f.
- the energy consumption calculating unit 62h supplies the cold air from the refrigerator 11 to the facility K based on the heat load calculated by the heat load calculating unit 62g (cools the facility K in the follow-up operation). Calculate energy consumption.
- the power consumption calculation unit 62i calculates the power consumption of the load device including the air conditioning equipment A based on the energy consumption calculated by the energy consumption calculation unit 62h. This power consumption corresponds to the power consumption when it is assumed that the facility K is cooled in the follow-up operation (that is, the heat dissipation operation is not performed).
- the command signal generation unit 62j has a function of generating a command signal for determining whether or not to perform the heat radiation operation. As illustrated in FIG. 20, the command signal generation unit 62j includes a thermal load comparison unit 621j, a power consumption comparison unit 622j, and a heat release start time change unit 623j.
- the thermal load comparison unit 621j compares the thermal load predicted by the thermal load prediction unit 62b with the thermal load calculated by the thermal load calculation unit 62g (actual thermal load). The comparison result by the thermal load comparison unit 621j is output to the heat release start time changing unit 623j.
- Power comparator unit 622j compares the power consumption calculated by the power consumption calculation unit 62i, and a threshold P M that is stored in the power threshold DB61b, large and small. The comparison result by the power consumption comparison unit 622j is output to the heat release start time change unit 623j.
- the heat release start time changing unit 623j changes the start time of the heat release operation set by the schedule setting unit 62e based on the comparison result by the thermal load comparison unit 621j and the comparison result by the power consumption comparison unit 622j. That is, the heat release start time changing unit 623j has a function of making the start time of the heat release operation earlier or later than the scheduled start time of the operation schedule. The processing executed by the heat release start time changing unit 623j will be described later.
- the command signal transmission unit 62k transmits the command signal generated by the command signal generation unit 62j to the controller 40 via the network N (see FIG. 19).
- ⁇ Operation of air conditioning management server> 21 to 25 are flowcharts showing the flow of processing executed by the air conditioning management server.
- step S101 the air conditioning management server 60 determines whether or not the distribution time of the weather correction value has come.
- step S102 the air conditioning management server 60 acquires a weather correction value from the correction device 200 by the weather correction value acquisition unit 62a (weather correction value acquisition step).
- the “meteorological correction value” includes the temperature correction value and the absolute humidity correction value for 24 hours (every hour).
- step S103 the air conditioning management server 60 determines the thermal load q f in the facility K for each time zone obtained by dividing the aforementioned 24 hours into a plurality of times (for example, every hour) and the time corresponding to the acquired weather correction value. Predict (thermal load prediction step). In addition, it is preferable to predict a heat load using a heat load simulator based on a weather correction value, a set temperature in the facility K, and the like.
- Air conditioning management server 60 in step S104 based on the heat load q f predicted in step S103, the energy consumption prediction unit 62c, the consumption energy of the air conditioning equipment A to predict for each time zone (energy consumption prediction step).
- the energy consumption prediction unit 62c the consumption energy of the air conditioning equipment A to predict for each time zone (energy consumption prediction step).
- step S105 the air conditioning management server 60 predicts the power consumption P1 f of the air conditioning equipment A for each time zone by the power consumption prediction unit 62d based on the energy consumption predicted in step S104.
- the power consumption P1 f is the power consumption when the facility K is cooled in the follow-up operation.
- Air conditioning management server 60 in step S106 refers to the power consumption pattern DB 61a (see FIG. 20), the power P2 f of devices other than the air conditioning equipment A (illumination device R1, etc.) predicted for each time zone.
- step S107 the air conditioning management server 60 adds the power consumption P1 f of the air conditioning equipment A and the power consumption P2 f of the equipment other than the air conditioning equipment A to obtain the power consumption P3 f of the load device for each time. Predicting the band (power consumption prediction step).
- Air conditioning management server 60 in step S108 of FIG. 22, the value n 1, the initial value of the required heat storage amount Q V to zero.
- a time zone represented by time (t1 + (n ⁇ 1) ⁇ t) to time (t1 + n ⁇ t) is specified.
- the time t1 is, for example, 7:00 am when the heat storage operation is ended and the follow-up operation is started, and the predetermined time ⁇ t is, for example, 1 hour.
- necessary heat storage amount Q V is power P3 f of the load device is a cold amount required to cancel the amount of power region exceeding the threshold value P M.
- Air conditioning management server 60 in step S109 it is determined with reference to the power threshold DB61b, identified with respect to time zone value n in step S108, whether the power P3 f of the load device exceeds the threshold value P M . If the power consumption P3 f exceeds the threshold value P M (step S109 ⁇ Yes), the processing of the air conditioning management server 60 proceeds to step S110. On the other hand, if the power consumption P3 f is equal to or less than the threshold value P M (step S109 ⁇ No), the processing of the air conditioning management server 60 proceeds to step S113.
- Step air conditioning management server 60 in S110 calculates the excess power ⁇ P by subtracting the threshold P M from the power consumption P3 f.
- the air conditioning management server 60 calculates a heat storage amount ⁇ Q corresponding to the excess power ⁇ P calculated in step S110. That is, the air conditioning management server 60 calculates the amount of heat storage ⁇ Q required to cancel the amount of power calculated by excess power ⁇ P ⁇ predetermined time ⁇ t.
- This heat storage amount ⁇ Q is calculated based on the specification information of the devices constituting the air conditioning equipment A, the weather correction value of the outside air wet bulb temperature, and the like.
- the air conditioning management server 60 updates the necessary heat storage amount Q V by adding the heat storage amount ⁇ Q needed heat storage amount Q V initial value zero (step S108).
- Air conditioning management server at step S115 60 so as to satisfy the final updated necessary heat storage amount Q V in step S112, the time period of performing the heat storage operation (heat storage time period) and the heat storage amount (load factor of the refrigerator 11 or the like ) Is set.
- the time zone of the heat storage operation so that the heat storage operation is performed using inexpensive nighttime electric power.
- the air conditioning management server 60 sets a time zone (heat release time zone) in which heat release operation is performed and a heat release amount (such as a flow rate of cold water).
- a heat release time zone such as a flow rate of cold water.
- the air conditioning management server 60 power P3 f of the load device is set the operation scheduled for radiating operation in the time zone that exceeds the threshold value P M.
- step S117 the air conditioning management server 60 sets an operation schedule obtained by adding a schedule such as a follow-up operation to the heat storage operation schedule set in step S115 and the heat radiation operation schedule set in step S116 by the schedule setting unit 62e.
- This operation schedule includes types of operation modes (heat storage operation, follow-up operation, heat radiation operation, etc.) and time zones (start time, end time) for performing each operation mode. Then, the air conditioning management server 60 transmits the operation schedule set via the network N to the controller 40.
- FIG. 23 is a flowchart showing a flow of processing executed by the air conditioning management server.
- cold heat is stored in the heat storage tank 14 at the start of step S118 (the heat storage operation has been completed), and the controller 40 performs a follow-up operation or a heat radiation operation according to the operation schedule set in step S117 of FIG. Is assumed to be executed.
- step S118 the air conditioning management server 60 acquires the measured value of the temperature and humidity near the facility K from the controller 40 by the measured value acquisition unit 62f (actual value acquisition step).
- the temperature / humidity described above is a value detected by the temperature / humidity sensor 30 immediately before the process of step S118. Note that the temperature and humidity may be measured every 5 minutes, and the measured values for one hour immediately before performing the process of step S118 may be averaged.
- step S119 the air conditioning management server 60 calculates the current thermal load qr of the air conditioning equipment A by the thermal load calculation unit 62g based on the actually measured value of temperature and humidity acquired in step S118 (thermal load calculation step).
- step S120 the air conditioning management server 60 calculates the current energy consumption of the air conditioning equipment A by the energy consumption calculation unit 62h based on the thermal load qr calculated in step S119 (energy consumption calculation step).
- Air conditioning management server 60 in step S121 based on the consumption Nerugi calculated in step S120, the power consumption calculation unit 62i, and calculates the power consumption P1 r HVAC A (power calculating step).
- This power consumption P1 r is the power consumption when it is assumed that the air conditioning equipment A continues the follow-up operation without performing the heat radiation operation.
- Air conditioning management server 60 in step S122 refers to the power consumption pattern DB 61a, reads the power consumption P2 r of devices other than the air conditioning equipment A (lighting equipment, etc.).
- step S123 the air conditioning management server 60 calculates the power consumption P3 r of the load device by adding the power consumption P1 r of the air conditioning equipment A and the power consumption P2 r of the equipment other than the air conditioning equipment A.
- step S125 the air conditioning management server 60 determines whether or not the current time is included in the heat radiation time zone set in step S116 (see FIG. 22). When the current time is not included in the set heat radiation time zone (step S125 ⁇ No), the process of the air conditioning management server 60 proceeds to step S126. For example, if the heat release time zone of the operation schedule is from 13:00 to 18:00 and the current time is 11:00, the process of the air conditioning management server 60 proceeds to step S126.
- Air conditioning management server 60 in step S126 determines whether the power P3 r of the load device calculated in (see FIG. 23) exceeds the threshold value P M. If the power consumption P3 r exceeds the threshold value P M (step S126 ⁇ Yes), the processing of the air conditioning management server 60 proceeds to step S127.
- step S127 the air conditioning management server 60 determines whether or not cold energy is stored in the heat storage tank 14 (whether there is heat storage). For example, the air conditioning management server 60 determines whether or not the value obtained by subtracting the amount of cold consumed by the secondary side air conditioning equipment 20 during the heat radiation operation from the amount of cold generated by the primary side air conditioning equipment 10 during the heat storage operation is greater than zero. Thus, the determination process in step S127 is performed.
- step S127 When cold heat is stored in the heat storage tank 14 (when there is heat storage: step S127 ⁇ Yes), the processing of the air conditioning management server 60 proceeds to step S128.
- step S127 when cold heat is not stored in the heat storage tank 14 in step S127 (when there is no heat storage: step S127 ⁇ No), the processing of the air conditioning management server 60 proceeds to step S129.
- step S129 the air conditioning management server 60 determines that the heat radiation operation is not performed (cannot be continued).
- the cold heat of the heat storage tank 14 may be used up at the end of the time zone. There is sex.
- step S130 the air conditioning management server 60 sets another measure by generating a command signal indicating that a measure different from the heat radiation operation is performed.
- the air conditioning management server 60 in order to suppress the power consumption of the load device below the threshold P M, usually also reduce than the power consumption of such an illumination device R1 while continuing to add hanging operation. If the current time is included in the heat radiation time zone in step S125 (step S125 ⁇ Yes), the air conditioning management server 60 proceeds to step S127.
- the processes after step S127 are as described above.
- step S131 the air conditioning management server 60 generates a command signal indicating that the heat radiation operation is not performed (not started yet). For example, towards the heat load q r based on the measured values of temperature and humidity, it is greater than the heat load q f based on the weather correction value, sometimes power P r is not greater than the threshold value P M. In this case, it is not necessary to perform a heat radiation operation (step S131).
- step S132 the air conditioning management server 60 determines whether or not the current time is included in the heat radiation time zone set in step S116 (see FIG. 22). When the current time is not included in the set heat radiation time zone (step S132 ⁇ No), the process of the air conditioning management server 60 proceeds to step S133. In step S133, the air conditioning management server 60 determines not to perform the heat dissipation operation (not to start yet).
- step S132 when the current time is included in the set heat radiation time zone (step S132 ⁇ Yes), the processing of the air conditioning management server 60 proceeds to step S134.
- Step air conditioning management server 60 in S134 determines whether the current power consumption P3 r calculated in step S123 exceeds the threshold value P M. If the current power consumption P3 r exceeds the threshold value P M (step S134 ⁇ Yes), the processing of the air conditioning management server 60 the process proceeds to the step S135.
- step S135 the air conditioning management server 60 determines whether or not cold energy is stored in the heat storage tank 14 (whether there is heat storage). When cold heat is stored in the heat storage tank 14 (when there is heat storage: step S135 ⁇ Yes), the processing of the air conditioning management server 60 proceeds to step S136.
- step S136 the air conditioning management server 60 generates a command signal to execute (start) the heat radiation operation. That is, although the heat load of the air conditioning equipment A is slightly smaller than expected, when the power consumption of the load device exceeds the threshold value P M, since the heat generated by the load other than the air conditioning equipment A is considered, the radiating operation by the controller 40 Do.
- step S135 the processing of the air conditioning management server 60 proceeds to step S137.
- step S137 the air conditioning management server 60 determines that the heat radiation operation is not performed (cannot be continued).
- step S138 the air conditioning management server 60 sets another measure by generating a command signal indicating that a measure different from the heat dissipation operation (for example, reduction of power consumption of the lighting device R1 or the like) is generated.
- step S134 if the current power consumption P3 r in step S134 is equal to or smaller than the threshold value P M (step S134 ⁇ No), the air conditioning management server 60 in step S133, does not perform the radiating operation (still not start) effect of the command signal Is generated. That is, the air conditioning management server 60, scheduled start time after the radiating operation, if the power consumption P3 r is equal to or less than the threshold value P M, delaying the start time of the radiating operation.
- step S139 of FIG. 25 the air conditioning management server 60 transmits the command signal generated in step S128 or the like to the controller 40 by the command signal transmission unit 62k (command signal transmission step).
- step S140 the air conditioning management server 60 calculates the remaining heat storage amount of the heat storage tank 14. That is, the air conditioning management server 60 calculates the remaining heat storage amount of the heat storage tank 14 based on the amount of cold supplied to the secondary side air conditioning facility 20 during the heat radiation operation. This remaining heat storage amount is used in the processes of steps S127 and S135 in the next cycle (determination process for determining whether there is heat storage: see FIG. 24).
- step S141 the air conditioning management server 60 determines whether or not the distribution time of the weather correction value has come.
- step S141 ⁇ Yes the processing of the air conditioning management server 60 returns to step S102 in FIG.
- step S141 ⁇ No the processing of the air conditioning management server 60 returns to step S118 of FIG.
- the series of processing from step S118 to step S141 is repeated according to the time (for example, every hour) at which the weather correction value is distributed.
- the processing from step S118 to step S141 may be performed, for example, every few minutes or every few seconds.
- the heat load can be predicted in consideration of the location conditions of the building by performing the heat load prediction using the weather correction value calculated by the correction device. Furthermore, the thermal load can be predicted for each time by predicting the thermal load using the weather correction value calculated for each time. As a result, it is possible to prevent a deviation between the weather forecast value in the morning, noon, evening, and the like and the weather measurement value. In addition, by applying the method according to the second embodiment to the third embodiment and the fourth embodiment to be described later, the heat load is predicted using the weather correction value even when the weather forecast data cannot be acquired. Can do.
- the change in the weather condition due to the location condition and time is taken into consideration. It is possible to predict the heat load and the power consumption. Thereby, the prediction accuracy of heat load and the prediction accuracy of power consumption can be improved. Further, according to the third embodiment and the fourth embodiment to be described later, it is possible to make an appropriate plan for the peak shift, and it becomes possible to reduce the running cost due to the effect of contract power reduction. Furthermore, since the air conditioning system S according to the third and fourth embodiments does not directly calculate power consumption from past weather forecast values, it can be flexibly applied.
- the air conditioning management server 60 starts at the radiating operation Is earlier than planned (step S128). Thereby, compared with the case where the air conditioning equipment A is controlled according to the operation schedule, the power leveling of the load device can be appropriately performed. Also, if the power P3 r of the load device at the scheduled start time after the radiating operation is less than the threshold value P M (step S134 ⁇ No), the air conditioning management server 60 delays than scheduled start time of the radiating operation (step S133 ). This makes it possible to effectively use the cold energy stored in the heat storage tank 14 in preparation for a situation in which the heat load becomes larger than predicted.
- the air conditioning management server 60 checks in real time whether or not the heat release time zone of the operation schedule is appropriate based on the actually measured temperature and humidity, and transmits a command signal to the controller 40 according to the check result. Thereby, for example, even if the weather correction value is lost and the thermal load in the facility K rapidly increases, the power consumption of the load device can be suppressed by immediately starting the heat radiation operation. Therefore, power consumption of the load device can be prevented from exceeding contract power P C.
- the air conditioning system S is a cloud computing system in which information about a plurality of air conditioning facilities A is collectively managed by the air conditioning management server 60 and information is provided to a large number of users. Therefore, what the user should prepare is only the minimum connection environment, and the cost required for the management of the air conditioning equipment A can be greatly reduced. Further, since the processing of the air conditioning management server 60 is automatically performed using a heat source simulator or the like, the power consumption is leveled with high accuracy compared to the case where the operator adjusts the operation schedule through trial and error. be able to.
- a power meter 70 for actually measuring the power consumption of each device is added to the air conditioning system S according to the third embodiment, and the configuration of the air conditioning management server 60A (see FIG. 27).
- the other points are the same as in the third embodiment. Therefore, a different part from 3rd Embodiment is demonstrated and description is abbreviate
- FIG. 26 is a configuration diagram of an air conditioning system including an air conditioning management server according to the present embodiment.
- the wattmeter 70 includes the refrigerator 11, the blower 12 a, the cooling water pump 13, the primary side cold water pump 15, the secondary side cold water pump 21, the indoor fan 22 b, and the power consumption P3 r (total value) of each device in the facility K. It is actually measured. The value of the power consumption P3 r actually measured by the wattmeter 70 is output to the controller 40. And the controller 40 transmits the measured value of the temperature / humidity sensor 30 and the wattmeter 70 to the air-conditioning management server 60A via the network N every 5 minutes, for example.
- FIG. 27 is a configuration diagram of an air conditioning management server according to the present embodiment.
- the configuration of the air conditioning management server 60A shown in FIG. 27 omits the energy consumption calculation unit 62h (see FIG. 20) from the air conditioning management server 60 (see FIG. 20) described in the third embodiment, and the power consumption calculation unit 62i (FIG. 20), but includes a power consumption acquisition unit 62m, but the other points are the same as the configuration of the third embodiment.
- the power consumption acquisition unit 62m acquires the actual measurement value of the wattmeter 70 (that is, the actual power consumption of the load device) from the controller 40 via the network N.
- the actual value of power consumption acquired by the power consumption acquisition unit 62m is output to the power consumption comparison unit 622j.
- the magnitude of the measured value and the threshold value P M of the power consumption is compared.
- FIG. 28 is a flowchart illustrating a flow of processing executed by the air conditioning management server.
- the process for setting the operation schedule of the air conditioning equipment A (steps S101 to S117: see FIGS. 21 and 22) is the same as that of the third embodiment. Further, at the start of the process shown in FIG. 28, the air conditioning facility A is performing a follow-up operation or a heat radiation operation.
- step S118 the air conditioning management server 60A acquires the measured value of the temperature and humidity near the facility K from the controller 40 by the measured value acquisition unit 62f.
- step S119 the air conditioning management server 60A calculates the current thermal load qr of the air conditioning equipment A by the thermal load calculation unit 62g based on the actually measured value of temperature and humidity acquired in step S118.
- the heat load q r is used in the comparison process with the predicted thermal load q f (Step S124: see FIG. 29).
- the air conditioning management server 60A in step S201, the power consumption acquiring unit 62m obtains the current power P S of the load device from the controller 40 (power consumption acquisition step). As described above, the power consumption P S is the actually measured value by the power meter 70.
- step S201 After executing the process of step S201, the process of the air conditioning management server 60A proceeds to step S124 shown in FIG. Note that the series of processing shown in FIG. 29 is the same as the flowchart of FIG. 24 described in the third embodiment, except for steps S202 and S203.
- step S125 ⁇ No if the actually measured power consumption P S exceeds the threshold value P M (step S202 ⁇ Yes), the air conditioning management server 60A executes heat radiation Thus, the start time of the heat radiation operation is made earlier than planned (step S128). Further, heat radiation scheduled start time after the operation (steps S132, including the current time to the heat dissipation time zone planned? ⁇ Yes), if the actually measured power consumption P S is equal to or less than the threshold value P M (step S203 ⁇ No ) The air conditioning management server 60A does not perform heat radiation, thereby delaying the start time of the heat radiation operation from the schedule (step S133). Note that the processing of step S139 to step S141 after node D is the same as the flowchart of FIG. 25 described in the third embodiment, and thus description thereof is omitted.
- the operation schedule can be flexibly changed in accordance with changes in the actually measured temperature and humidity.
- the power consumption P1 r of the air conditioning equipment A is calculated based on the actually measured value of the temperature / humidity sensor 30 (step S121: see FIG. 23), and the power consumption P2 r of equipment other than the air conditioning equipment A is calculated. read from the power consumption pattern DB61a (step S122), was calculated power P3 r of the load device take the sum of both (step S123).
- the operation schedule can be adjusted with higher accuracy than in the third embodiment.
- the current heat load q r is, the determination process of whether or not the predicted heat load q f above: there has been described a case where a (step S124 see Figure 24), but not limited to . That is, regardless of the heat load q r, q f, so as to repeatedly execute the processing that continues to perform radiating operation when the power consumption was measured by the power meter 70 exceeds the threshold value P M for a predetermined time May be. In this case, it is possible to suppress the power consumption of the load device below contract power P C.
- a solar radiation amount predicted value or the like may be added to the weather correction value.
- the power consumption P3 f has been described for storing the minimum cold necessary to counteract the minute amount of power exceeds a threshold value P M in the thermal storage tank 14 is not limited thereto.
- the heat storage tank 14 may be fully stored by the heat storage operation.
- a method for predicting power consumption other than those in the third embodiment and the fourth embodiment may be used.
- FIG. 30A and 30B are diagrams showing the results of thermal load prediction before and after the correction of the weather forecast value.
- the thermal load prediction uses the method in the third embodiment.
- FIG. 30A shows a case where the heat load is calculated using the weather forecast value as a comparative example
- FIG. 30B shows a case where the heat load is calculated using the weather correction value calculated by the method according to the first embodiment.
- a solid line indicates a change in actual heat load
- a broken line indicates a change in heat load calculated using weather forecast values.
- FIG. 30B a solid line indicates a change in actual heat load
- a broken line indicates a change in heat load calculated using the weather correction value.
- the present invention is not limited to the above-described embodiment, and includes various modifications.
- the above-described embodiment has been described in detail for easy understanding of the present invention, and is not necessarily limited to having all the configurations described.
- a part of the configuration of a certain embodiment can be replaced with the configuration of another embodiment, and the configuration of another embodiment can be added to the configuration of a certain embodiment.
- each of the above-described configurations, functions, units 211 to 217, 62, 62a to 62k, 62m, 621j, 622j, and 623j, the storage device 203, the storage unit 61, and the like may be partially or fully configured by, for example, an integrated circuit You may implement
- the above-described configurations, functions, and the like are realized by software by interpreting and executing a program that realizes each function by a processor such as a CPU. May be.
- a memory In addition to storing information such as programs, tables, and files for realizing each function in the HD, a memory, a recording device such as an SSD (Solid State Drive), an IC (Integrated Circuit) card, an SD (Secure) It can be stored in a recording medium such as a Digital) card or a DVD (Digital Versatile Disc).
- SSD Solid State Drive
- IC Integrated Circuit
- SD Secure Digital
- the correction devices 200 and 200a and the units 211 to 217, 62, 62a to 62k, 62m, 621j, 622j, and 623j of the air conditioning management servers 60 and 60A shown in FIGS. 3, 16, 20, and 27 are one device. You may make it mount on. Further, a device having at least one of the units 211 to 217, 62, 62a to 62k, 62m, 621j, 622j, and 623j may be installed separately from the correction devices 200 and 200a and the air conditioning management servers 60 and 60A. .
- control lines and information lines indicate what is considered necessary for the explanation, and not all the control lines and information lines on the product are necessarily shown. In practice, it can be considered that almost all configurations are connected to each other.
- Air conditioning system air conditioning management system K facility A air conditioning equipment Z, Z1, Z2 weather correction system 11 refrigerator 14 heat storage tank 30 temperature / humidity sensor 40 controller 60, 60A air conditioning management server 62 arithmetic processing section (air conditioning control section) 62a Weather correction value acquisition unit 62b Thermal load prediction unit 62c Energy consumption prediction unit 62d Power consumption prediction unit (power consumption prediction unit) 62e Schedule setting unit 62f Actual measurement value acquisition unit 62g Thermal load calculation unit 62h Energy consumption calculation unit 62i Power consumption calculation unit 62j Command signal generation unit 62k Command signal transmission unit 62m Power consumption acquisition unit 70 Wattmeter 102 Temperature / humidity sensor 103 Weather forecast server 200, 200a Correction device (weather correction device) 211 Processing Unit 212 Weather Forecast Data Acquisition Unit 213 Weather Measurement Data Acquisition Unit 214 Absolute Humidity Calculation Unit 215 Correction Coefficient Calculation Unit 216 Weather Correction Value Calculation Unit 217 Interpolation Processing Unit 221 Weather Forecast Data 222 Weather Measurement Data
Landscapes
- Engineering & Computer Science (AREA)
- Environmental & Geological Engineering (AREA)
- Combustion & Propulsion (AREA)
- Mechanical Engineering (AREA)
- General Engineering & Computer Science (AREA)
- Chemical & Material Sciences (AREA)
- Power Engineering (AREA)
- Life Sciences & Earth Sciences (AREA)
- Atmospheric Sciences (AREA)
- Biodiversity & Conservation Biology (AREA)
- Ecology (AREA)
- Environmental Sciences (AREA)
- Air Conditioning Control Device (AREA)
- Air-Conditioning For Vehicles (AREA)
Priority Applications (2)
| Application Number | Priority Date | Filing Date | Title |
|---|---|---|---|
| MYPI2017701955A MY191364A (en) | 2014-12-02 | 2015-11-06 | Weather correction device, air conditioning management system, and weather correction method |
| SG11201704344PA SG11201704344PA (en) | 2014-12-02 | 2015-11-06 | Weather correction device, air conditioning management system, and weather correction method |
Applications Claiming Priority (2)
| Application Number | Priority Date | Filing Date | Title |
|---|---|---|---|
| JP2014-244208 | 2014-12-02 | ||
| JP2014244208A JP6405210B2 (ja) | 2014-12-02 | 2014-12-02 | 気象補正装置、空調管理システム及び気象補正方法 |
Publications (1)
| Publication Number | Publication Date |
|---|---|
| WO2016088509A1 true WO2016088509A1 (ja) | 2016-06-09 |
Family
ID=56091461
Family Applications (1)
| Application Number | Title | Priority Date | Filing Date |
|---|---|---|---|
| PCT/JP2015/081340 Ceased WO2016088509A1 (ja) | 2014-12-02 | 2015-11-06 | 気象補正装置、空調管理システム及び気象補正方法 |
Country Status (4)
| Country | Link |
|---|---|
| JP (1) | JP6405210B2 (https=) |
| MY (1) | MY191364A (https=) |
| SG (1) | SG11201704344PA (https=) |
| WO (1) | WO2016088509A1 (https=) |
Cited By (1)
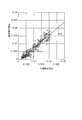
| Publication number | Priority date | Publication date | Assignee | Title |
|---|---|---|---|---|
| CN112906234A (zh) * | 2021-03-09 | 2021-06-04 | 廊坊市阳光建设工程质量检测有限公司 | 一种混凝土强度回弹法测强曲线数据回归的方法 |
Families Citing this family (7)
| Publication number | Priority date | Publication date | Assignee | Title |
|---|---|---|---|---|
| KR101898629B1 (ko) * | 2017-09-12 | 2018-09-13 | 서강대학교산학협력단 | H-Infinity 필터를 이용한 기상 예측값 보정 방법 및 이를 이용한 기상 예측값 보정 장치 |
| JP6927003B2 (ja) * | 2017-12-07 | 2021-08-25 | トヨタ自動車株式会社 | 電池の劣化推定装置 |
| JP7431536B2 (ja) * | 2019-09-10 | 2024-02-15 | シャープ株式会社 | 空気調和機およびサーバ |
| CN111023400B (zh) * | 2019-12-30 | 2021-05-14 | 宁波奥克斯电气股份有限公司 | 一种空调室外环温预测方法、装置及空调器 |
| KR102144674B1 (ko) * | 2020-01-15 | 2020-08-14 | 주식회사 나라컨트롤 | 실시간 성능분석 반응형 냉각탑 제어방법 |
| JP6759481B1 (ja) * | 2020-04-13 | 2020-09-23 | 東京瓦斯株式会社 | 冷却装置 |
| JP2025117817A (ja) * | 2024-01-31 | 2025-08-13 | 三菱重工業株式会社 | 空調システム、および空調システムの制御方法 |
Citations (4)
| Publication number | Priority date | Publication date | Assignee | Title |
|---|---|---|---|---|
| JPH08136032A (ja) * | 1994-11-01 | 1996-05-31 | Matsushita Refrig Co Ltd | 負荷予測補正装置 |
| JP2008102115A (ja) * | 2006-09-21 | 2008-05-01 | Toshiba Corp | 気象予測システム及び気象予測方法 |
| JP2013009492A (ja) * | 2011-06-23 | 2013-01-10 | Hitachi Ltd | 供給電力制御システム、供給電力制御方法、および供給電力制御プログラム |
| JP2015163861A (ja) * | 2014-02-28 | 2015-09-10 | 中国電力株式会社 | 気温予測システム、気温予測方法 |
Family Cites Families (3)
| Publication number | Priority date | Publication date | Assignee | Title |
|---|---|---|---|---|
| JP3457631B2 (ja) * | 2000-06-12 | 2003-10-20 | 三菱電線工業株式会社 | 気象予測システムにおける補正方法 |
| US7502768B2 (en) * | 2004-02-27 | 2009-03-10 | Siemens Building Technologies, Inc. | System and method for predicting building thermal loads |
| US20140207289A1 (en) * | 2013-01-21 | 2014-07-24 | Lennox Industries Inc. | Hvac system configured based on atmospheric data, an interface for receiving the atmospheric data and a controller configured to setup the hvac system based on the atmospheric data |
-
2014
- 2014-12-02 JP JP2014244208A patent/JP6405210B2/ja active Active
-
2015
- 2015-11-06 MY MYPI2017701955A patent/MY191364A/en unknown
- 2015-11-06 SG SG11201704344PA patent/SG11201704344PA/en unknown
- 2015-11-06 WO PCT/JP2015/081340 patent/WO2016088509A1/ja not_active Ceased
Patent Citations (4)
| Publication number | Priority date | Publication date | Assignee | Title |
|---|---|---|---|---|
| JPH08136032A (ja) * | 1994-11-01 | 1996-05-31 | Matsushita Refrig Co Ltd | 負荷予測補正装置 |
| JP2008102115A (ja) * | 2006-09-21 | 2008-05-01 | Toshiba Corp | 気象予測システム及び気象予測方法 |
| JP2013009492A (ja) * | 2011-06-23 | 2013-01-10 | Hitachi Ltd | 供給電力制御システム、供給電力制御方法、および供給電力制御プログラム |
| JP2015163861A (ja) * | 2014-02-28 | 2015-09-10 | 中国電力株式会社 | 気温予測システム、気温予測方法 |
Cited By (1)
| Publication number | Priority date | Publication date | Assignee | Title |
|---|---|---|---|---|
| CN112906234A (zh) * | 2021-03-09 | 2021-06-04 | 廊坊市阳光建设工程质量检测有限公司 | 一种混凝土强度回弹法测强曲线数据回归的方法 |
Also Published As
| Publication number | Publication date |
|---|---|
| SG11201704344PA (en) | 2017-06-29 |
| JP6405210B2 (ja) | 2018-10-17 |
| JP2016109312A (ja) | 2016-06-20 |
| MY191364A (en) | 2022-06-20 |
Similar Documents
| Publication | Publication Date | Title |
|---|---|---|
| JP6405210B2 (ja) | 気象補正装置、空調管理システム及び気象補正方法 | |
| CN108292860B (zh) | 电力控制装置、运转计划制定方法以及记录介质 | |
| JP5572799B2 (ja) | 空調システム制御装置 | |
| CN104428812B (zh) | 运转计划最佳化装置、方法及程序 | |
| US9817409B2 (en) | Method and apparatus for distributed control of thermostatic electric loads using high-granularity energy usage data | |
| US20160349725A1 (en) | Demand control device and computer readable medium | |
| US20150345812A1 (en) | Method and apparatus for selective componentized thermostatic controllable loads | |
| CN108709287B (zh) | 一种空调系统冷负荷预测方法及冷水机组群控的策略 | |
| WO2015002092A1 (ja) | エネルギー管理サーバ、エネルギー管理方法およびプログラム | |
| KR20150013670A (ko) | 에너지 사용량 기준치의 시간 비용 및 정확도 개선 방법 및 시스템 | |
| ZA201000347B (en) | Method of forecasting the electrical production of a photovoltaic device | |
| US20180195743A1 (en) | Hvac boiler controller | |
| JP2017531876A (ja) | 空調機を管理する方法及び装置 | |
| US20160161967A1 (en) | Predictive Alert System for Building Energy Management | |
| WO2019008698A1 (ja) | 運転制御装置、空気調和システム、運転制御方法および運転制御プログラム | |
| EP2818801B1 (en) | Method and device for controlling heater devices | |
| JP2016067125A (ja) | エネルギー設備運転制御装置およびエネルギー設備運転制御方法 | |
| JP6356502B2 (ja) | 機器運転設定装置及び機器運転設定値決定プログラム | |
| JP6203144B2 (ja) | 空調管理装置、空調管理方法、及びプログラム | |
| JP6230055B2 (ja) | 電力需要予測装置及び電力需要予測方法 | |
| JP6046530B2 (ja) | 最大発電量予測システム | |
| JP2020086595A (ja) | 数値解析装置及び方法 | |
| JP2015163010A (ja) | デマンド制御方法及びデマンド制御システム | |
| JP6452854B2 (ja) | 発電量算出装置、発電量算出システム、発電量算出方法及びプログラム | |
| JP5975276B2 (ja) | 運転管理装置、デマンドレスポンス制御発動時の電力実測値補正方法 |
Legal Events
| Date | Code | Title | Description |
|---|---|---|---|
| 121 | Ep: the epo has been informed by wipo that ep was designated in this application |
Ref document number: 15864482 Country of ref document: EP Kind code of ref document: A1 |
|
| WWE | Wipo information: entry into national phase |
Ref document number: 11201704344P Country of ref document: SG |
|
| NENP | Non-entry into the national phase |
Ref country code: DE |
|
| 122 | Ep: pct application non-entry in european phase |
Ref document number: 15864482 Country of ref document: EP Kind code of ref document: A1 |