WO2015163121A1 - Dispositif et procédé de surveillance de la stabilité d'une tension - Google Patents
Dispositif et procédé de surveillance de la stabilité d'une tension Download PDFInfo
- Publication number
- WO2015163121A1 WO2015163121A1 PCT/JP2015/060690 JP2015060690W WO2015163121A1 WO 2015163121 A1 WO2015163121 A1 WO 2015163121A1 JP 2015060690 W JP2015060690 W JP 2015060690W WO 2015163121 A1 WO2015163121 A1 WO 2015163121A1
- Authority
- WO
- WIPO (PCT)
- Prior art keywords
- voltage stability
- calculation
- voltage
- bus
- power
- Prior art date
Links
Images


Classifications
-
- H—ELECTRICITY
- H02—GENERATION; CONVERSION OR DISTRIBUTION OF ELECTRIC POWER
- H02J—CIRCUIT ARRANGEMENTS OR SYSTEMS FOR SUPPLYING OR DISTRIBUTING ELECTRIC POWER; SYSTEMS FOR STORING ELECTRIC ENERGY
- H02J13/00—Circuit arrangements for providing remote indication of network conditions, e.g. an instantaneous record of the open or closed condition of each circuitbreaker in the network; Circuit arrangements for providing remote control of switching means in a power distribution network, e.g. switching in and out of current consumers by using a pulse code signal carried by the network
- H02J13/00032—Systems characterised by the controlled or operated power network elements or equipment, the power network elements or equipment not otherwise provided for
- H02J13/00034—Systems characterised by the controlled or operated power network elements or equipment, the power network elements or equipment not otherwise provided for the elements or equipment being or involving an electric power substation
-
- G—PHYSICS
- G01—MEASURING; TESTING
- G01R—MEASURING ELECTRIC VARIABLES; MEASURING MAGNETIC VARIABLES
- G01R19/00—Arrangements for measuring currents or voltages or for indicating presence or sign thereof
- G01R19/0084—Arrangements for measuring currents or voltages or for indicating presence or sign thereof measuring voltage only
-
- G—PHYSICS
- G01—MEASURING; TESTING
- G01R—MEASURING ELECTRIC VARIABLES; MEASURING MAGNETIC VARIABLES
- G01R19/00—Arrangements for measuring currents or voltages or for indicating presence or sign thereof
- G01R19/25—Arrangements for measuring currents or voltages or for indicating presence or sign thereof using digital measurement techniques
- G01R19/2513—Arrangements for monitoring electric power systems, e.g. power lines or loads; Logging
-
- H—ELECTRICITY
- H02—GENERATION; CONVERSION OR DISTRIBUTION OF ELECTRIC POWER
- H02J—CIRCUIT ARRANGEMENTS OR SYSTEMS FOR SUPPLYING OR DISTRIBUTING ELECTRIC POWER; SYSTEMS FOR STORING ELECTRIC ENERGY
- H02J13/00—Circuit arrangements for providing remote indication of network conditions, e.g. an instantaneous record of the open or closed condition of each circuitbreaker in the network; Circuit arrangements for providing remote control of switching means in a power distribution network, e.g. switching in and out of current consumers by using a pulse code signal carried by the network
-
- H—ELECTRICITY
- H02—GENERATION; CONVERSION OR DISTRIBUTION OF ELECTRIC POWER
- H02J—CIRCUIT ARRANGEMENTS OR SYSTEMS FOR SUPPLYING OR DISTRIBUTING ELECTRIC POWER; SYSTEMS FOR STORING ELECTRIC ENERGY
- H02J3/00—Circuit arrangements for ac mains or ac distribution networks
-
- H—ELECTRICITY
- H02—GENERATION; CONVERSION OR DISTRIBUTION OF ELECTRIC POWER
- H02J—CIRCUIT ARRANGEMENTS OR SYSTEMS FOR SUPPLYING OR DISTRIBUTING ELECTRIC POWER; SYSTEMS FOR STORING ELECTRIC ENERGY
- H02J3/00—Circuit arrangements for ac mains or ac distribution networks
- H02J3/24—Arrangements for preventing or reducing oscillations of power in networks
Definitions
- the present invention relates to a voltage stability monitoring device that monitors voltage stability (also referred to as voltage stability) of a power system.
- Patent Document 2 JP-A-2005-287128
- the PV curve is drawn with high accuracy and high speed, and the PV curve is traced with respect to the continuous load. Therefore, the stability of the system voltage is monitored while accurately following the control of the transformer tap and the like.
- a power system stability monitoring system capable of performing the above is described.
- the conventional voltage stability monitoring device described in the above-mentioned non-patent documents and patent documents monitors the possibility of deterioration of voltage stability by assuming either or both of a tidal current change assumption and a failure (accident). Is possible.
- the monitoring points of conventional voltage stability monitoring devices are targeted at substation buses that are important for power transmission and reception, and each bus that has been known to deteriorate in voltage stability due to operator experience.
- the monitoring part of the conventional voltage stability monitoring device or the conventional There is a risk that the voltage stability of the bus that is not the monitoring part of the voltage stability monitoring device will deteriorate.
- the present invention provides a voltage stability monitoring apparatus for monitoring the voltage stability of a power system, and a scenario of a change assumed based on at least one of a change in a system configuration or a power flow state of the power system.
- An assumed change scenario calculation unit that creates a plurality of assumed change scenarios indicating the voltage, a voltage stability calculation unit that calculates the voltage stability using the assumed change scenario, and a margin of the voltage stability based on the voltage stability
- a voltage stability margin calculation unit for calculating a voltage stability margin indicating a degree, and each scenario severeness that selects an assumed change scenario having a high severity of the voltage stability for each of the assumed change scenarios based on the voltage stability margin
- Which bus of the power system is a vulnerable bus that reduces the voltage stability based on the degree ranking calculator and the selected assumed change scenario
- calculating fragile bus calculating unit characterized in that it comprises a monitoring point changing unit for changing the monitoring target of the voltage stability based on the information of the weak bus.
- the operator's labor is reduced by automatically calculating the assumed change scenario considering the output change of the renewable energy, and by performing voltage stability monitoring calculation for the assumed change scenario, the present or future It is possible to dynamically change the bus at which the voltage stability deteriorates, and to accurately monitor the current or future voltage stability deterioration.
- FIG. 1 It is an example of the figure which shows the drawing image which created the PV curve by the continuous power flow calculation. It is an example of a processing flow for creating a PV curve by continuous power flow calculation and determining the limit of voltage stability. It is an example of the figure showing a voltage vector and a load parameter as a variable decided by pseudo arc length. It is an example of the flowchart explaining the process of each scenario severe degree ranking calculation part. It is an example of the flowchart explaining the process of a weak
- an assumed change scenario is calculated from the system data D1 and the system facility data D2, and the voltage stability calculation is performed using the calculated assumed change scenario data D3, the system data D1, the system facility data D2, and the threshold data D8.
- an example of the voltage stability monitoring device 10 that performs each scenario severity ranking calculation and vulnerable bus calculation, outputs monitoring location change command data D9, and displays the monitoring location display
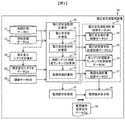
- FIG. 1 illustrates an example of the entire configuration including input / output indicating contents in a database and data and processing indicating contents in a calculation unit.
- a power system 100, a monitoring control device 210, and a voltage stability monitoring device 10 are described.
- An example of a hardware configuration of the measuring device 44, the power source 110, the load 150, the bus, the transformer, and the power transmission line will be described with reference to FIG.
- FIG. 1 is an example of an overall configuration diagram of the voltage stability monitoring apparatus 10 of the present embodiment, and system data D1, system equipment data D2, assumed change scenario calculation unit 30, assumed change scenario data D3, threshold data D8,
- the voltage stability calculation unit 31 the voltage stability margin calculation unit 32, each scenario severity ranking calculation unit 33, the voltage stability monitoring calculation unit 40 including the vulnerable bus calculation unit 34, the voltage stability calculation result data D4, and the voltage stability Degree margin calculation result data D5, each scenario severity ranking calculation result data D6 and vulnerable bus calculation result data D7, voltage stability monitoring calculation result data D41, monitoring location change unit 35, monitoring location change command data D9 and monitoring location 2 is a diagram illustrating a configuration of a voltage stability monitoring device 10 including a display unit 36.
- FIG. 1 is an example of an overall configuration diagram of the voltage stability monitoring apparatus 10 of the present embodiment, and system data D1, system equipment data D2, assumed change scenario calculation unit 30, assumed change scenario data D3, threshold data D8,
- the voltage stability calculation unit 31 the voltage stability margin calculation unit 32, each scenario severity ranking calculation unit 33, the voltage stability monitoring
- the input data of the voltage stability monitoring device 10 includes system data D1, system equipment data D2, assumed change scenario data D3, and threshold data D8.
- the assumed change scenario calculation unit 30 of the voltage stability monitoring apparatus 10 calculates assumed change scenario data D3 using the system data D1 and the system facility data D2. Further, the voltage stability calculation unit 31 of the voltage stability monitoring apparatus 10 performs voltage stability calculation using the system data D1, the system facility data D2, and the assumed change scenario data D3, and the voltage stability calculation result data D4 is obtained. Output.
- the voltage stability margin calculation unit 32 of the voltage stability monitoring apparatus 10 performs voltage stability margin calculation using the voltage stability calculation result data D4, and outputs voltage stability margin calculation result data D5.
- each scenario severity ranking calculation unit 33 of the voltage stability monitoring apparatus 10 performs each scenario severity ranking calculation using the voltage stability calculation result data D4, the voltage stability margin calculation result data D5, and the threshold data D8.
- the scenario severity ranking calculation result data D6 is output.
- the vulnerable bus calculation unit 34 of the voltage stability monitoring device 10 uses the voltage stability calculation result data D4, the voltage stability margin calculation result data D5, the scenario severity ranking calculation result data D6, and the threshold data D8.
- the vulnerable bus calculation is performed, and the vulnerable bus calculation result data D7 is output.
- the monitoring location change unit 35 of the voltage stability monitoring apparatus 10 transmits the monitoring location change command data D9 for changing the monitoring location to the monitoring location display 36 using the vulnerable bus calculation result data D7.
- the monitoring location display 36 of the voltage stability monitoring apparatus 10 the monitoring location is changed and displayed using the monitoring location command data D9, and the monitoring location information is displayed using the voltage stability monitoring calculation result data D41. .
- FIG. 2 is an example of a hardware configuration of the voltage stability monitoring device 10 and an overall configuration diagram of the power system 100.
- the power system 100, the monitoring control device 210, the voltage stability monitoring device 10, the measuring device 44, the power source 110, and the load It is the figure which showed the example of the hardware constitutions with 150, a bus-line, a transformer, and a power transmission line.
- the electric power system 100 is connected to the generator 110, the transformer 130, the measuring device 44, and the load 150, which are connected to each other via a branch (track) 140 and a node (bus) 120, respectively. It is composed of any one or a plurality of possible devices (battery, rechargeable secondary battery, EV storage battery, flywheel, etc.).
- examples of the power source 110 include a distributed power source such as a solar power generator and a wind power generator in addition to a large power source such as a thermal power generator, a hydroelectric power generator, and a nuclear power generator.
- an example of the measuring device 44 is a device (VT, PT, or CT) that measures one or more of the node voltage V, the branch current I, the power factor ⁇ , the active power P, and the reactive power Q. And a function of transmitting data including a data measurement location identification ID and a built-in time stamp of the measurement device (such as a telemeter (TM)).
- a device that measures power information (voltage phasor information) with absolute time using GPS, a phase measurement device (PMU: Phasor Measurement Units), or another measurement device may be used.
- the measurement device 44 is written to be in the power system 100, it may be installed on a bus or power transmission line connected to the generator 110, the transformer 130, the measurement device 44, and the load 150.
- the measurement data D1 is each of the data measured by the measurement device 44, and is received by the system measurement database 21 via the communication network 300.
- the system data may be aggregated by the monitoring control device 210 and then received by the system measurement database 21 via the communication network 300, or may be monitored with the measurement device 44. You may receive into the system
- FIG. The measurement data D1 may include a unique number for identifying data and a time stamp.
- Display unit 11 input unit 12, such as a keyboard or mouse, communication unit 13, computer or computer server (CPU: Central Processing Unit) 14, memory 15, various databases (system measurement database 21, system facility database 22, and assumed change scenario database 23, a voltage stability calculation result database 24, a voltage stability margin calculation result database 25, each scenario severity ranking calculation result database 26, a vulnerable bus calculation result database 27, a threshold database 28, and a program database 29) are connected to the bus line 43.
- various databases system measurement database 21, system facility database 22, and assumed change scenario database 23, a voltage stability calculation result database 24, a voltage stability margin calculation result database 25, each scenario severity ranking calculation result database 26, a vulnerable bus calculation result database 27, a threshold database 28, and a program database 29
- the display unit 11 is configured as a display device, for example.
- the display unit 11 may be configured to use a printer device, an audio output device, or the like instead of the display device or together with the display device.
- the input unit 12 may be configured to include at least one of a keyboard switch, a pointing device such as a mouse, a touch panel, a voice instruction device, and the like.
- the communication unit 13 includes a circuit for connecting to the communication network 300 and a communication protocol.
- the CPU 14 reads a predetermined computer program from the program database 29 and executes it.
- the CPU 14 may be configured as one or a plurality of semiconductor chips, or may be configured as a computer device such as a calculation server.
- the memory 15 is configured as a RAM (Random Access Memory), for example, and stores a computer program read from the program database 29, and stores calculation result data and image data necessary for each process.
- the screen data stored in the memory 14 is sent to the display unit 11 and displayed. An example of the displayed screen will be described later.
- FIG. 3 is an example of a configuration diagram showing the contents of the program data of the voltage stability monitoring device.
- the program database 29 includes, for example, a state estimation calculation program P70, an assumed change scenario calculation program P10, a voltage stability calculation program P20, a voltage stability margin calculation program P30, each scenario severity ranking calculation program P40, and a vulnerable bus calculation program P50. And a monitoring location change program P60 are stored.
- the CPU 14 reads the calculation programs (state estimation calculation program P70, assumed change scenario calculation program P10, voltage stability calculation program P20, and voltage stability margin calculation program P30) read from the program database 29 into the memory 14.
- Each scenario severity ranking calculation program P40, vulnerable bus calculation program P50, and monitoring location change program P60) are executed to calculate plausible system status, assumption change scenario calculation, voltage stability calculation, voltage stability margin Calculation, calculation of ranking of severe scenario, calculation of selection of severe scenario, calculation of vulnerable bus, instruction to change monitoring location, instruction of image data to be displayed, search of data in various databases, etc.
- the memory 14 temporarily stores calculation temporary data and calculation result data such as display image data, monitoring data, and monitoring result data.
- the memory 14 generates necessary image data by the CPU 14 and displays the display unit 11 (for example, a display display screen). ).
- the display unit 11 of the voltage stability monitoring apparatus 10 may be a simple screen only for rewriting each control program and database.
- the voltage stability monitoring device 10 stores roughly nine databases. Except for program database 29, system measurement database 21, system facility database 22, assumed change scenario database 23, voltage stability calculation result database 24, voltage stability margin calculation result database 25, each scenario severity ranking calculation result database 26, and vulnerability
- the bus calculation result database 27 and the threshold database 28 will be described.
- the system measurement database 21 includes active power P, reactive power Q, voltage V, voltage phase angle ⁇ , current I, power factor ⁇ , and the like as system measurement data. Data with time stamp or PMU data may be used. For example, the voltage and voltage phase angle at the nodes 120a and 120b connected to the power system 100, the line flow (P + jQ) of the branches 140a and 140b connected to the nodes 120a and 120b connected to the power system 100, and the power system 100 are connected.
- the measuring device is VT, PT, or the like.
- the line power flow (P + jQ) can be calculated from the current I, the voltage V, and the power factor ⁇ measured by VT or PT.
- each node, branch, generator, load, control device active power P, reactive power Q, voltage V, voltage phase angle ⁇ , current I which is a calculation result of the state estimation calculation program P70, is obtained.
- the result of estimating and calculating the power factor ⁇ is also stored as system measurement data.
- the system facility database 22 includes system configuration, line impedance (R + jX), ground capacitance (admittance: Y), data necessary for system configuration and state estimation (such as threshold of bat data), generator data, and other currents. Data necessary for calculation, state estimation, and voltage stability calculation are included.
- a measured value may be obtained from a monitoring control device, a central power supply command station, EMS, or may be obtained directly from a measuring device for the entire system.
- the CPU 14 At the time of input, the CPU 14 generates necessary image data and displays it on the display unit 11. At the time of input, it may be semi-manual so that a large amount of data can be set by using a complementary function.
- the assumed change scenario database 23 stores a failure location, a failure aspect, an assumed renewable energy change amount, and the like as a failure case assumed in the power system, stored using the input unit 12 of the voltage stability monitoring device 10.
- the failure is assumed as a failure case assumed in the electric power system as shown in FIG. It includes a list that combines the location, failure mode, and assumed renewable energy change. Other elements include failure removal timing and the like in the list.
- the assumed amount of renewable energy change includes the amount of fluctuation in the output of solar power generation, wind power generation, mega solar and wind farms, and the simultaneous loss of wind farms.
- the failure case may be only a severe failure case depending on the operation of the system.
- the assumed change scenario data D3 may be set in advance without using the input unit 12, or a value set by the monitoring control device 210 may be set via the communication network 300 and the communication unit 13. By these setting methods, there is an effect that the assumed change scenario data D3 can be set flexibly.
- calculation results such as continuous power flow calculation for evaluating the voltage stability calculated by the voltage stability calculation program P20 are stored.
- the continuous power flow calculation is an operation in which the load power is changed under certain conditions to predict the system state (predictor calculation) and the corresponding bus voltage is obtained by power flow calculation (corrector calculation). This is a technique for drawing a PV curve or a VQ curve by calculating continuously. Details of the continuous flow calculation will be described later.
- the voltage stability calculation may be a change in the node voltage with respect to the total demand, or a change in the node voltage relative to the total demand divided by the initial demand. It may be a change in node voltage with respect to the demand of the node, or a change in node voltage with respect to the demand of each node divided by the initial demand of each node.
- the node voltage change for any one or more of the above demands is stored.
- the PV curve or VQ curve of the voltage stability calculation result data D4 calculated by the voltage stability margin calculation program P30 is used.
- the voltage difference ⁇ V and active power margin ⁇ P from the difference in demand from the tip of the PV curve to the current operating point and the voltage difference, and the difference in demand from the tip of the VQ curve to the current operating point are calculated as follows.
- To reactive power margin ⁇ Q is stored for each node. Similar to the voltage stability calculation, for example, the PV curve used when obtaining the voltage margin ⁇ V and the active power margin ⁇ P from the PV curve is a change in the node voltage with respect to the total demand.
- It may be a change in node voltage relative to the total demand divided by the initial demand, or a change in node voltage relative to the demand of each node, and the demand of each node may be the initial value of each node. It may be a change in node voltage relative to that divided by demand.
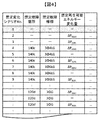
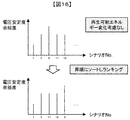
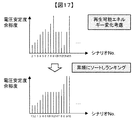
- Each scenario severity ranking calculation result database 26 uses the voltage stability margin calculation result data D5 corresponding to each scenario change scenario calculated by each scenario severity ranking calculation program P40 and uses each scenario change scenario.
- the results of ranking as shown in FIG. 16 and FIG. 17 by sorting in ascending order and the results of selecting a scenario that is equal to or less than the severity threshold using the threshold data D8 are stored.
- the threshold data D8 will be described later in the description of the threshold database 28.
- the vulnerable bus calculation result database 27 stores a node number, a location, and the like for unique identification of a vulnerable bus in terms of voltage stability, calculated by the vulnerable bus calculation program P50.
- the fragile bus is calculated according to a certain standard, for example, by comparing ⁇ V UL10 and ⁇ V UL20 of each node as shown in FIGS. 18 and 19 or comparing ⁇ Q 1 and ⁇ Q 2 of each node.
- the calculation method and certain criteria for the vulnerable bus will be described later.
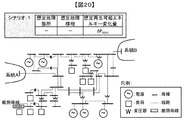
- stored is a position on a systematic diagram as shown, for example in FIG.
- the threshold database 28 stores a severity threshold and a vulnerable bus threshold as shown in FIG.
- the severity threshold is a threshold used in severe scenario severity ranking calculation, and is used to select a scenario that is equal to or less than the severity threshold as a severe scenario.
- the vulnerable bus threshold is a threshold used in vulnerable bus calculation, and is used to select a node that is equal to or lower than the vulnerable bus threshold as a vulnerable bus.
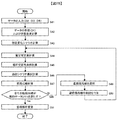
- FIG. 6 is an example of a flowchart showing the entire processing of the voltage stability monitoring apparatus.
- the flow will be briefly described.
- the system facility data D2, the assumed change scenario data D3, and the threshold data D8 are input and stored, the system measurement data D1 is received, the state estimation calculation is performed, and the state estimation calculation result is stored.
- an assumed change scenario is calculated using the system facility data D2, the assumed change scenario data D3, and the state estimation result (stored in the assumed change scenario database 23).
- the voltage stability calculation is performed using the state estimation calculation result (stored in the system measurement database 21) and the assumed change scenarios, and then the voltage stability margin calculation is performed.
- the voltage stability calculation result And the voltage stability margin calculation result is stored.
- the severe scenario severity ranking calculation is performed using the voltage stability margin calculation result D5 and the threshold data D8, and the severe scenario severity ranking calculation result is stored.
- vulnerable bus calculation is performed using the severe scenario severity ranking calculation result D6 and threshold data D8, and the vulnerable bus calculation result is stored.
- the vulnerable bus calculation result D7 the monitoring location is changed to a location where there are many vulnerable buses or vulnerable buses. Note that a plurality of monitoring locations may be displayed, or the most vulnerable busbar may be displayed.
- Various calculation results and data stored in the memory during the calculation may be sequentially displayed on the screen of the monitoring control device 210. Thereby, the operator can easily grasp the operation status of the voltage stability monitoring apparatus 10.
- the monitoring content (occurrence
- the operator can easily grasp the operation status of the voltage stability monitoring apparatus 10.
- the screen display of the situation from reception of various data to transmission of various calculation results is repeated until the monitoring location is changed.
- step S1 when the system equipment data D2, the assumed change scenario data D3, and the threshold data D8 are not set in advance, the system equipment data D2, the assumed change scenario data D3, and the threshold data D8 are input to the input unit 12 and the display unit 11. Enter using.
- data may be input from the monitoring control device 210 through the communication network 300 and the communication unit 13, or the system facility data D2, the assumed change scenario data D3, and the threshold data D8 held in the monitoring control device 210 or the like.
- the data related to the above may be automatically received and stored at regular intervals. Further, when the system facility data D2, the assumed change scenario data D3, and the threshold data D8 are set in advance, the correction may be added or the data as it is may be used.
- step S2 the system measurement data D1 is received, the state estimation calculation is performed, and the state estimation calculation result is stored in the system measurement database 21.
- state estimation calculation methods include, for example, Lars Holten, Anders Gjelsvlk, Sverre Adam, F. F. Wu, and Wen-Hs Iung E. Liu, Comparison of Different Methods for State Estimation, IEEE Transaction on Power Perform according to the calculation method described in 3 (1988), pp.1798-1806.
- step S3 the assumed change scenario calculation is performed using the system facility data D2, the assumed change scenario data D3 stored in step S1, and the state estimation result obtained in step S2, and the result is assumed change scenario database 23. To remember.
- FIG. 7 is an example of a flowchart for explaining the process of the assumed change scenario calculation unit 30.
- FIG. 7 shows a flow of reading system measurement data D1 and system equipment data D2 through steps S11 to S18, selecting an assumed failure location / mode, selecting an assumed renewable energy change amount, and saving it as an assumed change scenario D3. It shows a method of repeatedly calculating until an assumed failure location, an assumed failure aspect, and an assumed renewable energy change amount are selected. The flow of the above processing will be described below.
- step S11 the system measurement data D1 and the system facility data D2 input, received and calculated in steps S1 and S2 are read and read into the memory 14.
- step S12 an unselected one is selected from the list of conceivable failure locations read out to the memory 14.
- step S ⁇ b> 13 an unselected one is selected from the list of assumed failure modes read to the memory 14.
- step S14 an unselected one is selected from the list of assumed renewable energy change amounts read out to the memory 14.
- step S15 the combination of the assumed failure location, the assumed failure aspect, and the assumed renewable energy change amount selected in steps S12 to S14 is stored as one assumed change scenario D3.
- step S16 when the list of all assumed renewable energy changes is not selected, the process returns to step S14. Further, in step S16, if a list of all assumed renewable energy changes is selected, the process proceeds to step S17.
- step S17 when the list of all conceivable failure modes has not been selected, the process returns to step S13. Further, in step S17, when a list of all assumed failure modes has been selected, the process proceeds to step S18. If it is determined in step S18 that a list of all possible failure locations has not been selected, the process returns to step S12. Moreover, in step S17, when the list of all the assumed failure locations is selected, the flow ends.
- the assumed renewable energy change amount there is no output change, output decrease (for a certain period), output increase (for a certain period), and the like. Further, the assumed renewable energy change amount may be updated based on manual input or data stored in a monitoring control device or a database at regular intervals.
- the assumed failure location, the assumed failure aspect, and the assumed renewable energy change amount there is also a combination of only the assumed renewable energy change amount without failure.
- the assumed change scenario data D3 may be set in advance without using the input unit 12, or a value set by the monitoring control device 210 may be set via the communication network 300 and the communication unit 13. By these setting methods, there is an effect that the assumed change scenario data D3 can be set flexibly.
- step S ⁇ b> 4 after the voltage stability calculation is performed using the state estimation calculation result and each assumed change scenario, the voltage stability calculation result is stored.
- the voltage stability calculation method is, for example, Patent Document 2 and Chiang. H. D. et al., “CPFLOW: A Practical Tool for Tracing Power System Steady-State Stationary Behavior Due to Load and Generation Variations”, IEEE Trans , On Power Systems, Vol. 10, No. 2, pp.623-634, 1995, Venkataramana Ajjarapu, “Computational Techniques for Voltage Stability Assessment and Control”, Springer, 2006, pp.49-116 This is performed in accordance with the calculation method described in Japanese Patent No. 153397.
- the above voltage stability calculation method is generally called continuous power flow calculation, and is a method applying the continuous method based on the concept of the predictor-corrector method, which is a nonlinear function analysis method.
- a stable and stable solution can be obtained even near the active power limit, which is the limit of the voltage stability, and the effective power limit can be obtained accurately. is there.
- a voltage lowering solution can be stably calculated by using continuous power flow calculation. As a result, there is an effect that the difference ⁇ V between the higher solution and the lower solution at the operating point used in the evaluation of the voltage stability can be calculated.
- Fig. 8 shows a drawing image of the PV curve. The processing flow is shown in FIG.
- predictor calculation will be described.
- the purpose of the predictor is to obtain a prediction point for obtaining the next solution. Since the predicted point is an initial value of the corrector calculation (tidal flow calculation), the higher the quality of the predicted point, the shorter the iterative calculation of the corrector for obtaining an accurate solution.
- Linear predictors include (a) simple increase predictors, (b) secant predictors, (c) tangent predictors, and non-linear predictors include (d) parabolic predictors. Calculation of a combination predictor of any one or a plurality of predictors such as (a) to (d) may be performed. Note that (a) a simple increase predictor is a method of obtaining a predictor by simply increasing ⁇ . (B) The predictor of the secant method is the previous convergence point as shown in Mori et al .: “Continuous power flow calculation using Lagrangian interpolation nonlinear predictor”, Electrical Engineering B, Vol.
- the predictor of the tangent method is the tangent to the PV curve at the previous convergence point as shown in Fukuyama et al: “Continuation Power Flow practical system development”, IEEJ National Convention, No. 1387, 1997. This is a method for obtaining a predictor on the tangent line.
- the predictor of the parabola predictor is a method of obtaining a predictor on the parabola by drawing a parabola using the previous convergence point.
- Control of the step width in predictor calculation includes binary search method that controls the step width in half when it does not converge, Venkataramana Ajjarapu, “Computational Techniques for Voltage Stability Assessment and Control”, Springer, 2006, pp.33-
- the control for increasing / decreasing the step width control coefficient (described later) according to the number of convergence calculations of the previous correction calculation described in 38 may be performed by either one or both.
- convergence number control a method of applying both methods
- the step width ⁇ is determined by the following equation.
- N opt is initially set to an arbitrary value, and is increased or decreased as necessary when a desired PV curve cannot be drawn. Thereby, there is an effect that a desired PV curve can be drawn.
- the desired PV curve is, for example, a PV curve obtained up to the active power at the operating point on both sides of the voltage increasing solution and the lower solution, and a PV where the convergence point is between the desired point widths.
- the curve is a PV curve in which the convergence point in the vicinity of the nose of the PV curve is between a desired point width. This is because, depending on the value of N opt , there are cases where the lower solution side does not converge on the way before it is reduced to the active power at the operating point, and there are cases where the number of points on the PV curve is small or large. On the lower solution side, there is an advantage that ⁇ V UL10 shown in FIG. 18 is calculated by calculating up to the active power at the operating point, and an index of voltage stability can be used. Further, since the convergence point is between the desired point widths, there is an advantage that the PV curve can be adjusted to a desired accuracy.
- Convergence frequency control is controlled such that (k) N is increased and the step width is decreased when the power flow state is difficult to converge, and (k) N is decreased and the step width is increased when convergence is easy. As a result, continuous power flow calculation can be performed efficiently.
- the binary search method is switched until convergence.
- the case of not converging is counted every time the sum of mismatches calculated in the nth time becomes larger than the sum of mismatches calculated in the n + 1th time in the convergence calculation in one corrector calculation. This is when the set number of times is exceeded.
- equation (1) is used. If converged, the next step adjustment returns to the convergence number control of equation (1). As a result, even when it is difficult to converge such that the upper limit of the number of convergence calculations is reached, a solution can be obtained stably.
- the shape of the PV curve is a quadratic curve, so the predictor created using the voltage increase solution and the active power limit solution one before the active power limit is There is a possibility that the number of convergence calculations increases as the voltage lowering solution to be converged is far away.
- (k) N is increased when obtaining the first voltage lowering solution point, and subsequent voltage lowering solutions are obtained. ⁇ becomes smaller than when a solution with higher voltage is sought, and the solution with lower voltage may be calculated in small increments, which may increase the amount of calculation.
- x is a variable vector in which bus voltage values are arranged
- ⁇ is a variable vector in which load parameter values are arranged.
- f Pi is the active power at bus i
- f Qi is the reactive power at bus i
- f Vi is a function representing the magnitude of the voltage at bus i
- f Psi , f Qsi , f Vsi is an active power, reactive power, and specified value of voltage magnitude on bus i, respectively
- ⁇ is a load parameter. Since either (4) or (5) can only be specified, normally a bus that is not subject to voltage control, such as a load bus, is subject to voltage control, such as a generator bus, using (5) as the PQ designation. (5) is used for the PV bus designation.
- x is a voltage vector
- ⁇ is a load parameter
- s is a pseudo arc length.
- Equation (8) represents the hypersphere shown in (1), and shows the constraint that the sum of the increments of all variables is partially equal to the value obtained by linearly approximating the PV curve.
- Continuous power flow calculation creates a PV curve by changing the active power and reactive power of the simultaneous equations (6), (7), and (8) using the Newton-Raphson method each time. To do.
- ⁇ x (l + 1) Newton-Raphson method, a correction amount ⁇ x (l + 1) is obtained from equation (9), and a solution is obtained while updating x by equation (10).
- J Aug is an extended Jacobian matrix obtained by partial differentiation of f (x) by the element of x, and the right superscript (l) represents the number of convergence calculation steps.
- the difference between the expanded Jacobian matrix and the Jacobian matrix used in normal power flow calculation is that the matrix of the load parameter ⁇ is expanded. Thereby, the convergence can be improved even near the active power limit.
- x in equations (9) and (10) is described including ⁇ .
- the Newton-Raphson method may be calculated using a polar coordinate system or an orthogonal coordinate system.
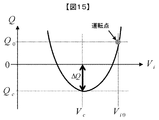
- FIGS. 13 and 15 are examples illustrating an image of the voltage stability calculator 31.
- FIG. 13 shows an example in which a PV curve is calculated with the total demand P of active power on the horizontal axis and the voltage V i of the node i on the vertical axis.
- the operating point is (P 0 , V i0 ), and the lower solution that is paired with this higher solution is (P 0 , V ′ i0 ).
- the limit of voltage stability, active power limit is part of the P C.
- the active power limit which is the tip of the PV curve, is generally called the nose.
- VQ curve 15 is an example of calculating a VQ curve with the horizontal axis representing the voltage V i of the node i and the vertical axis representing the total demand Q of reactive power.
- the operating point is (V i0 , Q 0 ).
- the limit of voltage stability, reactive power limit is part of the Q C.
- the VQ curve can be drawn by subtracting the reactive power supply from the system side from the reactive power consumption of node i.
- it has the function of the voltage stability calculation which considered the constraint data of a generator as shown in FIG. As a result, the voltage stability of the power system closer to reality can be examined.
- step S5 the voltage stability margin calculation is performed, and the voltage stability margin calculation result is stored.
- FIG. 13 and FIG. 15 are examples illustrating an image of the voltage stability margin calculation unit 32. From P-V curve of FIG. 13, by a difference between P 0 of the operating point and the active power limit P C (11) equation can be calculated voltage stability margin [Delta] P. Further, the voltage stability margin may be ⁇ V i calculated by equation (12).
- the system operator can easily understand by using the voltage stability margin that can be easily obtained from the PV curve and VQ curve composed of physical quantities that are usually used by the system operator.
- other voltage stability margins may be calculated and used.
- the PV curve or VQ curve cannot be written in the first place. In such a case, it is considered that there is no operating point, and it is determined that there is no voltage stability margin.
- step S6 the severe scenario severity ranking calculation is performed using the voltage stability margin calculation result D5 and the threshold data D8, and the severe scenario severity ranking calculation result is stored.
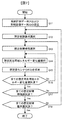
- FIG. 11 is an example of a flowchart for explaining the processing of the severe scenario severity ranking calculation unit 33.
- FIG. 11 reads the voltage stability margin calculation result data D5 and threshold data D8 calculated in step S5 through steps S21 to S26, sorts the assumed change scenarios in ascending order of the voltage stability margin, and calculates the severity of each assumed change scenario. Saved in the ranking calculation result data D6, select one assumed change scenario, and if the voltage stability margin of the selected assumed change scenario is less than the threshold, select a severe scenario, and each assumed change scenario severity ranking calculation result data Severe scenario information is added to D6 and stored.
- step S21 the voltage stability margin calculation result data D5 and threshold value data D8 calculated in step S5 are read and read into the memory 14.
- step S22 the voltage stability margins of each assumed change scenario read out to the memory 14 are sorted in ascending order and stored in each assumed change scenario severity ranking calculation result data D6.
- step S23 one assumed change scenario is selected from each assumed change scenario.
- step S24 it is determined whether the voltage stability margin of the assumed change scenario selected in step S23 is less than the severity threshold (see FIG.
- step S5 if the voltage stability margin of the selected assumed change scenario is less than the severity threshold, the assumed assumed change scenario is selected as the severe scenario, and the process proceeds to step S25. On the other hand, if the voltage stability margin of the selected assumed change scenario is equal to or greater than the severity threshold, the process returns to step S23 to select one next assumed change scenario.
- step S25 severe scenario information is added to each assumed change scenario severe degree ranking calculation result data D6 and stored.
- step S26 it is determined whether all assumed change scenarios have been selected. If all assumed change scenarios have not been selected, the process returns to step S23, and if all assumed change scenarios have been selected, the process ends. Become.
- FIGS. 16 and 17 are examples illustrating an image of the severe scenario severity ranking calculation unit 33.
- FIG. 16 shows a scenario number on the horizontal axis and a voltage stability margin on the vertical axis. It can be seen that ranking (ranking) can be performed by sorting (rearranging) each assumed change scenario in ascending order according to the magnitude of the voltage stability margin obtained in step S5. Also, in FIG. 17, the horizontal axis indicates the scenario number and the vertical axis indicates the voltage stability margin as in FIG. However, renewable energy changes are taken into account for each assumed change scenario.
- ranking can be performed by sorting (rearranging) each assumed change scenario in ascending order according to the magnitude of the voltage stability margin obtained in step S5.
- ranking is performed in consideration of the change in renewable energy as described above, if the relationship between each assumed change scenario becomes difficult to understand, the ranking is performed without considering the change in renewable energy as shown in FIG.
- the assumed change scenario determined as having no voltage stability margin in which the PV curve or VQ curve cannot be written in the first place is ranked using another method in step S6.
- step S7 a vulnerable bus calculation is performed using the severe scenario severity ranking calculation result D6 and threshold data D8, and the vulnerable bus calculation result is stored.
- FIG. 12 and FIG. 14 are examples of flowcharts for explaining the processing of the vulnerable bus calculation unit 34.
- FIG. 12 is a flow for determining the vulnerable bus using the PV curve of FIG. 13 through steps S31 to S38, and the voltage stability calculation result data D4 calculated in step S4 for each severe scenario calculated in step S6.
- threshold data D8 select one severe scenario, select one load bus, determine whether ⁇ V 0 of the PV curve of the selected load bus is less than or equal to the vulnerable bus threshold ⁇ V 0 , and PV curve If ⁇ V 0 is not less than the vulnerable bus threshold ⁇ V 0 , the load bus is selected again.
- the PV curve of the selected load bus is It is determined whether or not ⁇ V / ⁇ P in the initial P lower solution is equal to or less than the vulnerable bus threshold ⁇ V / ⁇ P, and ⁇ V / ⁇ P in the initial P lower solution of the PV curve of the selected load bus is the vulnerable bus threshold ⁇ V / ⁇ P or less Otherwise, the load bus is selected again, and if ⁇ V / ⁇ P in the initial P lowering solution of the PV curve of the selected load bus is equal to or less than the vulnerable bus threshold ⁇ V / ⁇ P, it is determined as the vulnerable bus, Save to the vulnerable bus calculation result data D7 and select the load bus again.
- step S31 the voltage stability calculation result data D4 and threshold data D8 calculated in step S4 for each severe scenario calculated in step S6 are read and read into the memory.
- step S32 it is determined whether all severe scenarios have been selected. If all severe scenarios have not been selected, the process proceeds to step S33, and if all severe scenarios have been selected, the process proceeds to step S39. In step S33, one severe scenario is selected.
- step S34 it is determined whether all load buses have been selected. If all load buses have not been selected, the process proceeds to step S35, and if all load buses have been selected, the process returns to step S32. In step S35, one load bus is selected.
- step S36 it is determined whether or not ⁇ V 0 of the PV curve of the selected load bus shown in FIG. 13 is equal to or less than the vulnerable bus threshold ⁇ V 0 . If ⁇ V 0 of the PV curve is not equal to or less than the weak bus threshold ⁇ V 0 , the process returns to step S36. If ⁇ V 0 of the PV curve is less than or equal to the weak bus threshold ⁇ V 0 , the process proceeds to step S37. In step S37, it is determined whether or not ⁇ V / ⁇ P in the lower initial P solution of the PV curve of the selected load bus shown in FIG. 13 is equal to or less than the vulnerable bus threshold ⁇ V / ⁇ P.
- step S34 if ⁇ V / ⁇ P in the lower initial P solution of the PV curve of the selected load bus is not equal to or less than the vulnerable bus threshold ⁇ V / ⁇ P, the process returns to step S34.
- the load bus is selected again, and if ⁇ V / ⁇ P in the lower initial P solution of the PV curve of the selected load bus is equal to or less than the weak bus threshold ⁇ V / ⁇ P, the process proceeds to step S38.
- step S38 the load bus selected in step S35 and determined as Yes in step S36 and step S37 is determined as a vulnerable bus and stored in the vulnerable bus calculation result data D7. Thereafter, the process returns to step S34.
- step S39 the bus having the largest ⁇ V 0 among the vulnerable bus candidates is determined and stored as the vulnerable load bus, and the flow ends.
- FIG. 18 is an example illustrating an image of the vulnerable bus calculation unit 34.
- FIG. 18 is an example in which a PV curve is calculated with the total demand P of active power on the horizontal axis and the voltage V i of the node i on the vertical axis.
- the PV curves of nodes 1 and 2 are shown, and the operating points are (P 0 , V 10 ) and (P 0 , V 20 ), respectively, and lower solutions that are paired with the respective higher solutions V U.
- V L becomes (P 0 , V ′ 10 ) and (P 0 , V ′ 20 ).
- the limit of voltage stability, active power limit is same position P C.
- This value is compared with the threshold value ⁇ V / ⁇ P.
- FIG. 18 since an image of a fragile generatrix calculation when the P-V curve taken voltage V i at the node i to the total demand P, took a voltage V i of the node i for increased demand of each node In the case of a PV curve, the way of thinking may be different.
- FIG. 14 is a flow for determining a vulnerable bus using the VQ curve of FIG. 15 through steps S31 ′ to S38 ′, which is largely the same as the step of FIG. 12, but each severe condition calculated in step S6.
- the voltage stability calculation result data D4 and threshold data D8 calculated in step S4 for the scenario are read, one severe scenario is selected, one load bus is selected, and ⁇ Q of the VQ curve of the selected load bus is the vulnerable bus threshold ⁇ Q It is determined whether or not ⁇ Q of the VQ curve is not less than or equal to the vulnerable bus threshold ⁇ Q, the load bus is selected again, and if ⁇ Q of the VQ curve is less than or equal to the vulnerable bus threshold ⁇ Q, The vulnerable bus is determined, stored in the vulnerable bus calculation result data D7, and the load bus is selected again. When all load buses are selected, the severe scenario is selected, and the flow for obtaining the vulnerable bus is repeated with the same flow. When all the severe scenarios are selected, ⁇ Q is the smallest among the vulnerable bus candidates. The bus is confirmed as a vulnerable load bus and saved, and the flow ends.
- step S31 the voltage stability calculation result data D4 and threshold value data D8 calculated in step S4 for each severe scenario calculated in step S6 are read and read into the memory 14. .
- step S32 it is determined whether all severe scenarios have been selected. If all severe scenarios have not been selected, the process proceeds to step S33. If all severe scenarios have been selected, the process proceeds to step S39 ′. . In step S33, one severe scenario is selected.
- step S34 it is determined whether all load buses have been selected. If all load buses have not been selected, the process proceeds to step S35, and if all load buses have been selected, the process returns to step S32. In step S35, one load bus is selected.
- step S36 ' it is determined whether or not ⁇ Q of the VQ curve of the selected load bus shown in FIG. 15 is equal to or less than the vulnerable bus threshold ⁇ Q.
- the process returns to step S34.
- ⁇ Q of the VQ curve is less than or equal to the weak bus threshold ⁇ Q
- the process proceeds to step S38.
- step S38 the load bus selected in step S35 and determined as Yes in step S36 'is determined as a vulnerable bus and stored in the vulnerable bus calculation result data D7. Thereafter, the process returns to step S34.
- step S39 ' the bus with the smallest ⁇ Q among the vulnerable bus candidates is determined and stored as the vulnerable load bus, and the flow ends.
- FIG. 19 is an example illustrating an image of the vulnerable bus calculation unit 34.
- FIG. 18 is an example of calculating a VQ curve with the horizontal axis representing the voltage V i of the node i and the vertical axis representing the total active power demand P.
- the VQ curves of nodes 1 and 2 are shown, and the operating points are (V 10 , Q 10 ) and (V 20 , Q 20 ), respectively.
- the reactive power limit which is the limit of the voltage stability, is the place where Q C is Q 1C and Q 2C .
- a voltage lower than the reactive power limit becomes unstable.
- V 1C or lower becomes unstable
- V 2C or lower becomes unstable.
- FIG. 19 since an image of a fragile generatrix calculation when the V-Q curve took the voltage V i of the node i to the total amount of reactive power Q, the voltage V i of the node i for reactive power increase of each node In the case of a VQ curve with a difference, the way of thinking may be different.
- the position of the reactive power limit with respect to the increase in reactive power at each node may be different. Therefore, a load bus having a small difference between the operating point and the reactive power limit and satisfying the flow of FIG. 14 can be selected as the weak bus.
- the determination method and evaluation method of the said weak bus of FIG.12 and FIG.14 and FIG.18 and FIG.19 show an example, in addition, for example, WECC, “Voltage Stability Criteria, Undervoltage Load Shedding Strategy, and Reactive Power Reserve Monitoring Methodology ”, Final Report, 1998, pp.33-58, and Power System Stable Operation Technology Technical Committee:“ Power System Stable Operation Technology ”, Electric Cooperative Research, Vol. 47, No. 1 1991, pp. 24-34, and the like.
- the vulnerable bus can also be referred to as a limit bus, and is a bus that causes a limit in voltage stability. Since the voltage of the fragile bus decreases, the system voltage and reactive power supply are insufficient, leading to voltage collapse.
- the number of vulnerable buses is not limited to one, and the vulnerable buses can be moved by bringing them closer to the actual system in consideration of constraints on voltage and reactive power, such as the power factor constraint of the generator described later in Example 2.
- the PV curve or the VQ curve cannot be written in step S4 in the first place, it is determined that there is no voltage stability margin in step S5, and it is ranked using the other method in step S6 and selected as a severe scenario.
- the buses ranked among them the PV curve and the VQ curve cannot be written in the first place, and thus the vulnerable bus calculation cannot be used.
- the vulnerable bus is unknown, but an alarm indicating that it is a severe scenario is displayed to notify that it is a severe scenario, and a process for writing a PV curve or a VQ curve, for example, system It is also conceivable to use the above-mentioned vulnerable bus calculation after reducing the load on the network. In this case, the process for writing the PV curve and the VQ curve is performed simultaneously on a severe scenario where the PV curve and the VQ curve cannot be written at all, so that comparison can be made in the scenario. To do.
- FIG. 20 is an example for explaining an image of the vulnerable bus calculation unit 34.
- FIG. 20 by displaying the position of the vulnerable bus in the system diagram, there is an advantage that the operator can easily grasp the vulnerable bus with respect to the voltage stability and can easily consider the countermeasure. Furthermore, by displaying the vulnerable buses of a plurality of severe scenarios in an overlapping manner, there is also an advantage that it is easy to grasp where the tendency is likely to become unstable. Moreover, visibility can be improved regarding the voltage stability of an object system
- step S ⁇ b> 8 using the vulnerable bus calculation result D ⁇ b> 7, the monitoring location is changed to a location where there are many vulnerable buses or vulnerable buses.
- a plurality of monitoring locations may be displayed, or the most vulnerable busbar may be displayed.
- Various calculation results and data stored in the memory during the calculation may be sequentially displayed on the screen of the monitoring control device 210. Thereby, the operator can easily grasp the operation status of the voltage stability monitoring apparatus 10.
- the monitoring content occurrence
- the screen display of the situation from reception of various data to transmission of various calculation results is repeated until the monitoring location is changed.
- step S2 Thereafter, the process may return to the data reception step of step S2, or the input data may be corrected by returning to the data input process of step S1.
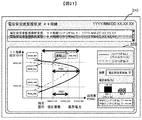
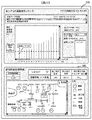
- FIG. 21 is a diagram illustrating an example of a screen that displays a voltage stability calculation result and a voltage stability margin calculation result as the voltage stability monitoring status.
- the monitoring status of the severe scenario and the current voltage stability is shown on the screen of the monitoring control device 210 via the voltage stability monitoring device 10 or the communication network 300, so that the voltage stability of the power system 100 can be seen at a glance. There is an effect that can be seen.
- the voltage value and the voltage stability margin of each scenario are displayed, so that the user can easily see the data. Further, by displaying the voltage margin, the operator can grasp the margin at a glance.
- the vulnerable bus of each scenario is displayed, but it is also possible to confirm the PV curve of another node.
- FIG. 22 is a diagram illustrating an example of a screen displaying each scenario severity ranking result and vulnerable bus system information.
- each scenario severity ranking result and vulnerable bus system information which are calculation results, are displayed on the screen of the monitoring control apparatus 210 via the voltage stability monitoring apparatus 10 and the communication network 300, thereby There is an effect that you can see at a glance the situation of a severe scenario where the voltage stability deteriorates.
- the voltage stability margin of each scenario is displayed, and a curve relating to the voltage stability is displayed on a separate screen, so that the user can easily see the data.
- the operator can grasp the severe scenario at a glance.
- the vulnerable bus at that time is displayed on the screen, and the contents can be viewed.
- the position of one or a plurality of vulnerable buses can be easily recognized.
- it has a function to select a past history and change the display.
- the vulnerable bus of the current severe scenario is usually displayed, but it is also possible to confirm the vulnerable bus of another assumed change scenario.
- by clicking on the vulnerable bus it is possible to display a PV curve or a VQ curve of the bus.
- the vulnerable bus calculation of the first embodiment not only the vulnerable bus calculation but also whether the vulnerable bus is an accurate vulnerable bus based on the constraint data D10, and the voltage stabilization with the constraint data added.
- An example of a voltage stability monitoring device capable of performing accurate weak bus calculation by performing degree calculation will be described. Note that descriptions overlapping with the contents described in FIGS. 1 to 22 are omitted.
- FIG. 23 is an example of an overall configuration diagram of the voltage stability monitoring apparatus 10 in the second embodiment. In the example of the entire configuration diagram of the voltage stability monitoring apparatus 10 in the first embodiment shown in FIG. It has been added. In the voltage stability monitoring device 10 of FIG. 23, the description of the components having the same functions as those already described with reference to FIG. 1 is omitted.
- the input data of the voltage stability monitoring device 10 includes system data D1, system equipment data D2, assumed change scenario data D3, threshold data D8, and constraint data D10.
- FIG. 24 shows an example of the constraint data D10.
- the constraint data D10 is, for example, an active power constraint, a reactive power constraint, a power factor constraint, or the like of each bus (generator constraints have already been considered in step S4).
- FIG. 25 shows an example of a flowchart showing the entire processing of the voltage stability monitoring apparatus including the flow of weak bus calculation including the constraint data in consideration of the constraint data D10.
- Step S1 and Step S41, Step S2 and Step S42, Step S3 and Step S43, Step S4 and Step S44, Step S5 and Step S45, Step S6 and Step S46, Step S7 and Step S47, Step S8 and Step S51 Each has the same content.
- step S48 it is confirmed whether or not all the vulnerable buses calculated in step S47 satisfy the constraint data D10. If the constraint data D10 is not satisfied, the process proceeds to step S49. If satisfied, the process proceeds to step S51.
- step S49 the most vulnerable bus that is the most vulnerable bus selected in step S47 is selected, and the process proceeds to step S50.
- step S50 the most vulnerable bus selected in step S49 is constrained, the data is rewritten, and the process returns to step S44. Thereby, there is an effect that the voltage stability of the power system closer to reality can be examined. Presenting the difference between the first embodiment and the second embodiment to the operator may help to consider why the vulnerable bus is calculated.
- FIG. 26 is an example of an overall configuration diagram of a voltage stability monitoring device according to the third embodiment, in which threshold data, a data transmission unit, and a monitoring control device are added to FIG. 1 of the first embodiment.
- the voltage stability monitoring calculation result data D41 calculated by the voltage stability monitoring device 10 is transmitted to the monitoring control device 210, the central power supply command station, and the EMS via the communication network 300 using the data transmission unit 37. It has.
- the supervisory controller 210, the central power supply command center, and the EMS have an advantage that it is easy to make a control plan for maintaining the voltage stability based on the information on the voltage stability.
Landscapes
- Engineering & Computer Science (AREA)
- Power Engineering (AREA)
- Physics & Mathematics (AREA)
- General Physics & Mathematics (AREA)
- Supply And Distribution Of Alternating Current (AREA)
- Remote Monitoring And Control Of Power-Distribution Networks (AREA)
Abstract
L'objectif de la présente invention est de surveiller avec précision la dégradation d'une stabilité de tension présente ou future en amenant une ligne de bus sur laquelle une dégradation de la stabilité de la tension présente ou future se produit à être modifiée dynamiquement dans un calcul pour la surveillance de la stabilité d'un réseau électrique. Ainsi, la présente invention est un dispositif de surveillance de la stabilité d'une tension pour surveiller la stabilité d'une tension d'un réseau électrique. Dans ledit dispositif, une pluralité de scénarios de changement imaginés représentant des scénarios de changement qui sont imaginés sont créés sur la base du changement de l'état du flux de puissance et/ou de la configuration de réseau du réseau électrique ; la stabilité de la tension est calculée en utilisant les scénarios de changement imaginés ; une tolérance de stabilité de tension représentant le degré de tolérance pour la stabilité de la tension est calculée sur la base de la stabilité de la tension ; des scénarios de changement imaginés qui ont un niveau élevé de gravité de la stabilité de la tension pour leurs scénarios individuels de changement imaginés sont choisis sur la base de la tolérance de la stabilité de la tension ; et un calcul est effectué, sur la base du scénario de changement imaginé sélectionné, afin de déterminer si des lignes de bus du réseau électrique sont des lignes de bus vulnérables qui vont précipiter un déclin de la stabilité de la tension, moyennant quoi des cibles de surveillance de la stabilité de la tension sont modifiées sur la base d'informations sur les lignes de bus vulnérables.
Priority Applications (3)
| Application Number | Priority Date | Filing Date | Title |
|---|---|---|---|
| EP15783447.4A EP3136530B1 (fr) | 2014-04-25 | 2015-04-06 | Dispositif et procédé de surveillance de la stabilité d'une tension |
| PL15783447T PL3136530T3 (pl) | 2014-04-25 | 2015-04-06 | Urządzenie i sposób monitorowania stabilności napięcia |
| US15/306,226 US10473700B2 (en) | 2014-04-25 | 2015-04-06 | Voltage stability monitoring device and method |
Applications Claiming Priority (2)
| Application Number | Priority Date | Filing Date | Title |
|---|---|---|---|
| JP2014-090829 | 2014-04-25 | ||
| JP2014090829A JP6244255B2 (ja) | 2014-04-25 | 2014-04-25 | 電圧安定度監視装置および方法 |
Publications (1)
| Publication Number | Publication Date |
|---|---|
| WO2015163121A1 true WO2015163121A1 (fr) | 2015-10-29 |
Family
ID=54332288
Family Applications (1)
| Application Number | Title | Priority Date | Filing Date |
|---|---|---|---|
| PCT/JP2015/060690 WO2015163121A1 (fr) | 2014-04-25 | 2015-04-06 | Dispositif et procédé de surveillance de la stabilité d'une tension |
Country Status (5)
| Country | Link |
|---|---|
| US (1) | US10473700B2 (fr) |
| EP (1) | EP3136530B1 (fr) |
| JP (1) | JP6244255B2 (fr) |
| PL (1) | PL3136530T3 (fr) |
| WO (1) | WO2015163121A1 (fr) |
Cited By (6)
| Publication number | Priority date | Publication date | Assignee | Title |
|---|---|---|---|---|
| CN105406476A (zh) * | 2015-12-31 | 2016-03-16 | 国家电网公司 | 基于历史数据的电力系统稳定性快速判断方法 |
| WO2017104302A1 (fr) * | 2015-12-16 | 2017-06-22 | 株式会社日立製作所 | Dispositif et procédé de surveillance de stabilité de tension |
| CN108229071A (zh) * | 2018-02-09 | 2018-06-29 | 杭州安脉盛智能技术有限公司 | 基于ar模型与svdd算法的刀具性能退化评估方法及系统 |
| WO2018138973A1 (fr) * | 2017-01-30 | 2018-08-02 | 株式会社日立製作所 | Dispositif et procédé d'aide à la prise de décision de fonctionnement de système |
| JP2018182844A (ja) * | 2017-04-07 | 2018-11-15 | 株式会社日立製作所 | 電力系統安定化装置および電力系統安定化方法 |
| CN110460085A (zh) * | 2019-08-28 | 2019-11-15 | 华北电力大学(保定) | 一种考虑风电和负荷特性对电力系统影响的方法 |
Families Citing this family (13)
| Publication number | Priority date | Publication date | Assignee | Title |
|---|---|---|---|---|
| JP6397760B2 (ja) * | 2014-12-26 | 2018-09-26 | 株式会社日立製作所 | 電力系統安定化装置および方法 |
| WO2018011843A1 (fr) | 2016-07-11 | 2018-01-18 | 株式会社日立製作所 | Système de stabilisation de réseau électrique et procédé de stabilisation |
| US11770001B2 (en) * | 2016-07-27 | 2023-09-26 | Hitachi, Ltd. | Stability monitoring device and method |
| JP6715740B2 (ja) * | 2016-10-13 | 2020-07-01 | 株式会社日立製作所 | 電力系統の潮流監視装置、電力系統安定化装置および電力系統の潮流監視方法 |
| WO2019097672A1 (fr) * | 2017-11-17 | 2019-05-23 | 株式会社日立製作所 | Dispositif et procédé de surveillance de système de distribution d'énergie, procédé de surveillance de système de distribution d'énergie et programme |
| US10644509B2 (en) * | 2018-08-31 | 2020-05-05 | Avista Corporation | SK analysis techniques |
| JP7098515B2 (ja) * | 2018-12-14 | 2022-07-11 | 株式会社東芝 | 電力系統安定化装置 |
| US10767630B1 (en) * | 2019-05-28 | 2020-09-08 | General Electric Company | System and method for operating a wind farm during low wind speeds |
| WO2021252067A1 (fr) * | 2020-06-10 | 2021-12-16 | Colorado State University Research Foundation | Commutation de transmission hybridée pour gestion de contingence dans des systèmes d'alimentation électrique |
| CN114665498A (zh) * | 2020-12-23 | 2022-06-24 | 南京邮电大学 | 一种计及新能源影响的主动配电网脆弱节点辨识方法 |
| CN113224844B (zh) * | 2021-05-19 | 2023-01-24 | 广东电网有限责任公司 | 一种配网母线失压事件智能感知方法、系统和设备 |
| KR102645381B1 (ko) * | 2021-11-12 | 2024-03-11 | 한국에너지기술연구원 | 분산제어기 측정값을 이용한 전압민감도 측정방법 및 측정장치 |
| CN115986746B (zh) * | 2022-12-16 | 2024-03-26 | 南方电网数字电网研究院有限公司 | 基于软传感器的预测方法、装置、计算机设备和存储介质 |
Citations (3)
| Publication number | Priority date | Publication date | Assignee | Title |
|---|---|---|---|---|
| JPH0946935A (ja) * | 1995-07-25 | 1997-02-14 | Toshiba Corp | 電力系統監視システム |
| JP2001025168A (ja) * | 1999-07-09 | 2001-01-26 | Fuji Electric Co Ltd | 電力系統の電圧信頼度解析における並列処理方法 |
| JP2011115024A (ja) * | 2009-11-30 | 2011-06-09 | Mitsubishi Electric Corp | 電圧無効電力監視システム |
Family Cites Families (7)
| Publication number | Priority date | Publication date | Assignee | Title |
|---|---|---|---|---|
| EP0757855A1 (fr) * | 1994-04-29 | 1997-02-12 | Michigan State University | Procede destine a effectuer l'evaluation de la securite liee a la stabilite de la tension pour un systeme de transmission de puissance |
| JP2005287128A (ja) | 2004-03-29 | 2005-10-13 | Fuji Electric Systems Co Ltd | 電力系統安定度監視システム |
| KR100576511B1 (ko) * | 2004-05-11 | 2006-05-03 | 한국전기연구원 | 시계열 데이터를 이용한 전력계통 실시간 전압안정도위험지수 계산 시스템 및 방법 |
| GB0712749D0 (en) * | 2007-07-02 | 2007-08-08 | Areva T & D Uk Ltd | Method of determining voltage stability margin for load shedding within an electrical power system |
| US8788244B2 (en) * | 2010-05-24 | 2014-07-22 | Washington State University | Systems and methods for global voltage security assessment in power systems |
| US8941372B2 (en) | 2011-12-20 | 2015-01-27 | General Electric Company | Systems and methods for predicting power system instability |
| US9876352B2 (en) * | 2013-02-26 | 2018-01-23 | Washington State University | Voltage stability monitoring in power systems |
-
2014
- 2014-04-25 JP JP2014090829A patent/JP6244255B2/ja active Active
-
2015
- 2015-04-06 WO PCT/JP2015/060690 patent/WO2015163121A1/fr active Application Filing
- 2015-04-06 PL PL15783447T patent/PL3136530T3/pl unknown
- 2015-04-06 EP EP15783447.4A patent/EP3136530B1/fr active Active
- 2015-04-06 US US15/306,226 patent/US10473700B2/en active Active
Patent Citations (3)
| Publication number | Priority date | Publication date | Assignee | Title |
|---|---|---|---|---|
| JPH0946935A (ja) * | 1995-07-25 | 1997-02-14 | Toshiba Corp | 電力系統監視システム |
| JP2001025168A (ja) * | 1999-07-09 | 2001-01-26 | Fuji Electric Co Ltd | 電力系統の電圧信頼度解析における並列処理方法 |
| JP2011115024A (ja) * | 2009-11-30 | 2011-06-09 | Mitsubishi Electric Corp | 電圧無効電力監視システム |
Cited By (12)
| Publication number | Priority date | Publication date | Assignee | Title |
|---|---|---|---|---|
| WO2017104302A1 (fr) * | 2015-12-16 | 2017-06-22 | 株式会社日立製作所 | Dispositif et procédé de surveillance de stabilité de tension |
| JP2017112709A (ja) * | 2015-12-16 | 2017-06-22 | 株式会社日立製作所 | 電圧安定度監視装置および方法 |
| EP3392995A4 (fr) * | 2015-12-16 | 2019-05-01 | Hitachi, Ltd. | Dispositif et procédé de surveillance de stabilité de tension |
| US11349311B2 (en) | 2015-12-16 | 2022-05-31 | Hitachi, Ltd. | Voltage stability monitoring device and method |
| CN105406476A (zh) * | 2015-12-31 | 2016-03-16 | 国家电网公司 | 基于历史数据的电力系统稳定性快速判断方法 |
| CN105406476B (zh) * | 2015-12-31 | 2017-10-13 | 国家电网公司 | 基于历史数据的电力系统稳定性快速判断方法 |
| WO2018138973A1 (fr) * | 2017-01-30 | 2018-08-02 | 株式会社日立製作所 | Dispositif et procédé d'aide à la prise de décision de fonctionnement de système |
| JP2018182844A (ja) * | 2017-04-07 | 2018-11-15 | 株式会社日立製作所 | 電力系統安定化装置および電力系統安定化方法 |
| EP3609033A4 (fr) * | 2017-04-07 | 2020-12-30 | Hitachi, Ltd. | Dispositif et procédé de stabilisation de système énergétique |
| US11256278B2 (en) | 2017-04-07 | 2022-02-22 | Hitachi, Ltd. | Power system stabilization device and power system stabilization method |
| CN108229071A (zh) * | 2018-02-09 | 2018-06-29 | 杭州安脉盛智能技术有限公司 | 基于ar模型与svdd算法的刀具性能退化评估方法及系统 |
| CN110460085A (zh) * | 2019-08-28 | 2019-11-15 | 华北电力大学(保定) | 一种考虑风电和负荷特性对电力系统影响的方法 |
Also Published As
| Publication number | Publication date |
|---|---|
| PL3136530T3 (pl) | 2018-12-31 |
| US10473700B2 (en) | 2019-11-12 |
| JP2015211512A (ja) | 2015-11-24 |
| US20170045558A1 (en) | 2017-02-16 |
| EP3136530A4 (fr) | 2018-01-17 |
| EP3136530A1 (fr) | 2017-03-01 |
| EP3136530B1 (fr) | 2018-07-25 |
| JP6244255B2 (ja) | 2017-12-06 |
Similar Documents
| Publication | Publication Date | Title |
|---|---|---|
| JP6244255B2 (ja) | 電圧安定度監視装置および方法 | |
| JP6726959B2 (ja) | 電圧安定度監視装置および方法 | |
| JP6239754B2 (ja) | 電圧安定度監視装置および方法 | |
| JP6412822B2 (ja) | 電力系統電圧無効電力監視制御装置及び方法 | |
| Qi et al. | Joint planning of energy storage and transmission for wind energy generation | |
| Leonardi et al. | An approach for real time voltage stability margin control via reactive power reserve sensitivities | |
| US10389133B2 (en) | Device and method for controlling power system | |
| JP6397760B2 (ja) | 電力系統安定化装置および方法 | |
| JP2018068045A (ja) | 電圧無効電力運用支援装置および支援方法、並びに電圧無効電力運用監視制御装置および監視制御方法 | |
| WO2022130790A1 (fr) | Dispositif de commande de surveillance de système d'alimentation, système de commande de surveillance de système d'alimentation et procédé de commande de surveillance de système d'alimentation | |
| Liu et al. | Kriging surrogate model enabled heuristic algorithm for coordinated Volt/Var management in active distribution networks | |
| KR20130034769A (ko) | 순동무효전력을 확보하기 위한 무효전력보상 제어장치 및 그 방법 | |
| JP2018014774A (ja) | 配電系統の系統最適化計算装置および系統最適化計算方法 | |
| Abdelaziz et al. | Fuel-saving benefit analysis of islanded microgrid central controllers | |
| CN116316611B (zh) | 基于低压台区下的供电方法及系统 | |
| Santos et al. | A novel methodology to determine the reactive power range requirements for wind generators considering the correlation of electricity demand and wind generation | |
| WO2019097672A1 (fr) | Dispositif et procédé de surveillance de système de distribution d'énergie, procédé de surveillance de système de distribution d'énergie et programme | |
| GB2606467A (en) | Renewable energy system stabilization system and system stabilization support method | |
| Dyachenko et al. | Algorithm for the Program of Energy Saving for Power Supply System | |
| JP6996998B2 (ja) | 電力系統監視装置 | |
| JP2015177607A (ja) | 配電系統の対策工事決定装置及び方法 | |
| Dhadbanjan et al. | Comparison of optimum reactive power schedule with different objectives using lp technique | |
| He et al. | Impacts of dynamic thermal rating systems on wind generations: A review | |
| Putranto | Design of Wide Area Monitoring Systems for Securing Voltage Stability | |
| JP2024006734A (ja) | 電力系統安定化装置および方法 |
Legal Events
| Date | Code | Title | Description |
|---|---|---|---|
| 121 | Ep: the epo has been informed by wipo that ep was designated in this application |
Ref document number: 15783447 Country of ref document: EP Kind code of ref document: A1 |
|
| REEP | Request for entry into the european phase |
Ref document number: 2015783447 Country of ref document: EP |
|
| WWE | Wipo information: entry into national phase |
Ref document number: 15306226 Country of ref document: US Ref document number: 2015783447 Country of ref document: EP |
|
| NENP | Non-entry into the national phase |
Ref country code: DE |