WO2015163121A1 - Voltage stability-monitoring device and method - Google Patents
Voltage stability-monitoring device and method Download PDFInfo
- Publication number
- WO2015163121A1 WO2015163121A1 PCT/JP2015/060690 JP2015060690W WO2015163121A1 WO 2015163121 A1 WO2015163121 A1 WO 2015163121A1 JP 2015060690 W JP2015060690 W JP 2015060690W WO 2015163121 A1 WO2015163121 A1 WO 2015163121A1
- Authority
- WO
- WIPO (PCT)
- Prior art keywords
- voltage stability
- calculation
- voltage
- bus
- power
- Prior art date
Links
Images


Classifications
-
- H—ELECTRICITY
- H02—GENERATION; CONVERSION OR DISTRIBUTION OF ELECTRIC POWER
- H02J—CIRCUIT ARRANGEMENTS OR SYSTEMS FOR SUPPLYING OR DISTRIBUTING ELECTRIC POWER; SYSTEMS FOR STORING ELECTRIC ENERGY
- H02J13/00—Circuit arrangements for providing remote indication of network conditions, e.g. an instantaneous record of the open or closed condition of each circuitbreaker in the network; Circuit arrangements for providing remote control of switching means in a power distribution network, e.g. switching in and out of current consumers by using a pulse code signal carried by the network
- H02J13/00032—Systems characterised by the controlled or operated power network elements or equipment, the power network elements or equipment not otherwise provided for
- H02J13/00034—Systems characterised by the controlled or operated power network elements or equipment, the power network elements or equipment not otherwise provided for the elements or equipment being or involving an electric power substation
-
- G—PHYSICS
- G01—MEASURING; TESTING
- G01R—MEASURING ELECTRIC VARIABLES; MEASURING MAGNETIC VARIABLES
- G01R19/00—Arrangements for measuring currents or voltages or for indicating presence or sign thereof
- G01R19/0084—Arrangements for measuring currents or voltages or for indicating presence or sign thereof measuring voltage only
-
- G—PHYSICS
- G01—MEASURING; TESTING
- G01R—MEASURING ELECTRIC VARIABLES; MEASURING MAGNETIC VARIABLES
- G01R19/00—Arrangements for measuring currents or voltages or for indicating presence or sign thereof
- G01R19/25—Arrangements for measuring currents or voltages or for indicating presence or sign thereof using digital measurement techniques
- G01R19/2513—Arrangements for monitoring electric power systems, e.g. power lines or loads; Logging
-
- H—ELECTRICITY
- H02—GENERATION; CONVERSION OR DISTRIBUTION OF ELECTRIC POWER
- H02J—CIRCUIT ARRANGEMENTS OR SYSTEMS FOR SUPPLYING OR DISTRIBUTING ELECTRIC POWER; SYSTEMS FOR STORING ELECTRIC ENERGY
- H02J13/00—Circuit arrangements for providing remote indication of network conditions, e.g. an instantaneous record of the open or closed condition of each circuitbreaker in the network; Circuit arrangements for providing remote control of switching means in a power distribution network, e.g. switching in and out of current consumers by using a pulse code signal carried by the network
-
- H—ELECTRICITY
- H02—GENERATION; CONVERSION OR DISTRIBUTION OF ELECTRIC POWER
- H02J—CIRCUIT ARRANGEMENTS OR SYSTEMS FOR SUPPLYING OR DISTRIBUTING ELECTRIC POWER; SYSTEMS FOR STORING ELECTRIC ENERGY
- H02J3/00—Circuit arrangements for ac mains or ac distribution networks
-
- H—ELECTRICITY
- H02—GENERATION; CONVERSION OR DISTRIBUTION OF ELECTRIC POWER
- H02J—CIRCUIT ARRANGEMENTS OR SYSTEMS FOR SUPPLYING OR DISTRIBUTING ELECTRIC POWER; SYSTEMS FOR STORING ELECTRIC ENERGY
- H02J3/00—Circuit arrangements for ac mains or ac distribution networks
- H02J3/24—Arrangements for preventing or reducing oscillations of power in networks
Definitions
- the present invention relates to a voltage stability monitoring device that monitors voltage stability (also referred to as voltage stability) of a power system.
- Patent Document 2 JP-A-2005-287128
- the PV curve is drawn with high accuracy and high speed, and the PV curve is traced with respect to the continuous load. Therefore, the stability of the system voltage is monitored while accurately following the control of the transformer tap and the like.
- a power system stability monitoring system capable of performing the above is described.
- the conventional voltage stability monitoring device described in the above-mentioned non-patent documents and patent documents monitors the possibility of deterioration of voltage stability by assuming either or both of a tidal current change assumption and a failure (accident). Is possible.
- the monitoring points of conventional voltage stability monitoring devices are targeted at substation buses that are important for power transmission and reception, and each bus that has been known to deteriorate in voltage stability due to operator experience.
- the monitoring part of the conventional voltage stability monitoring device or the conventional There is a risk that the voltage stability of the bus that is not the monitoring part of the voltage stability monitoring device will deteriorate.
- the present invention provides a voltage stability monitoring apparatus for monitoring the voltage stability of a power system, and a scenario of a change assumed based on at least one of a change in a system configuration or a power flow state of the power system.
- An assumed change scenario calculation unit that creates a plurality of assumed change scenarios indicating the voltage, a voltage stability calculation unit that calculates the voltage stability using the assumed change scenario, and a margin of the voltage stability based on the voltage stability
- a voltage stability margin calculation unit for calculating a voltage stability margin indicating a degree, and each scenario severeness that selects an assumed change scenario having a high severity of the voltage stability for each of the assumed change scenarios based on the voltage stability margin
- Which bus of the power system is a vulnerable bus that reduces the voltage stability based on the degree ranking calculator and the selected assumed change scenario
- calculating fragile bus calculating unit characterized in that it comprises a monitoring point changing unit for changing the monitoring target of the voltage stability based on the information of the weak bus.
- the operator's labor is reduced by automatically calculating the assumed change scenario considering the output change of the renewable energy, and by performing voltage stability monitoring calculation for the assumed change scenario, the present or future It is possible to dynamically change the bus at which the voltage stability deteriorates, and to accurately monitor the current or future voltage stability deterioration.
- FIG. 1 It is an example of the figure which shows the drawing image which created the PV curve by the continuous power flow calculation. It is an example of a processing flow for creating a PV curve by continuous power flow calculation and determining the limit of voltage stability. It is an example of the figure showing a voltage vector and a load parameter as a variable decided by pseudo arc length. It is an example of the flowchart explaining the process of each scenario severe degree ranking calculation part. It is an example of the flowchart explaining the process of a weak
- an assumed change scenario is calculated from the system data D1 and the system facility data D2, and the voltage stability calculation is performed using the calculated assumed change scenario data D3, the system data D1, the system facility data D2, and the threshold data D8.
- an example of the voltage stability monitoring device 10 that performs each scenario severity ranking calculation and vulnerable bus calculation, outputs monitoring location change command data D9, and displays the monitoring location display
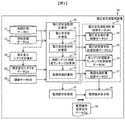
- FIG. 1 illustrates an example of the entire configuration including input / output indicating contents in a database and data and processing indicating contents in a calculation unit.
- a power system 100, a monitoring control device 210, and a voltage stability monitoring device 10 are described.
- An example of a hardware configuration of the measuring device 44, the power source 110, the load 150, the bus, the transformer, and the power transmission line will be described with reference to FIG.
- FIG. 1 is an example of an overall configuration diagram of the voltage stability monitoring apparatus 10 of the present embodiment, and system data D1, system equipment data D2, assumed change scenario calculation unit 30, assumed change scenario data D3, threshold data D8,
- the voltage stability calculation unit 31 the voltage stability margin calculation unit 32, each scenario severity ranking calculation unit 33, the voltage stability monitoring calculation unit 40 including the vulnerable bus calculation unit 34, the voltage stability calculation result data D4, and the voltage stability Degree margin calculation result data D5, each scenario severity ranking calculation result data D6 and vulnerable bus calculation result data D7, voltage stability monitoring calculation result data D41, monitoring location change unit 35, monitoring location change command data D9 and monitoring location 2 is a diagram illustrating a configuration of a voltage stability monitoring device 10 including a display unit 36.
- FIG. 1 is an example of an overall configuration diagram of the voltage stability monitoring apparatus 10 of the present embodiment, and system data D1, system equipment data D2, assumed change scenario calculation unit 30, assumed change scenario data D3, threshold data D8,
- the voltage stability calculation unit 31 the voltage stability margin calculation unit 32, each scenario severity ranking calculation unit 33, the voltage stability monitoring
- the input data of the voltage stability monitoring device 10 includes system data D1, system equipment data D2, assumed change scenario data D3, and threshold data D8.
- the assumed change scenario calculation unit 30 of the voltage stability monitoring apparatus 10 calculates assumed change scenario data D3 using the system data D1 and the system facility data D2. Further, the voltage stability calculation unit 31 of the voltage stability monitoring apparatus 10 performs voltage stability calculation using the system data D1, the system facility data D2, and the assumed change scenario data D3, and the voltage stability calculation result data D4 is obtained. Output.
- the voltage stability margin calculation unit 32 of the voltage stability monitoring apparatus 10 performs voltage stability margin calculation using the voltage stability calculation result data D4, and outputs voltage stability margin calculation result data D5.
- each scenario severity ranking calculation unit 33 of the voltage stability monitoring apparatus 10 performs each scenario severity ranking calculation using the voltage stability calculation result data D4, the voltage stability margin calculation result data D5, and the threshold data D8.
- the scenario severity ranking calculation result data D6 is output.
- the vulnerable bus calculation unit 34 of the voltage stability monitoring device 10 uses the voltage stability calculation result data D4, the voltage stability margin calculation result data D5, the scenario severity ranking calculation result data D6, and the threshold data D8.
- the vulnerable bus calculation is performed, and the vulnerable bus calculation result data D7 is output.
- the monitoring location change unit 35 of the voltage stability monitoring apparatus 10 transmits the monitoring location change command data D9 for changing the monitoring location to the monitoring location display 36 using the vulnerable bus calculation result data D7.
- the monitoring location display 36 of the voltage stability monitoring apparatus 10 the monitoring location is changed and displayed using the monitoring location command data D9, and the monitoring location information is displayed using the voltage stability monitoring calculation result data D41. .
- FIG. 2 is an example of a hardware configuration of the voltage stability monitoring device 10 and an overall configuration diagram of the power system 100.
- the power system 100, the monitoring control device 210, the voltage stability monitoring device 10, the measuring device 44, the power source 110, and the load It is the figure which showed the example of the hardware constitutions with 150, a bus-line, a transformer, and a power transmission line.
- the electric power system 100 is connected to the generator 110, the transformer 130, the measuring device 44, and the load 150, which are connected to each other via a branch (track) 140 and a node (bus) 120, respectively. It is composed of any one or a plurality of possible devices (battery, rechargeable secondary battery, EV storage battery, flywheel, etc.).
- examples of the power source 110 include a distributed power source such as a solar power generator and a wind power generator in addition to a large power source such as a thermal power generator, a hydroelectric power generator, and a nuclear power generator.
- an example of the measuring device 44 is a device (VT, PT, or CT) that measures one or more of the node voltage V, the branch current I, the power factor ⁇ , the active power P, and the reactive power Q. And a function of transmitting data including a data measurement location identification ID and a built-in time stamp of the measurement device (such as a telemeter (TM)).
- a device that measures power information (voltage phasor information) with absolute time using GPS, a phase measurement device (PMU: Phasor Measurement Units), or another measurement device may be used.
- the measurement device 44 is written to be in the power system 100, it may be installed on a bus or power transmission line connected to the generator 110, the transformer 130, the measurement device 44, and the load 150.
- the measurement data D1 is each of the data measured by the measurement device 44, and is received by the system measurement database 21 via the communication network 300.
- the system data may be aggregated by the monitoring control device 210 and then received by the system measurement database 21 via the communication network 300, or may be monitored with the measurement device 44. You may receive into the system
- FIG. The measurement data D1 may include a unique number for identifying data and a time stamp.
- Display unit 11 input unit 12, such as a keyboard or mouse, communication unit 13, computer or computer server (CPU: Central Processing Unit) 14, memory 15, various databases (system measurement database 21, system facility database 22, and assumed change scenario database 23, a voltage stability calculation result database 24, a voltage stability margin calculation result database 25, each scenario severity ranking calculation result database 26, a vulnerable bus calculation result database 27, a threshold database 28, and a program database 29) are connected to the bus line 43.
- various databases system measurement database 21, system facility database 22, and assumed change scenario database 23, a voltage stability calculation result database 24, a voltage stability margin calculation result database 25, each scenario severity ranking calculation result database 26, a vulnerable bus calculation result database 27, a threshold database 28, and a program database 29
- the display unit 11 is configured as a display device, for example.
- the display unit 11 may be configured to use a printer device, an audio output device, or the like instead of the display device or together with the display device.
- the input unit 12 may be configured to include at least one of a keyboard switch, a pointing device such as a mouse, a touch panel, a voice instruction device, and the like.
- the communication unit 13 includes a circuit for connecting to the communication network 300 and a communication protocol.
- the CPU 14 reads a predetermined computer program from the program database 29 and executes it.
- the CPU 14 may be configured as one or a plurality of semiconductor chips, or may be configured as a computer device such as a calculation server.
- the memory 15 is configured as a RAM (Random Access Memory), for example, and stores a computer program read from the program database 29, and stores calculation result data and image data necessary for each process.
- the screen data stored in the memory 14 is sent to the display unit 11 and displayed. An example of the displayed screen will be described later.
- FIG. 3 is an example of a configuration diagram showing the contents of the program data of the voltage stability monitoring device.
- the program database 29 includes, for example, a state estimation calculation program P70, an assumed change scenario calculation program P10, a voltage stability calculation program P20, a voltage stability margin calculation program P30, each scenario severity ranking calculation program P40, and a vulnerable bus calculation program P50. And a monitoring location change program P60 are stored.
- the CPU 14 reads the calculation programs (state estimation calculation program P70, assumed change scenario calculation program P10, voltage stability calculation program P20, and voltage stability margin calculation program P30) read from the program database 29 into the memory 14.
- Each scenario severity ranking calculation program P40, vulnerable bus calculation program P50, and monitoring location change program P60) are executed to calculate plausible system status, assumption change scenario calculation, voltage stability calculation, voltage stability margin Calculation, calculation of ranking of severe scenario, calculation of selection of severe scenario, calculation of vulnerable bus, instruction to change monitoring location, instruction of image data to be displayed, search of data in various databases, etc.
- the memory 14 temporarily stores calculation temporary data and calculation result data such as display image data, monitoring data, and monitoring result data.
- the memory 14 generates necessary image data by the CPU 14 and displays the display unit 11 (for example, a display display screen). ).
- the display unit 11 of the voltage stability monitoring apparatus 10 may be a simple screen only for rewriting each control program and database.
- the voltage stability monitoring device 10 stores roughly nine databases. Except for program database 29, system measurement database 21, system facility database 22, assumed change scenario database 23, voltage stability calculation result database 24, voltage stability margin calculation result database 25, each scenario severity ranking calculation result database 26, and vulnerability
- the bus calculation result database 27 and the threshold database 28 will be described.
- the system measurement database 21 includes active power P, reactive power Q, voltage V, voltage phase angle ⁇ , current I, power factor ⁇ , and the like as system measurement data. Data with time stamp or PMU data may be used. For example, the voltage and voltage phase angle at the nodes 120a and 120b connected to the power system 100, the line flow (P + jQ) of the branches 140a and 140b connected to the nodes 120a and 120b connected to the power system 100, and the power system 100 are connected.
- the measuring device is VT, PT, or the like.
- the line power flow (P + jQ) can be calculated from the current I, the voltage V, and the power factor ⁇ measured by VT or PT.
- each node, branch, generator, load, control device active power P, reactive power Q, voltage V, voltage phase angle ⁇ , current I which is a calculation result of the state estimation calculation program P70, is obtained.
- the result of estimating and calculating the power factor ⁇ is also stored as system measurement data.
- the system facility database 22 includes system configuration, line impedance (R + jX), ground capacitance (admittance: Y), data necessary for system configuration and state estimation (such as threshold of bat data), generator data, and other currents. Data necessary for calculation, state estimation, and voltage stability calculation are included.
- a measured value may be obtained from a monitoring control device, a central power supply command station, EMS, or may be obtained directly from a measuring device for the entire system.
- the CPU 14 At the time of input, the CPU 14 generates necessary image data and displays it on the display unit 11. At the time of input, it may be semi-manual so that a large amount of data can be set by using a complementary function.
- the assumed change scenario database 23 stores a failure location, a failure aspect, an assumed renewable energy change amount, and the like as a failure case assumed in the power system, stored using the input unit 12 of the voltage stability monitoring device 10.
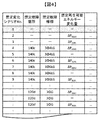
- the failure is assumed as a failure case assumed in the electric power system as shown in FIG. It includes a list that combines the location, failure mode, and assumed renewable energy change. Other elements include failure removal timing and the like in the list.
- the assumed amount of renewable energy change includes the amount of fluctuation in the output of solar power generation, wind power generation, mega solar and wind farms, and the simultaneous loss of wind farms.
- the failure case may be only a severe failure case depending on the operation of the system.
- the assumed change scenario data D3 may be set in advance without using the input unit 12, or a value set by the monitoring control device 210 may be set via the communication network 300 and the communication unit 13. By these setting methods, there is an effect that the assumed change scenario data D3 can be set flexibly.
- calculation results such as continuous power flow calculation for evaluating the voltage stability calculated by the voltage stability calculation program P20 are stored.
- the continuous power flow calculation is an operation in which the load power is changed under certain conditions to predict the system state (predictor calculation) and the corresponding bus voltage is obtained by power flow calculation (corrector calculation). This is a technique for drawing a PV curve or a VQ curve by calculating continuously. Details of the continuous flow calculation will be described later.
- the voltage stability calculation may be a change in the node voltage with respect to the total demand, or a change in the node voltage relative to the total demand divided by the initial demand. It may be a change in node voltage with respect to the demand of the node, or a change in node voltage with respect to the demand of each node divided by the initial demand of each node.
- the node voltage change for any one or more of the above demands is stored.
- the PV curve or VQ curve of the voltage stability calculation result data D4 calculated by the voltage stability margin calculation program P30 is used.
- the voltage difference ⁇ V and active power margin ⁇ P from the difference in demand from the tip of the PV curve to the current operating point and the voltage difference, and the difference in demand from the tip of the VQ curve to the current operating point are calculated as follows.
- To reactive power margin ⁇ Q is stored for each node. Similar to the voltage stability calculation, for example, the PV curve used when obtaining the voltage margin ⁇ V and the active power margin ⁇ P from the PV curve is a change in the node voltage with respect to the total demand.
- It may be a change in node voltage relative to the total demand divided by the initial demand, or a change in node voltage relative to the demand of each node, and the demand of each node may be the initial value of each node. It may be a change in node voltage relative to that divided by demand.
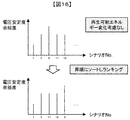
- Each scenario severity ranking calculation result database 26 uses the voltage stability margin calculation result data D5 corresponding to each scenario change scenario calculated by each scenario severity ranking calculation program P40 and uses each scenario change scenario.
- the results of ranking as shown in FIG. 16 and FIG. 17 by sorting in ascending order and the results of selecting a scenario that is equal to or less than the severity threshold using the threshold data D8 are stored.
- the threshold data D8 will be described later in the description of the threshold database 28.
- the vulnerable bus calculation result database 27 stores a node number, a location, and the like for unique identification of a vulnerable bus in terms of voltage stability, calculated by the vulnerable bus calculation program P50.
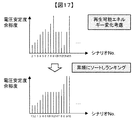
- the fragile bus is calculated according to a certain standard, for example, by comparing ⁇ V UL10 and ⁇ V UL20 of each node as shown in FIGS. 18 and 19 or comparing ⁇ Q 1 and ⁇ Q 2 of each node.
- the calculation method and certain criteria for the vulnerable bus will be described later.
- stored is a position on a systematic diagram as shown, for example in FIG.
- the threshold database 28 stores a severity threshold and a vulnerable bus threshold as shown in FIG.
- the severity threshold is a threshold used in severe scenario severity ranking calculation, and is used to select a scenario that is equal to or less than the severity threshold as a severe scenario.
- the vulnerable bus threshold is a threshold used in vulnerable bus calculation, and is used to select a node that is equal to or lower than the vulnerable bus threshold as a vulnerable bus.
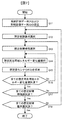
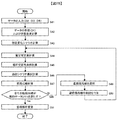
- FIG. 6 is an example of a flowchart showing the entire processing of the voltage stability monitoring apparatus.
- the flow will be briefly described.
- the system facility data D2, the assumed change scenario data D3, and the threshold data D8 are input and stored, the system measurement data D1 is received, the state estimation calculation is performed, and the state estimation calculation result is stored.
- an assumed change scenario is calculated using the system facility data D2, the assumed change scenario data D3, and the state estimation result (stored in the assumed change scenario database 23).
- the voltage stability calculation is performed using the state estimation calculation result (stored in the system measurement database 21) and the assumed change scenarios, and then the voltage stability margin calculation is performed.
- the voltage stability calculation result And the voltage stability margin calculation result is stored.
- the severe scenario severity ranking calculation is performed using the voltage stability margin calculation result D5 and the threshold data D8, and the severe scenario severity ranking calculation result is stored.
- vulnerable bus calculation is performed using the severe scenario severity ranking calculation result D6 and threshold data D8, and the vulnerable bus calculation result is stored.
- the vulnerable bus calculation result D7 the monitoring location is changed to a location where there are many vulnerable buses or vulnerable buses. Note that a plurality of monitoring locations may be displayed, or the most vulnerable busbar may be displayed.
- Various calculation results and data stored in the memory during the calculation may be sequentially displayed on the screen of the monitoring control device 210. Thereby, the operator can easily grasp the operation status of the voltage stability monitoring apparatus 10.
- the monitoring content (occurrence
- the operator can easily grasp the operation status of the voltage stability monitoring apparatus 10.
- the screen display of the situation from reception of various data to transmission of various calculation results is repeated until the monitoring location is changed.
- step S1 when the system equipment data D2, the assumed change scenario data D3, and the threshold data D8 are not set in advance, the system equipment data D2, the assumed change scenario data D3, and the threshold data D8 are input to the input unit 12 and the display unit 11. Enter using.
- data may be input from the monitoring control device 210 through the communication network 300 and the communication unit 13, or the system facility data D2, the assumed change scenario data D3, and the threshold data D8 held in the monitoring control device 210 or the like.
- the data related to the above may be automatically received and stored at regular intervals. Further, when the system facility data D2, the assumed change scenario data D3, and the threshold data D8 are set in advance, the correction may be added or the data as it is may be used.
- step S2 the system measurement data D1 is received, the state estimation calculation is performed, and the state estimation calculation result is stored in the system measurement database 21.
- state estimation calculation methods include, for example, Lars Holten, Anders Gjelsvlk, Sverre Adam, F. F. Wu, and Wen-Hs Iung E. Liu, Comparison of Different Methods for State Estimation, IEEE Transaction on Power Perform according to the calculation method described in 3 (1988), pp.1798-1806.
- step S3 the assumed change scenario calculation is performed using the system facility data D2, the assumed change scenario data D3 stored in step S1, and the state estimation result obtained in step S2, and the result is assumed change scenario database 23. To remember.
- FIG. 7 is an example of a flowchart for explaining the process of the assumed change scenario calculation unit 30.
- FIG. 7 shows a flow of reading system measurement data D1 and system equipment data D2 through steps S11 to S18, selecting an assumed failure location / mode, selecting an assumed renewable energy change amount, and saving it as an assumed change scenario D3. It shows a method of repeatedly calculating until an assumed failure location, an assumed failure aspect, and an assumed renewable energy change amount are selected. The flow of the above processing will be described below.
- step S11 the system measurement data D1 and the system facility data D2 input, received and calculated in steps S1 and S2 are read and read into the memory 14.
- step S12 an unselected one is selected from the list of conceivable failure locations read out to the memory 14.
- step S ⁇ b> 13 an unselected one is selected from the list of assumed failure modes read to the memory 14.
- step S14 an unselected one is selected from the list of assumed renewable energy change amounts read out to the memory 14.
- step S15 the combination of the assumed failure location, the assumed failure aspect, and the assumed renewable energy change amount selected in steps S12 to S14 is stored as one assumed change scenario D3.
- step S16 when the list of all assumed renewable energy changes is not selected, the process returns to step S14. Further, in step S16, if a list of all assumed renewable energy changes is selected, the process proceeds to step S17.
- step S17 when the list of all conceivable failure modes has not been selected, the process returns to step S13. Further, in step S17, when a list of all assumed failure modes has been selected, the process proceeds to step S18. If it is determined in step S18 that a list of all possible failure locations has not been selected, the process returns to step S12. Moreover, in step S17, when the list of all the assumed failure locations is selected, the flow ends.
- the assumed renewable energy change amount there is no output change, output decrease (for a certain period), output increase (for a certain period), and the like. Further, the assumed renewable energy change amount may be updated based on manual input or data stored in a monitoring control device or a database at regular intervals.
- the assumed failure location, the assumed failure aspect, and the assumed renewable energy change amount there is also a combination of only the assumed renewable energy change amount without failure.
- the assumed change scenario data D3 may be set in advance without using the input unit 12, or a value set by the monitoring control device 210 may be set via the communication network 300 and the communication unit 13. By these setting methods, there is an effect that the assumed change scenario data D3 can be set flexibly.
- step S ⁇ b> 4 after the voltage stability calculation is performed using the state estimation calculation result and each assumed change scenario, the voltage stability calculation result is stored.
- the voltage stability calculation method is, for example, Patent Document 2 and Chiang. H. D. et al., “CPFLOW: A Practical Tool for Tracing Power System Steady-State Stationary Behavior Due to Load and Generation Variations”, IEEE Trans , On Power Systems, Vol. 10, No. 2, pp.623-634, 1995, Venkataramana Ajjarapu, “Computational Techniques for Voltage Stability Assessment and Control”, Springer, 2006, pp.49-116 This is performed in accordance with the calculation method described in Japanese Patent No. 153397.
- the above voltage stability calculation method is generally called continuous power flow calculation, and is a method applying the continuous method based on the concept of the predictor-corrector method, which is a nonlinear function analysis method.
- a stable and stable solution can be obtained even near the active power limit, which is the limit of the voltage stability, and the effective power limit can be obtained accurately. is there.
- a voltage lowering solution can be stably calculated by using continuous power flow calculation. As a result, there is an effect that the difference ⁇ V between the higher solution and the lower solution at the operating point used in the evaluation of the voltage stability can be calculated.
- Fig. 8 shows a drawing image of the PV curve. The processing flow is shown in FIG.
- predictor calculation will be described.
- the purpose of the predictor is to obtain a prediction point for obtaining the next solution. Since the predicted point is an initial value of the corrector calculation (tidal flow calculation), the higher the quality of the predicted point, the shorter the iterative calculation of the corrector for obtaining an accurate solution.
- Linear predictors include (a) simple increase predictors, (b) secant predictors, (c) tangent predictors, and non-linear predictors include (d) parabolic predictors. Calculation of a combination predictor of any one or a plurality of predictors such as (a) to (d) may be performed. Note that (a) a simple increase predictor is a method of obtaining a predictor by simply increasing ⁇ . (B) The predictor of the secant method is the previous convergence point as shown in Mori et al .: “Continuous power flow calculation using Lagrangian interpolation nonlinear predictor”, Electrical Engineering B, Vol.
- the predictor of the tangent method is the tangent to the PV curve at the previous convergence point as shown in Fukuyama et al: “Continuation Power Flow practical system development”, IEEJ National Convention, No. 1387, 1997. This is a method for obtaining a predictor on the tangent line.
- the predictor of the parabola predictor is a method of obtaining a predictor on the parabola by drawing a parabola using the previous convergence point.
- Control of the step width in predictor calculation includes binary search method that controls the step width in half when it does not converge, Venkataramana Ajjarapu, “Computational Techniques for Voltage Stability Assessment and Control”, Springer, 2006, pp.33-
- the control for increasing / decreasing the step width control coefficient (described later) according to the number of convergence calculations of the previous correction calculation described in 38 may be performed by either one or both.
- convergence number control a method of applying both methods
- the step width ⁇ is determined by the following equation.
- N opt is initially set to an arbitrary value, and is increased or decreased as necessary when a desired PV curve cannot be drawn. Thereby, there is an effect that a desired PV curve can be drawn.
- the desired PV curve is, for example, a PV curve obtained up to the active power at the operating point on both sides of the voltage increasing solution and the lower solution, and a PV where the convergence point is between the desired point widths.
- the curve is a PV curve in which the convergence point in the vicinity of the nose of the PV curve is between a desired point width. This is because, depending on the value of N opt , there are cases where the lower solution side does not converge on the way before it is reduced to the active power at the operating point, and there are cases where the number of points on the PV curve is small or large. On the lower solution side, there is an advantage that ⁇ V UL10 shown in FIG. 18 is calculated by calculating up to the active power at the operating point, and an index of voltage stability can be used. Further, since the convergence point is between the desired point widths, there is an advantage that the PV curve can be adjusted to a desired accuracy.
- Convergence frequency control is controlled such that (k) N is increased and the step width is decreased when the power flow state is difficult to converge, and (k) N is decreased and the step width is increased when convergence is easy. As a result, continuous power flow calculation can be performed efficiently.
- the binary search method is switched until convergence.
- the case of not converging is counted every time the sum of mismatches calculated in the nth time becomes larger than the sum of mismatches calculated in the n + 1th time in the convergence calculation in one corrector calculation. This is when the set number of times is exceeded.
- equation (1) is used. If converged, the next step adjustment returns to the convergence number control of equation (1). As a result, even when it is difficult to converge such that the upper limit of the number of convergence calculations is reached, a solution can be obtained stably.
- the shape of the PV curve is a quadratic curve, so the predictor created using the voltage increase solution and the active power limit solution one before the active power limit is There is a possibility that the number of convergence calculations increases as the voltage lowering solution to be converged is far away.
- (k) N is increased when obtaining the first voltage lowering solution point, and subsequent voltage lowering solutions are obtained. ⁇ becomes smaller than when a solution with higher voltage is sought, and the solution with lower voltage may be calculated in small increments, which may increase the amount of calculation.
- x is a variable vector in which bus voltage values are arranged
- ⁇ is a variable vector in which load parameter values are arranged.
- f Pi is the active power at bus i
- f Qi is the reactive power at bus i
- f Vi is a function representing the magnitude of the voltage at bus i
- f Psi , f Qsi , f Vsi is an active power, reactive power, and specified value of voltage magnitude on bus i, respectively
- ⁇ is a load parameter. Since either (4) or (5) can only be specified, normally a bus that is not subject to voltage control, such as a load bus, is subject to voltage control, such as a generator bus, using (5) as the PQ designation. (5) is used for the PV bus designation.
- x is a voltage vector
- ⁇ is a load parameter
- s is a pseudo arc length.
- Equation (8) represents the hypersphere shown in (1), and shows the constraint that the sum of the increments of all variables is partially equal to the value obtained by linearly approximating the PV curve.
- Continuous power flow calculation creates a PV curve by changing the active power and reactive power of the simultaneous equations (6), (7), and (8) using the Newton-Raphson method each time. To do.
- ⁇ x (l + 1) Newton-Raphson method, a correction amount ⁇ x (l + 1) is obtained from equation (9), and a solution is obtained while updating x by equation (10).
- J Aug is an extended Jacobian matrix obtained by partial differentiation of f (x) by the element of x, and the right superscript (l) represents the number of convergence calculation steps.
- the difference between the expanded Jacobian matrix and the Jacobian matrix used in normal power flow calculation is that the matrix of the load parameter ⁇ is expanded. Thereby, the convergence can be improved even near the active power limit.
- x in equations (9) and (10) is described including ⁇ .
- the Newton-Raphson method may be calculated using a polar coordinate system or an orthogonal coordinate system.
- FIGS. 13 and 15 are examples illustrating an image of the voltage stability calculator 31.
- FIG. 13 shows an example in which a PV curve is calculated with the total demand P of active power on the horizontal axis and the voltage V i of the node i on the vertical axis.
- the operating point is (P 0 , V i0 ), and the lower solution that is paired with this higher solution is (P 0 , V ′ i0 ).
- the limit of voltage stability, active power limit is part of the P C.
- the active power limit which is the tip of the PV curve, is generally called the nose.
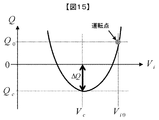
- VQ curve 15 is an example of calculating a VQ curve with the horizontal axis representing the voltage V i of the node i and the vertical axis representing the total demand Q of reactive power.
- the operating point is (V i0 , Q 0 ).
- the limit of voltage stability, reactive power limit is part of the Q C.
- the VQ curve can be drawn by subtracting the reactive power supply from the system side from the reactive power consumption of node i.
- it has the function of the voltage stability calculation which considered the constraint data of a generator as shown in FIG. As a result, the voltage stability of the power system closer to reality can be examined.
- step S5 the voltage stability margin calculation is performed, and the voltage stability margin calculation result is stored.
- FIG. 13 and FIG. 15 are examples illustrating an image of the voltage stability margin calculation unit 32. From P-V curve of FIG. 13, by a difference between P 0 of the operating point and the active power limit P C (11) equation can be calculated voltage stability margin [Delta] P. Further, the voltage stability margin may be ⁇ V i calculated by equation (12).
- the system operator can easily understand by using the voltage stability margin that can be easily obtained from the PV curve and VQ curve composed of physical quantities that are usually used by the system operator.
- other voltage stability margins may be calculated and used.
- the PV curve or VQ curve cannot be written in the first place. In such a case, it is considered that there is no operating point, and it is determined that there is no voltage stability margin.
- step S6 the severe scenario severity ranking calculation is performed using the voltage stability margin calculation result D5 and the threshold data D8, and the severe scenario severity ranking calculation result is stored.
- FIG. 11 is an example of a flowchart for explaining the processing of the severe scenario severity ranking calculation unit 33.
- FIG. 11 reads the voltage stability margin calculation result data D5 and threshold data D8 calculated in step S5 through steps S21 to S26, sorts the assumed change scenarios in ascending order of the voltage stability margin, and calculates the severity of each assumed change scenario. Saved in the ranking calculation result data D6, select one assumed change scenario, and if the voltage stability margin of the selected assumed change scenario is less than the threshold, select a severe scenario, and each assumed change scenario severity ranking calculation result data Severe scenario information is added to D6 and stored.
- step S21 the voltage stability margin calculation result data D5 and threshold value data D8 calculated in step S5 are read and read into the memory 14.
- step S22 the voltage stability margins of each assumed change scenario read out to the memory 14 are sorted in ascending order and stored in each assumed change scenario severity ranking calculation result data D6.
- step S23 one assumed change scenario is selected from each assumed change scenario.
- step S24 it is determined whether the voltage stability margin of the assumed change scenario selected in step S23 is less than the severity threshold (see FIG.
- step S5 if the voltage stability margin of the selected assumed change scenario is less than the severity threshold, the assumed assumed change scenario is selected as the severe scenario, and the process proceeds to step S25. On the other hand, if the voltage stability margin of the selected assumed change scenario is equal to or greater than the severity threshold, the process returns to step S23 to select one next assumed change scenario.
- step S25 severe scenario information is added to each assumed change scenario severe degree ranking calculation result data D6 and stored.
- step S26 it is determined whether all assumed change scenarios have been selected. If all assumed change scenarios have not been selected, the process returns to step S23, and if all assumed change scenarios have been selected, the process ends. Become.
- FIGS. 16 and 17 are examples illustrating an image of the severe scenario severity ranking calculation unit 33.
- FIG. 16 shows a scenario number on the horizontal axis and a voltage stability margin on the vertical axis. It can be seen that ranking (ranking) can be performed by sorting (rearranging) each assumed change scenario in ascending order according to the magnitude of the voltage stability margin obtained in step S5. Also, in FIG. 17, the horizontal axis indicates the scenario number and the vertical axis indicates the voltage stability margin as in FIG. However, renewable energy changes are taken into account for each assumed change scenario.
- ranking can be performed by sorting (rearranging) each assumed change scenario in ascending order according to the magnitude of the voltage stability margin obtained in step S5.
- ranking is performed in consideration of the change in renewable energy as described above, if the relationship between each assumed change scenario becomes difficult to understand, the ranking is performed without considering the change in renewable energy as shown in FIG.
- the assumed change scenario determined as having no voltage stability margin in which the PV curve or VQ curve cannot be written in the first place is ranked using another method in step S6.
- step S7 a vulnerable bus calculation is performed using the severe scenario severity ranking calculation result D6 and threshold data D8, and the vulnerable bus calculation result is stored.
- FIG. 12 and FIG. 14 are examples of flowcharts for explaining the processing of the vulnerable bus calculation unit 34.
- FIG. 12 is a flow for determining the vulnerable bus using the PV curve of FIG. 13 through steps S31 to S38, and the voltage stability calculation result data D4 calculated in step S4 for each severe scenario calculated in step S6.
- threshold data D8 select one severe scenario, select one load bus, determine whether ⁇ V 0 of the PV curve of the selected load bus is less than or equal to the vulnerable bus threshold ⁇ V 0 , and PV curve If ⁇ V 0 is not less than the vulnerable bus threshold ⁇ V 0 , the load bus is selected again.
- the PV curve of the selected load bus is It is determined whether or not ⁇ V / ⁇ P in the initial P lower solution is equal to or less than the vulnerable bus threshold ⁇ V / ⁇ P, and ⁇ V / ⁇ P in the initial P lower solution of the PV curve of the selected load bus is the vulnerable bus threshold ⁇ V / ⁇ P or less Otherwise, the load bus is selected again, and if ⁇ V / ⁇ P in the initial P lowering solution of the PV curve of the selected load bus is equal to or less than the vulnerable bus threshold ⁇ V / ⁇ P, it is determined as the vulnerable bus, Save to the vulnerable bus calculation result data D7 and select the load bus again.
- step S31 the voltage stability calculation result data D4 and threshold data D8 calculated in step S4 for each severe scenario calculated in step S6 are read and read into the memory.
- step S32 it is determined whether all severe scenarios have been selected. If all severe scenarios have not been selected, the process proceeds to step S33, and if all severe scenarios have been selected, the process proceeds to step S39. In step S33, one severe scenario is selected.
- step S34 it is determined whether all load buses have been selected. If all load buses have not been selected, the process proceeds to step S35, and if all load buses have been selected, the process returns to step S32. In step S35, one load bus is selected.
- step S36 it is determined whether or not ⁇ V 0 of the PV curve of the selected load bus shown in FIG. 13 is equal to or less than the vulnerable bus threshold ⁇ V 0 . If ⁇ V 0 of the PV curve is not equal to or less than the weak bus threshold ⁇ V 0 , the process returns to step S36. If ⁇ V 0 of the PV curve is less than or equal to the weak bus threshold ⁇ V 0 , the process proceeds to step S37. In step S37, it is determined whether or not ⁇ V / ⁇ P in the lower initial P solution of the PV curve of the selected load bus shown in FIG. 13 is equal to or less than the vulnerable bus threshold ⁇ V / ⁇ P.
- step S34 if ⁇ V / ⁇ P in the lower initial P solution of the PV curve of the selected load bus is not equal to or less than the vulnerable bus threshold ⁇ V / ⁇ P, the process returns to step S34.
- the load bus is selected again, and if ⁇ V / ⁇ P in the lower initial P solution of the PV curve of the selected load bus is equal to or less than the weak bus threshold ⁇ V / ⁇ P, the process proceeds to step S38.
- step S38 the load bus selected in step S35 and determined as Yes in step S36 and step S37 is determined as a vulnerable bus and stored in the vulnerable bus calculation result data D7. Thereafter, the process returns to step S34.
- step S39 the bus having the largest ⁇ V 0 among the vulnerable bus candidates is determined and stored as the vulnerable load bus, and the flow ends.
- FIG. 18 is an example illustrating an image of the vulnerable bus calculation unit 34.
- FIG. 18 is an example in which a PV curve is calculated with the total demand P of active power on the horizontal axis and the voltage V i of the node i on the vertical axis.
- the PV curves of nodes 1 and 2 are shown, and the operating points are (P 0 , V 10 ) and (P 0 , V 20 ), respectively, and lower solutions that are paired with the respective higher solutions V U.
- V L becomes (P 0 , V ′ 10 ) and (P 0 , V ′ 20 ).
- the limit of voltage stability, active power limit is same position P C.
- This value is compared with the threshold value ⁇ V / ⁇ P.
- FIG. 18 since an image of a fragile generatrix calculation when the P-V curve taken voltage V i at the node i to the total demand P, took a voltage V i of the node i for increased demand of each node In the case of a PV curve, the way of thinking may be different.
- FIG. 14 is a flow for determining a vulnerable bus using the VQ curve of FIG. 15 through steps S31 ′ to S38 ′, which is largely the same as the step of FIG. 12, but each severe condition calculated in step S6.
- the voltage stability calculation result data D4 and threshold data D8 calculated in step S4 for the scenario are read, one severe scenario is selected, one load bus is selected, and ⁇ Q of the VQ curve of the selected load bus is the vulnerable bus threshold ⁇ Q It is determined whether or not ⁇ Q of the VQ curve is not less than or equal to the vulnerable bus threshold ⁇ Q, the load bus is selected again, and if ⁇ Q of the VQ curve is less than or equal to the vulnerable bus threshold ⁇ Q, The vulnerable bus is determined, stored in the vulnerable bus calculation result data D7, and the load bus is selected again. When all load buses are selected, the severe scenario is selected, and the flow for obtaining the vulnerable bus is repeated with the same flow. When all the severe scenarios are selected, ⁇ Q is the smallest among the vulnerable bus candidates. The bus is confirmed as a vulnerable load bus and saved, and the flow ends.
- step S31 the voltage stability calculation result data D4 and threshold value data D8 calculated in step S4 for each severe scenario calculated in step S6 are read and read into the memory 14. .
- step S32 it is determined whether all severe scenarios have been selected. If all severe scenarios have not been selected, the process proceeds to step S33. If all severe scenarios have been selected, the process proceeds to step S39 ′. . In step S33, one severe scenario is selected.
- step S34 it is determined whether all load buses have been selected. If all load buses have not been selected, the process proceeds to step S35, and if all load buses have been selected, the process returns to step S32. In step S35, one load bus is selected.
- step S36 ' it is determined whether or not ⁇ Q of the VQ curve of the selected load bus shown in FIG. 15 is equal to or less than the vulnerable bus threshold ⁇ Q.
- the process returns to step S34.
- ⁇ Q of the VQ curve is less than or equal to the weak bus threshold ⁇ Q
- the process proceeds to step S38.
- step S38 the load bus selected in step S35 and determined as Yes in step S36 'is determined as a vulnerable bus and stored in the vulnerable bus calculation result data D7. Thereafter, the process returns to step S34.
- step S39 ' the bus with the smallest ⁇ Q among the vulnerable bus candidates is determined and stored as the vulnerable load bus, and the flow ends.
- FIG. 19 is an example illustrating an image of the vulnerable bus calculation unit 34.
- FIG. 18 is an example of calculating a VQ curve with the horizontal axis representing the voltage V i of the node i and the vertical axis representing the total active power demand P.
- the VQ curves of nodes 1 and 2 are shown, and the operating points are (V 10 , Q 10 ) and (V 20 , Q 20 ), respectively.
- the reactive power limit which is the limit of the voltage stability, is the place where Q C is Q 1C and Q 2C .
- a voltage lower than the reactive power limit becomes unstable.
- V 1C or lower becomes unstable
- V 2C or lower becomes unstable.
- FIG. 19 since an image of a fragile generatrix calculation when the V-Q curve took the voltage V i of the node i to the total amount of reactive power Q, the voltage V i of the node i for reactive power increase of each node In the case of a VQ curve with a difference, the way of thinking may be different.
- the position of the reactive power limit with respect to the increase in reactive power at each node may be different. Therefore, a load bus having a small difference between the operating point and the reactive power limit and satisfying the flow of FIG. 14 can be selected as the weak bus.
- the determination method and evaluation method of the said weak bus of FIG.12 and FIG.14 and FIG.18 and FIG.19 show an example, in addition, for example, WECC, “Voltage Stability Criteria, Undervoltage Load Shedding Strategy, and Reactive Power Reserve Monitoring Methodology ”, Final Report, 1998, pp.33-58, and Power System Stable Operation Technology Technical Committee:“ Power System Stable Operation Technology ”, Electric Cooperative Research, Vol. 47, No. 1 1991, pp. 24-34, and the like.
- the vulnerable bus can also be referred to as a limit bus, and is a bus that causes a limit in voltage stability. Since the voltage of the fragile bus decreases, the system voltage and reactive power supply are insufficient, leading to voltage collapse.
- the number of vulnerable buses is not limited to one, and the vulnerable buses can be moved by bringing them closer to the actual system in consideration of constraints on voltage and reactive power, such as the power factor constraint of the generator described later in Example 2.
- the PV curve or the VQ curve cannot be written in step S4 in the first place, it is determined that there is no voltage stability margin in step S5, and it is ranked using the other method in step S6 and selected as a severe scenario.
- the buses ranked among them the PV curve and the VQ curve cannot be written in the first place, and thus the vulnerable bus calculation cannot be used.
- the vulnerable bus is unknown, but an alarm indicating that it is a severe scenario is displayed to notify that it is a severe scenario, and a process for writing a PV curve or a VQ curve, for example, system It is also conceivable to use the above-mentioned vulnerable bus calculation after reducing the load on the network. In this case, the process for writing the PV curve and the VQ curve is performed simultaneously on a severe scenario where the PV curve and the VQ curve cannot be written at all, so that comparison can be made in the scenario. To do.
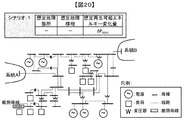
- FIG. 20 is an example for explaining an image of the vulnerable bus calculation unit 34.
- FIG. 20 by displaying the position of the vulnerable bus in the system diagram, there is an advantage that the operator can easily grasp the vulnerable bus with respect to the voltage stability and can easily consider the countermeasure. Furthermore, by displaying the vulnerable buses of a plurality of severe scenarios in an overlapping manner, there is also an advantage that it is easy to grasp where the tendency is likely to become unstable. Moreover, visibility can be improved regarding the voltage stability of an object system
- step S ⁇ b> 8 using the vulnerable bus calculation result D ⁇ b> 7, the monitoring location is changed to a location where there are many vulnerable buses or vulnerable buses.
- a plurality of monitoring locations may be displayed, or the most vulnerable busbar may be displayed.
- Various calculation results and data stored in the memory during the calculation may be sequentially displayed on the screen of the monitoring control device 210. Thereby, the operator can easily grasp the operation status of the voltage stability monitoring apparatus 10.
- the monitoring content occurrence
- the screen display of the situation from reception of various data to transmission of various calculation results is repeated until the monitoring location is changed.
- step S2 Thereafter, the process may return to the data reception step of step S2, or the input data may be corrected by returning to the data input process of step S1.
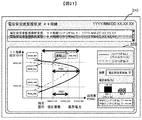
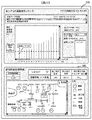
- FIG. 21 is a diagram illustrating an example of a screen that displays a voltage stability calculation result and a voltage stability margin calculation result as the voltage stability monitoring status.
- the monitoring status of the severe scenario and the current voltage stability is shown on the screen of the monitoring control device 210 via the voltage stability monitoring device 10 or the communication network 300, so that the voltage stability of the power system 100 can be seen at a glance. There is an effect that can be seen.
- the voltage value and the voltage stability margin of each scenario are displayed, so that the user can easily see the data. Further, by displaying the voltage margin, the operator can grasp the margin at a glance.
- the vulnerable bus of each scenario is displayed, but it is also possible to confirm the PV curve of another node.
- FIG. 22 is a diagram illustrating an example of a screen displaying each scenario severity ranking result and vulnerable bus system information.
- each scenario severity ranking result and vulnerable bus system information which are calculation results, are displayed on the screen of the monitoring control apparatus 210 via the voltage stability monitoring apparatus 10 and the communication network 300, thereby There is an effect that you can see at a glance the situation of a severe scenario where the voltage stability deteriorates.
- the voltage stability margin of each scenario is displayed, and a curve relating to the voltage stability is displayed on a separate screen, so that the user can easily see the data.
- the operator can grasp the severe scenario at a glance.
- the vulnerable bus at that time is displayed on the screen, and the contents can be viewed.
- the position of one or a plurality of vulnerable buses can be easily recognized.
- it has a function to select a past history and change the display.
- the vulnerable bus of the current severe scenario is usually displayed, but it is also possible to confirm the vulnerable bus of another assumed change scenario.
- by clicking on the vulnerable bus it is possible to display a PV curve or a VQ curve of the bus.
- the vulnerable bus calculation of the first embodiment not only the vulnerable bus calculation but also whether the vulnerable bus is an accurate vulnerable bus based on the constraint data D10, and the voltage stabilization with the constraint data added.
- An example of a voltage stability monitoring device capable of performing accurate weak bus calculation by performing degree calculation will be described. Note that descriptions overlapping with the contents described in FIGS. 1 to 22 are omitted.
- FIG. 23 is an example of an overall configuration diagram of the voltage stability monitoring apparatus 10 in the second embodiment. In the example of the entire configuration diagram of the voltage stability monitoring apparatus 10 in the first embodiment shown in FIG. It has been added. In the voltage stability monitoring device 10 of FIG. 23, the description of the components having the same functions as those already described with reference to FIG. 1 is omitted.
- the input data of the voltage stability monitoring device 10 includes system data D1, system equipment data D2, assumed change scenario data D3, threshold data D8, and constraint data D10.
- FIG. 24 shows an example of the constraint data D10.
- the constraint data D10 is, for example, an active power constraint, a reactive power constraint, a power factor constraint, or the like of each bus (generator constraints have already been considered in step S4).
- FIG. 25 shows an example of a flowchart showing the entire processing of the voltage stability monitoring apparatus including the flow of weak bus calculation including the constraint data in consideration of the constraint data D10.
- Step S1 and Step S41, Step S2 and Step S42, Step S3 and Step S43, Step S4 and Step S44, Step S5 and Step S45, Step S6 and Step S46, Step S7 and Step S47, Step S8 and Step S51 Each has the same content.
- step S48 it is confirmed whether or not all the vulnerable buses calculated in step S47 satisfy the constraint data D10. If the constraint data D10 is not satisfied, the process proceeds to step S49. If satisfied, the process proceeds to step S51.
- step S49 the most vulnerable bus that is the most vulnerable bus selected in step S47 is selected, and the process proceeds to step S50.
- step S50 the most vulnerable bus selected in step S49 is constrained, the data is rewritten, and the process returns to step S44. Thereby, there is an effect that the voltage stability of the power system closer to reality can be examined. Presenting the difference between the first embodiment and the second embodiment to the operator may help to consider why the vulnerable bus is calculated.
- FIG. 26 is an example of an overall configuration diagram of a voltage stability monitoring device according to the third embodiment, in which threshold data, a data transmission unit, and a monitoring control device are added to FIG. 1 of the first embodiment.
- the voltage stability monitoring calculation result data D41 calculated by the voltage stability monitoring device 10 is transmitted to the monitoring control device 210, the central power supply command station, and the EMS via the communication network 300 using the data transmission unit 37. It has.
- the supervisory controller 210, the central power supply command center, and the EMS have an advantage that it is easy to make a control plan for maintaining the voltage stability based on the information on the voltage stability.
Abstract
The objective of the present invention is to accurately monitor the deterioration of present or future voltage stability by causing a bus line over which present or future voltage stability deterioration occurs to be dynamically modified in a calculation for monitoring the stability of an electrical grid. Thus, the present invention is a voltage stability-monitoring device for monitoring the voltage stability of an electrical grid, wherein: a plurality of imagined change scenarios representing scenarios of change that are imagined are created on the basis of the change in power flow status and/or the grid configuration of the electrical grid; the voltage stability is calculated using the imagined change scenarios; a voltage stability allowance representing the degree of allowance for the voltage stability is calculated on the basis of the voltage stability; imagined change scenarios that have a high-severity level of voltage stability for their individual imagined change scenarios are selected on the basis of the voltage stability allowance; and a calculation is made, on the basis of the selected imagined change scenario, as to whether any bus lines of the electrical grid are vulnerable bus lines that will precipitate a decline in voltage stability, whereby monitoring targets for voltage stability are modified on the basis of information on the vulnerable bus lines.
Description
本発明は、電力系統の電圧安定度(電圧安定性ともいう)を監視する電圧安定度監視装置に関する。
The present invention relates to a voltage stability monitoring device that monitors voltage stability (also referred to as voltage stability) of a power system.
将来、電力系統には、再生可能エネルギー(太陽光発電や風力発電など)をはじめとする天候によって出力が変動する電源(出力変動型電源)が大量導入される予定である。また、近年、世界各国で電力自由化が進んだ結果、電力系統の設備投資が抑制され、既存の送電線に流れる電力潮流が増加している(重潮流化している)。重潮流状態で潮流変動(潮流変化)が大きくなると、電力系統の電圧安定度が悪化する可能性がある。さらに、系統に落雷などが原因で故障が生じると、さらに電力系統の電圧安定度は悪化する恐れがある。このような電圧安定度の悪化現象を正確に監視できる電圧安定度監視装置が必要である。
In the future, a large number of power sources (output fluctuation type power sources) whose output fluctuates depending on the weather including renewable energy (solar power generation, wind power generation, etc.) will be introduced into the power system. In recent years, as a result of the progress of electricity liberalization around the world, capital investment in the power system has been restrained, and the power flow flowing through existing transmission lines has increased (heavy flow). If the tidal current fluctuation (tidal current change) increases in a heavy tidal current state, the voltage stability of the power system may deteriorate. Furthermore, if a failure occurs in the system due to lightning or the like, the voltage stability of the power system may further deteriorate. There is a need for a voltage stability monitoring device that can accurately monitor such a phenomenon of voltage stability deterioration.
本技術分野の背景技術として、例えば、鈴木守、岸田幸雄:「電圧安定性オンライン監視システム」、電学論B、111巻3号、平成3年(非特許文献1)がある。この解説論文には、「オンライン定周期監視機能」や「ピーク負荷時の安定度判定機能」について記載されている(本文248頁~251頁参照)。
As background technology in this technical field, for example, Mamoru Suzuki and Yukio Kishida: “Voltage Stability Online Monitoring System”, Denki Theory B, Vol. 111, No. 3, 1991 (Non-patent Document 1). This commentary paper describes the “online fixed cycle monitoring function” and the “stability determination function at peak load” (see pages 248 to 251 of the text).
他に、特開2011-115024号公報(特許文献1)がある。この公報には、所定の目的関数が最小化されるように最適潮流計算を行った上でP-V曲線を定め、また電力系統に属する全ての負荷母線の状態変数を所定の規定値内に収めることで、電力系統全体で見た場合に実際の電力系統全体の動きに合致させる電圧無効電力監視システムが記載されている
In addition, there exists Unexamined-Japanese-Patent No. 2011-115024 (patent document 1). In this publication, a PV curve is defined after performing an optimal power flow calculation so that a predetermined objective function is minimized, and state variables of all load buses belonging to the power system are within a predetermined specified value. A voltage reactive power monitoring system that matches the movement of the actual entire power system when viewed in the entire power system is described.
また他に、特開2005-287128号公報(特許文献2)がある。この公報には、PV曲線を高精度かつ高速に描き、連続的な負荷に対してPV曲線をトレースしていくので、変圧器タップ等の制御にも正確に追従しながら系統電圧の安定度監視を行うことができる電力系統安定度監視システムが記載されている。
In addition, there is JP-A-2005-287128 (Patent Document 2). In this publication, the PV curve is drawn with high accuracy and high speed, and the PV curve is traced with respect to the continuous load. Therefore, the stability of the system voltage is monitored while accurately following the control of the transformer tap and the like. A power system stability monitoring system capable of performing the above is described.
上記非特許文献や特許文献に記載の従来の電圧安定度監視装置は、潮流変化の想定と故障(事故)のいずれか一方もしくは両方を想定することで、電圧安定度の悪化の可能性を監視可能である。
The conventional voltage stability monitoring device described in the above-mentioned non-patent documents and patent documents monitors the possibility of deterioration of voltage stability by assuming either or both of a tidal current change assumption and a failure (accident). Is possible.
しかし、従来の電圧安定度監視装置の監視箇所は、電力の送受電において重要な変電所母線や、運用者の経験によって電圧安定度が悪化するとわかっている各母線を対象としているため、これまでの系統の設備計画とは異なり予想できない系統の箇所に導入される再生可能エネルギーの天候に起因する急峻な潮流変動などが将来発生すると、前記従来の電圧安定度監視装置の監視箇所もしくは、前記従来の電圧安定度監視装置の監視箇所でない母線の電圧安定度が悪化する恐れがある。その結果、現在の電圧安定度の悪化や将来の電圧安定度の悪化の一つもしくは両方を正確に監視できず、現在の電圧安定度の悪化や将来の電圧安定度の悪化の一つもしくは両方を引き起こすという課題がある。
However, the monitoring points of conventional voltage stability monitoring devices are targeted at substation buses that are important for power transmission and reception, and each bus that has been known to deteriorate in voltage stability due to operator experience. In the future, when a steep current fluctuation due to the weather of renewable energy introduced into a part of the system that cannot be predicted unlike the facility plan of the system of the future occurs, the monitoring part of the conventional voltage stability monitoring device or the conventional There is a risk that the voltage stability of the bus that is not the monitoring part of the voltage stability monitoring device will deteriorate. As a result, it is impossible to accurately monitor one or both of the current voltage stability deterioration and the future voltage stability deterioration, and one or both of the current voltage stability deterioration and the future voltage stability deterioration. There is a problem of causing.
上記課題を解決するために、本発明は、電力系統の電圧安定度を監視する電圧安定度監視装置において、前記電力系統の系統構成又は潮流状態の変化の少なくとも一方に基づき想定される変化のシナリオを示す想定変化シナリオを複数作成する想定変化シナリオ計算部と、前記想定変化シナリオを用いて前記電圧安定度を計算する電圧安定度計算部と、前記電圧安定度に基づいて前記電圧安定度の余裕度を示す電圧安定度余裕を計算する電圧安定度余裕計算部と、前記電圧安定度余裕に基づいて前記想定変化シナリオごとの前記電圧安定度の過酷度が高い想定変化シナリオを選択する各シナリオ過酷度ランキング計算部と、前記選択された想定変化シナリオに基づき前記電力系統のいずれの母線が電圧安定度を低下させる脆弱母線であるかを計算する脆弱母線計算部と、前記脆弱母線の情報に基づいて前記電圧安定度の監視対象を変更する監視箇所変更部と、を備えることを特徴とする。
In order to solve the above-described problems, the present invention provides a voltage stability monitoring apparatus for monitoring the voltage stability of a power system, and a scenario of a change assumed based on at least one of a change in a system configuration or a power flow state of the power system. An assumed change scenario calculation unit that creates a plurality of assumed change scenarios indicating the voltage, a voltage stability calculation unit that calculates the voltage stability using the assumed change scenario, and a margin of the voltage stability based on the voltage stability A voltage stability margin calculation unit for calculating a voltage stability margin indicating a degree, and each scenario severeness that selects an assumed change scenario having a high severity of the voltage stability for each of the assumed change scenarios based on the voltage stability margin Which bus of the power system is a vulnerable bus that reduces the voltage stability based on the degree ranking calculator and the selected assumed change scenario And calculating fragile bus calculating unit, characterized in that it comprises a monitoring point changing unit for changing the monitoring target of the voltage stability based on the information of the weak bus.
本発明によれば、再生可能エネルギーの出力変化を考慮した想定変化シナリオを自動で計算するため運用者の労力が低減され、想定変化シナリオに対する電圧安定度監視計算を行うことで、現在又は将来の電圧安定度の悪化が生じる母線を動的に変更し、現在又は将来の電圧安定度の悪化を正確に監視することができる。
According to the present invention, the operator's labor is reduced by automatically calculating the assumed change scenario considering the output change of the renewable energy, and by performing voltage stability monitoring calculation for the assumed change scenario, the present or future It is possible to dynamically change the bus at which the voltage stability deteriorates, and to accurately monitor the current or future voltage stability deterioration.
以下、本発明の実施に好適な実施例について説明する。尚、下記はあくまでも実施の例に過ぎず、下記具体的内容に発明自体が限定されることを意図する趣旨ではない。
Hereinafter, preferred embodiments for implementing the present invention will be described. It should be noted that the following is merely an example of implementation and is not intended to limit the invention itself to the following specific contents.
本実施例では、系統データD1と系統設備データD2から想定変化シナリオを計算し、算出した想定変化シナリオデータD3と系統データD1と系統設備データD2と閾値データD8を用いて、電圧安定度計算と電圧安定度余裕計算を行った結果をもとに、各シナリオ過酷度ランキング計算と脆弱母線計算を行い、監視箇所変更指令データD9を出し、監視箇所表示を行う電圧安定度監視装置10の例について、データベースとデータで内容を示す入出力と、計算部で内容を示す処理、からなる全体構成の例を図1で説明し、次に電力系統100と監視制御装置210と電圧安定度監視装置10と計測装置44と電源110と負荷150と母線と変圧器と送電線とのハード構成の例を図2で説明する。
In this embodiment, an assumed change scenario is calculated from the system data D1 and the system facility data D2, and the voltage stability calculation is performed using the calculated assumed change scenario data D3, the system data D1, the system facility data D2, and the threshold data D8. Based on the results of the voltage stability margin calculation, an example of the voltage stability monitoring device 10 that performs each scenario severity ranking calculation and vulnerable bus calculation, outputs monitoring location change command data D9, and displays the monitoring location display FIG. 1 illustrates an example of the entire configuration including input / output indicating contents in a database and data and processing indicating contents in a calculation unit. Next, a power system 100, a monitoring control device 210, and a voltage stability monitoring device 10 are described. An example of a hardware configuration of the measuring device 44, the power source 110, the load 150, the bus, the transformer, and the power transmission line will be described with reference to FIG.
図1は、本実施例の電圧安定度監視装置10の全体構成図の例であり、系統データD1と系統設備データD2と想定変化シナリオ計算部30と想定変化シナリオデータD3と閾値データD8と、電圧安定度計算部31と電圧安定度余裕計算部32と各シナリオ過酷度ランキング計算部33と脆弱母線計算部34からなる電圧安定度監視計算部40と、電圧安定度計算結果データD4と電圧安定度余裕計算結果データD5と各シナリオ過酷度ランキング計算結果データD6と脆弱母線計算結果データD7からなる電圧安定度監視計算結果データD41と、監視箇所変更部35と監視箇所変更指令データD9と監視箇所表示部36、からなる電圧安定度監視装置10の構成を示した図である。
FIG. 1 is an example of an overall configuration diagram of the voltage stability monitoring apparatus 10 of the present embodiment, and system data D1, system equipment data D2, assumed change scenario calculation unit 30, assumed change scenario data D3, threshold data D8, The voltage stability calculation unit 31, the voltage stability margin calculation unit 32, each scenario severity ranking calculation unit 33, the voltage stability monitoring calculation unit 40 including the vulnerable bus calculation unit 34, the voltage stability calculation result data D4, and the voltage stability Degree margin calculation result data D5, each scenario severity ranking calculation result data D6 and vulnerable bus calculation result data D7, voltage stability monitoring calculation result data D41, monitoring location change unit 35, monitoring location change command data D9 and monitoring location 2 is a diagram illustrating a configuration of a voltage stability monitoring device 10 including a display unit 36. FIG.
電圧安定度監視装置10の入力データは、系統データD1と系統設備データD2と想定変化シナリオデータD3と閾値データD8からなる。電圧安定度監視装置10の想定変化シナリオ計算部30では、系統データD1と系統設備データD2を用いて、想定変化シナリオデータD3を計算する。また、電圧安定度監視装置10の電圧安定度計算部31では、系統データD1と系統設備データD2と想定変化シナリオデータD3を用いて、電圧安定度計算を行い、電圧安定度計算結果データD4を出力する。また、電圧安定度監視装置10の電圧安定度余裕計算部32では、電圧安定度計算結果データD4を用いて、電圧安定度余裕計算を行い、電圧安定度余裕計算結果データD5を出力する。また、電圧安定度監視装置10の各シナリオ過酷度ランキング計算部33では、電圧安定度計算結果データD4と電圧安定度余裕計算結果データD5と閾値データD8を用いて、各シナリオ過酷度ランキング計算を行い、各シナリオ過酷度ランキング計算結果データD6を出力する。また、電圧安定度監視装置10の脆弱母線計算部34では、電圧安定度計算結果データD4と電圧安定度余裕計算結果データD5と各シナリオ過酷度ランキング計算結果データD6と閾値データD8を用いて、脆弱母線計算を行い、脆弱母線計算結果データD7を出力する。また、電圧安定度監視装置10の監視箇所変更部35では、脆弱母線計算結果データD7を用いて、監視箇所を変更するための監視箇所変更指令データD9を監視箇所表示部36に送信する。また、電圧安定度監視装置10の監視箇所表示36では、監視箇所指令データD9を用いて、監視箇所を変更表示し、電圧安定度監視計算結果データD41を用いて、監視箇所の情報を表示する。
The input data of the voltage stability monitoring device 10 includes system data D1, system equipment data D2, assumed change scenario data D3, and threshold data D8. The assumed change scenario calculation unit 30 of the voltage stability monitoring apparatus 10 calculates assumed change scenario data D3 using the system data D1 and the system facility data D2. Further, the voltage stability calculation unit 31 of the voltage stability monitoring apparatus 10 performs voltage stability calculation using the system data D1, the system facility data D2, and the assumed change scenario data D3, and the voltage stability calculation result data D4 is obtained. Output. In addition, the voltage stability margin calculation unit 32 of the voltage stability monitoring apparatus 10 performs voltage stability margin calculation using the voltage stability calculation result data D4, and outputs voltage stability margin calculation result data D5. Further, each scenario severity ranking calculation unit 33 of the voltage stability monitoring apparatus 10 performs each scenario severity ranking calculation using the voltage stability calculation result data D4, the voltage stability margin calculation result data D5, and the threshold data D8. The scenario severity ranking calculation result data D6 is output. Further, the vulnerable bus calculation unit 34 of the voltage stability monitoring device 10 uses the voltage stability calculation result data D4, the voltage stability margin calculation result data D5, the scenario severity ranking calculation result data D6, and the threshold data D8. The vulnerable bus calculation is performed, and the vulnerable bus calculation result data D7 is output. In addition, the monitoring location change unit 35 of the voltage stability monitoring apparatus 10 transmits the monitoring location change command data D9 for changing the monitoring location to the monitoring location display 36 using the vulnerable bus calculation result data D7. Moreover, in the monitoring location display 36 of the voltage stability monitoring apparatus 10, the monitoring location is changed and displayed using the monitoring location command data D9, and the monitoring location information is displayed using the voltage stability monitoring calculation result data D41. .
図2は、電圧安定度監視装置10のハード構成と電力系統100の全体構成図の例であり、電力系統100と監視制御装置210と電圧安定度監視装置10と計測装置44と電源110と負荷150と母線と変圧器と送電線とのハード構成の例を示した図である。電力系統100は、ブランチ(線路)140およびノード(母線)120を介してそれぞれ接続する、発電機110と変圧器130と計測装置44と負荷150と図には書いていないがその他計測装置や制御可能な装置(バッテリー、充放電可能な二次電池、EVの蓄電池、フライホイール等)のいずれか又は複数で構成される。
FIG. 2 is an example of a hardware configuration of the voltage stability monitoring device 10 and an overall configuration diagram of the power system 100. The power system 100, the monitoring control device 210, the voltage stability monitoring device 10, the measuring device 44, the power source 110, and the load It is the figure which showed the example of the hardware constitutions with 150, a bus-line, a transformer, and a power transmission line. The electric power system 100 is connected to the generator 110, the transformer 130, the measuring device 44, and the load 150, which are connected to each other via a branch (track) 140 and a node (bus) 120, respectively. It is composed of any one or a plurality of possible devices (battery, rechargeable secondary battery, EV storage battery, flywheel, etc.).
ここで、前記電源110の例は、火力発電機や水力発電機や原子力発電機などの大型電源のほかに、太陽光発電や風力発電といった分散型電源を含む。
Here, examples of the power source 110 include a distributed power source such as a solar power generator and a wind power generator in addition to a large power source such as a thermal power generator, a hydroelectric power generator, and a nuclear power generator.
ここで、計測装置44の例は、ノード電圧V、ブランチ電流I、力率Φ、有効電力P、無効電力Q、のいずれか一つまたは複数を計測する装置(VTやPTやCT)であり、データ計測箇所識別IDや計測装置の内臓タイムスタンプを含んでデータを送信する機能を備える(テレメータ(TM:Telemeter)などである)。なお、GPSを利用した絶対時刻付きの電力情報(電圧のフェーザ情報)を計測する装置や位相計測装置(PMU:Phasor Measurement Units)や、他の計測機器でもよい。前記計測装置44は、電力系統100内にあるように書いたが、発電機110と変圧器130と計測装置44と負荷150に接続する母線や送電線などに設置されてもよい。
Here, an example of the measuring device 44 is a device (VT, PT, or CT) that measures one or more of the node voltage V, the branch current I, the power factor Φ, the active power P, and the reactive power Q. And a function of transmitting data including a data measurement location identification ID and a built-in time stamp of the measurement device (such as a telemeter (TM)). Note that a device that measures power information (voltage phasor information) with absolute time using GPS, a phase measurement device (PMU: Phasor Measurement Units), or another measurement device may be used. Although the measurement device 44 is written to be in the power system 100, it may be installed on a bus or power transmission line connected to the generator 110, the transformer 130, the measurement device 44, and the load 150.
ここで、計測データD1は、計測装置44にて計測された各前記データであり、通信ネットワーク300を介して系統計測データベース21に受信する。ただし、計測装置44から直接前記系統データを受信する代わりに、監視制御装置210に一端集約されてから、通信ネットワーク300を介して系統計測データベース21に受信してもよいし、計測装置44と監視制御装置210の両方から通信ネットワーク300を介して系統計測データベース21に受信してもよい。なお、計測データD1は、データを識別するための固有番号と、タイムスタンプとを含んでもよい。
Here, the measurement data D1 is each of the data measured by the measurement device 44, and is received by the system measurement database 21 via the communication network 300. However, instead of receiving the system data directly from the measurement device 44, the system data may be aggregated by the monitoring control device 210 and then received by the system measurement database 21 via the communication network 300, or may be monitored with the measurement device 44. You may receive into the system | strain measurement database 21 via the communication network 300 from both of the control apparatuses 210. FIG. The measurement data D1 may include a unique number for identifying data and a time stamp.
電圧安定度監視装置10の構成について説明する。表示部11、キーボードやマウス等の入力部12、通信部13、コンピュータや計算機サーバ(CPU:Central Processing Unit)14、メモリ15、各種データベース(系統計測データベース21と系統設備データベース22と想定変化シナリオデータベース23と電圧安定度計算結果データベース24と電圧安定度余裕計算結果データベース25と各シナリオ過酷度ランキング計算結果データベース26と脆弱母線計算結果データベース27と閾値データベース28とプログラムデータベース29)がバス線43に接続されている。表示部11は、例えば、ディスプレイ装置として構成される。
The configuration of the voltage stability monitoring device 10 will be described. Display unit 11, input unit 12, such as a keyboard or mouse, communication unit 13, computer or computer server (CPU: Central Processing Unit) 14, memory 15, various databases (system measurement database 21, system facility database 22, and assumed change scenario database 23, a voltage stability calculation result database 24, a voltage stability margin calculation result database 25, each scenario severity ranking calculation result database 26, a vulnerable bus calculation result database 27, a threshold database 28, and a program database 29) are connected to the bus line 43. Has been. The display unit 11 is configured as a display device, for example.
表示部11は、例えば、ディスプレイ装置に代えて、またはディスプレイ装置と共に、プリンタ装置または音声出力装置等を用いる構成でもよい。入力部12は、例えば、キーボードスイッチ、マウス等のポインティング装置、タッチパネル、音声指示装置等の少なくともいずれか一つを備えて構成できる。通信部13、通信ネットワーク300に接続するための回路及び通信プロトコルを備える。CPU14は、プログラムデータベース29から所定のコンピュータプログラムを読み込んで実行する。CPU14は、一つまたは複数の半導体チップとして構成してもよいし、または、計算サーバのようなコンピュータ装置として構成してもよい。メモリ15は、例えば、RAM(Random Access Memory)として構成され、プログラムデータベース29から読み出されたコンピュータプログラムを記憶したり、各処理に必要な計算結果データ及び画像データ等を記憶したりする。メモリ14に格納された画面データは、表示部11に送られて表示される。表示される画面の例は後述する。
The display unit 11 may be configured to use a printer device, an audio output device, or the like instead of the display device or together with the display device. The input unit 12 may be configured to include at least one of a keyboard switch, a pointing device such as a mouse, a touch panel, a voice instruction device, and the like. The communication unit 13 includes a circuit for connecting to the communication network 300 and a communication protocol. The CPU 14 reads a predetermined computer program from the program database 29 and executes it. The CPU 14 may be configured as one or a plurality of semiconductor chips, or may be configured as a computer device such as a calculation server. The memory 15 is configured as a RAM (Random Access Memory), for example, and stores a computer program read from the program database 29, and stores calculation result data and image data necessary for each process. The screen data stored in the memory 14 is sent to the display unit 11 and displayed. An example of the displayed screen will be described later.
ここで、図3を参照して、プログラムデータベース29の記憶内容を説明する。図3は、電圧安定度監視装置のプログラムデータの内容を示す構成図の例である。プログラムデータベース29には、例えば、状態推定計算プログラムP70と想定変化シナリオ計算プログラムP10と電圧安定度計算プログラムP20と電圧安定度余裕計算プログラムP30と各シナリオ過酷度ランキング計算プログラムP40と脆弱母線計算プログラムP50と監視箇所変更プログラムP60が格納されている。
Here, the stored contents of the program database 29 will be described with reference to FIG. FIG. 3 is an example of a configuration diagram showing the contents of the program data of the voltage stability monitoring device. The program database 29 includes, for example, a state estimation calculation program P70, an assumed change scenario calculation program P10, a voltage stability calculation program P20, a voltage stability margin calculation program P30, each scenario severity ranking calculation program P40, and a vulnerable bus calculation program P50. And a monitoring location change program P60 are stored.
図2に戻り、CPU14は、プログラムデータベース29からメモリ14に読み出された計算プログラム(状態推定計算プログラムP70と想定変化シナリオ計算プログラムP10と電圧安定度計算プログラムP20と電圧安定度余裕計算プログラムP30と各シナリオ過酷度ランキング計算プログラムP40と脆弱母線計算プログラムP50と監視箇所変更プログラムP60)を実行して、尤もらしい系統状態の計算、想定変化シナリオの計算、電圧安定度の計算、電圧安定度余裕の計算、過酷シナリオのランキングの計算、過酷シナリオの選択の計算、脆弱母線の計算、監視箇所変更の指示、表示すべき画像データの指示、各種データベース内のデータの検索等を行う。メモリ14は表示用の画像データ、監視データ、監視結果データ等の計算一時データ及び計算結果データを一旦格納するメモリであり、CPU14によって必要な画像データを生成して表示部11(例えば表示ディスプレイ画面)に表示する。なお、電圧安定度監視装置10の表示部11は、各制御プログラムやデータベースの書き換えを行うためだけの簡単な画面だけであったてもよい。
Returning to FIG. 2, the CPU 14 reads the calculation programs (state estimation calculation program P70, assumed change scenario calculation program P10, voltage stability calculation program P20, and voltage stability margin calculation program P30) read from the program database 29 into the memory 14. Each scenario severity ranking calculation program P40, vulnerable bus calculation program P50, and monitoring location change program P60) are executed to calculate plausible system status, assumption change scenario calculation, voltage stability calculation, voltage stability margin Calculation, calculation of ranking of severe scenario, calculation of selection of severe scenario, calculation of vulnerable bus, instruction to change monitoring location, instruction of image data to be displayed, search of data in various databases, etc. The memory 14 temporarily stores calculation temporary data and calculation result data such as display image data, monitoring data, and monitoring result data. The memory 14 generates necessary image data by the CPU 14 and displays the display unit 11 (for example, a display display screen). ). The display unit 11 of the voltage stability monitoring apparatus 10 may be a simple screen only for rewriting each control program and database.
電圧安定度監視装置10には、大きく分けて9つのデータベースが格納される。プログラムデータベース29を除く、系統計測データベース21と系統設備データベース22と想定変化シナリオデータベース23と電圧安定度計算結果データベース24と電圧安定度余裕計算結果データベース25と各シナリオ過酷度ランキング計算結果データベース26と脆弱母線計算結果データベース27と閾値データベース28について説明する。
The voltage stability monitoring device 10 stores roughly nine databases. Except for program database 29, system measurement database 21, system facility database 22, assumed change scenario database 23, voltage stability calculation result database 24, voltage stability margin calculation result database 25, each scenario severity ranking calculation result database 26, and vulnerability The bus calculation result database 27 and the threshold database 28 will be described.
系統計測データベース21には、系統計測データとして、有効電力P、無効電力Q、電圧V、電圧位相角δ、電流I、力率Φなどが含まれる。時刻スタンプ付きデータやPMUデータでもよい。例えば、電力系統100に接続するノード120aや120bにおける電圧および電圧位相角と、電力系統100に接続するノード120aや120bに接続するブランチ140aや140bの線路潮流(P+jQ)と、電力系統100に接続するノード120aや120bに接続する変圧器130aや130bの線路潮流(P+jQ)と、変圧器130aや130bに接続するノード121aや121bの電圧Vおよび電圧位相角δと、ノード121aや121bに接続する負荷150や電源110の有効電力Pや無効電力Qや力率Φと、計測装置44や監視制御装置210などから通信ネットワークを介して計測する電力系統100に接続するその他のノードやブランチや電源や負荷や制御装置などの有効電力Pや無効電力Qや力率Φや電圧Vおよび電圧位相角δなどが記憶されている。なお、電圧位相角δは、PMUやGPSを利用した他の計測機器を利用して計測したものでもよい。なお、計測装置は、VTやPTなどである。VTやPTなどで計測した電流Iと電圧Vと力率Φから線路潮流(P+jQ)を計算することができる。また、状態推定計算プログラムP70の計算結果である、もっともらいしい系統の各ノード、ブランチ、発電機、負荷、制御機器の有効電力P、無効電力Q、電圧V、電圧位相角δ、電流I、力率Φ、を推定計算した結果も、系統計測データとして保存しておく。
The system measurement database 21 includes active power P, reactive power Q, voltage V, voltage phase angle δ, current I, power factor Φ, and the like as system measurement data. Data with time stamp or PMU data may be used. For example, the voltage and voltage phase angle at the nodes 120a and 120b connected to the power system 100, the line flow (P + jQ) of the branches 140a and 140b connected to the nodes 120a and 120b connected to the power system 100, and the power system 100 are connected. The line current (P + jQ) of the transformers 130a and 130b connected to the nodes 120a and 120b, the voltage V and the voltage phase angle δ of the nodes 121a and 121b connected to the transformers 130a and 130b, and the nodes 121a and 121b. The active power P, reactive power Q, power factor Φ of the load 150 and the power supply 110, and other nodes, branches, power supplies, etc. connected to the power system 100 measured from the measuring device 44, the monitoring control device 210, etc. via the communication network Active power P, reactive power Q, power factor Φ, power Etc. V and the voltage phase angle δ is stored. Note that the voltage phase angle δ may be measured using another measuring device using PMU or GPS. The measuring device is VT, PT, or the like. The line power flow (P + jQ) can be calculated from the current I, the voltage V, and the power factor Φ measured by VT or PT. In addition, each node, branch, generator, load, control device active power P, reactive power Q, voltage V, voltage phase angle δ, current I, which is a calculation result of the state estimation calculation program P70, is obtained. The result of estimating and calculating the power factor Φ is also stored as system measurement data.
系統設備データベース22には、系統構成、線路インピーダンス(R+jX)、対地静電容量(アドミタンス:Y)、系統構成と状態推定に必要なデータ(バットデータの閾値など)、発電機データ、その他の潮流計算・状態推定・電圧安定度計算に必要なデータが含まれる。なお、計測値は、監視制御装置や中央給電指令所やEMSから入手してもよいし、系統全体の計測装置から直接入手してもよい。なお、手動で入力する際には、入力部12によって手動で入力し記憶する。なお、入力の際はCPU14によって必要な画像データを生成して表示部11に表示する。入力の際は、補完機能を利用して、大量のデータを設定できるように半手動にしてもよい。
The system facility database 22 includes system configuration, line impedance (R + jX), ground capacitance (admittance: Y), data necessary for system configuration and state estimation (such as threshold of bat data), generator data, and other currents. Data necessary for calculation, state estimation, and voltage stability calculation are included. In addition, a measured value may be obtained from a monitoring control device, a central power supply command station, EMS, or may be obtained directly from a measuring device for the entire system. In addition, when inputting manually, it inputs and memorize | stores manually with the input part 12. FIG. At the time of input, the CPU 14 generates necessary image data and displays it on the display unit 11. At the time of input, it may be semi-manual so that a large amount of data can be set by using a complementary function.
想定変化シナリオデータベース23には、電圧安定度監視装置10の入力部12を用いて記憶された、電力系統において想定される故障ケースとして故障箇所と故障様相と想定再生可能エネルギー変化量などと、電力系統において想定される故障ケースとして故障箇所と故障様相と想定再生可能エネルギー変化量などから想定変化シナリオ計算プログラムP10によって計算された、図4に示すような、電力系統において想定される故障ケースとして故障箇所と故障様相と想定再生可能エネルギー変化量などを組み合わせたリストが含まれる。これ以外の要素としては、故障除去タイミングなどが一覧に含まれる。想定再生可能エネルギー変化量は、太陽光発電や風力発電やメガソーラやウィンドファームの出力変動量や、ウィンドファームの一斉脱落などを含む。故障ケースとしては、系統の運用によっては、過酷な故障ケースのみであってもよい。なお、想定変化シナリオデータD3は入力部12を用いずに事前に設定したり、監視制御装置210で設定した値を通信ネットワーク300および通信部13を介して設定したり、してもよい。これらの設定方法により、柔軟に想定変化シナリオデータD3を設定することができる効果がある。
The assumed change scenario database 23 stores a failure location, a failure aspect, an assumed renewable energy change amount, and the like as a failure case assumed in the power system, stored using the input unit 12 of the voltage stability monitoring device 10, As an assumed failure case in the system, the failure is assumed as a failure case assumed in the electric power system as shown in FIG. It includes a list that combines the location, failure mode, and assumed renewable energy change. Other elements include failure removal timing and the like in the list. The assumed amount of renewable energy change includes the amount of fluctuation in the output of solar power generation, wind power generation, mega solar and wind farms, and the simultaneous loss of wind farms. The failure case may be only a severe failure case depending on the operation of the system. The assumed change scenario data D3 may be set in advance without using the input unit 12, or a value set by the monitoring control device 210 may be set via the communication network 300 and the communication unit 13. By these setting methods, there is an effect that the assumed change scenario data D3 can be set flexibly.
電圧安定度計算結果データベース24には、電圧安定度計算プログラムP20によって計算された、電圧安定度を評価するための連続型潮流計算などの計算結果が記憶されている。例えば、ノード毎の図13に示すP-V曲線や図15に示すV-Q曲線などである。前記連続型潮流計算とは、負荷電力などをある一定の条件で変化させ系統状態を予測する計算(予測子計算)と、対応する母線電圧を潮流計算(修正子計算)で求める、という動作を連続して計算することでP-V曲線やV-Q曲線を描く手法である。前記連続型潮流計算の詳細は後述する。電圧安定度計算は、例えばP-V曲線の場合、総需要に対するノード電圧の変化であってもよいし、総需要を初期需要で割ったものに対するノード電圧の変化であってもよいし、各ノードの需要に対するノード電圧の変化であってもよいし、各ノードの需要を各ノードの初期需要で割ったものに対するノード電圧の変化であってもよい。上記いずれかひとつまたは複数の需要に対するノード電圧の変化を保存する。
In the voltage stability calculation result database 24, calculation results such as continuous power flow calculation for evaluating the voltage stability calculated by the voltage stability calculation program P20 are stored. For example, a PV curve shown in FIG. 13 or a VQ curve shown in FIG. 15 for each node. The continuous power flow calculation is an operation in which the load power is changed under certain conditions to predict the system state (predictor calculation) and the corresponding bus voltage is obtained by power flow calculation (corrector calculation). This is a technique for drawing a PV curve or a VQ curve by calculating continuously. Details of the continuous flow calculation will be described later. For example, in the case of a PV curve, the voltage stability calculation may be a change in the node voltage with respect to the total demand, or a change in the node voltage relative to the total demand divided by the initial demand. It may be a change in node voltage with respect to the demand of the node, or a change in node voltage with respect to the demand of each node divided by the initial demand of each node. The node voltage change for any one or more of the above demands is stored.
電圧安定度余裕計算結果データベース25には、電圧安定度余裕計算プログラムP30によって計算された、電圧安定度計算結果データD4のP-V曲線やV-Q曲線などを用いて、図13や図15のように算出する、P-V曲線の先端から現在の運転点までの需要差分と電圧差分から電圧余裕ΔVおよび有効電力余裕ΔPや、V-Q曲線の先端から現在の運転点までの需要差分から無効電力余裕ΔQがノード毎に記憶されている。電圧安定度余裕も電圧安定度計算と同様に、例えばP-V曲線から前記電圧余裕ΔVおよび前記有効電力余裕ΔPを求める際に用いるP-V曲線は、総需要に対するノード電圧の変化であってもよいし、総需要を初期需要で割ったものに対するノード電圧の変化であってもよいし、各ノードの需要に対するノード電圧の変化であってもよいし、各ノードの需要を各ノードの初期需要で割ったものに対するノード電圧の変化であってもよい。
In the voltage stability margin calculation result database 25, the PV curve or VQ curve of the voltage stability calculation result data D4 calculated by the voltage stability margin calculation program P30 is used. The voltage difference ΔV and active power margin ΔP from the difference in demand from the tip of the PV curve to the current operating point and the voltage difference, and the difference in demand from the tip of the VQ curve to the current operating point are calculated as follows. To reactive power margin ΔQ is stored for each node. Similar to the voltage stability calculation, for example, the PV curve used when obtaining the voltage margin ΔV and the active power margin ΔP from the PV curve is a change in the node voltage with respect to the total demand. It may be a change in node voltage relative to the total demand divided by the initial demand, or a change in node voltage relative to the demand of each node, and the demand of each node may be the initial value of each node. It may be a change in node voltage relative to that divided by demand.
各シナリオ過酷度ランキング計算結果データベース26には、各シナリオ過酷度ランキング計算プログラムP40によって計算された、前記各想定変化シナリオに対応した電圧安定度余裕計算結果データD5を用いて、前記各想定変化シナリオを昇順にソートすることで図16や図17に示すようなランキングを行った結果と、閾値データD8を用いて過酷度閾値以下であるシナリオを過酷シナリオとして選択した結果を、記憶しておく。閾値データD8については、閾値データベース28の説明において後述する。
Each scenario severity ranking calculation result database 26 uses the voltage stability margin calculation result data D5 corresponding to each scenario change scenario calculated by each scenario severity ranking calculation program P40 and uses each scenario change scenario. The results of ranking as shown in FIG. 16 and FIG. 17 by sorting in ascending order and the results of selecting a scenario that is equal to or less than the severity threshold using the threshold data D8 are stored. The threshold data D8 will be described later in the description of the threshold database 28.
脆弱母線計算結果データベース27には、脆弱母線計算プログラムP50によって計算された、電圧安定度上、脆弱な母線の固有識別のためのノード番号、箇所など、が記憶される。脆弱な母線は、例えば、図18や図19に示すような各ノードのΔVUL10とΔVUL20の比較や各ノードのΔQ1とΔQ2の比較などから一定の基準によって計算される。脆弱母線の計算方法や一定の基準については、後述する。記憶される前記箇所とは、例えば、図20に示すような、系統図上の位置のことである。
The vulnerable bus calculation result database 27 stores a node number, a location, and the like for unique identification of a vulnerable bus in terms of voltage stability, calculated by the vulnerable bus calculation program P50. The fragile bus is calculated according to a certain standard, for example, by comparing ΔV UL10 and ΔV UL20 of each node as shown in FIGS. 18 and 19 or comparing ΔQ 1 and ΔQ 2 of each node. The calculation method and certain criteria for the vulnerable bus will be described later. The said location memorize | stored is a position on a systematic diagram as shown, for example in FIG.
閾値データベース28には、図5に示すような、過酷度閾値や脆弱母線閾値が記憶されている。前記過酷度閾値は、過酷シナリオ過酷度ランキング計算において用いる閾値であり、前記過酷度閾値以下であるシナリオを過酷シナリオとして選択するために用いられる。また、前記脆弱母線閾値は、脆弱母線計算において用いる閾値であり、前記脆弱母線閾値以下であるノードを脆弱母線として選択するために用いられる。
The threshold database 28 stores a severity threshold and a vulnerable bus threshold as shown in FIG. The severity threshold is a threshold used in severe scenario severity ranking calculation, and is used to select a scenario that is equal to or less than the severity threshold as a severe scenario. The vulnerable bus threshold is a threshold used in vulnerable bus calculation, and is used to select a node that is equal to or lower than the vulnerable bus threshold as a vulnerable bus.
次に電圧安定度監視装置10の計算処理内容について図6を用いて説明する。図6は、電圧安定度監視装置の処理の全体を示すフローチャートの例である。まず、簡単に流れを説明する。系統設備データD2と想定変化シナリオデータD3と閾値データD8を入力した記憶したあと、系統計測データD1を受信し、状態推定計算を行い、状態推定計算結果を記憶する。次に、系統設備データD2と想定変化シナリオデータD3と前記状態推定結果を用いて想定変化シナリオを計算する(想定変化シナリオデータベース23に格納される)。次に、前記状態推定計算結果(系統計測データベース21に格納される)と前記各想定変化シナリオを用いて、電圧安定度計算を行った後に、電圧安定度余裕計算を行い、電圧安定度計算結果および電圧安定度余裕計算結果を記憶する。次に、前記電圧安定度余裕計算結果D5と閾値データD8を用いて、過酷シナリオ過酷度ランキング計算を行い、過酷シナリオ過酷度ランキング計算結果を記憶する。次に、前記過酷シナリオ過酷度ランキング計算結果D6と閾値データD8を用いて、脆弱母線計算を行い、脆弱母線計算結果を記憶する。最後に、前記脆弱母線計算結果D7を用いて、脆弱母線や脆弱母線が多い箇所に監視箇所変更する流れである。なお、監視箇所は複数箇所を表示してもよいし、最も脆弱な母線を表示してもよい。各種計算結果や計算途中でメモリに蓄積されるデータは、監視制御装置210の画面に逐次表示されてもよい。これにより、運用者が電圧安定度監視装置10の運用状況を容易に把握できる。また、電圧安定度監視装置10において、運転状況として、監視内容(脆弱母線の発生)などが表示されてもよい。これにより、運用者が電圧安定度監視装置10の運用状況を容易に把握できる。なお、監視箇所変更が実施されるまで、各種データの受信から各種計算結果を夫々送信するまでの状況の画面表示を繰り返す。以上の処理の流れをステップ毎に説明する。
Next, the calculation processing contents of the voltage stability monitoring apparatus 10 will be described with reference to FIG. FIG. 6 is an example of a flowchart showing the entire processing of the voltage stability monitoring apparatus. First, the flow will be briefly described. After the system facility data D2, the assumed change scenario data D3, and the threshold data D8 are input and stored, the system measurement data D1 is received, the state estimation calculation is performed, and the state estimation calculation result is stored. Next, an assumed change scenario is calculated using the system facility data D2, the assumed change scenario data D3, and the state estimation result (stored in the assumed change scenario database 23). Next, the voltage stability calculation is performed using the state estimation calculation result (stored in the system measurement database 21) and the assumed change scenarios, and then the voltage stability margin calculation is performed. The voltage stability calculation result And the voltage stability margin calculation result is stored. Next, the severe scenario severity ranking calculation is performed using the voltage stability margin calculation result D5 and the threshold data D8, and the severe scenario severity ranking calculation result is stored. Next, vulnerable bus calculation is performed using the severe scenario severity ranking calculation result D6 and threshold data D8, and the vulnerable bus calculation result is stored. Finally, using the vulnerable bus calculation result D7, the monitoring location is changed to a location where there are many vulnerable buses or vulnerable buses. Note that a plurality of monitoring locations may be displayed, or the most vulnerable busbar may be displayed. Various calculation results and data stored in the memory during the calculation may be sequentially displayed on the screen of the monitoring control device 210. Thereby, the operator can easily grasp the operation status of the voltage stability monitoring apparatus 10. Moreover, in the voltage stability monitoring apparatus 10, the monitoring content (occurrence | occurrence | production of a weak bus) etc. may be displayed as an operation condition. Thereby, the operator can easily grasp the operation status of the voltage stability monitoring apparatus 10. Note that the screen display of the situation from reception of various data to transmission of various calculation results is repeated until the monitoring location is changed. The above processing flow will be described step by step.
まず、ステップS1では、系統設備データD2と想定変化シナリオデータD3と閾値データD8が予め設定されていない場合、系統設備データD2と想定変化シナリオデータD3と閾値データD8を入力部12および表示部11を用いて入力する。ここで、監視制御装置210から通信ネットワーク300および通信部13を通してデータの入力をしてもよいし、監視制御装置210などで保持している系統設備データD2と想定変化シナリオデータD3と閾値データD8に関するデータを一定周期で自動受信し、記憶してもよい。また、系統設備データD2と想定変化シナリオデータD3と閾値データD8が予め設定されている場合は、修正を加えてもよいし、そのままのデータを用いてもよい。
First, in step S1, when the system equipment data D2, the assumed change scenario data D3, and the threshold data D8 are not set in advance, the system equipment data D2, the assumed change scenario data D3, and the threshold data D8 are input to the input unit 12 and the display unit 11. Enter using. Here, data may be input from the monitoring control device 210 through the communication network 300 and the communication unit 13, or the system facility data D2, the assumed change scenario data D3, and the threshold data D8 held in the monitoring control device 210 or the like. The data related to the above may be automatically received and stored at regular intervals. Further, when the system facility data D2, the assumed change scenario data D3, and the threshold data D8 are set in advance, the correction may be added or the data as it is may be used.
ステップS2では、系統計測データD1を受信し、状態推定計算を行い、状態推定計算結果を、系統計測データベース21に記憶する。状態推定計算によって、もっともらいしい系統の各ノード、ブランチ、発電機、負荷、制御機器の有効電力P、無効電力Q、電圧V、電圧位相角δ、電流I、力率Φ、を推定計算した結果も、系統計測データとして保存しておく。なお、状態推定計算の方法は、例えば、Lars Holten, Anders Gjelsvlk, Sverre Adam, F. F. Wu, and Wen-Hs Iung E. Liu, Comparison of Different Methods for State Estimation, IEEE Transaction on Power Systems, Vol. 3 (1988), pp.1798-1806に記載の計算方法などに則して行う。
In step S2, the system measurement data D1 is received, the state estimation calculation is performed, and the state estimation calculation result is stored in the system measurement database 21. By estimating the state, each node, branch, generator, load, control device active power P, reactive power Q, voltage V, voltage phase angle δ, current I, and power factor Φ of the desired system were estimated and calculated. The results are also saved as system measurement data. State estimation calculation methods include, for example, Lars Holten, Anders Gjelsvlk, Sverre Adam, F. F. Wu, and Wen-Hs Iung E. Liu, Comparison of Different Methods for State Estimation, IEEE Transaction on Power Perform according to the calculation method described in 3 (1988), pp.1798-1806.
ステップS3では、ステップS1で記憶した系統設備データD2と想定変化シナリオデータD3と、ステップS2で求めた状態推定結果と、を用いて、想定変化シナリオ計算を行い、その結果を想定変化シナリオデータベース23に記憶する。
In step S3, the assumed change scenario calculation is performed using the system facility data D2, the assumed change scenario data D3 stored in step S1, and the state estimation result obtained in step S2, and the result is assumed change scenario database 23. To remember.
ここで、図7を用いて、想定変化シナリオ計算の流れを説明する。図7は、想定変化シナリオ計算部30の処理を説明するフローチャートの例である。図7は、ステップS11~S18を通して、系統計測データD1および系統設備データD2を読込み、想定故障箇所・様相を選択後、想定再生可能エネルギー変化量を選択し想定変化シナリオD3として保存する流れを、想定故障箇所と想定故障様相と想定再生可能エネルギー変化量が選択し終わるまで繰り返して計算する方法を示している。以上の処理の流れを以下で説明する。ステップS11では、ステップS1およびステップS2で入力および受信・計算した、系統計測データD1および系統設備データD2を読込み、メモリ14に読込む。ステップS12では、メモリ14に読み出された想定故障箇所のリストの中から、未選択のひとつを選択する。ステップS13では、メモリ14に読み出された想定故障様相のリストの中から、未選択のひとつを選択する。ステップS14では、メモリ14に読み出された想定再生可能エネルギー変化量のリストの中から、未選択のひとつを選択する。ステップS15では、ステップS12~14で選択された想定故障箇所・想定故障様相・想定再生可能エネルギー変化量の組合せをひとつの想定変化シナリオD3として保存する。ステップS16では、全ての想定再生可能エネルギー変化量のリストが選択されていない場合、ステップS14に戻る。また、ステップS16では、全ての想定再生可能エネルギー変化量のリストが選択されている場合、ステップS17に進む。ステップS17では、全ての想定故障様相のリストが選択されていない場合、ステップS13に戻る。また、ステップS17では、全ての想定故障様相のリストが選択されている場合、ステップS18に進む。ステップS18では、全ての想定故障箇所のリストが選択されていない場合、ステップS12に戻る。また、ステップS17では、全ての想定故障箇所のリストが選択されている場合、フローを終了する。ここで、想定再生可能エネルギー変化量は、出力変化なし、(ある一定期間の間の)出力減少、(ある一定期間の間の)出力増加などが考えられる。また、想定再生可能エネルギー変化量は、一定周期毎に手入力や監視制御装置やデータベースに記憶されたデータを元に更新されてもよい。ここで、想定故障箇所・想定故障様相・想定再生可能エネルギー変化量の組合せとして、故障なしで、想定再生可能エネルギー変化量だけの組合せも存在する。
Here, the flow of assumed change scenario calculation will be described with reference to FIG. FIG. 7 is an example of a flowchart for explaining the process of the assumed change scenario calculation unit 30. FIG. 7 shows a flow of reading system measurement data D1 and system equipment data D2 through steps S11 to S18, selecting an assumed failure location / mode, selecting an assumed renewable energy change amount, and saving it as an assumed change scenario D3. It shows a method of repeatedly calculating until an assumed failure location, an assumed failure aspect, and an assumed renewable energy change amount are selected. The flow of the above processing will be described below. In step S11, the system measurement data D1 and the system facility data D2 input, received and calculated in steps S1 and S2 are read and read into the memory 14. In step S12, an unselected one is selected from the list of conceivable failure locations read out to the memory 14. In step S <b> 13, an unselected one is selected from the list of assumed failure modes read to the memory 14. In step S14, an unselected one is selected from the list of assumed renewable energy change amounts read out to the memory 14. In step S15, the combination of the assumed failure location, the assumed failure aspect, and the assumed renewable energy change amount selected in steps S12 to S14 is stored as one assumed change scenario D3. In step S16, when the list of all assumed renewable energy changes is not selected, the process returns to step S14. Further, in step S16, if a list of all assumed renewable energy changes is selected, the process proceeds to step S17. In step S17, when the list of all conceivable failure modes has not been selected, the process returns to step S13. Further, in step S17, when a list of all assumed failure modes has been selected, the process proceeds to step S18. If it is determined in step S18 that a list of all possible failure locations has not been selected, the process returns to step S12. Moreover, in step S17, when the list of all the assumed failure locations is selected, the flow ends. Here, as the assumed renewable energy change amount, there is no output change, output decrease (for a certain period), output increase (for a certain period), and the like. Further, the assumed renewable energy change amount may be updated based on manual input or data stored in a monitoring control device or a database at regular intervals. Here, as a combination of the assumed failure location, the assumed failure aspect, and the assumed renewable energy change amount, there is also a combination of only the assumed renewable energy change amount without failure.
ここで、図4を用いて、想定変化シナリオデータD3の例を説明する。図4に示すように、電力系統において想定される故障ケースとして故障箇所と故障様相と想定再生可能エネルギー変化量などを組み合わせたリストが含まれる。これ以外の要素としては、故障除去タイミングなどが一覧に含まれる。想定再生可能エネルギー変化量は、太陽光発電や風力発電やメガソーラやウィンドファームの出力変動量や、ウィンドファームの一斉脱落などを含む。故障ケースとしては、系統の運用によっては、過酷な故障ケースのみであってもよい。また、再生可能エネルギー変化量は、設定されなくてもよい。なお、想定変化シナリオデータD3は入力部12を用いずに事前に設定したり、監視制御装置210で設定した値を通信ネットワーク300および通信部13を介して設定したり、してもよい。これらの設定方法により、柔軟に想定変化シナリオデータD3を設定することができる効果がある。
Here, an example of the assumed change scenario data D3 will be described with reference to FIG. As shown in FIG. 4, a list including a failure location, a failure aspect, an assumed renewable energy change amount, and the like is included as a failure case assumed in the power system. Other elements include failure removal timing and the like in the list. The assumed amount of renewable energy change includes the amount of fluctuation in the output of solar power generation, wind power generation, mega solar and wind farms, and the simultaneous loss of wind farms. The failure case may be only a severe failure case depending on the operation of the system. Further, the renewable energy change amount may not be set. The assumed change scenario data D3 may be set in advance without using the input unit 12, or a value set by the monitoring control device 210 may be set via the communication network 300 and the communication unit 13. By these setting methods, there is an effect that the assumed change scenario data D3 can be set flexibly.
図6に戻り、ここで、ステップS4では、前記状態推定計算結果と前記各想定変化シナリオを用いて、電圧安定度計算を行った後に、電圧安定度計算結果を記憶する。電圧安定度計算の方法は、例えば、特許文献2や、Chiang. H. D. et al., “CPFLOW: A Practical Tool for Tracing Power System Steady-State Stationary Behavior Due to Load and Generation Variations”, IEEE Trans, on Power Systems, Vol. 10, No. 2, pp.623-634, 1995や、Venkataramana Ajjarapu, “Computational Techniques for Voltage Stability Assessment and Control”, Springer, 2006, pp.49-116や、特開平6-153397号公報などに記載の計算方法などに則して行う。
Returning to FIG. 6, here, in step S <b> 4, after the voltage stability calculation is performed using the state estimation calculation result and each assumed change scenario, the voltage stability calculation result is stored. The voltage stability calculation method is, for example, Patent Document 2 and Chiang. H. D. et al., “CPFLOW: A Practical Tool for Tracing Power System Steady-State Stationary Behavior Due to Load and Generation Variations”, IEEE Trans , On Power Systems, Vol. 10, No. 2, pp.623-634, 1995, Venkataramana Ajjarapu, “Computational Techniques for Voltage Stability Assessment and Control”, Springer, 2006, pp.49-116 This is performed in accordance with the calculation method described in Japanese Patent No. 153397.
上記電圧安定度計算の方法は、一般に連続型潮流計算と呼ばれ、非線形関数の解析手法である予測子-修正子法の考え方に基づく、連続法を応用した手法である。この手法を用いてP-V曲線を算出することで、電圧安定度の限界である、有効電力限界付近においても安定定的に解が得られ、有効電力限界を正確に求めることができる効果がある。さらに、連続型潮流計算を用いると電圧低め解を安定的に算出できる。これにより、電圧安定度の評価で用いる運転点における高め解と低め解との差ΔVを算出ができる効果がある。
The above voltage stability calculation method is generally called continuous power flow calculation, and is a method applying the continuous method based on the concept of the predictor-corrector method, which is a nonlinear function analysis method. By calculating the PV curve using this method, a stable and stable solution can be obtained even near the active power limit, which is the limit of the voltage stability, and the effective power limit can be obtained accurately. is there. Furthermore, a voltage lowering solution can be stably calculated by using continuous power flow calculation. As a result, there is an effect that the difference ΔV between the higher solution and the lower solution at the operating point used in the evaluation of the voltage stability can be calculated.
ここで、上記連続型潮流計算によりP-V曲線を作成し、電圧安定度の限界を決定する処理の概略を以下で説明する。
Here, an outline of a process for creating a PV curve by the above continuous flow calculation and determining the limit of the voltage stability will be described below.
P-V曲線の描画イメージを図8に示す。また、処理フローを図9に示す。
Fig. 8 shows a drawing image of the PV curve. The processing flow is shown in FIG.
まず、予測子計算について説明する。予測子の目的は、次の解を得るための予測点を求めることである。予測点は、修正子計算(潮流計算)の初期値となるため、予測点の質が高いほど、正確な解を得るための修正子の反復計算が短くなる。
First, predictor calculation will be described. The purpose of the predictor is to obtain a prediction point for obtaining the next solution. Since the predicted point is an initial value of the corrector calculation (tidal flow calculation), the higher the quality of the predicted point, the shorter the iterative calculation of the corrector for obtaining an accurate solution.
予測子の計算方法は、線形と非線形の予測子に大別できる。線形予測子は(a)単純増加の予測子と(b)割線法の予測子と(c)接線法の予測子などがあり、非線形予測子は(d)放物線の予測子などがある。前記(a)~(d)などのいずれか一つまたは複数の予測子の組合せ予測子の計算を実施してもよい。なお、(a)単純増加の予測子は、単純にλを増加させて予測子を求める方法である。(b)割線法の予測子は、森他:「ラグランジュ補間非線形予測子を用いた連続型潮流計算」、電学論B、123巻、4号、2003年、に示すような前回収束点(λ’、P’)と前々回収束点(λ”、P”)を通る割線を引き、その直線上で予測子を求める方法である。(c)接線法の予測子は、福山他:「Continuation Power Flow実用化システムの開発」、電気学会全国大会、No. 1387、1997、に示すような前回収束点におけるP-V曲線に対する接線を引き、接線上で予測子を求める方法である。(d)放物線の予測子の予測子は、前回以前の収束点を用いて放物線を引き、放物線上で予測子を求める方法である。
∙ Predictor calculation methods can be broadly classified into linear and nonlinear predictors. Linear predictors include (a) simple increase predictors, (b) secant predictors, (c) tangent predictors, and non-linear predictors include (d) parabolic predictors. Calculation of a combination predictor of any one or a plurality of predictors such as (a) to (d) may be performed. Note that (a) a simple increase predictor is a method of obtaining a predictor by simply increasing λ. (B) The predictor of the secant method is the previous convergence point as shown in Mori et al .: “Continuous power flow calculation using Lagrangian interpolation nonlinear predictor”, Electrical Engineering B, Vol. 123, No. 4, No. 2003 ( This is a method of drawing a secant that passes through (λ ′, P ′) and the convergence point (λ ″, P ″) the previous time and obtaining a predictor on the straight line. (C) The predictor of the tangent method is the tangent to the PV curve at the previous convergence point as shown in Fukuyama et al: “Continuation Power Flow practical system development”, IEEJ National Convention, No. 1387, 1997. This is a method for obtaining a predictor on the tangent line. (D) The predictor of the parabola predictor is a method of obtaining a predictor on the parabola by drawing a parabola using the previous convergence point.
以下では、(a)と(b)の予測子を用いた計算を説明する。1ステップ目のみ(a)単純増加の予測子を用いて予測点を求め、2ステップ目以降は(b)割線法の予測子を用いて計算することで、計算量を低減する。これは、割線を引くためには最低2点の収束解が必要なためである。この2つの予測子計算の組合せにすることで、簡単な計算で予測点を求めることができるようになり、計算量を低減できる効果がある。
In the following, calculation using the predictors (a) and (b) will be described. Only in the first step (a) A prediction point is obtained by using a predictor of simple increase, and in the second step and thereafter, calculation is performed by using a predictor of (b) secant method, thereby reducing the amount of calculation. This is because a convergence solution of at least two points is necessary to draw a secant line. By combining these two predictor calculations, it becomes possible to obtain a prediction point with a simple calculation, which has the effect of reducing the amount of calculation.
予測子計算におけるステップ幅の制御は、収束しなかった場合にステップ幅を半分に制御する二分探索法や、Venkataramana Ajjarapu, “Computational Techniques for Voltage Stability Assessment and Control”, Springer, 2006, pp.33-38に記載の一つ前の
修正子計算の収束計算回数によってステップ幅の制御係数(後述)を増減させる制御の、いずれか一方もしくは両方などで実施してもよい。以下では、両方の方法を適用する方法を説明する(以下、収束回数制御と呼ぶ)。 Control of the step width in predictor calculation includes binary search method that controls the step width in half when it does not converge, Venkataramana Ajjarapu, “Computational Techniques for Voltage Stability Assessment and Control”, Springer, 2006, pp.33- The control for increasing / decreasing the step width control coefficient (described later) according to the number of convergence calculations of the previous correction calculation described in 38 may be performed by either one or both. Hereinafter, a method of applying both methods will be described (hereinafter referred to as convergence number control).
修正子計算の収束計算回数によってステップ幅の制御係数(後述)を増減させる制御の、いずれか一方もしくは両方などで実施してもよい。以下では、両方の方法を適用する方法を説明する(以下、収束回数制御と呼ぶ)。 Control of the step width in predictor calculation includes binary search method that controls the step width in half when it does not converge, Venkataramana Ajjarapu, “Computational Techniques for Voltage Stability Assessment and Control”, Springer, 2006, pp.33- The control for increasing / decreasing the step width control coefficient (described later) according to the number of convergence calculations of the previous correction calculation described in 38 may be performed by either one or both. Hereinafter, a method of applying both methods will be described (hereinafter referred to as convergence number control).
後者の収束回数制御において、具体的には、ステップ幅σは次式により決定する。
In the latter control of convergence frequency, specifically, the step width σ is determined by the following equation.

ここで、(k)σは現在の予測子ステップ幅、(k+1)σは次の予測子ステップ幅、Δσはステップ幅増分、Noptは最適な修正子計算の収束計算回数、(k)Nは最後に収束した修正子計算の収束計算回数、Nopt/(k)Nはステップ幅増分の制御係数、である。Noptは、最初は任意の値を設定しておき、所望のP-V曲線の描画ができなかった場合には、必要に応じて増減させる。これにより、所望のP-V曲線を描画することができる効果がある。ここで、所望のP-V曲線とは、例えば、電圧高め解および低め解の両側が運転点の有効電力まで求まったP-V曲線、収束点が所望の点数幅の間であるP-V曲線、P-V曲線のノーズ付近における収束点が所望の点数幅の間であるP-V曲線、である。これは、Noptの値によっては、低め解側が運転点の有効電力に減少させる前に途中で収束しなくなるケースや、P-V曲線の点数が少なかったり多かったりケースが、あるためである。この低め解側も運転点の有効電力まで算出することによって、図18で示すΔVUL10などを計算し、電圧安定性の指標が利用できる利点がある。また、収束点が所望の点数幅の間であることによって、P-V曲線を所望の精度を調整できる利点がある。
Where (k) σ is the current predictor step width, (k + 1) σ is the next predictor step width, Δσ is the step width increment, N opt is the number of convergence calculations of the optimal corrector calculation, (k ) N is the number of convergence calculations of the last corrector calculation, and N opt / (k) N is a control coefficient for incrementing the step width. N opt is initially set to an arbitrary value, and is increased or decreased as necessary when a desired PV curve cannot be drawn. Thereby, there is an effect that a desired PV curve can be drawn. Here, the desired PV curve is, for example, a PV curve obtained up to the active power at the operating point on both sides of the voltage increasing solution and the lower solution, and a PV where the convergence point is between the desired point widths. The curve is a PV curve in which the convergence point in the vicinity of the nose of the PV curve is between a desired point width. This is because, depending on the value of N opt , there are cases where the lower solution side does not converge on the way before it is reduced to the active power at the operating point, and there are cases where the number of points on the PV curve is small or large. On the lower solution side, there is an advantage that ΔV UL10 shown in FIG. 18 is calculated by calculating up to the active power at the operating point, and an index of voltage stability can be used. Further, since the convergence point is between the desired point widths, there is an advantage that the PV curve can be adjusted to a desired accuracy.
収束回数制御は、潮流状態が収束しにくい場合には(k)Nが大きくなりステップ幅が小さく制御され、収束しやすい場合には(k)Nが小さくなりステップ幅が大きく制御される。これにより、効率的に連続型潮流計算を実施できるようになる。
Convergence frequency control is controlled such that (k) N is increased and the step width is decreased when the power flow state is difficult to converge, and (k) N is decreased and the step width is increased when convergence is easy. As a result, continuous power flow calculation can be performed efficiently.
収束回数制御で、修正子計算が収束しなかった場合は、収束するまで二分探索法に切り替える。ここで、収束しなかった場合とは、1つの修正子計算における、収束計算において、n回目に計算したミスマッチの総和がn+1回目に計算したミスマッチの総和よりも大きくなる毎にカウントし、カウントが設定回数を上回った場合のことである。ただし、事前に設定する収束計算の上限回数に達した場合は、(1)式を使用する。収束すれば、次のステップ調節は(1)式の収束回数制御に戻す。これにより、収束計算回数上限に到達するような収束しにくいときでも、安定して解を得ることができるようになる。また、修正子計算において、P-V曲線の形状が二次曲線のようになっているため、有効電力限界の一つ前の電圧高め解と有効電力限界の解を用いて作成する予測子が、収束すべき電圧低め解から大きく離れ、収束計算回数が増加する可能性がある。収束回数制御では、(1)式を用いて次の予測子を計算するため、最初の電圧低め解の点を求める際には、(k)Nが大きくなり、それ以降の電圧低め解を求めるΔσが電圧高め解を求めていた時よりは小さくなり、電圧低め解を細かな刻みで計算してしまい計算量が増加する可能性がある。そこで、最初の電圧低め解の点を求める際には、(1)式を使用せずに、電圧高め解における、最初の電圧低め解よりも小さな倍率を用いて、(k+1)σを計算する。これによって、電圧低め解の計算を適切な点数で計算することができ、計算量を低減することができる効果がある。
If the correction calculation does not converge in the convergence count control, the binary search method is switched until convergence. Here, the case of not converging is counted every time the sum of mismatches calculated in the nth time becomes larger than the sum of mismatches calculated in the n + 1th time in the convergence calculation in one corrector calculation. This is when the set number of times is exceeded. However, when the upper limit number of convergence calculations set in advance is reached, equation (1) is used. If converged, the next step adjustment returns to the convergence number control of equation (1). As a result, even when it is difficult to converge such that the upper limit of the number of convergence calculations is reached, a solution can be obtained stably. Also, in the corrector calculation, the shape of the PV curve is a quadratic curve, so the predictor created using the voltage increase solution and the active power limit solution one before the active power limit is There is a possibility that the number of convergence calculations increases as the voltage lowering solution to be converged is far away. In the convergence frequency control, since the next predictor is calculated using the equation (1), (k) N is increased when obtaining the first voltage lowering solution point, and subsequent voltage lowering solutions are obtained. Δσ becomes smaller than when a solution with higher voltage is sought, and the solution with lower voltage may be calculated in small increments, which may increase the amount of calculation. Therefore, when finding the first voltage lowering solution point, instead of using equation (1), (k + 1) σ is calculated using a smaller magnification than the first voltage lowering solution in the voltage increasing solution. calculate. As a result, it is possible to calculate the voltage lowering solution with an appropriate number of points and to reduce the amount of calculation.
修正子計算結果の負荷が運転点より小さくなった場合、計算を終了する。
When the load of the correction calculation result becomes smaller than the operating point, the calculation ends.
次に修正子計算方法について説明する。まず、負荷パラメータλを変数として考慮して、潮流方程式を(2)式のように定式化する。
Next, the corrector calculation method will be described. First, considering the load parameter λ as a variable, the power flow equation is formulated as shown in equation (2).
ただし、xは母線電圧値を並べた変数ベクトル、λは負荷パラメータ値を並べた変数ベクトルである。
However, x is a variable vector in which bus voltage values are arranged, and λ is a variable vector in which load parameter values are arranged.
(2)式は具体的には次の三つからなる。
(2) Specifically, the equation consists of the following three.
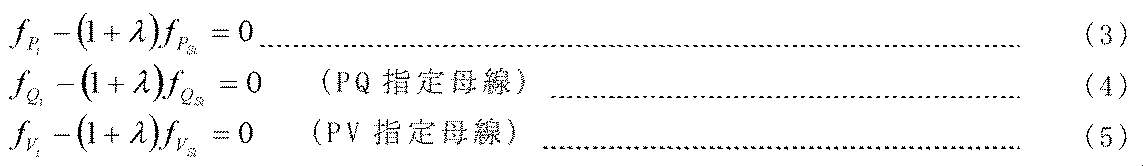
ここで、iはノード番号、fPiは母線iでの有効電力、fQiは母線iでの無効電力、fViは母線iでの電圧の大きさを表す関数、fPsi、fQsi、fVsiはそれぞれ母線iでの有効電力、無効電力、電圧の大きさの指定値、λは負荷パラメータ、である。
(4)式と(5)式はどちらか一方しか指定できないため、通常、負荷母線など電圧制御がかかっていない母線はPQ指定として(5)式を用い、発電機母線など電圧制御がかかっている母線はPV指定として(5)式を用いる。 Where i is the node number, f Pi is the active power at bus i, f Qi is the reactive power at bus i, f Vi is a function representing the magnitude of the voltage at bus i, f Psi , f Qsi , f Vsi is an active power, reactive power, and specified value of voltage magnitude on bus i, respectively, and λ is a load parameter.
Since either (4) or (5) can only be specified, normally a bus that is not subject to voltage control, such as a load bus, is subject to voltage control, such as a generator bus, using (5) as the PQ designation. (5) is used for the PV bus designation.
また、Chiang. H. D. et al., “CPFLOW: A Practical Tool for Tracing Power System Steady-State Stationary Behavior Due to Load and Generation Variations”に示されるように、電圧ベクトルと負荷パラメータを疑似アークレングス(図10参照)によって決まる変数として表す。
Also, as shown in Chiang. H. D. et al., “CPFLOW: A Practical Tool for Tracing Power System Steady-State Stationary Behavior Due to Load and Generation Variations” It is expressed as a variable determined by (see FIG. 10).

ただし、xは電圧ベクトル、λは負荷パラメータ、sは疑似アークレングス、である。
ここで、(6)式および(7)式に以下の条件を与える。 Here, x is a voltage vector, λ is a load parameter, and s is a pseudo arc length.
Here, the following conditions are given to the expressions (6) and (7).
ここで、(6)式および(7)式に以下の条件を与える。 Here, x is a voltage vector, λ is a load parameter, and s is a pseudo arc length.
Here, the following conditions are given to the expressions (6) and (7).

ただし、xは電圧ベクトル、nはノード数、iは変数の番号、kはステップ数、Δsは、疑似アーグレングスの変化量、である。
(8)式は、に示される超球面を表し、全変数の増加量の和が部分的にP-V曲線を線形近似した値と等しい制約を示す。この式の考慮によって、CPF法はヤコビ行列が特異となる条件を変化させている。 However, x is a voltage vector, n is the number of nodes, i is the number of a variable, k is the number of steps, and Δs is the amount of change in pseudo-arglens.
Equation (8) represents the hypersphere shown in (1), and shows the constraint that the sum of the increments of all variables is partially equal to the value obtained by linearly approximating the PV curve. By considering this equation, the CPF method changes the conditions under which the Jacobian matrix is singular.
連続型潮流計算は(6)式、(7)式、(8)式の連立方程式の有効電力および無効電力を変更しながらその都度ニュートン・ラプソン法などで解くことによって、P-V曲線を作成する。なお、Δx(l+1)ニュートン・ラプソン法は(9)式により修正量Δx(l+1)を求め,(10)式でxを更新しながら解を求める。
Continuous power flow calculation creates a PV curve by changing the active power and reactive power of the simultaneous equations (6), (7), and (8) using the Newton-Raphson method each time. To do. In the Δx (l + 1) Newton-Raphson method, a correction amount Δx (l + 1) is obtained from equation (9), and a solution is obtained while updating x by equation (10).

ここで,JAugはf(x)をxの要素で偏微分した拡張ヤコビ行列であり,右肩添え字(l)は収束計算ステップ数を表す。前記拡張ヤコビ行列と、通常の潮流計算で用いるヤコビ行列の違いは、負荷パラメータλの行列が拡張された点である。これにより、有効電力限界付近でも収束性が改善できる。なお、(9)式および(10)式のxには、λも含めて表記している。また、前記ニュートン・ラプソン法は、極座標系で計算してもよいし、直交座標系で計算してもよい。また、前記ニュートン・ラプソン法による、連立方程式を解くにはLU分解などを用いるが、順序付け(オーダリング)によりフィルインを減少させてから計算することで、計算量を低減できる効果がある。なお 、計算の高速性が求められる場合には、上記連続型潮流計算のように潮流方程式と疑似アークレングスの(8)式を導入せずに、潮流方程式のみで通常の潮流計算を繰り返し解くだけでもよい。これにより、計算が高速になる利点がある。ただし、この場合、P-V曲線計算では、電圧低め解が求まらない可能性があるため、電圧低め解を用いた電圧安定度指標を利用できないため、運転点からノーズ端までの電圧高め解を用いた電圧安定度指標を用いる。
Here, J Aug is an extended Jacobian matrix obtained by partial differentiation of f (x) by the element of x, and the right superscript (l) represents the number of convergence calculation steps. The difference between the expanded Jacobian matrix and the Jacobian matrix used in normal power flow calculation is that the matrix of the load parameter λ is expanded. Thereby, the convergence can be improved even near the active power limit. It should be noted that x in equations (9) and (10) is described including λ. The Newton-Raphson method may be calculated using a polar coordinate system or an orthogonal coordinate system. Further, LU decomposition or the like is used to solve the simultaneous equations by the Newton-Raphson method, but there is an effect that the calculation amount can be reduced by calculating after reducing the fill-in by ordering. When high-speed calculation is required, the usual tidal current calculation is simply solved by using only the tidal equation without introducing the tidal equation and pseudo arc length (8) as in the case of the continuous tidal current calculation. But you can. As a result, there is an advantage that the calculation becomes faster. However, in this case, there is a possibility that the voltage lowering solution may not be obtained in the PV curve calculation, so the voltage stability index using the voltage lowering solution cannot be used, so the voltage from the operating point to the nose end is increased. A voltage stability index using the solution is used.
ここで、図13および図15を用いて、電圧安定度計算結果の例を説明する。図13および図15は、電圧安定度計算部31のイメージを説明する例である。図13は、横軸に有効電力の総需要P、縦軸にノードiの電圧ViをとったP-V曲線を算出した例である。運転点は、(P0、Vi0)となり、この高め解と対となる低め解は、(P0、V’i0)となる。さらに、電圧安定度の限界である、有効電力限界は、PCの箇所である。P-V曲線の先端である、有効電力限界を一般にノーズと呼ぶ。図15は、横軸にノードiの電圧Vi、縦軸に無効電力の総需要QをとったV-Q曲線を算出した例である。運転点は、(Vi0、Q0)となる。さらに、電圧安定度の限界である、無効電力限界は、QCの箇所である。V-Q曲線は、ノードiの無効電力消費から、系統側からの無効電力供給分を引くことで描く事ができる。なお、図24に示すような発電機の制約データを考慮した電圧安定度計算の機能を持つ。これにより、より現実に近い電力系統の電圧安定性を検討することができる。
Here, an example of the voltage stability calculation result will be described with reference to FIGS. 13 and 15. FIGS. 13 and 15 are examples illustrating an image of the voltage stability calculator 31. FIG. 13 shows an example in which a PV curve is calculated with the total demand P of active power on the horizontal axis and the voltage V i of the node i on the vertical axis. The operating point is (P 0 , V i0 ), and the lower solution that is paired with this higher solution is (P 0 , V ′ i0 ). Furthermore, the limit of voltage stability, active power limit is part of the P C. The active power limit, which is the tip of the PV curve, is generally called the nose. FIG. 15 is an example of calculating a VQ curve with the horizontal axis representing the voltage V i of the node i and the vertical axis representing the total demand Q of reactive power. The operating point is (V i0 , Q 0 ). Furthermore, the limit of voltage stability, reactive power limit is part of the Q C. The VQ curve can be drawn by subtracting the reactive power supply from the system side from the reactive power consumption of node i. In addition, it has the function of the voltage stability calculation which considered the constraint data of a generator as shown in FIG. As a result, the voltage stability of the power system closer to reality can be examined.
図6に戻り、ここで、ステップS5では、電圧安定度余裕計算を行い、および電圧安定度余裕計算結果を記憶する。ここで、図13および図15を用いて、電圧安定度余裕計算結果の例を説明する。図13および図15は、電圧安定度余裕計算部32のイメージを説明する例である。図13のP-V曲線から、運転点のP0と有効電力限界PCとの差分である(11)式によって、電圧安定度余裕ΔPが計算できる。また、電圧安定度余裕は、(12)式によって計算されるΔViであってもよい。
Returning to FIG. 6, here, in step S5, the voltage stability margin calculation is performed, and the voltage stability margin calculation result is stored. Here, an example of the voltage stability margin calculation result will be described with reference to FIGS. 13 and 15. FIG. 13 and FIG. 15 are examples illustrating an image of the voltage stability margin calculation unit 32. From P-V curve of FIG. 13, by a difference between P 0 of the operating point and the active power limit P C (11) equation can be calculated voltage stability margin [Delta] P. Further, the voltage stability margin may be ΔV i calculated by equation (12).

また、図15のV-Q曲線から、無効電力Q=0と無効電力限界QCとの差分であるΔQによって、電圧安定度余裕ΔQが計算できる。このように、系統運用者が普段用いている物理量で構成されるP-V曲線やV-Q曲線から、簡単に求められる電圧安定度余裕を用いることによって、系統運用者が理解し易いという効果がある。ただし、これ以外の電圧安定度余裕を計算し用いてもよい。また、想定変化シナリオによっては、P-V曲線やV-Q曲線がそもそも書けないケースも存在する。このようなケースは、運転点がないと考えられ、電圧安定度余裕なし判定される。
Further, from the VQ curve of FIG. 15, the voltage stability margin ΔQ can be calculated from ΔQ which is the difference between the reactive power Q = 0 and the reactive power limit Q C. In this way, the system operator can easily understand by using the voltage stability margin that can be easily obtained from the PV curve and VQ curve composed of physical quantities that are usually used by the system operator. There is. However, other voltage stability margins may be calculated and used. Also, depending on the assumed change scenario, there are cases where the PV curve or VQ curve cannot be written in the first place. In such a case, it is considered that there is no operating point, and it is determined that there is no voltage stability margin.
図6に戻り、ここで、ステップS6では、前記電圧安定度余裕計算結果D5と閾値データD8を用いて、過酷シナリオ過酷度ランキング計算を行い、過酷シナリオ過酷度ランキング計算結果を記憶する。
Returning to FIG. 6, in step S6, the severe scenario severity ranking calculation is performed using the voltage stability margin calculation result D5 and the threshold data D8, and the severe scenario severity ranking calculation result is stored.
ここで、図11を用いて、過酷シナリオ過酷度ランキング計算の流れを説明する。図11は、過酷シナリオ過酷度ランキング計算部33の処理を説明するフローチャートの例である。図11は、ステップS21~S26を通して、ステップS5で計算した電圧安定度余裕計算結果データD5および閾値データD8を読込み、各想定変化シナリオを電圧安定度余裕の昇順にソートし各想定変化シナリオ過酷度ランキング計算結果データD6に保存し、想定変化シナリオをひとつ選択し、選択した想定変化シナリオの電圧安定度余裕が閾値未満であれば、過酷シナリオと選択し、各想定変化シナリオ過酷度ランキング計算結果データD6に過酷シナリオ情報を付加して記憶する。一方、選択した想定変化シナリオの電圧安定度余裕が閾値以上であれば、次の想定変化シナリオをひとつ選択する。以上を全ての想定変化シナリオを選択し終わるまで繰り返して計算する方法を示している。以上の処理の流れを以下で説明する。ステップS21では、ステップS5で計算した電圧安定度余裕計算結果データD5および閾値データD8を読込み、メモリ14に読込む。ステップS22では、メモリ14に読み出された各想定変化シナリオの電圧安定度余裕を昇順にソートし、各想定変化シナリオ過酷度ランキング計算結果データD6に保存する。ステップS23では、各想定変化シナリオの中から、想定変化シナリオをひとつ選択する。ステップS24では、ステップS23で選択した想定変化シナリオの電圧安定度余裕がステップS5で読込んだ閾値データD8の過酷度閾値(図5参照)未満であるかどうかを判定する。ここで、選択した想定変化シナリオの電圧安定度余裕が過酷度閾値未満であれば、選択した想定変化シナリオが過酷シナリオと選択され、ステップS25に進む。一方、選択した想定変化シナリオの電圧安定度余裕が過酷度閾値以上であれば、次の想定変化シナリオをひとつ選択するためにステップS23に戻る。ステップS25では、各想定変化シナリオ過酷度ランキング計算結果データD6に過酷シナリオ情報を付加して記憶する。ステップS26では、全ての想定変化シナリオを選択したかを判定し、全ての想定変化シナリオを選択していない場合には、ステップS23に戻り、全ての想定変化シナリオを選択した場合には、終了となる。
Here, the flow of severe scenario severity ranking calculation will be described with reference to FIG. FIG. 11 is an example of a flowchart for explaining the processing of the severe scenario severity ranking calculation unit 33. FIG. 11 reads the voltage stability margin calculation result data D5 and threshold data D8 calculated in step S5 through steps S21 to S26, sorts the assumed change scenarios in ascending order of the voltage stability margin, and calculates the severity of each assumed change scenario. Saved in the ranking calculation result data D6, select one assumed change scenario, and if the voltage stability margin of the selected assumed change scenario is less than the threshold, select a severe scenario, and each assumed change scenario severity ranking calculation result data Severe scenario information is added to D6 and stored. On the other hand, if the voltage stability margin of the selected assumed change scenario is greater than or equal to the threshold value, the next assumed change scenario is selected. The above shows a method of calculating repeatedly until all assumed change scenarios are selected. The flow of the above processing will be described below. In step S21, the voltage stability margin calculation result data D5 and threshold value data D8 calculated in step S5 are read and read into the memory 14. In step S22, the voltage stability margins of each assumed change scenario read out to the memory 14 are sorted in ascending order and stored in each assumed change scenario severity ranking calculation result data D6. In step S23, one assumed change scenario is selected from each assumed change scenario. In step S24, it is determined whether the voltage stability margin of the assumed change scenario selected in step S23 is less than the severity threshold (see FIG. 5) of the threshold data D8 read in step S5. Here, if the voltage stability margin of the selected assumed change scenario is less than the severity threshold, the assumed assumed change scenario is selected as the severe scenario, and the process proceeds to step S25. On the other hand, if the voltage stability margin of the selected assumed change scenario is equal to or greater than the severity threshold, the process returns to step S23 to select one next assumed change scenario. In step S25, severe scenario information is added to each assumed change scenario severe degree ranking calculation result data D6 and stored. In step S26, it is determined whether all assumed change scenarios have been selected. If all assumed change scenarios have not been selected, the process returns to step S23, and if all assumed change scenarios have been selected, the process ends. Become.
ここで、図16および図17を用いて、過酷シナリオ過酷度ランキング計算の例を説明する。図16および図17は、過酷シナリオ過酷度ランキング計算部33のイメージを説明する例である。図16は、横軸にシナリオNo.、縦軸に電圧安定度余裕を示している。各想定変化シナリオをステップS5で求めた電圧安定度余裕の大きさで昇順にソート(並び替え)することで、ランキング(順位付け)できることがわかる。また、図17は、図16と同様に横軸にシナリオNo.、縦軸に電圧安定度余裕を示している。ただし、各想定変化シナリオに再生可能エネルギー変化を考慮している。各想定変化シナリオをステップS5で求めた電圧安定度余裕の大きさで昇順にソート(並び替え)することで、ランキング(順位付け)できることがわかる。ただし、このように再生可能エネルギー変化を考慮してランキングすると、各想定変化シナリオ間の関係がわかりにくくなる場合には、図16のように、再生可能エネルギー変化を考慮せずにランキングする。また、再生可能エネルギー変化の中でもウィンドファームの一斉脱落など大きな出力変化だけを対象として、再生可能エネルギー変化を考慮してランキングすることで、運用者にとって、重大な想定変化シナリオを抽出することが可能となる。また、P-V曲線やV-Q曲線がそもそも書けない電圧安定度余裕なし判定された想定変化シナリオは、ステップS6において、別の方法を用いてランキングされる。例えば、蘇、田中:「電圧不安定を含む(N-1)電圧安定性高速ランキング手法」、電気学会論文誌B、Vol. 129、No. 9、pp.1098-1106、2009に記載の評価方法などに則して行う。こうすることで、電圧安定度余裕なしと判定された想定変化シナリオを過酷シナリオとして選択し、さらに、その中でもランキングすることができる。
Here, an example of severe scenario severity ranking calculation will be described with reference to FIGS. 16 and 17. FIGS. 16 and 17 are examples illustrating an image of the severe scenario severity ranking calculation unit 33. FIG. 16 shows a scenario number on the horizontal axis and a voltage stability margin on the vertical axis. It can be seen that ranking (ranking) can be performed by sorting (rearranging) each assumed change scenario in ascending order according to the magnitude of the voltage stability margin obtained in step S5. Also, in FIG. 17, the horizontal axis indicates the scenario number and the vertical axis indicates the voltage stability margin as in FIG. However, renewable energy changes are taken into account for each assumed change scenario. It can be seen that ranking (ranking) can be performed by sorting (rearranging) each assumed change scenario in ascending order according to the magnitude of the voltage stability margin obtained in step S5. However, when ranking is performed in consideration of the change in renewable energy as described above, if the relationship between each assumed change scenario becomes difficult to understand, the ranking is performed without considering the change in renewable energy as shown in FIG. In addition, it is possible to extract significant assumed change scenarios for operators by ranking only for large output changes such as the simultaneous dropout of wind farms among renewable energy changes, considering renewable energy changes. It becomes. In addition, the assumed change scenario determined as having no voltage stability margin in which the PV curve or VQ curve cannot be written in the first place is ranked using another method in step S6. For example, Su, Tanaka: Evaluation described in “N-1) Voltage Stability Fast Ranking Method Including Voltage Instability”, IEEJ Transactions B, Vol. 129, No. 9, pp.1098-1106, 2009 Perform according to the method. By doing so, it is possible to select an assumed change scenario determined as having no voltage stability margin as a severe scenario, and to rank among them.
図6に戻り、ここで、ステップS7では、前記過酷シナリオ過酷度ランキング計算結果D6と閾値データD8を用いて、脆弱母線計算を行い、脆弱母線計算結果を記憶する。
Returning to FIG. 6, here, in step S7, a vulnerable bus calculation is performed using the severe scenario severity ranking calculation result D6 and threshold data D8, and the vulnerable bus calculation result is stored.
ここで、図12および図14を用いて、脆弱母線計算の流れを説明する。図12および図14は、脆弱母線計算部34の処理を説明するフローチャートの例である。図12は、ステップS31~S38を通して、図13のP-V曲線を用いて脆弱母線を確定するフローであり、ステップS6で計算した各過酷シナリオに対するステップS4で計算した電圧安定度計算結果データD4と閾値データD8を読込み、過酷シナリオをひとつ選択し、負荷母線をひとつ選択し、選択負荷母線のP-V曲線のΔV0が脆弱母線閾値ΔV0以下であるかどうか判定し、P-V曲線のΔV0が脆弱母線閾値ΔV0以下でない場合には、負荷母線を選択しなおし、P-V曲線のΔV0が脆弱母線閾値ΔV0以下である場合には、選択負荷母線のP-V曲線の初期Pの低め解におけるΔV/ΔPが脆弱母線閾値ΔV/ΔP以下であるかどうかを判定し、選択負荷母線のP-V曲線の初期Pの低め解におけるΔV/ΔPが脆弱母線閾値ΔV/ΔP以下でない場合には、負荷母線を選択しなおし、選択負荷母線のP-V曲線の初期Pの低め解におけるΔV/ΔPが脆弱母線閾値ΔV/ΔP以下である場合には、脆弱母線と確定し、脆弱母線計算結果データD7に保存し、負荷母線を選択しなおす。全ての負荷母線を選択した場合には、過酷シナリオを選択し、同様のフローで脆弱母線を求めるフローを繰り返し、全ての過酷シナリオを選択した場合に、脆弱母線候補の中で、最もΔV0 が大きい母線を脆弱負荷母線と確定し保存し、フロー終了となる。
Here, the flow of vulnerable bus calculation will be described with reference to FIGS. 12 and 14. FIG. 12 and FIG. 14 are examples of flowcharts for explaining the processing of the vulnerable bus calculation unit 34. FIG. 12 is a flow for determining the vulnerable bus using the PV curve of FIG. 13 through steps S31 to S38, and the voltage stability calculation result data D4 calculated in step S4 for each severe scenario calculated in step S6. And threshold data D8, select one severe scenario, select one load bus, determine whether ΔV 0 of the PV curve of the selected load bus is less than or equal to the vulnerable bus threshold ΔV 0 , and PV curve If ΔV 0 is not less than the vulnerable bus threshold ΔV 0 , the load bus is selected again. If ΔV 0 of the PV curve is less than or equal to the vulnerable bus threshold ΔV 0, the PV curve of the selected load bus is It is determined whether or not ΔV / ΔP in the initial P lower solution is equal to or less than the vulnerable bus threshold ΔV / ΔP, and ΔV / ΔP in the initial P lower solution of the PV curve of the selected load bus is the vulnerable bus threshold ΔV / ΔP or less Otherwise, the load bus is selected again, and if ΔV / ΔP in the initial P lowering solution of the PV curve of the selected load bus is equal to or less than the vulnerable bus threshold ΔV / ΔP, it is determined as the vulnerable bus, Save to the vulnerable bus calculation result data D7 and select the load bus again. When all load buses are selected, the severe scenario is selected, and the flow for obtaining the vulnerable bus is repeated with the same flow. When all the severe scenarios are selected, ΔV 0 is the largest among the vulnerable bus candidates. The large bus is confirmed as a vulnerable load bus and saved, and the flow ends.
以上の処理の流れを以下で説明する。ステップS31では、ステップS6で計算した各過酷シナリオに対するステップS4で計算した電圧安定度計算結果データD4と閾値データD8を読込み、メモリ14に読込む。ステップS32では、全ての過酷シナリオを選択したかを判定し、全ての過酷シナリオを選択していない場合には、ステップS33に進み、全ての過酷シナリオを選択した場合には、ステップS39に進む。ステップS33では、過酷シナリオをひとつ選択する。ステップS34では、全ての負荷母線を選択したかを判定し、全ての負荷母線を選択していない場合には、ステップS35に進み、全ての負荷母線を選択した場合には、ステップS32に戻る。ステップS35では、負荷母線をひとつ選択する。ステップS36では、図13に示す選択負荷母線のP-V曲線のΔV0が脆弱母線閾値ΔV0以下であるかどうか判定する。ここで、P-V曲線のΔV0が脆弱母線閾値ΔV0以下でない場合には、ステップS36に戻る。P-V曲線のΔV0が脆弱母線閾値ΔV0以下である場合には、ステップS37に進む。ステップS37では、図13に示す選択負荷母線のP-V曲線の初期Pの低め解におけるΔV/ΔPが脆弱母線閾値ΔV/ΔP以下であるかどうかを判定する。ここで、選択負荷母線のP-V曲線の初期Pの低め解におけるΔV/ΔPが脆弱母線閾値ΔV/ΔP以下でない場合には、ステップS34に戻る。負荷母線を選択しなおし、選択負荷母線のP-V曲線の初期Pの低め解におけるΔV/ΔPが脆弱母線閾値ΔV/ΔP以下である場合には、ステップS38に進む。ステップS38では、ステップS35で選択され、ステップS36、ステップS37でYesと判定された負荷母線を脆弱母線と確定し、脆弱母線計算結果データD7に保存する。その後、ステップS34に戻る。以上のフローにより、全ての過酷シナリオおよび負荷母線を選択し、脆弱母線群を確定する。また、ステップS39では、脆弱母線候補の中で、最もΔV0 が大きい母線を脆弱負荷母線と確定し保存し、フロー終了となる。
The flow of the above processing will be described below. In step S31, the voltage stability calculation result data D4 and threshold data D8 calculated in step S4 for each severe scenario calculated in step S6 are read and read into the memory. In step S32, it is determined whether all severe scenarios have been selected. If all severe scenarios have not been selected, the process proceeds to step S33, and if all severe scenarios have been selected, the process proceeds to step S39. In step S33, one severe scenario is selected. In step S34, it is determined whether all load buses have been selected. If all load buses have not been selected, the process proceeds to step S35, and if all load buses have been selected, the process returns to step S32. In step S35, one load bus is selected. In step S36, it is determined whether or not ΔV 0 of the PV curve of the selected load bus shown in FIG. 13 is equal to or less than the vulnerable bus threshold ΔV 0 . If ΔV 0 of the PV curve is not equal to or less than the weak bus threshold ΔV 0 , the process returns to step S36. If ΔV 0 of the PV curve is less than or equal to the weak bus threshold ΔV 0 , the process proceeds to step S37. In step S37, it is determined whether or not ΔV / ΔP in the lower initial P solution of the PV curve of the selected load bus shown in FIG. 13 is equal to or less than the vulnerable bus threshold ΔV / ΔP. Here, if ΔV / ΔP in the lower initial P solution of the PV curve of the selected load bus is not equal to or less than the vulnerable bus threshold ΔV / ΔP, the process returns to step S34. The load bus is selected again, and if ΔV / ΔP in the lower initial P solution of the PV curve of the selected load bus is equal to or less than the weak bus threshold ΔV / ΔP, the process proceeds to step S38. In step S38, the load bus selected in step S35 and determined as Yes in step S36 and step S37 is determined as a vulnerable bus and stored in the vulnerable bus calculation result data D7. Thereafter, the process returns to step S34. With the above flow, all severe scenarios and load buses are selected, and vulnerable bus groups are determined. In step S39, the bus having the largest ΔV 0 among the vulnerable bus candidates is determined and stored as the vulnerable load bus, and the flow ends.
ここで、図18を用いて、脆弱母線計算の例を説明する。図18は、脆弱母線計算部34のイメージを説明する例である。図18は、横軸に有効電力の総需要P、縦軸にノードiの電圧ViをとったP-V曲線を算出した例である。ノード1と2のP-V曲線が示されており、それぞれの運転点は、(P0、V10)と(P0、V20)となり、それぞれの高め解VUと対となる低め解VLは、(P0、V’10)と(P0、V’20)となる。さらに、電圧安定度の限界である、有効電力限界は、PCの同一箇所である。ノード1の高め解VU=V
10と低め解VL=V’10との差ΔVUL10と、ノード2の高め解VU=V20と低め解VL=V’20との差ΔVUL20がステップS36にて脆弱母線閾値ΔV0と比較される値である。ここで、ΔVUL10とΔVUL20は電圧高め解と低め解の差ΔVULとして(13)式によって、計算できる。 Here, an example of vulnerable bus calculation will be described with reference to FIG. FIG. 18 is an example illustrating an image of the vulnerablebus calculation unit 34. FIG. 18 is an example in which a PV curve is calculated with the total demand P of active power on the horizontal axis and the voltage V i of the node i on the vertical axis. The PV curves of nodes 1 and 2 are shown, and the operating points are (P 0 , V 10 ) and (P 0 , V 20 ), respectively, and lower solutions that are paired with the respective higher solutions V U. V L becomes (P 0 , V ′ 10 ) and (P 0 , V ′ 20 ). Furthermore, the limit of voltage stability, active power limit is same position P C. Node 1's higher solution V U = V
'The difference [Delta] V UL10 and 10,node 2 higher resolution V U = V 20 and low resolution V L = V' 10 and lower resolution V L = V 20 the difference [Delta] V UL20 vulnerable bus threshold [Delta] V in step S36 in A value to be compared with 0 . Here, ΔV UL10 and ΔV UL20 can be calculated by the equation (13) as a difference ΔV UL between the voltage increasing solution and the lower solution.
10と低め解VL=V’10との差ΔVUL10と、ノード2の高め解VU=V20と低め解VL=V’20との差ΔVUL20がステップS36にて脆弱母線閾値ΔV0と比較される値である。ここで、ΔVUL10とΔVUL20は電圧高め解と低め解の差ΔVULとして(13)式によって、計算できる。 Here, an example of vulnerable bus calculation will be described with reference to FIG. FIG. 18 is an example illustrating an image of the vulnerable
'The difference [Delta] V UL10 and 10,
また、ノード1の低め解VL=V’10における接線の傾きdV10/dP0、ノード2の低め解VL=V’20における接線の傾きdV20/dP0がステップS37にて脆弱母線閾値ΔV/ΔPと比較される値である。なお、図18は、総需要Pに対するノードiの電圧ViをとったP-V曲線の際の脆弱母線計算のイメージであるため、各ノードの需要増加に対するノードiの電圧ViをとったP-V曲線である場合は考え方が異なる場合もある。各ノードの需要増加に対するノードiの電圧ViをとったP-V曲線である場合は、例えば、各ノードの需要増加に対する有効電力限界の位置が異なることが考えられる。そこで、運転点と有効電力限界の差が小さいものかつ、図12のフローを満たす負荷母線が脆弱母線として選択できる。図14は、ステップS31’~S38’を通して、図15のV-Q曲線を用いて脆弱母線を確定するフローであり、大きくは図12のステップと同様であるが、ステップS6で計算した各過酷シナリオに対するステップS4で計算した電圧安定度計算結果データD4と閾値データD8を読込み、過酷シナリオをひとつ選択し、負荷母線をひとつ選択し、選択負荷母線のV-Q曲線のΔQが脆弱母線閾値ΔQ以下であるかどうか判定し、V-Q曲線のΔQが脆弱母線閾値ΔQ以下でない場合には、負荷母線を選択しなおし、V-Q曲線のΔQが脆弱母線閾値ΔQ以下である場合には、脆弱母線と確定し、脆弱母線計算結果データD7に保存し、負荷母線を選択しなおす。全ての負荷母線を選択した場合には、過酷シナリオを選択し、同様のフローで脆弱母線を求めるフローを繰り返し、全ての過酷シナリオを選択した場合に、脆弱母線候補の中で、最もΔQ が小さい母線を脆弱負荷母線と確定し保存し、フロー終了となる。
Further, the tangential slope dV 10 / dP 0 at the lower solution V L = V ′ 10 of the node 1 and the tangential slope dV 20 / dP 0 at the lower solution V L = V ′ 20 of the node 2 are weakened in step S37. This value is compared with the threshold value ΔV / ΔP. Incidentally, FIG. 18, since an image of a fragile generatrix calculation when the P-V curve taken voltage V i at the node i to the total demand P, took a voltage V i of the node i for increased demand of each node In the case of a PV curve, the way of thinking may be different. In the case of the PV curve taking the voltage V i of the node i with respect to the increase in demand at each node, for example, the position of the active power limit with respect to the increase in demand at each node may be different. Therefore, a load bus having a small difference between the operating point and the active power limit and satisfying the flow of FIG. 12 can be selected as the weak bus. FIG. 14 is a flow for determining a vulnerable bus using the VQ curve of FIG. 15 through steps S31 ′ to S38 ′, which is largely the same as the step of FIG. 12, but each severe condition calculated in step S6. The voltage stability calculation result data D4 and threshold data D8 calculated in step S4 for the scenario are read, one severe scenario is selected, one load bus is selected, and ΔQ of the VQ curve of the selected load bus is the vulnerable bus threshold ΔQ It is determined whether or not ΔQ of the VQ curve is not less than or equal to the vulnerable bus threshold ΔQ, the load bus is selected again, and if ΔQ of the VQ curve is less than or equal to the vulnerable bus threshold ΔQ, The vulnerable bus is determined, stored in the vulnerable bus calculation result data D7, and the load bus is selected again. When all load buses are selected, the severe scenario is selected, and the flow for obtaining the vulnerable bus is repeated with the same flow. When all the severe scenarios are selected, ΔQ is the smallest among the vulnerable bus candidates. The bus is confirmed as a vulnerable load bus and saved, and the flow ends.
以上の処理の流れを以下で説明する。ステップS31~S35までは、図12と同様に、ステップS31では、ステップS6で計算した各過酷シナリオに対するステップS4で計算した電圧安定度計算結果データD4と閾値データD8を読込み、メモリ14に読込む。ステップS32では、全ての過酷シナリオを選択したかを判定し、全ての過酷シナリオを選択していない場合には、ステップS33に進み、全ての過酷シナリオを選択した場合には、ステップS39’に進む。ステップS33では、過酷シナリオをひとつ選択する。ステップS34では、全ての負荷母線を選択したかを判定し、全ての負荷母線を選択していない場合には、ステップS35に進み、全ての負荷母線を選択した場合には、ステップS32に戻る。ステップS35では、負荷母線をひとつ選択する。ステップS36’では、図15に示す選択負荷母線のV-Q曲線のΔQが脆弱母線閾値ΔQ以下であるかどうか判定する。ここで、V-Q曲線のΔQが脆弱母線閾値ΔQ以下でない場合には、ステップS34に戻る。V-Q曲線のΔQが脆弱母線閾値ΔQ以下である場合には、ステップS38に進む。ステップS38では、ステップS35で選択され、ステップS36’でYesと判定された負荷母線を脆弱母線と確定し、脆弱母線計算結果データD7に保存する。その後、ステップS34に戻る。以上のフローにより、全ての過酷シナリオおよび負荷母線を選択し、脆弱母線群を確定する。また、ステップS39’では、脆弱母線候補の中で、最もΔQ が小さい母線を脆弱負荷母線と確定し保存し、フロー終了となる。
The above processing flow will be described below. From step S31 to S35, as in FIG. 12, in step S31, the voltage stability calculation result data D4 and threshold value data D8 calculated in step S4 for each severe scenario calculated in step S6 are read and read into the memory 14. . In step S32, it is determined whether all severe scenarios have been selected. If all severe scenarios have not been selected, the process proceeds to step S33. If all severe scenarios have been selected, the process proceeds to step S39 ′. . In step S33, one severe scenario is selected. In step S34, it is determined whether all load buses have been selected. If all load buses have not been selected, the process proceeds to step S35, and if all load buses have been selected, the process returns to step S32. In step S35, one load bus is selected. In step S36 ', it is determined whether or not ΔQ of the VQ curve of the selected load bus shown in FIG. 15 is equal to or less than the vulnerable bus threshold ΔQ. Here, if ΔQ of the VQ curve is not equal to or less than the weak bus threshold ΔQ, the process returns to step S34. If ΔQ of the VQ curve is less than or equal to the weak bus threshold ΔQ, the process proceeds to step S38. In step S38, the load bus selected in step S35 and determined as Yes in step S36 'is determined as a vulnerable bus and stored in the vulnerable bus calculation result data D7. Thereafter, the process returns to step S34. With the above flow, all severe scenarios and load buses are selected, and vulnerable bus groups are determined. In step S39 ', the bus with the smallest ΔQ among the vulnerable bus candidates is determined and stored as the vulnerable load bus, and the flow ends.
ここで、図19を用いて、脆弱母線計算の例を説明する。図19は、脆弱母線計算部34のイメージを説明する例である。図18は、横軸にノードiの電圧Vi、縦軸に有効電力の総需要PをとったV-Q曲線を算出した例である。ノード1と2のV-Q曲線が示されており、それぞれの運転点は、(V10、Q10)と(V20、Q20)となる。さらに、電圧安定度の限界である、無効電力限界は、QCはQ1CとQ2Cの箇所である。ノード1と2の無効電力Q=0と無効電力限界QCとの差分であるΔQ1とΔQ2がステップS36’にて脆弱母線閾値ΔQと比較される値である。なお、V-Q曲線では、無効電力限界よりも低い
電圧は、不安定となる。例えば、ノード1では、V1C以下は不安定となり、ノード2では、V2C以下は不安定となる。なお、図19は、総無効電力量Qに対するノードiの電圧ViをとったV-Q曲線の際の脆弱母線計算のイメージであるため、各ノードの無効電力増加に対するノードiの電圧ViをとったV-Q曲線である場合は考え方が異なる場合もある。各ノードの無効電力増加に対するノードiの電圧ViをとったV-Q曲線である場合は、例えば、各ノードの無効電力増加に対する無効電力限界の位置が異なることが考えられる。そこで、運転点と無効電力限界の差が小さいものかつ、図14のフローを満たす負荷母線が脆弱母線として選択できる。なお、図12および図14、そして図18および図19の上記脆弱母線の判定方法や評価方法は、一例を示したものであるが、その他にも例えば、WECC, “Voltage Stability Criteria, Undervoltage Load Shedding Strategy, and Reactive Power Reserve Monitoring Methodology”, Final Report, 1998, pp.33-58や、電力系統安定運用技術専門委員会:「電力系統安定運用技術」、電気協同研究、第47巻、第1号、1991、pp.24-34に記載の判定方法や評価方法などに則して行う。なお、脆弱母線は、限界母線と呼ぶこともでき、電圧安定度の限界の原因となっている母線のことである。この脆弱母線の電圧が低下するために、系統の電圧および無効電力供給が不足し、電圧崩壊に至る。1つの過酷シナリオに対して、脆弱母線は1つとは限らないし、実施例2で後述する発電機の力率制約など電圧・無効電力に関する制約を考慮し実系統に近づけることによって、脆弱母線は移動する可能性もある。また、ステップS4においてP-V曲線やV-Q曲線がそもそも書けず、ステップS5において電圧安定度余裕なし判定され、ステップS6において前記別の方法を用いてランキングされ過酷シナリオとして選択し、さらに、その中でランキングされた母線に関しては、そもそもP-V曲線やV-Q曲線がそもそも書けないため、上記脆弱母線計算が利用できない。そこで、脆弱母線は不明であるが、過酷シナリオだというアラームを表示することで、過酷なシナリオであることを知らせることや、P-V曲線やV-Q曲線を書くための処理、例えば、系統の負荷を軽くするなど、を行った後に、上記脆弱母線計算を利用するということも考えられる。この場合、P-V曲線やV-Q曲線を書くための処理は、P-V曲線やV-Q曲線がそもそも書けない過酷シナリオに対して同時に施すことで、その中で比較ができるようにする。 Here, an example of vulnerable bus calculation will be described with reference to FIG. FIG. 19 is an example illustrating an image of the vulnerablebus calculation unit 34. FIG. 18 is an example of calculating a VQ curve with the horizontal axis representing the voltage V i of the node i and the vertical axis representing the total active power demand P. The VQ curves of nodes 1 and 2 are shown, and the operating points are (V 10 , Q 10 ) and (V 20 , Q 20 ), respectively. Further, the reactive power limit, which is the limit of the voltage stability, is the place where Q C is Q 1C and Q 2C . ΔQ 1 and ΔQ 2, which are the difference between the reactive power Q = 0 of the nodes 1 and 2 and the reactive power limit Q C , are values compared with the vulnerable bus threshold ΔQ in step S36 ′. In the VQ curve, a voltage lower than the reactive power limit becomes unstable. For example, in node 1, V 1C or lower becomes unstable, and in node 2, V 2C or lower becomes unstable. Incidentally, FIG. 19, since an image of a fragile generatrix calculation when the V-Q curve took the voltage V i of the node i to the total amount of reactive power Q, the voltage V i of the node i for reactive power increase of each node In the case of a VQ curve with a difference, the way of thinking may be different. In the case of the VQ curve obtained by taking the voltage V i of the node i with respect to the increase in reactive power at each node, for example, the position of the reactive power limit with respect to the increase in reactive power at each node may be different. Therefore, a load bus having a small difference between the operating point and the reactive power limit and satisfying the flow of FIG. 14 can be selected as the weak bus. In addition, although the determination method and evaluation method of the said weak bus of FIG.12 and FIG.14 and FIG.18 and FIG.19 show an example, in addition, for example, WECC, “Voltage Stability Criteria, Undervoltage Load Shedding Strategy, and Reactive Power Reserve Monitoring Methodology ”, Final Report, 1998, pp.33-58, and Power System Stable Operation Technology Technical Committee:“ Power System Stable Operation Technology ”, Electric Cooperative Research, Vol. 47, No. 1 1991, pp. 24-34, and the like. The vulnerable bus can also be referred to as a limit bus, and is a bus that causes a limit in voltage stability. Since the voltage of the fragile bus decreases, the system voltage and reactive power supply are insufficient, leading to voltage collapse. For one severe scenario, the number of vulnerable buses is not limited to one, and the vulnerable buses can be moved by bringing them closer to the actual system in consideration of constraints on voltage and reactive power, such as the power factor constraint of the generator described later in Example 2. There is also a possibility to do. In addition, the PV curve or the VQ curve cannot be written in step S4 in the first place, it is determined that there is no voltage stability margin in step S5, and it is ranked using the other method in step S6 and selected as a severe scenario. As for the buses ranked among them, the PV curve and the VQ curve cannot be written in the first place, and thus the vulnerable bus calculation cannot be used. Therefore, the vulnerable bus is unknown, but an alarm indicating that it is a severe scenario is displayed to notify that it is a severe scenario, and a process for writing a PV curve or a VQ curve, for example, system It is also conceivable to use the above-mentioned vulnerable bus calculation after reducing the load on the network. In this case, the process for writing the PV curve and the VQ curve is performed simultaneously on a severe scenario where the PV curve and the VQ curve cannot be written at all, so that comparison can be made in the scenario. To do.
電圧は、不安定となる。例えば、ノード1では、V1C以下は不安定となり、ノード2では、V2C以下は不安定となる。なお、図19は、総無効電力量Qに対するノードiの電圧ViをとったV-Q曲線の際の脆弱母線計算のイメージであるため、各ノードの無効電力増加に対するノードiの電圧ViをとったV-Q曲線である場合は考え方が異なる場合もある。各ノードの無効電力増加に対するノードiの電圧ViをとったV-Q曲線である場合は、例えば、各ノードの無効電力増加に対する無効電力限界の位置が異なることが考えられる。そこで、運転点と無効電力限界の差が小さいものかつ、図14のフローを満たす負荷母線が脆弱母線として選択できる。なお、図12および図14、そして図18および図19の上記脆弱母線の判定方法や評価方法は、一例を示したものであるが、その他にも例えば、WECC, “Voltage Stability Criteria, Undervoltage Load Shedding Strategy, and Reactive Power Reserve Monitoring Methodology”, Final Report, 1998, pp.33-58や、電力系統安定運用技術専門委員会:「電力系統安定運用技術」、電気協同研究、第47巻、第1号、1991、pp.24-34に記載の判定方法や評価方法などに則して行う。なお、脆弱母線は、限界母線と呼ぶこともでき、電圧安定度の限界の原因となっている母線のことである。この脆弱母線の電圧が低下するために、系統の電圧および無効電力供給が不足し、電圧崩壊に至る。1つの過酷シナリオに対して、脆弱母線は1つとは限らないし、実施例2で後述する発電機の力率制約など電圧・無効電力に関する制約を考慮し実系統に近づけることによって、脆弱母線は移動する可能性もある。また、ステップS4においてP-V曲線やV-Q曲線がそもそも書けず、ステップS5において電圧安定度余裕なし判定され、ステップS6において前記別の方法を用いてランキングされ過酷シナリオとして選択し、さらに、その中でランキングされた母線に関しては、そもそもP-V曲線やV-Q曲線がそもそも書けないため、上記脆弱母線計算が利用できない。そこで、脆弱母線は不明であるが、過酷シナリオだというアラームを表示することで、過酷なシナリオであることを知らせることや、P-V曲線やV-Q曲線を書くための処理、例えば、系統の負荷を軽くするなど、を行った後に、上記脆弱母線計算を利用するということも考えられる。この場合、P-V曲線やV-Q曲線を書くための処理は、P-V曲線やV-Q曲線がそもそも書けない過酷シナリオに対して同時に施すことで、その中で比較ができるようにする。 Here, an example of vulnerable bus calculation will be described with reference to FIG. FIG. 19 is an example illustrating an image of the vulnerable
ここで、図20を用いて、脆弱母線計算結果の例を説明する。図20は、脆弱母線計算結部34のイメージを説明する例である。図20に示すように、系統図に脆弱母線の位置を表示することによって、運用者が電圧安定度に対し脆弱な母線を把握しやすく、対策の検討が立てやすいという利点がある。さらに、複数の過酷シナリオの脆弱母線を重ねて表示することで、どこが不安定になりやすいか傾向をつかみやすくなるという利点もある。また、外部系統を省略して表示することで、対象系統の電圧安定度に関して視認性を向上することができる。
Here, an example of the vulnerable bus calculation result will be described with reference to FIG. FIG. 20 is an example for explaining an image of the vulnerable bus calculation unit 34. As shown in FIG. 20, by displaying the position of the vulnerable bus in the system diagram, there is an advantage that the operator can easily grasp the vulnerable bus with respect to the voltage stability and can easily consider the countermeasure. Furthermore, by displaying the vulnerable buses of a plurality of severe scenarios in an overlapping manner, there is also an advantage that it is easy to grasp where the tendency is likely to become unstable. Moreover, visibility can be improved regarding the voltage stability of an object system | strain by omitting and displaying an external system | strain.
図6に戻り、ここで、ステップS8では、前記脆弱母線計算結果D7を用いて、脆弱母線や脆弱母線が多い箇所に監視箇所変更する。これによって、運転者が考えていなかった電圧安定度の悪化を予測することができるようになるという効果がある。なお、監視箇所は複数箇所を表示してもよいし、最も脆弱な母線を表示してもよい。各種計算結果や計算途中でメモリに蓄積されるデータは、監視制御装置210の画面に逐次表示されてもよい。これにより、運用者が電圧安定度監視装置10の運用状況を容易に把握できる。また、電圧安定度監視装置10において、運転状況として、監視内容(脆弱母線の発生)などが表示されてもよい。これにより、運用者が電圧安定度監視装置10の運用状況を容易に把握できる。なお、監視箇所変更が実施されるまで、各種データの受信から各種計算結果を夫々送信するまでの状況の画面表示を繰り返す。
Returning to FIG. 6, here, in step S <b> 8, using the vulnerable bus calculation result D <b> 7, the monitoring location is changed to a location where there are many vulnerable buses or vulnerable buses. As a result, there is an effect that it is possible to predict the deterioration of the voltage stability that the driver did not consider. Note that a plurality of monitoring locations may be displayed, or the most vulnerable busbar may be displayed. Various calculation results and data stored in the memory during the calculation may be sequentially displayed on the screen of the monitoring control device 210. Thereby, the operator can easily grasp the operation status of the voltage stability monitoring apparatus 10. Moreover, in the voltage stability monitoring apparatus 10, the monitoring content (occurrence | occurrence | production of a weak bus) etc. may be displayed as an operation condition. Thereby, the operator can easily grasp the operation status of the voltage stability monitoring apparatus 10. Note that the screen display of the situation from reception of various data to transmission of various calculation results is repeated until the monitoring location is changed.
その後、ステップS2のデータの受信ステップに戻ってもよいし、ステップS1のデータの入力処理にもどって、入力データを修正してもよい。
Thereafter, the process may return to the data reception step of step S2, or the input data may be corrected by returning to the data input process of step S1.
ここで、図21を参照する。図21は、電圧安定度監視状況として、電圧安定度計算結果および電圧安定度余裕計算結果を表示する画面の一例を示す図である。図21のように過酷シナリオと現在の電圧安定度の監視状況を電圧安定度監視装置10や通信ネットワーク300を介して監視制御装置210の画面に示すことで、電力系統100の電圧安定度が一目でみてわかる効果がある。また、指定箇所を動かすと各シナリオの電圧値および電圧安定度余裕を表示することで、ユーザが容易にデータを見ることができる機能をもつ。また、電圧余裕を表示することで、運用者が余裕を一目で把握することが可能となる。また、電圧安定度の指標をいくつか選択でき、それぞれの結果および画面上で表示を操作可能な機能をもつ。これにより、電圧安定度の厳しさを容易に評価可能である。また、過去の履歴を選択し、表示を変更可能な機能をもつ。これにより、通常は、各シナリオの脆弱母線を表示しているが、別のノードのP-V曲線を確認することも可能である。
Here, refer to FIG. FIG. 21 is a diagram illustrating an example of a screen that displays a voltage stability calculation result and a voltage stability margin calculation result as the voltage stability monitoring status. As shown in FIG. 21, the monitoring status of the severe scenario and the current voltage stability is shown on the screen of the monitoring control device 210 via the voltage stability monitoring device 10 or the communication network 300, so that the voltage stability of the power system 100 can be seen at a glance. There is an effect that can be seen. In addition, when the designated part is moved, the voltage value and the voltage stability margin of each scenario are displayed, so that the user can easily see the data. Further, by displaying the voltage margin, the operator can grasp the margin at a glance. In addition, it can select several indicators of voltage stability, and has a function that can operate the display on each result and screen. Thereby, the severity of the voltage stability can be easily evaluated. In addition, it has a function to select a past history and change the display. Thus, normally, the vulnerable bus of each scenario is displayed, but it is also possible to confirm the PV curve of another node.
ここで、図22を参照する。図22は、各シナリオ過酷度ランキング結果および脆弱母線系統情報を表示する画面の一例を示す図である。図22のように計算結果である各シナリオ過酷度ランキング結果および脆弱母線系統情報を、電圧安定度監視装置10や通信ネットワーク300を介して監視制御装置210の画面に示すことで、電力系統100の電圧安定度が悪化する過酷シナリオの状況を一目でみてわかる効果がある。また、指定箇所を動かすと各シナリオの電圧安定度余裕を表示、および電圧安定度に関する曲線を別画面で表示することで、ユーザが容易にデータを見ることができる機能をもつ。また、過酷度閾値を示して、過酷シナリオを表示したり、過酷シナリオの番号を表示したりすることで、運用者が過酷シナリオを一目で把握することが可能となる。また、再生可能エネルギーを考慮有無などの条件を設定して、各シナリオ過酷度ランキング結果および脆弱母線系統情報を更新することで、様々な条件の計算結果を容易に把握できるようになる機能をもつ。さらに、各想定変化シナリオを選択し、その時の脆弱母線の箇所を画面上で表示し、内容を見る事ができる機能を持つ。これにより、ひとつ又は複数の脆弱母線の位置を容易に認識可能である。また、過去の履歴を選択し、表示を変更可能な機能をもつ。これにより、通常は、現在の過酷シナリオの脆弱母線を表示しているが、別の想定変化シナリオの脆弱母線を確認することも可能である。また、上記脆弱母線をクリックすることで、同母線のP-V曲線やV-Q曲線を表示することも可能な機能をもつ。これにより、容易に、脆弱母線の電圧安定度を評価した状況を確認することができるようになる利点をもつ。
Here, refer to FIG. FIG. 22 is a diagram illustrating an example of a screen displaying each scenario severity ranking result and vulnerable bus system information. As shown in FIG. 22, each scenario severity ranking result and vulnerable bus system information, which are calculation results, are displayed on the screen of the monitoring control apparatus 210 via the voltage stability monitoring apparatus 10 and the communication network 300, thereby There is an effect that you can see at a glance the situation of a severe scenario where the voltage stability deteriorates. In addition, when the designated location is moved, the voltage stability margin of each scenario is displayed, and a curve relating to the voltage stability is displayed on a separate screen, so that the user can easily see the data. Further, by displaying the severeness threshold and displaying the severe scenario or displaying the severe scenario number, the operator can grasp the severe scenario at a glance. In addition, by setting conditions such as whether or not to consider renewable energy, and updating the scenario severity ranking results and vulnerable bus system information, it has a function that makes it easy to grasp the calculation results of various conditions . In addition, each assumed scenario is selected, the vulnerable bus at that time is displayed on the screen, and the contents can be viewed. As a result, the position of one or a plurality of vulnerable buses can be easily recognized. In addition, it has a function to select a past history and change the display. As a result, the vulnerable bus of the current severe scenario is usually displayed, but it is also possible to confirm the vulnerable bus of another assumed change scenario. In addition, by clicking on the vulnerable bus, it is possible to display a PV curve or a VQ curve of the bus. Thereby, there is an advantage that the situation where the voltage stability of the vulnerable bus is evaluated can be easily confirmed.
本実施例では、実施例1の脆弱母線計算において、単に脆弱母線計算を行うだけでなく脆弱母線が制約データD10に基づいた正確な脆弱母線であるかを判定し、制約データを付加した電圧安定度計算を行うことで、正確な脆弱母線計算を行える電圧安定度監視装置の例を説明する。なお、図1~図22で説明した内容と重複する説明については省略する。
In the present embodiment, in the vulnerable bus calculation of the first embodiment, not only the vulnerable bus calculation but also whether the vulnerable bus is an accurate vulnerable bus based on the constraint data D10, and the voltage stabilization with the constraint data added. An example of a voltage stability monitoring device capable of performing accurate weak bus calculation by performing degree calculation will be described. Note that descriptions overlapping with the contents described in FIGS. 1 to 22 are omitted.
図23は、実施例2における電圧安定度監視装置10の全体構成図の例であり、図1に示した実施例1における電圧安定度監視装置10の全体構成図の例に、制約データD10が加わったものとなっている。図23の電圧安定度監視装置10のうち、既に説明した図1に示された同一の符号を付された構成と、同一の機能を有する部分については、説明を省略する。電圧安定度監視装置10の入力データは、系統データD1と系統設備データD2と想定変化シナリオデータD3と閾値データD8と制約データD10からなる。
FIG. 23 is an example of an overall configuration diagram of the voltage stability monitoring apparatus 10 in the second embodiment. In the example of the entire configuration diagram of the voltage stability monitoring apparatus 10 in the first embodiment shown in FIG. It has been added. In the voltage stability monitoring device 10 of FIG. 23, the description of the components having the same functions as those already described with reference to FIG. 1 is omitted. The input data of the voltage stability monitoring device 10 includes system data D1, system equipment data D2, assumed change scenario data D3, threshold data D8, and constraint data D10.
ここで、図24に、制約データD10の例を示す。制約データD10とは、例えば、各母線の有効電力制約や無効電力制約や力率制約などである(発電機の制約は、ステップS4で考慮済みである)。ここで、上記制約データD10を考慮した、制約データを含む脆弱母線計算のフローを含む電圧安定度監視装置の処理の全体を示すフローチャートの例を図25に示す。
Here, FIG. 24 shows an example of the constraint data D10. The constraint data D10 is, for example, an active power constraint, a reactive power constraint, a power factor constraint, or the like of each bus (generator constraints have already been considered in step S4). Here, FIG. 25 shows an example of a flowchart showing the entire processing of the voltage stability monitoring apparatus including the flow of weak bus calculation including the constraint data in consideration of the constraint data D10.
次に電圧安定度監視装置10の計算処理内容について図25を用いて説明する。図25は図6に制約データD10を考慮したものであるため、図6と同一のステップ部分については、説明を省略する。ステップS1とステップS41、ステップS2とステップS42、ステップS3とステップS43、ステップS4とステップS44、ステップS5とステップS45、ステップS6とステップS46、ステップS7とステップS47、ステップS8とステップS51、についてはそれぞれ同様の内容である。
Next, the calculation processing contents of the voltage stability monitoring apparatus 10 will be described with reference to FIG. Since FIG. 25 considers the constraint data D10 in FIG. 6, the description of the same steps as those in FIG. 6 is omitted. About Step S1 and Step S41, Step S2 and Step S42, Step S3 and Step S43, Step S4 and Step S44, Step S5 and Step S45, Step S6 and Step S46, Step S7 and Step S47, Step S8 and Step S51 Each has the same content.
ステップS48では、ステップS47で計算された全ての脆弱母線が制約データD10を満たすかどうかを確認する。制約データD10を満たさない場合、ステップS49に進み、満たす場合はステップS51に進む。
In step S48, it is confirmed whether or not all the vulnerable buses calculated in step S47 satisfy the constraint data D10. If the constraint data D10 is not satisfied, the process proceeds to step S49. If satisfied, the process proceeds to step S51.
ステップS49では、ステップS47で選択された最も脆弱な母線である最脆弱母線を選択し、ステップS50に進む。
In step S49, the most vulnerable bus that is the most vulnerable bus selected in step S47 is selected, and the process proceeds to step S50.
ステップS50では、ステップS49で選択された最脆弱母線に制約を付け加えて、データを書き直し、ステップS44の計算に戻る。これにより、より現実に近い電力系統の電圧安定性を検討することができる効果がある。実施例1と実施例2の差分を運用者に提示することで、脆弱母線がなぜ計算されたかということを考える助けとなることも考えられる。
In step S50, the most vulnerable bus selected in step S49 is constrained, the data is rewritten, and the process returns to step S44. Thereby, there is an effect that the voltage stability of the power system closer to reality can be examined. Presenting the difference between the first embodiment and the second embodiment to the operator may help to consider why the vulnerable bus is calculated.
本実施例では、実施例1の電圧安定度監視だけでなく電圧安定度監視結果データD41を外部の監視制御装置に送信可能な電圧安定度監視装置の例を説明する。なお、図1~図22で説明した内容と重複する説明については省略する。
In this embodiment, an example of a voltage stability monitoring device capable of transmitting not only the voltage stability monitoring of the first embodiment but also the voltage stability monitoring result data D41 to an external monitoring control device will be described. Note that descriptions overlapping with the contents described in FIGS. 1 to 22 are omitted.
図26は、実施例3における、実施例1の図1に対して閾値データ、データ送信部、および、監視制御装置を加えた電圧安定度監視装置の全体構成図の例である。図26の電圧安定度監視装置10のうち、既に説明した図1に示された同一の符号を付された構成と、同一の機能を有する部分については、説明を省略する。電圧安定度監視装置10で計算された電圧安定度監視計算結果データD41は、データ送信部37を用いて、通信ネットワーク300を介し、監視制御装置210や中央給電指令所やEMSに送信される機能をもつ。これにより、監視制御装置210や中央給電指令所やEMSにおいては、電圧安定度に関する情報をもとに、電圧安定度維持のための制御計画を立案しやすくなるという利点をもつ。
FIG. 26 is an example of an overall configuration diagram of a voltage stability monitoring device according to the third embodiment, in which threshold data, a data transmission unit, and a monitoring control device are added to FIG. 1 of the first embodiment. In the voltage stability monitoring device 10 of FIG. 26, the description of the components having the same functions as those already described with reference to FIG. 1 is omitted. The voltage stability monitoring calculation result data D41 calculated by the voltage stability monitoring device 10 is transmitted to the monitoring control device 210, the central power supply command station, and the EMS via the communication network 300 using the data transmission unit 37. It has. As a result, the supervisory controller 210, the central power supply command center, and the EMS have an advantage that it is easy to make a control plan for maintaining the voltage stability based on the information on the voltage stability.
10:電圧安定度監視装置
11:表示部
12:入力部
13:通信部
14:CPU
15:メモリ
20:制約データ
21:系統計測データ(系統計測データベース)
22:系統設備データ(系統設備データベース)
23:想定変化シナリオデータ(想定変化シナリオデータベース)
24:電圧安定度計算結果データ(電圧安定度計算結果データベース)
25:電圧安定度余裕計算結果データ(電圧安定度余裕計算結果データベース)
26:各シナリオ過酷度ランキング計算結果データ(各シナリオ過酷度ランキング計算結果データベース)
27:脆弱母線計算結果データ(脆弱母線計算結果データベース)
28:閾値データ(閾値データベース)
29:プログラムデータ(プログラムデータベース)
30:想定変化シナリオ計算部
31:電圧安定度計算部
32:電圧安定度余裕計算部
33:各シナリオ過酷度ランキング計算部
34:脆弱母線計算部
35:監視箇所変更部
36:監視箇所表示部
37:データ送信部
40:電圧安定度監視計算部
41:電圧安定度監視計算結果データ(電圧安定度監視計算結果データベース)
43:バス線
44:計測装置
51:系統計測データ
59:監視箇所変更指令データ
100:電力系統
110:電源
120a、120b、121a、121b:ノード(母線)
130a、130b:変圧器
140a、140b、141a、141b:ブランチ(線路)
150:負荷
210:監視制御装置
300:通信ネットワーク
310:電圧安定度監視画面
320:電圧安定度計算結果画面および電圧安定度余裕計算結果画面
330:各シナリオ過酷度ランキング画面
340:脆弱母線系統情報画面
541:電圧安定度監視結果データ 10: Voltage stability monitoring device 11: Display unit 12: Input unit 13: Communication unit 14: CPU
15: Memory 20: Constraint data 21: System measurement data (system measurement database)
22: System facilities data (system facilities database)
23: Assumed change scenario data (assumed change scenario database)
24: Voltage stability calculation result data (voltage stability calculation result database)
25: Voltage stability margin calculation result data (voltage stability margin calculation result database)
26: Each scenario severity ranking calculation result data (each scenario severity ranking calculation result database)
27: Vulnerable bus calculation result data (Vulnerable bus calculation result database)
28: Threshold data (threshold database)
29: Program data (program database)
30: Assumed change scenario calculation unit 31: Voltage stability calculation unit 32: Voltage stability margin calculation unit 33: Each scenario severity ranking calculation unit 34: Vulnerable bus calculation unit 35: Monitoring location change unit 36: Monitoring location display unit 37 : Data transmission unit 40: Voltage stability monitoring calculation calculation unit 41: Voltage stability monitoring calculation result data (voltage stability monitoring calculation result database)
43: Bus line 44: Measuring device 51: System measurement data 59: Monitoring location change command data 100: Power system 110: Power supply 120a, 120b, 121a, 121b: Node (bus)
130a, 130b:transformers 140a, 140b, 141a, 141b: branches (lines)
150: Load 210: Monitoring and control device 300: Communication network 310: Voltage stability monitoring screen 320: Voltage stability calculation result screen and voltage stability margin calculation result screen 330: Each scenario severity ranking screen 340: Vulnerable bus system information screen 541: Voltage stability monitoring result data
11:表示部
12:入力部
13:通信部
14:CPU
15:メモリ
20:制約データ
21:系統計測データ(系統計測データベース)
22:系統設備データ(系統設備データベース)
23:想定変化シナリオデータ(想定変化シナリオデータベース)
24:電圧安定度計算結果データ(電圧安定度計算結果データベース)
25:電圧安定度余裕計算結果データ(電圧安定度余裕計算結果データベース)
26:各シナリオ過酷度ランキング計算結果データ(各シナリオ過酷度ランキング計算結果データベース)
27:脆弱母線計算結果データ(脆弱母線計算結果データベース)
28:閾値データ(閾値データベース)
29:プログラムデータ(プログラムデータベース)
30:想定変化シナリオ計算部
31:電圧安定度計算部
32:電圧安定度余裕計算部
33:各シナリオ過酷度ランキング計算部
34:脆弱母線計算部
35:監視箇所変更部
36:監視箇所表示部
37:データ送信部
40:電圧安定度監視計算部
41:電圧安定度監視計算結果データ(電圧安定度監視計算結果データベース)
43:バス線
44:計測装置
51:系統計測データ
59:監視箇所変更指令データ
100:電力系統
110:電源
120a、120b、121a、121b:ノード(母線)
130a、130b:変圧器
140a、140b、141a、141b:ブランチ(線路)
150:負荷
210:監視制御装置
300:通信ネットワーク
310:電圧安定度監視画面
320:電圧安定度計算結果画面および電圧安定度余裕計算結果画面
330:各シナリオ過酷度ランキング画面
340:脆弱母線系統情報画面
541:電圧安定度監視結果データ 10: Voltage stability monitoring device 11: Display unit 12: Input unit 13: Communication unit 14: CPU
15: Memory 20: Constraint data 21: System measurement data (system measurement database)
22: System facilities data (system facilities database)
23: Assumed change scenario data (assumed change scenario database)
24: Voltage stability calculation result data (voltage stability calculation result database)
25: Voltage stability margin calculation result data (voltage stability margin calculation result database)
26: Each scenario severity ranking calculation result data (each scenario severity ranking calculation result database)
27: Vulnerable bus calculation result data (Vulnerable bus calculation result database)
28: Threshold data (threshold database)
29: Program data (program database)
30: Assumed change scenario calculation unit 31: Voltage stability calculation unit 32: Voltage stability margin calculation unit 33: Each scenario severity ranking calculation unit 34: Vulnerable bus calculation unit 35: Monitoring location change unit 36: Monitoring location display unit 37 : Data transmission unit 40: Voltage stability monitoring calculation calculation unit 41: Voltage stability monitoring calculation result data (voltage stability monitoring calculation result database)
43: Bus line 44: Measuring device 51: System measurement data 59: Monitoring location change command data 100: Power system 110:
130a, 130b:
150: Load 210: Monitoring and control device 300: Communication network 310: Voltage stability monitoring screen 320: Voltage stability calculation result screen and voltage stability margin calculation result screen 330: Each scenario severity ranking screen 340: Vulnerable bus system information screen 541: Voltage stability monitoring result data
Claims (15)
- 電力系統の電圧安定度を監視する電圧安定度監視装置において、
前記電力系統の系統構成又は潮流状態の変化の少なくとも一方に基づき想定される変化のシナリオを示す想定変化シナリオを複数作成する想定変化シナリオ計算部と、
前記想定変化シナリオを用いて前記電圧安定度を計算する電圧安定度計算部と、
前記電圧安定度に基づいて前記電圧安定度の余裕度を示す電圧安定度余裕を計算する電圧安定度余裕計算部と、
前記電圧安定度余裕に基づいて前記想定変化シナリオごとの前記電圧安定度の過酷度が高い想定変化シナリオを選択する各シナリオ過酷度ランキング計算部と、
前記選択された想定変化シナリオに基づき前記電力系統のいずれの母線が電圧安定度を低下させる脆弱母線であるかを計算する脆弱母線計算部と、
前記脆弱母線の情報に基づいて前記電圧安定度の監視対象を変更する監視箇所変更部と、
を備えることを特徴とする電圧安定度監視装置。 In the voltage stability monitoring device that monitors the voltage stability of the power system,
An assumed change scenario calculation unit for creating a plurality of assumed change scenarios indicating a scenario of a change assumed based on at least one of a change in the power system configuration or power flow state;
A voltage stability calculator that calculates the voltage stability using the assumed change scenario;
A voltage stability margin calculation unit for calculating a voltage stability margin indicating a margin of the voltage stability based on the voltage stability;
Each scenario severity ranking calculator that selects an assumed change scenario with a high severity of the voltage stability for each assumed change scenario based on the voltage stability margin;
A vulnerable bus calculation unit that calculates which bus of the power system is a vulnerable bus that reduces voltage stability based on the selected assumed change scenario;
A monitoring point changing unit that changes the monitoring target of the voltage stability based on the information of the vulnerable bus;
A voltage stability monitoring device comprising: - 請求項1に記載の電圧安定度監視装置おいて、
前記想定変化シナリオには、前記電力系統において想定される故障ケースとして故障箇所、故障様相、想定再生可能エネルギー変化量又は故障除去タイミングの内少なくとも一つ含まれ、前記想定再生可能エネルギー変化量として、太陽光発電、風力発電、メガソーラ又はウィンドファームの出力変動量、又はウィンドファームの一斉脱落の内少なくとも一つ含むことを特徴とする電圧安定度監視装置。 In the voltage stability monitoring apparatus according to claim 1,
The assumed change scenario includes at least one of a failure location, a failure aspect, an assumed renewable energy change amount, or a failure removal timing as a failure case assumed in the power system, and the assumed renewable energy change amount is A voltage stability monitoring device comprising at least one of photovoltaic power generation, wind power generation, mega solar or wind farm output fluctuation amount, or simultaneous wind farm loss. - 請求項1に記載の電圧安定度監視装置おいて、
前記電圧安定度計算部は、電力系統の総需要や各ノードの需要に対するノード電圧の変化を計算し、P-V曲線又はV-Q曲線の少なくとも一方を算出することを特徴とする電圧安定度監視装置。 In the voltage stability monitoring apparatus according to claim 1,
The voltage stability calculating unit calculates a change in node voltage with respect to the total demand of the power system and the demand of each node, and calculates at least one of a PV curve or a VQ curve. Monitoring device. - 請求項1に記載の電圧安定度監視装置おいて、
前記電圧安定度計算部で計算するP-V曲線は、潮流計算の繰り返しまたは連続型潮流計算を用いることを特徴とする電圧安定度監視装置。 In the voltage stability monitoring apparatus according to claim 1,
The PV curve calculated by the voltage stability calculation unit uses repetition of power flow calculation or continuous power flow calculation. - 請求項4に記載の電圧安定度監視装置において、
前記連続型潮流計算における予測子計算のステップ幅の制御は、二分探索法又は修正子計算の収束計算回数の少なくとも一方によってステップ幅を増減させる方法で前記ステップ幅を決定することを特徴とする電圧安定度監視装置。 In the voltage stability monitoring apparatus according to claim 4,
Control of the step width of the predictor calculation in the continuous power flow calculation is performed by determining the step width by a method of increasing or decreasing the step width by at least one of the binary search method and the convergence calculation number of the modifier calculation. Stability monitoring device. - 請求項4に記載の電圧安定度監視装置において、
前記連続型潮流計算における電圧低め解が計算完了しなかった場合、予測子計算のステップ幅の制御を、修正子計算の収束計算回数に応じてステップ幅を増減させる指標となる定数を変更して、前記電圧低め解が計算完了するまで再計算することを特徴とする電圧安定度監視装置。 In the voltage stability monitoring apparatus according to claim 4,
If the voltage reduction solution in the continuous power flow calculation is not completed, control the step width of the predictor calculation by changing a constant that serves as an index to increase or decrease the step width according to the number of convergence calculations of the corrector calculation. The voltage stability monitoring device is characterized in that the voltage lowering solution is recalculated until the calculation is completed. - 請求項1に記載の電圧安定度監視装置おいて、
前記電圧安定度余裕計算部は、前記電圧安定度計算部において計算されたP-V曲線やV-Q曲線を用いて、運転点から限界電力までの有効電力偏差又は電圧偏差、又は無効電力が零の点から限界電力までの無効電力偏差、の内少なくとも一つを計算することを特徴とする電圧安定度監視装置。 In the voltage stability monitoring apparatus according to claim 1,
The voltage stability margin calculation unit uses the PV curve or VQ curve calculated by the voltage stability calculation unit to calculate the active power deviation or voltage deviation from the operating point to the limit power, or the reactive power. A voltage stability monitoring device that calculates at least one of reactive power deviations from a zero point to a limit power. - 請求項1に記載の電圧安定度監視装置おいて、
前記各シナリオ過酷度ランキング計算部は、前記想定変化シナリオを前記電圧安定度の昇順に並べ替えることで順位をつけることを特徴とする電圧安定度監視装置。 In the voltage stability monitoring apparatus according to claim 1,
Each of the scenario severity ranking calculation units ranks the assumed change scenarios by rearranging the assumed change scenarios in ascending order of the voltage stability. - 請求項1に記載の電圧安定度監視装置おいて、
前記想定変化シナリオを選択するための前記過酷度の閾値を持つデータベースを更に備えることを特徴とする電圧安定度監視装置。 In the voltage stability monitoring apparatus according to claim 1,
The voltage stability monitoring apparatus further comprising a database having a threshold value of the severity for selecting the assumed change scenario. - 請求項1に記載の電圧安定度監視装置おいて、
前記脆弱母線を選択するための閾値を持つデータベースを更に備えることを特徴とする電圧安定度監視装置。 In the voltage stability monitoring apparatus according to claim 1,
The voltage stability monitoring apparatus further comprising a database having a threshold value for selecting the weak bus. - 請求項1に記載の電圧安定度監視装置おいて、
前記脆弱母線計算部は、前記電圧安定度計算部において計算されたP-V曲線を用いて、運転点における高め解と低め解の電圧偏差又は前記低め解における有効電力に対する電圧変化率の少なくとも一方、及び前記閾値を用いて、前記脆弱母線であることを判定することを特徴とする電圧安定度監視装置。 In the voltage stability monitoring apparatus according to claim 1,
The weak bus calculation unit uses the PV curve calculated by the voltage stability calculation unit to at least one of a voltage deviation between a high solution and a low solution at an operating point or a voltage change rate with respect to active power at the low solution. And the voltage stability monitoring apparatus characterized by determining using the said threshold value that it is the said weak bus-bar. - 請求項1に記載の電圧安定度監視装置おいて、
前記脆弱母線計算部は、前記電圧安定度計算部において計算されたV-Q曲線を用いて、無効電力が零の点から限界電力までの無効電力偏差、及び前記閾値を用いて、前記脆弱母線であることを判定することを特徴とする電圧安定度監視装置。 In the voltage stability monitoring apparatus according to claim 1,
The fragile bus calculation unit uses the VQ curve calculated in the voltage stability calculation unit, the reactive power deviation from a point where the reactive power is zero to a limit power, and the threshold value, and the fragile bus A voltage stability monitoring device characterized by determining that - 請求項1に記載の電圧安定度監視装置おいて、
前記脆弱母線計算部は、運転点における高め解と低め解の電圧偏差、前記低め解における有効電力に対する電圧変化率又は無効電力が零の点から限界電力までの無効電力偏差の内少なくとも一つを用いて、前記脆弱母線の中で最も脆弱である脆弱母線を判定して、表示部に画面表示することを特徴とする電圧安定度監視装置。 In the voltage stability monitoring apparatus according to claim 1,
The fragile bus calculation unit calculates at least one of a voltage deviation between a higher solution and a lower solution at an operating point, a voltage change rate with respect to an active power at the lower solution, or a reactive power deviation from a point where the reactive power is zero to a limit power. A voltage stability monitoring device, characterized in that a vulnerable bus that is most vulnerable among the vulnerable buses is determined and displayed on a display unit. - 請求項1に記載の電圧安定度監視装置おいて、
前記脆弱母線計算で用いられる、各ノードの有効電力制約又は無効電力制約又は力率制約の内少なくとも一つの制約データを持つ制約データベースを備えることを特徴とする電圧安定度監視装置。 In the voltage stability monitoring apparatus according to claim 1,
A voltage stability monitoring apparatus comprising a constraint database having at least one constraint data among active power constraints, reactive power constraints, and power factor constraints of each node used in the weak bus calculation. - 電力系統の電圧安定度を監視する電圧安定度監視方法において、
前記電力系統の系統構成又は潮流状態の変化の少なくとも一方に基づき想定される変化のシナリオを示す想定変化シナリオを複数作成するステップと、
前記想定変化シナリオを用いて前記電圧安定度を計算するステップと、
前記電圧安定度に基づいて前記電圧安定度の余裕度を示す電圧安定度余裕を計算するステップと、
前記電圧安定度余裕に基づいて前記想定変化シナリオごとの前記電圧安定度の過酷度が高い想定変化シナリオを選択するステップと、
前記選択された想定変化シナリオに基づき前記電力系統のいずれの母線が電圧安定度を低下させる脆弱母線であるかを計算するステップと、
前記脆弱母線の情報に基づいて前記電圧安定度の監視対象を変更するステップと、
を備えることを特徴とする電圧安定度監視方法。 In the voltage stability monitoring method for monitoring the voltage stability of the power system,
Creating a plurality of assumed change scenarios indicating a scenario of a change assumed based on at least one of a change in system configuration or power flow state of the power system;
Calculating the voltage stability using the assumed change scenario;
Calculating a voltage stability margin indicating a margin of the voltage stability based on the voltage stability;
Selecting an assumed change scenario with a high severity of the voltage stability for each assumed change scenario based on the voltage stability margin;
Calculating which bus of the power system is a vulnerable bus that reduces voltage stability based on the selected assumed change scenario;
Changing the monitoring target of the voltage stability based on the information of the vulnerable bus;
A voltage stability monitoring method comprising:
Priority Applications (3)
| Application Number | Priority Date | Filing Date | Title |
|---|---|---|---|
| PL15783447T PL3136530T3 (en) | 2014-04-25 | 2015-04-06 | Voltage stability-monitoring device and method |
| US15/306,226 US10473700B2 (en) | 2014-04-25 | 2015-04-06 | Voltage stability monitoring device and method |
| EP15783447.4A EP3136530B1 (en) | 2014-04-25 | 2015-04-06 | Voltage stability-monitoring device and method |
Applications Claiming Priority (2)
| Application Number | Priority Date | Filing Date | Title |
|---|---|---|---|
| JP2014090829A JP6244255B2 (en) | 2014-04-25 | 2014-04-25 | Voltage stability monitoring apparatus and method |
| JP2014-090829 | 2014-04-25 |
Publications (1)
| Publication Number | Publication Date |
|---|---|
| WO2015163121A1 true WO2015163121A1 (en) | 2015-10-29 |
Family
ID=54332288
Family Applications (1)
| Application Number | Title | Priority Date | Filing Date |
|---|---|---|---|
| PCT/JP2015/060690 WO2015163121A1 (en) | 2014-04-25 | 2015-04-06 | Voltage stability-monitoring device and method |
Country Status (5)
| Country | Link |
|---|---|
| US (1) | US10473700B2 (en) |
| EP (1) | EP3136530B1 (en) |
| JP (1) | JP6244255B2 (en) |
| PL (1) | PL3136530T3 (en) |
| WO (1) | WO2015163121A1 (en) |
Cited By (6)
| Publication number | Priority date | Publication date | Assignee | Title |
|---|---|---|---|---|
| CN105406476A (en) * | 2015-12-31 | 2016-03-16 | 国家电网公司 | Historical data-based power system stability fast judging method |
| WO2017104302A1 (en) * | 2015-12-16 | 2017-06-22 | 株式会社日立製作所 | Voltage stability monitoring device and method |
| CN108229071A (en) * | 2018-02-09 | 2018-06-29 | 杭州安脉盛智能技术有限公司 | Cutting performance degradation assessment method and system based on AR models Yu SVDD algorithms |
| WO2018138973A1 (en) * | 2017-01-30 | 2018-08-02 | 株式会社日立製作所 | System operation decision-making assistance device and method |
| JP2018182844A (en) * | 2017-04-07 | 2018-11-15 | 株式会社日立製作所 | Power system stabilization apparatus and power system stabilization method |
| CN110460085A (en) * | 2019-08-28 | 2019-11-15 | 华北电力大学(保定) | A method of consider wind-powered electricity generation and part throttle characteristics to effect on power system |
Families Citing this family (13)
| Publication number | Priority date | Publication date | Assignee | Title |
|---|---|---|---|---|
| JP6397760B2 (en) * | 2014-12-26 | 2018-09-26 | 株式会社日立製作所 | Power system stabilization apparatus and method |
| WO2018011843A1 (en) * | 2016-07-11 | 2018-01-18 | 株式会社日立製作所 | Power grid stabilization system and stabilization method |
| US11770001B2 (en) * | 2016-07-27 | 2023-09-26 | Hitachi, Ltd. | Stability monitoring device and method |
| JP6715740B2 (en) * | 2016-10-13 | 2020-07-01 | 株式会社日立製作所 | Power system power flow monitoring device, power system stabilizing device, and power system power flow monitoring method |
| WO2019097672A1 (en) * | 2017-11-17 | 2019-05-23 | 株式会社日立製作所 | Power system monitoring device, power system monitoring method, and program |
| US10644509B2 (en) * | 2018-08-31 | 2020-05-05 | Avista Corporation | SK analysis techniques |
| JP7098515B2 (en) * | 2018-12-14 | 2022-07-11 | 株式会社東芝 | Power system stabilizer |
| US10767630B1 (en) * | 2019-05-28 | 2020-09-08 | General Electric Company | System and method for operating a wind farm during low wind speeds |
| US20230216294A1 (en) * | 2020-06-10 | 2023-07-06 | Colorado State University Research Foundation | Hybridized transmission switching for contingency management in electric power systems |
| CN114665498A (en) * | 2020-12-23 | 2022-06-24 | 南京邮电大学 | Active power distribution network fragile node identification method considering new energy influence |
| CN113224844B (en) * | 2021-05-19 | 2023-01-24 | 广东电网有限责任公司 | Intelligent sensing method, system and equipment for distribution network bus voltage loss event |
| KR102645381B1 (en) * | 2021-11-12 | 2024-03-11 | 한국에너지기술연구원 | Voltage sensitivity measurement method and measurement device using distributed controller measurement value |
| CN115986746B (en) * | 2022-12-16 | 2024-03-26 | 南方电网数字电网研究院有限公司 | Prediction method and device based on soft sensor, computer equipment and storage medium |
Citations (3)
| Publication number | Priority date | Publication date | Assignee | Title |
|---|---|---|---|---|
| JPH0946935A (en) * | 1995-07-25 | 1997-02-14 | Toshiba Corp | Power line monitoring system |
| JP2001025168A (en) * | 1999-07-09 | 2001-01-26 | Fuji Electric Co Ltd | Method of parallel processing in voltage reliability analysis of power system |
| JP2011115024A (en) * | 2009-11-30 | 2011-06-09 | Mitsubishi Electric Corp | System for monitoring voltage and reactive power |
Family Cites Families (7)
| Publication number | Priority date | Publication date | Assignee | Title |
|---|---|---|---|---|
| WO1995030266A1 (en) * | 1994-04-29 | 1995-11-09 | Michigan State University | Method for performing a voltage stability security assessment for a power transmission system |
| JP2005287128A (en) | 2004-03-29 | 2005-10-13 | Fuji Electric Systems Co Ltd | Power system stability supervisory system |
| KR100576511B1 (en) * | 2004-05-11 | 2006-05-03 | 한국전기연구원 | System and method for calculating real-time voltage stability risk index in power system using time series data |
| GB0712749D0 (en) * | 2007-07-02 | 2007-08-08 | Areva T & D Uk Ltd | Method of determining voltage stability margin for load shedding within an electrical power system |
| US8788244B2 (en) * | 2010-05-24 | 2014-07-22 | Washington State University | Systems and methods for global voltage security assessment in power systems |
| US8941372B2 (en) * | 2011-12-20 | 2015-01-27 | General Electric Company | Systems and methods for predicting power system instability |
| US9876352B2 (en) * | 2013-02-26 | 2018-01-23 | Washington State University | Voltage stability monitoring in power systems |
-
2014
- 2014-04-25 JP JP2014090829A patent/JP6244255B2/en active Active
-
2015
- 2015-04-06 US US15/306,226 patent/US10473700B2/en active Active
- 2015-04-06 EP EP15783447.4A patent/EP3136530B1/en active Active
- 2015-04-06 PL PL15783447T patent/PL3136530T3/en unknown
- 2015-04-06 WO PCT/JP2015/060690 patent/WO2015163121A1/en active Application Filing
Patent Citations (3)
| Publication number | Priority date | Publication date | Assignee | Title |
|---|---|---|---|---|
| JPH0946935A (en) * | 1995-07-25 | 1997-02-14 | Toshiba Corp | Power line monitoring system |
| JP2001025168A (en) * | 1999-07-09 | 2001-01-26 | Fuji Electric Co Ltd | Method of parallel processing in voltage reliability analysis of power system |
| JP2011115024A (en) * | 2009-11-30 | 2011-06-09 | Mitsubishi Electric Corp | System for monitoring voltage and reactive power |
Cited By (12)
| Publication number | Priority date | Publication date | Assignee | Title |
|---|---|---|---|---|
| WO2017104302A1 (en) * | 2015-12-16 | 2017-06-22 | 株式会社日立製作所 | Voltage stability monitoring device and method |
| JP2017112709A (en) * | 2015-12-16 | 2017-06-22 | 株式会社日立製作所 | Voltage stability monitoring device and method |
| EP3392995A4 (en) * | 2015-12-16 | 2019-05-01 | Hitachi, Ltd. | Voltage stability monitoring device and method |
| US11349311B2 (en) | 2015-12-16 | 2022-05-31 | Hitachi, Ltd. | Voltage stability monitoring device and method |
| CN105406476A (en) * | 2015-12-31 | 2016-03-16 | 国家电网公司 | Historical data-based power system stability fast judging method |
| CN105406476B (en) * | 2015-12-31 | 2017-10-13 | 国家电网公司 | Stability of power system quick judgment method based on historical data |
| WO2018138973A1 (en) * | 2017-01-30 | 2018-08-02 | 株式会社日立製作所 | System operation decision-making assistance device and method |
| JP2018182844A (en) * | 2017-04-07 | 2018-11-15 | 株式会社日立製作所 | Power system stabilization apparatus and power system stabilization method |
| EP3609033A4 (en) * | 2017-04-07 | 2020-12-30 | Hitachi, Ltd. | Power system stabilization device and power system stabilization method |
| US11256278B2 (en) | 2017-04-07 | 2022-02-22 | Hitachi, Ltd. | Power system stabilization device and power system stabilization method |
| CN108229071A (en) * | 2018-02-09 | 2018-06-29 | 杭州安脉盛智能技术有限公司 | Cutting performance degradation assessment method and system based on AR models Yu SVDD algorithms |
| CN110460085A (en) * | 2019-08-28 | 2019-11-15 | 华北电力大学(保定) | A method of consider wind-powered electricity generation and part throttle characteristics to effect on power system |
Also Published As
| Publication number | Publication date |
|---|---|
| US20170045558A1 (en) | 2017-02-16 |
| PL3136530T3 (en) | 2018-12-31 |
| US10473700B2 (en) | 2019-11-12 |
| JP6244255B2 (en) | 2017-12-06 |
| EP3136530B1 (en) | 2018-07-25 |
| JP2015211512A (en) | 2015-11-24 |
| EP3136530A1 (en) | 2017-03-01 |
| EP3136530A4 (en) | 2018-01-17 |
Similar Documents
| Publication | Publication Date | Title |
|---|---|---|
| JP6244255B2 (en) | Voltage stability monitoring apparatus and method | |
| JP6726959B2 (en) | Voltage stability monitoring device and method | |
| EP3163706B1 (en) | Voltage stability monitoring device and method | |
| JP6412822B2 (en) | Power system voltage reactive power monitoring and control apparatus and method | |
| Qi et al. | Joint planning of energy storage and transmission for wind energy generation | |
| Leonardi et al. | An approach for real time voltage stability margin control via reactive power reserve sensitivities | |
| US10389133B2 (en) | Device and method for controlling power system | |
| JP6397760B2 (en) | Power system stabilization apparatus and method | |
| JP2018068045A (en) | Voltage reactive power operation support device and support method, and voltage reactive power operation monitoring control device and monitoring control method | |
| WO2022130790A1 (en) | Power system monitoring control device, power system monitoring control system, and power system monitoring control method | |
| KR20130034769A (en) | Reactive power dispatch control device and metho for reserving secure reactive power | |
| JP2018014774A (en) | System optimization calculation device and system optimization calculation method of power distribution system | |
| Abdelaziz et al. | Fuel-saving benefit analysis of islanded microgrid central controllers | |
| CN116316611B (en) | Power supply method and system based on low-voltage transformer area | |
| Liu et al. | Kriging surrogate model enabled heuristic algorithm for coordinated Volt/Var management in active distribution networks | |
| Santos et al. | A novel methodology to determine the reactive power range requirements for wind generators considering the correlation of electricity demand and wind generation | |
| WO2019097672A1 (en) | Power system monitoring device, power system monitoring method, and program | |
| GB2606467A (en) | Renewable energy system stabilization system and system stabilization support method | |
| Dyachenko et al. | Algorithm for the Program of Energy Saving for Power Supply System | |
| JP6996998B2 (en) | Power system monitoring device | |
| JP2015177607A (en) | Countermeasure construction determination device and method for distribution system | |
| Dhadbanjan et al. | Comparison of optimum reactive power schedule with different objectives using lp technique | |
| Putranto | Design of Wide Area Monitoring Systems for Securing Voltage Stability | |
| JP2024006734A (en) | Power system stabilization device and method | |
| Peng et al. | On-line voltage stability assessment strategy considering limit of voltage source |
Legal Events
| Date | Code | Title | Description |
|---|---|---|---|
| 121 | Ep: the epo has been informed by wipo that ep was designated in this application |
Ref document number: 15783447 Country of ref document: EP Kind code of ref document: A1 |
|
| REEP | Request for entry into the european phase |
Ref document number: 2015783447 Country of ref document: EP |
|
| WWE | Wipo information: entry into national phase |
Ref document number: 15306226 Country of ref document: US Ref document number: 2015783447 Country of ref document: EP |
|
| NENP | Non-entry into the national phase |
Ref country code: DE |