WO2012073322A1 - 質量分析データ処理装置 - Google Patents
質量分析データ処理装置 Download PDFInfo
- Publication number
- WO2012073322A1 WO2012073322A1 PCT/JP2010/071337 JP2010071337W WO2012073322A1 WO 2012073322 A1 WO2012073322 A1 WO 2012073322A1 JP 2010071337 W JP2010071337 W JP 2010071337W WO 2012073322 A1 WO2012073322 A1 WO 2012073322A1
- Authority
- WO
- WIPO (PCT)
- Prior art keywords
- peak
- mass
- mass spectrum
- data processing
- saturation
- Prior art date
- Legal status (The legal status is an assumption and is not a legal conclusion. Google has not performed a legal analysis and makes no representation as to the accuracy of the status listed.)
- Ceased
Links
Images


Classifications
-
- H—ELECTRICITY
- H01—ELECTRIC ELEMENTS
- H01J—ELECTRIC DISCHARGE TUBES OR DISCHARGE LAMPS
- H01J49/00—Particle spectrometers or separator tubes
- H01J49/0027—Methods for using particle spectrometers
-
- H—ELECTRICITY
- H01—ELECTRIC ELEMENTS
- H01J—ELECTRIC DISCHARGE TUBES OR DISCHARGE LAMPS
- H01J49/00—Particle spectrometers or separator tubes
- H01J49/0027—Methods for using particle spectrometers
- H01J49/0036—Step by step routines describing the handling of the data generated during a measurement
-
- G—PHYSICS
- G06—COMPUTING OR CALCULATING; COUNTING
- G06F—ELECTRIC DIGITAL DATA PROCESSING
- G06F2218/00—Aspects of pattern recognition specially adapted for signal processing
- G06F2218/08—Feature extraction
- G06F2218/10—Feature extraction by analysing the shape of a waveform, e.g. extracting parameters relating to peaks
Definitions
- the present invention relates to a mass spectrometry data processing apparatus for processing data obtained by a mass spectrometer.
- the compound in a qualitative analysis using a mass spectrometer, the compound is included in the sample by comparing the mass-to-charge ratio of the peak appearing in the mass spectrum obtained by actual measurement on the sample with the molecular weight obtained from the composition formula of the known compound. It is determined whether or not.
- a mass spectrometer having high mass resolution and high mass accuracy such as a time-of-flight mass spectrometer (hereinafter referred to as “TOFMS”)
- TOFMS time-of-flight mass spectrometer
- the monoisotopic mass of the compound can also be used to estimate the structure of the compound.
- the structure of a compound is estimated by using the intensity pattern of the isotope peak appearing in the mass spectrum.
- the mass-to-charge ratio and intensity pattern of the peak on the MS n spectrum obtained by mass analysis of ions generated by dissociating the target ion one or more times. Is used to analyze the structure of high molecular weight compounds such as proteins and peptides.
- the signal When a high-concentration sample is measured with a mass spectrometer, particularly a mass spectrometer with high mass resolution and high mass accuracy, the signal is saturated at the detector or the detection signal from the detector is converted to a digital value.
- the peak intensity may be saturated on the mass spectrum. If such peak intensity saturation occurs, the accuracy of the mass calculated from the position of the center of gravity of the peak waveform may deteriorate, and the reproducibility of the isotope peak pattern appearing on the mass spectrum may deteriorate. There is.
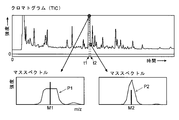
- FIG. 3 (a) is a chromatogram (total ion chromatogram) obtained by a conventional liquid chromatograph mass spectrometer (LC / MS), and FIG. 3 (b) is derived from the same component in FIG. 3 (a). It is a mass spectrum at time t1 and time t2 within the time range of one peak. In the mass spectrum corresponding to the time t1 near the peak top on the chromatogram, the peak P1 derived from the target component is saturated. In such a state, the mass-to-charge ratio M1 calculated from the peak P1 will deviate from the mass-to-charge ratio M2 calculated from the peak P2 on the mass spectrum corresponding to the time t2 when no saturation occurs. When such a decrease in mass accuracy occurs, it may be difficult to identify a compound based on a mass spectrum, or may cause erroneous identification.
- LC / MS liquid chromatograph mass spectrometer
- the most common method for avoiding the above troubles when measuring a high-concentration sample is to dilute the sample and adjust the sample introduction amount, and then re-measure the sample.
- such a method cannot be adopted when there is no sample to be remeasured, and is not an appropriate method even when the sample is very precious and expensive.
- Non-Patent Document 1 discloses that when the sample concentration is high in an ion trap time-of-flight mass spectrometer, the amount of ions used for mass analysis is reduced by shortening the ion accumulation time in the ion trap, thereby saturating the peak intensity. A method for avoiding this is disclosed. Further, in Patent Document 1, in the MALDI time-of-flight mass spectrometer, when it is detected that the amount of ion generation is excessive based on the potential change generated in the sample plate, the ion passage efficiency in the ion lens is lowered. Thus, a method for avoiding saturation of peak intensity by controlling the lens voltage and reducing the amount of ions used for mass spectrometry is disclosed.
- the method of reducing the amount of ions used for mass spectrometry is certainly effective in avoiding saturation of peak intensity.
- the former method since the sensitivity to all ions accumulated in the ion trap in one cycle is lowered, a low concentration component exists in a position close to the high concentration component in time on the chromatogram. In such a case, the sensitivity may be lowered even for the low-concentration component, and it may not be detected. Even in the latter method, it is inevitable that the sensitivity of ions corresponding to a specific high-concentration component to the ions trying to pass through the ion lens before and after passing through the ion lens results in detection leakage. There is a fear. In any of the methods, if appropriate control is performed in response to various factors such as the type of sample to be analyzed and measurement conditions, the control becomes complicated.
- the present invention has been made to solve the above-mentioned problems, and its main object is to influence the saturation of mass spectrum (including MS n spectrum) peak intensity by data processing without depending on addition or control of hardware. It is an object of the present invention to provide a mass spectrometry data processing apparatus that can accurately obtain a mass-to-charge ratio corresponding to a peak where saturation occurs.
- Another object of the present invention is to produce an extracted ion chromatogram with high accuracy in the mass-to-charge ratio of ions derived from the component even when the sample component concentration is high and the peak intensity is saturated on the mass spectrum.
- An object of the present invention is to provide a mass spectrometric data processing apparatus capable of performing the above.
- the present invention made to solve the above problems is a mass spectrometry data processing apparatus for processing data collected by a mass spectrometer, a) Peak waveform estimation for estimating a peak waveform shape without saturation on a peak waveform with a peak top saturated on a mass spectrum based on the data, based on data of an inclined portion of the bottom of the peak waveform Means, b) Approximate spectrum creation means for creating a mass spectrum using the peak waveform shape estimated by the peak waveform estimation means instead of the peak where the peak top is saturated; It is characterized by having.
- the type of mass spectrometry apparatus from which data to be processed is acquired is not particularly limited.
- a time-of-flight mass spectrometer, a quadrupole mass spectrometer, a sector (magnetic field) Type mass spectrometers, FT-ICR type mass spectrometers, and the like can be used.
- the present invention is useful for mass spectrometers that have high mass resolution and high mass accuracy, such as time-of-flight mass spectrometers. is there.
- data to be processed is data collected by performing mass scanning substantially at least once over a predetermined mass range in the mass spectrometer.
- the peak waveform estimation means extracts the peak where the peak top is saturated on the mass spectrum based on the data, and extracts the extracted peak. Based on a plurality of data included in the bottom slope portion of the peak waveform, that is, the leading portion and the tailing portion, the peak waveform shape without saturation is estimated.
- the peak waveform shape without saturation is estimated.
- fitting according to a multidimensional expression such as a two-dimensional expression or fitting according to a Gaussian distribution (normal distribution) can be used. Creates an approximate mass spectrum using the peak waveform shape estimated by the peak waveform estimation means in place of the peak where the peak top is saturated on the original mass spectrum. That is, there is no peak top saturation on the approximate mass spectrum created here.
- the peak whose peak top is not saturated on the original mass spectrum is the same as the original mass spectrum, and only the peak whose peak top is saturated on the original mass spectrum is estimated.
- the peak of the approximate shape obtained by is reflected. Since the ideal peak shape on the mass spectrum should follow a normal distribution, the peak top position of the peak of the approximate shape is quite close to the peak top position when there is no saturation. Therefore, by using such an approximate mass spectrum, the accuracy of the mass-to-charge ratio of the peak is improved, and the accuracy of the isotope pattern fitting using the mass spectrum and the matching with the monoisotopic mass is also improved. Further, by performing, for example, centroid processing on such approximate mass spectrum, a highly accurate centroid peak can be obtained.
- the approximate mass spectrum created by the approximate spectrum creation means as described above can be displayed on the display screen.
- the drawing may be performed by changing the line color, the line type, or the like so that the peak waveform portion based on the whole or the entire peak including the peak waveform portion can be identified. Further, not only the approximate peak obtained by estimation on the approximate mass spectrum but also a saturated actually measured peak waveform may be drawn together.
- the analyst can know that the peak is actually saturated, and can know that the displayed peak is not an actual measurement result but an estimation result.
- the analyst can take appropriate measures such as diluting the sample and performing remeasurement as necessary (for example, it is necessary to obtain an actual measurement result instead of estimation).
- the mass spectrometry data processing apparatus processes data collected by the chromatographic mass spectrometer, the spectrum creation means is obtained at each time according to the passage of time of the chromatographic analysis.
- a configuration may be further provided with a chromatogram creating means for creating a chromatogram (extracted ion chromatogram) at a specific mass-to-charge ratio based on the created mass spectrum using the approximate peak waveform shape.
- the extracted ion chromatogram at the mass-to-charge ratio corresponding to the sample component is more accurate. Can be displayed.
- the accuracy and reproducibility of the peak area value (integrated value) are improved.
- the mass spectrometry data processing apparatus of the present invention when measuring a high-concentration sample, the measurement control in the mass spectrometer is changed in order to avoid saturation of the peak on the mass spectrum.
- the measurement control in the mass spectrometer is changed in order to avoid saturation of the peak on the mass spectrum.
- mass-to-charge ratios can be obtained with high accuracy even for high-concentration sample components, and isotopic peak patterns appearing on the mass spectrum and matching with monoisotopic mass can be performed accurately.
- the accuracy of compound identification and mass structure estimation using mass spectrum is improved.
- the quantitative property using the peak area value (integrated value) is also improved.
- the mass spectrometry data processing apparatus when the mass spectrometry data processing apparatus according to the present invention is applied to a chromatograph mass spectrometer such as a gas chromatograph mass spectrometer or a liquid chromatograph mass spectrometer, the mass spectrum data on the mass spectrum due to the high concentration of the sample components It is possible to reduce the influence of peak saturation and to create and display highly accurate extracted ion chromatograms and total ion chromatograms.
- FIG. 1 is a schematic block configuration diagram of an embodiment of an LC / MS analysis system including a mass spectrometry data processing apparatus according to the present invention.
- FIG. 1 is a schematic block diagram of the LC / MS analysis system according to this embodiment
- FIG. 2 is an explanatory diagram of the saturation peak estimation reproduction processing operation in the LC / MS analysis system of this embodiment.
- This LC / MS analysis system includes a liquid chromatograph (LC) 1 that separates a sample to be analyzed for each component, and an ion trap time-of-flight mass spectrometer that performs mass analysis on each separated component ( IT-TOFMS) 2, data processing unit 3 for processing the detection signal obtained by the detector 21 of IT-TOFMS 2, control unit 4 for controlling the operation of each unit, and input unit for setting analysis conditions and the like 5 and a display unit 6 for displaying analysis results and the like.
- LC liquid chromatograph
- IT-TOFMS ion trap time-of-flight mass spectrometer
- the IT-TOFMS 2 includes, in addition to the detector 21, an atmospheric pressure ion source using an electrospray ion method, an ion trap, a time-of-flight mass analyzer, and the like.
- the data processing unit 3 includes functional blocks such as a data collection unit 31, a saturation peak determination unit 32, a saturation peak estimation reproduction unit 33, a mass spectrum creation unit 34, and a modified chromatogram creation unit 35. It should be noted that most of the functions of the data processing unit 3 and the control unit 4 can be realized by a personal computer equipped with predetermined control / processing software.
- LC / MS analysis system when a sample to be analyzed is introduced into LC1, various components contained in the sample are temporally separated while passing through the column included in LC1, and from the column outlet. Elute sequentially.
- the sample components in the eluate introduced from LC1 to IT-TOFMS2 are ionized by the atmospheric pressure ion source, and the generated ions are temporarily accumulated in the ion trap.
- the ions accumulated for a certain period of time are given a certain amount of energy in the ion trap and sent to the time-of-flight mass analyzer, which is separated according to the mass-to-charge ratio (m / z) while flying in the flight space. 21 is reached.
- the detection signal obtained by the detector 21 of the IT-TOFMS 2 is an intensity signal corresponding to the time of flight required for each ion to fly through the time-of-flight mass analyzer.
- the data collection unit 31 converts the detection signal sent from the detector 21 of the IT-TOFMS 2 into a digital value, and further converts the flight time corresponding to each detection signal into a mass-to-charge ratio.
- profile data representing the relationship between the mass-to-charge ratio and the intensity signal is obtained, and this profile data is stored in the data memory.
- the data collection unit 31 calculates a signal intensity that does not depend on the mass-to-charge ratio based on data obtained corresponding to, for example, one mass analysis operation (that is, over a predetermined mass range), and thereby the total ion A chromatogram is created and sent to the control unit 4, and the control unit 4 renders the total ion chromatogram on the screen of the display unit 6 almost in real time.
- the saturation peak determination unit 32 When profile data over a predetermined mass range is passed from the data collection unit 31 to the saturation peak determination unit 32, the saturation peak determination unit 32 has a peak whose peak top is saturated on the mass spectrum created based on the profile data. Determine whether or not. Specifically, for example, the saturation peak determination unit 32 finds a pair of a peak leading part and a tailing part by examining the value of each data in a direction in which the mass-to-charge ratio increases, and the pair of leading part and tailing part It can be determined that the peak is saturated when the value of the data in the portion sandwiched between is substantially constant for a predetermined period.
- the method for detecting the saturation of the peak top is not limited to this.
- the saturation peak estimation reproduction unit 33 when there is a peak in a state where the peak top is saturated, the saturation peak estimation reproduction unit 33 performs the leading and tailing portions of the peak (A in FIG. 2 (a)). 2), the peak shape of the saturated portion (waveform B in FIG. 2B) is estimated based on the values of a plurality of data included in each range.
- the shape of the peak appearing in the mass spectrum is not affected by the mobile phase sent from the LC1, there is no baseline drift due to changes in analysis conditions, etc., there is no noise, or the influence of contaminants in the sample. In an ideal state such as no, it is reasonable to consider that it follows a normal distribution. Therefore, for example, the saturation peak estimation reproduction unit 33 obtains a target approximate peak shape by performing fitting with a Gaussian function using a plurality of data respectively included in the peak reading part and the tailing part. can do.
- the mass spectrum creation unit 34 receives data constituting the approximate peak waveform estimated by the saturation peak estimation reproduction unit 33, and creates a mass spectrum in which the saturated peak is replaced with this approximate peak waveform. In addition, the mass spectrum creation unit 34 performs centroid processing on the mass spectrum in which the saturation peak disappears as described above, calculates the barycentric position of the peak, and obtains the mass-to-charge ratio of the peak.
- the corrected chromatogram creation unit 35 is based on the mass spectrum in which the saturation peak is replaced with the approximate peak as described above for all the mass spectra obtained with the passage of time after the sample is injected into the LC1. Create extracted ion chromatograms and total ion chromatograms. Therefore, the extracted ion chromatogram and the total ion chromatogram created at this time have almost no influence of peak saturation in the profile data.
- the control unit 4 In response to a request from the analyst via the input unit 5, the control unit 4 generates a mass spectrum without peak saturation created by the mass spectrum creation unit 34 or a modified chromatogram creation unit 35 as described above. An extracted ion chromatogram or a total ion chromatogram that hardly affects the peak saturation is displayed on the screen of the display unit 6.
- the approximate peak obtained by estimation may be drawn using, for example, different line colors or line types so that it can be distinguished from other peaks, that is, peaks based on actual measurement.
- the analyst can easily recognize that peak saturation has occurred, and can easily know which peak is based on the estimation and the accuracy of the mass-to-charge ratio may be slightly inferior. it can.
- the mass spectrum without peak saturation created by the mass spectrum creation unit 34 is used.
- the accuracy of the mass-to-charge ratio corresponding to the peak is improved as compared with the case where the mass spectrum in which the peak is saturated as shown in FIG.
- the accuracy is improved and, for example, in the qualitative analysis, identification omission and misidentification can be reduced.
- the extracted ion chromatogram created by the modified chromatogram creation unit 35 is used to calculate the peak area value (integral value) corresponding to the retention time of the target component.
- the quantitative value is obtained from the area value by calculation. Since the accuracy of the peak area value itself is higher than in the past, the quantitative accuracy is also improved.
- a peak whose peak top is saturated on the mass spectrum is a processing target.
- the mass spectrometer is an MS n type
- a peak whose peak top is saturated on the MS n spectrum is used.
- the present invention can be applied not only to data obtained by a mass spectrometer having a chromatograph connected to the preceding stage, but also to processing of data obtained by a single mass spectrometer.
Landscapes
- Chemical & Material Sciences (AREA)
- Analytical Chemistry (AREA)
- Other Investigation Or Analysis Of Materials By Electrical Means (AREA)
Abstract
検出器やその後段の増幅器における信号飽和等でマススペクトル上のピークが飽和した場合に、データ処理部はそのピークの飽和の影響のないリーディング部及びテーリング部(範囲A)に含まれるデータを用いてガウス関数によるフィッティングを行うことにより、目的とする近似的なピーク形状Bを求める。そして、飽和ピークを上記のように求めた近似ピークに置き換えたマススペクトルを作成し、このマススペクトルに対しピークトップの質量電荷比を算出した上で該マススペクトルを表示画面上に表示する。さらに、その修正されたマススペクトルの質量電荷比対強度情報に基づいて抽出イオンクロマトグラムを作成して表示する。これにより、ピーク飽和があった場合でも該ピークに対する質量電荷比の精度が向上し、マススペクトルを利用した同定、化合物構造推定の精度、或いはピーク面積値(積分値)による定量性が向上する。
Description
本発明は、質量分析装置で得られたデータを処理する質量分析データ処理装置に関する。
一般に質量分析装置を用いた定性分析では、試料に対する実測により得られたマススペクトルに現れるピークの質量電荷比を既知の化合物の組成式から求まる分子量と比較することにより、試料中にその化合物が含まれているか否かが判断される。また、飛行時間型質量分析装置(以下「TOFMS」と略す)など、高質量分解能、高質量精度である質量分析装置を用いた分析では、実測により得られたマススペクトルに現れるピークの質量電荷比と化合物のモノアイソトピック質量とを比較することで、化合物の構造を推定することもできる。さらにまた、マススペクトルに現れている同位体ピークの強度パターンを利用することで、化合物の構造を推定することも行われている。さらにまた、MSn型質量分析装置を用いた分析では、目的のイオンを1乃至複数回解離させて生成したイオンを質量分析して得られたMSnスペクトル上のピークの質量電荷比や強度パターンを利用して、タンパク質やペプチドなどの高分子量の化合物の構造解析が行われている。
質量分析装置、特に高質量分解能、高質量精度である質量分析装置で高濃度の試料を測定した場合、検出器において信号が飽和したり、或いは、検出器からの検出信号をデジタル値に変換するアナログ/デジタル変換器や時間/デジタル変換器などにおいて入力信号が入力レンジを外れてしまったりした結果、マススペクトル上でピーク強度が飽和してしまうことがある。このようなピーク強度の飽和が起こると、それによって該ピーク波形の重心位置等から算出される質量の精度が悪化したり、マススペクトル上に現れる同位体ピークパターンの再現性が悪化したりするおそれがある。
図3(a)は従来の液体クロマトグラフ質量分析装置(LC/MS)で取得したクロマトグラム(トータルイオンクロマトグラム)であり、図3(b)は図3(a)中の同一成分由来の1つのピークの時間範囲内における時刻t1と時刻t2とのマススペクトルである。クロマトグラム上のピークトップ付近の時刻t1に対応したマススペクトルでは、目的成分由来のピークP1が飽和してしまっている。このような状態では、ピークP1から計算される質量電荷比M1は、飽和が生じていない時刻t2に対応したマススペクトル上のピークP2から計算される質量電荷比M2からずれてしまうことになる。こうした質量精度の低下が起こると、マススペクトルに基づく化合物の同定が困難になる、或いは誤同定を引き起こすおそれがある。
上記のような高濃度試料測定時の不具合を避けるために最も一般的な方法は、試料の希釈や試料導入量の調整を行って同試料を再測定することである。しかしながら、再測定する試料がない場合にはこうした方法は採用できず、試料が非常に貴重で高価である場合にも適切な方法ではない。
非特許文献1には、イオントラップ飛行時間型質量分析装置において試料濃度が高い場合に、イオントラップでのイオン蓄積時間を短くすることで質量分析に供するイオン量を減らし、それによってピーク強度の飽和を回避する方法が開示されている。また、特許文献1には、MALDI飛行時間型質量分析装置において、サンプルプレートに生じる電位変化に基づいてイオン生成量が過剰であることが検知された場合に、イオンレンズでのイオン通過効率を下げるようにレンズ電圧を制御し、質量分析に供するイオン量を減らすことでピーク強度の飽和を回避する方法が開示されている。
上述したように質量分析に供するイオン量を減らす方法は確かにピーク強度の飽和を回避するには有効である。しかしながら、例えば前者の方法では、1回のサイクルでイオントラップに蓄積される全てのイオンに対する感度が下がることになるため、クロマトグラム上で高濃度成分と時間的に近い位置に低濃度成分が存在した場合に、その低濃度成分に対しても感度が下がり、検出されなくなるおそれがある。また、後者の方法でも、特定の高濃度成分に対応するイオンがイオンレンズを通過する前後に該イオンレンズを通過しようとするイオンに対しても感度が下がることが避けられず、検出漏れが生じるおそれがある。また、いずれの方法でも、分析対象の試料の種類や測定条件など様々な要素に対応して適切な制御を行おうとすると制御が複雑になる。
「LCMS-IT-TOFによる高濃度サンプルの精密質量測定 テクニカル・レポート No.27」、[online]、株式会社島津製作所、 [平成22年11月18日検索]、インターネット<URL : https://solutions.shimadzu.co.jp/solnavi/n/pdf/prominencerep/lc27.pdf>
本発明は上記課題を解決するためになされたものであり、その主な目的は、ハードウエアの付加や制御に依らず、データ処理によってマススペクトル(MSnスペクトルを含む)ピーク強度の飽和の影響を軽減して、飽和が生じたピークに対応する質量電荷比を精度良く求めることができる質量分析データ処理装置を提供することにある。
また、本発明の別の目的は、試料成分濃度が高くマススペクトル上でピーク強度の飽和が生じるような場合でも、該成分由来のイオンの質量電荷比における抽出イオンクロマトグラムを高い精度で作成することができる質量分析データ処理装置を提供することにある。
上記課題を解決するために成された本発明は、質量分析装置で収集されたデータを処理する質量分析データ処理装置であって、
a)前記データに基づくマススペクトル上でピークトップが飽和しているピーク波形について、該ピーク波形の裾の傾斜部分のデータに基づいて、前記飽和がない状態のピーク波形形状を推定するピーク波形推定手段と、
b)ピークトップが飽和しているピークに代えて前記ピーク波形推定手段により推定されたピーク波形形状を用いたマススペクトルを作成する近似スペクトル作成手段と、
を備えることを特徴としている。
a)前記データに基づくマススペクトル上でピークトップが飽和しているピーク波形について、該ピーク波形の裾の傾斜部分のデータに基づいて、前記飽和がない状態のピーク波形形状を推定するピーク波形推定手段と、
b)ピークトップが飽和しているピークに代えて前記ピーク波形推定手段により推定されたピーク波形形状を用いたマススペクトルを作成する近似スペクトル作成手段と、
を備えることを特徴としている。
本発明に係る質量分析データ処理装置において、処理対象であるデータが取得される質量分析装置のタイプは特に問わず、例えば飛行時間型質量分析装置、四重極型質量分析装置、セクター(磁場)型質量分析装置、FT-ICR型質量分析装置などを用いることができるが、特に、本発明は飛行時間型質量分析装置等の高質量分解能、高質量精度を誇るタイプの質量分析装置に有用である。また、複数の質量分析器が組み合わされたハイブリッドタイプの装置(例えば、IT-TOF、三連四重極、Q-TOF等)に用いてもよい。また、本発明において処理対象のデータは、少なくとも1回、質量分析装置において所定の質量範囲に亘り実質的に質量走査がなされることにより収集されたデータである。
本発明に係る質量分析データ処理装置では、上述したようなデータが与えられると、ピーク波形推定手段はそれらデータに基づいてマススペクトル上でピークトップが飽和しているピークを抽出し、その抽出したピーク波形の裾の傾斜部分、つまりリーディング部とテーリング部に含まれる複数のデータに基づいて、飽和がない状態のピーク波形形状を推定する。具体的な一態様として、ピーク波形形状を推定するために、二次元式のような多次元式に従ったフィッティングやガウス分布(正規分布)に従ったフィッティングを用いることができる、近似スペクトル作成手段は、元のマススペクトル上ではピークトップが飽和しているピークに代えてピーク波形推定手段により推定されたピーク波形形状を用いた近似マススペクトルを作成する。即ち、ここで作成される近似マススペクトル上ではピークトップの飽和はない。
この近似マススペクトルにおいては、元のマススペクトル上でピークトップが飽和していないピークについては元のマススペクトルと同じであり、元のマススペクトル上でピークトップが飽和しているピークについてのみ、推定により求められた近似形状のピークが反映される。マススペクトル上においても理想的なピーク形状は正規分布に従う筈であるから、近似形状のピークのピークトップの位置は、仮に飽和が無かったとしたときのピークトップの位置にかなり近い。したがって、このような近似マススペクトルを用いることによって、ピークの質量電荷比の精度が上がり、マススペクトルを利用した同位体パターンのフィッティングやモノアイソトピック質量との照合の精度も向上する。また、このような近似マススペクトルに例えばセントロイド処理を行うことにより、精度の高いセントロイドピークを求めることができる。
本発明に係る質量分析データ処理装置では、上述のように近似スペクトル作成手段により作成された近似マススペクトルを表示画面上に表示することができるが、好ましくは、その際にピーク推定手段による推定に基づくピーク波形部分又は該ピーク波形部分を含む該ピーク全体と、それ以外の部分とが識別可能であるように、例えば線色や線種などを変えて描画するとよい。また、近似マススペクトル上で推定により得られた近似ピークだけでなく、飽和した実測のピーク波形も併せて描画するようにしてもよい。
これにより、分析者(オペレータ)は実際にはピークが飽和していることを知ることができるとともに、表示されているピークが実測の結果ではなく推定によるものであることを知ることができ、例えば分析者は必要に応じ(例えば推定ではなくあくまで実測の結果を求める必要がある等)試料を希釈する等して再測定を行うといった適切な対応を採ることができる。
また本発明に係る質量分析データ処理装置が、クロマトグラフ質量分析装置で収集されたデータを処理するものである場合に、クロマトグラフ分析の時間経過に従って各時刻毎に得られる、前記スペクトル作成手段により作成された近似ピーク波形形状を用いたマススペクトルに基づいて、特定の質量電荷比におけるクロマトグラム(抽出イオンクロマトグラム)を作成するクロマトグラム作成手段をさらに備える構成とすることができる。
この構成によれば、従来であれば抽出イオンクロマトグラム上でピークが飽和してしまうような高濃度試料を測定した場合でも、その試料成分に対応した質量電荷比における抽出イオンクロマトグラムをより正確に表示させることができる。これにより、抽出イオンクロマトグラム上でピークが出現する保持時間をより正確に特定することができ、この保持時間に基づく成分同定やマススペクトルを利用した同定の正確性の評価などの精度を向上させることができる。また、ピーク面積値(積分値)の精度や再現性が向上する。
本発明に係る質量分析データ処理装置によれば、高濃度の試料を測定する場合に、マススペクトル上でのピークの飽和を回避するために質量分析装置における測定上の制御の変更などを行うことなく、また試料の希釈などを伴う再測定を行うこともなく、或る程度十分な精度の確保されたマススペクトルを作成することができる。それによって、高濃度試料成分についても高い精度で質量電荷比を求めることができるとともに、マススペクトル上に現れる同位体ピークパターンのフィッティングやモノアイソトピック質量との照合などが正確に行えるようになり、マススペクトルを利用した化合物の同定や化合物の構造推定などの正確性が向上する。また、ピーク面積値(積分値)を利用した定量性も向上する。
また従来は、測定実行前に試料濃度が高いことが既知である場合にはピーク飽和が生じないように試料を希釈する等の前処理を行うのが一般的であったが、そうすると、試料中に含まれる低濃度の別の成分の濃度が低くなりすぎて検出できなくなるおそれがあった。そのため、濃度差が大きな複数の成分が試料に含まれる場合には、従来であれば、各成分濃度に合わせて複数回の測定が必要であった。これに対し、本発明に係る質量分析データ処理装置によれば、1回の測定によって得られたデータに基づいて、飽和することなく且つ十分に観測可能な強度のピークトップを有するピークがそれら複数の成分に対応して現れる1乃至複数のマススペクトルを取得することができる。それによって、複数回の測定を行う必要がなく、また1回の測定における低濃度の試料成分の検出見逃しを防止することもできる。さらにまた、1回の測定だけで、そうした複数の成分のおおよその強度比などを簡便に知ることができる。
また本発明に係る質量分析データ処理装置をガスクロマトグラフ質量分析装置、液体クロマトグラフ質量分析装置等のクロマトグラフ質量分析装置に適用した場合、試料成分の高濃度であることに起因するマススペクトル上でのピークの飽和の影響を軽減し、正確性の高い抽出イオンクロマトグラムやトータルイオンクロマトグラムを作成・表示することができる。
本発明に係る質量分析データ処理装置を備えるLC/MS分析システムの一実施例について以下に説明する。図1はこの実施例によるLC/MS分析システムの概略ブロック構成図、図2は本実施例のLC/MS分析システムにおける飽和ピーク推定再現処理動作の説明図である。
このLC/MS分析システムは、分析対象である試料を成分毎に分離する液体クロマトグラフ(LC)1と、分離された各成分に対して質量分析を実行するイオントラップ飛行時間型質量分析計(IT-TOFMS)2と、IT-TOFMS2の検出器21で得られた検出信号を処理するデータ処理部3と、各部の動作を制御する制御部4と、分析条件等を設定するための入力部5と、分析結果等を表示するための表示部6と、を備える。
図示しないが、IT-TOFMS2は、検出器21のほかに、エレクトロスプレイイオン法等を用いた大気圧イオン源、イオントラップ、飛行時間型質量分析器等を備える。データ処理部3は、データ収集部31、飽和ピーク判定部32、飽和ピーク推定再現部33、マススペクトル作成部34、修正クロマトグラム作成部35などの機能ブロックを含む。なお、データ処理部3及び制御部4の機能の大部分は、所定の制御/処理ソフトウエアを搭載したパーソナルコンピュータにより具現化することができる。
本実施例のLC/MS分析システムにおいて、分析対象である試料がLC1に導入されると、該試料に含まれる各種成分はLC1が備えるカラムを通過する間に時間的に分離され、カラム出口から順次溶出する。LC1からIT-TOFMS2に導入された溶出液中の試料成分は大気圧イオン源でイオン化され、生成されたイオンは一旦イオントラップに蓄積される。一定時間蓄積されたイオンはイオントラップにおいて一定のエネルギを付与されて飛行時間型質量分析器に送り込まれ、飛行空間を飛行する間に質量電荷比(m/z)に応じて分離されて検出器21に到達する。イオントラップにおけるイオンの蓄積とその蓄積されたイオンに対する飛行時間型質量分析器による所定質量範囲に亘る質量分析とを所定時間間隔で繰り返すことにより、LC1で分離された全て又は大部分の試料成分がIT-TOFMS2で質量分析される。
IT-TOFMS2の検出器21で得られる検出信号は、各イオンが飛行時間型質量分析器中を飛行するのに要した飛行時間に対応する強度信号である。データ処理部3において、データ収集部31はIT-TOFMS2の検出器21から送られてくる検出信号をデジタル値に変換し、さらに各検出信号に対応している飛行時間を質量電荷比に換算することにより、質量電荷比と強度信号との関係を表すプロファイルデータを求め、このプロファイルデータをデータメモリに格納する。また、データ収集部31は、例えば1回の(つまり所定質量範囲に亘る)質量分析動作に対応して得られたデータに基づいて質量電荷比に依らない信号強度を算出し、それによりトータルイオンクロマトグラムを作成して制御部4へと送り、制御部4は表示部6の画面上にほぼリアルタイムでトータルイオンクロマトグラムを描出する。
次に、データ処理部3において、試料に対する測定実行中に実施される又は測定によるデータの収集が終了した後にバッチ的に実施される特徴的なデータ処理動作について説明する。データ収集部31から所定質量範囲に亘るプロファイルデータが飽和ピーク判定部32に渡されると、飽和ピーク判定部32はプロファイルデータに基づいて作成されるマススペクトル上でピークトップが飽和したピークが有るか否かを判定する。具体的には例えば、飽和ピーク判定部32は、質量電荷比が大きくなる方向に各データの値を調べることでピークのリーディング部とテーリング部との対を見つけ、一対のリーディング部とテーリング部とで挟まれる部分のデータの値が略一定である状態が所定期間続いたときにピークが飽和していると判断することができる。もちろん、ピークトップの飽和の検出方法はこれに限らない。
図2(a)に示すように、ピークトップが飽和した状態であるピークが存在した場合には、飽和ピーク推定再現部33はそのピークのリーディング部及びテーリング部(図2(a)中のAの範囲)にそれぞれ含まれる複数のデータの値に基づいて、飽和した部分のピーク形状(図2(b)中の波形B)を推定する。マススペクトルに現れるピークの形状は、LC1から送られてくる移動相の影響がない、分析条件の変動などによるベースラインのドリフトがない、各種のノイズがない、或いは試料中の夾雑物の影響がない、などといった理想的な状態では、正規分布に従うと考えるのが妥当である。そこで、例えば飽和ピーク推定再現部33は、ピークのリーディング部とテーリング部とにそれぞれ含まれる複数のデータを用いてガウス関数によるフィッティングを行うことにより、目的とする近似的なピーク形状を求めるようにすることができる。
1つのマススペクトル中に複数の飽和ピークが存在する場合には、そのピーク毎に上記のようにして近似ピーク波形を求める。マススペクトル作成部34は飽和ピーク推定再現部33により推定された近似ピーク波形を構成するデータを受け取り、飽和したピークをこの近似ピーク波形に置き換えたマススペクトルを作成する。また、マススペクトル作成部34はこのように飽和ピークがなくなった状態のマススペクトルに対してセントロイド処理を実行し、ピークの重心位置を計算して該ピークの質量電荷比を求める。
また、修正クロマトグラム作成部35は、試料がLC1に注入されてからの時間経過に伴って得られる全てのマススペクトルについて上述したように飽和ピークを近似的ピークに置き換えたマススペクトルに基づいて、抽出イオンクトマトグラムやトータルイオンクロマトグラムを作成する。したがって、このときに作成される抽出イオンクトマトグラムやトータルイオンクロマトグラムはプロファイルデータ中のピーク飽和の影響が殆どないものとなる。
制御部4は入力部5を介した分析者からの要求に応じて、上述したようにマススペクトル作成部34で作成されたピーク飽和のないマススペクトルや、修正クロマトグラム作成部35で作成されたピーク飽和の影響が殆ど残らない抽出イオンクトマトグラム又はトータルイオンクロマトグラムを表示部6の画面上に表示する。マススペクトルを表示する際には、推定により得られた近似ピークをそれ以外の、つまり実測に基づくピークとは識別可能なように、例えば異なる線色や線種などを用いて描画するとよい。これにより、分析者はピーク飽和が生じていたことを容易に認識できるし、何れのピークが推定に基づくピークであって質量電荷比の精度が若干劣る可能性があるかを容易に知ることができる。
さらに、データ処理部3において定性分析(同定)や化合物の構造推定を行う際には、マススペクトル作成部34で作成されたピーク飽和のないマススペクトルを利用する。それにより、図2(a)に示したようにピークが飽和した状態であるマススペクトルを用いる場合に比べて、ピークに対応した質量電荷比の精度が向上するので、定性分析や構造推定自体の精度が向上し、例えば定性分析においては同定漏れや誤同定を減らすことができる。また、データ処理部3において定量分析を行う際には、修正クロマトグラム作成部35で作成された抽出イオンクトマトグラムを用い、目的成分の保持時間に対応したピークの面積値(積分値)を計算して該面積値から定量値を求める。従来に比べてピーク面積値自体の精度が高いので、定量精度も向上する。
なお、上記実施例は本発明の一例にすぎず、本発明の趣旨の範囲で適宜に変更、修正、追加を行っても本願請求の範囲に包含されることは当然である。
例えば、上記実施例では、マススペクトル上でピークトップが飽和したピークのみを処理対象としていたが、質量分析装置がMSn型である場合には、MSnスペクトル上でピークトップが飽和したピークについても同様の処理を行うことができる。また、前段にクロマトグラフが接続された質量分析装置で得られたデータだけでなく、単独の質量分析装置で得られたデータに対する処理にも本願発明を適用することができる。
1…液体クロマトグラフ(LC)
2…イオントラップ飛行時間型質量分析計(IT-TOFMS)
21…検出器
3…データ処理部
31…データ収集部
32…飽和ピーク判定部
33…飽和ピーク推定再現部
34…マススペクトル作成部
35…修正クロマトグラム作成部
4…制御部
5…入力部
6…表示部
2…イオントラップ飛行時間型質量分析計(IT-TOFMS)
21…検出器
3…データ処理部
31…データ収集部
32…飽和ピーク判定部
33…飽和ピーク推定再現部
34…マススペクトル作成部
35…修正クロマトグラム作成部
4…制御部
5…入力部
6…表示部
Claims (4)
- 質量分析装置で収集されたデータを処理する質量分析データ処理装置であって、
a)前記データに基づくマススペクトル上でピークトップが飽和しているピーク波形について、該ピーク波形の裾の傾斜部分のデータに基づいて、前記飽和がない状態のピーク波形形状を推定するピーク波形推定手段と、
b)ピークトップが飽和しているピークに代えて前記ピーク波形推定手段により推定されたピーク波形形状を用いたマススペクトルを作成する近似スペクトル作成手段と、
を備えることを特徴とする質量分析データ処理装置。 - 請求項1に記載の質量分析データ処理装置であって、
前記ピーク推定手段は、ピークトップが飽和しているピーク波形の裾の傾斜部分のデータに基づきガウス分布に従って前記飽和がない状態のピーク波形形状を推定することを特徴とする質量分析データ処理装置。 - 請求項1に記載の質量分析データ処理装置であって、
前記ピーク推定手段による推定に基づくピーク波形部分又は該ピーク波形部分を含む該ピーク全体と、それ以外の部分とが識別可能であるように、前記近似スペクトル作成手段によるマススペクトルを表示画面上に表示する表示処理手段をさらに備えることを特徴とする質量分析データ処理装置。 - 請求項1~3のいずれかに記載の質量分析データ処理装置であって、クロマトグラフの検出器として前記質量分析装置が用いられたクロマトグラフ質量分析装置で収集されたデータを処理する質量分析データ処理装置において、
クロマトグラフ分析の時間経過に従って各時刻毎に得られる、前記スペクトル作成手段により作成された仮想的なピーク波形形状を用いたマススペクトルに基づいて、特定の質量電荷比におけるクロマトグラムを作成するクロマトグラム作成手段をさらに備えることを特徴とする質量分析データ処理装置。
Priority Applications (3)
| Application Number | Priority Date | Filing Date | Title |
|---|---|---|---|
| PCT/JP2010/071337 WO2012073322A1 (ja) | 2010-11-30 | 2010-11-30 | 質量分析データ処理装置 |
| JP2012546604A JP5590145B2 (ja) | 2010-11-30 | 2010-11-30 | 質量分析データ処理装置 |
| US13/905,535 US9514922B2 (en) | 2010-11-30 | 2013-05-30 | Mass analysis data processing apparatus |
Applications Claiming Priority (1)
| Application Number | Priority Date | Filing Date | Title |
|---|---|---|---|
| PCT/JP2010/071337 WO2012073322A1 (ja) | 2010-11-30 | 2010-11-30 | 質量分析データ処理装置 |
Related Child Applications (1)
| Application Number | Title | Priority Date | Filing Date |
|---|---|---|---|
| US13/905,535 Continuation-In-Part US9514922B2 (en) | 2010-11-30 | 2013-05-30 | Mass analysis data processing apparatus |
Publications (1)
| Publication Number | Publication Date |
|---|---|
| WO2012073322A1 true WO2012073322A1 (ja) | 2012-06-07 |
Family
ID=46171310
Family Applications (1)
| Application Number | Title | Priority Date | Filing Date |
|---|---|---|---|
| PCT/JP2010/071337 Ceased WO2012073322A1 (ja) | 2010-11-30 | 2010-11-30 | 質量分析データ処理装置 |
Country Status (3)
| Country | Link |
|---|---|
| US (1) | US9514922B2 (ja) |
| JP (1) | JP5590145B2 (ja) |
| WO (1) | WO2012073322A1 (ja) |
Cited By (15)
| Publication number | Priority date | Publication date | Assignee | Title |
|---|---|---|---|---|
| WO2014091243A1 (en) * | 2012-12-14 | 2014-06-19 | Micromass Uk Limited | Correction of time of flight ms adc data on push by push basis |
| GB2512695A (en) * | 2012-12-14 | 2014-10-08 | Micromass Ltd | Correction of time of flight MS ADC data on push by push basis |
| CN105408743A (zh) * | 2013-07-29 | 2016-03-16 | 株式会社岛津制作所 | 色谱仪用数据处理装置以及数据处理方法 |
| CN105518454A (zh) * | 2013-09-02 | 2016-04-20 | 株式会社岛津制作所 | 色谱仪用数据处理装置以及方法 |
| JP2017032465A (ja) * | 2015-08-04 | 2017-02-09 | 株式会社島津製作所 | ピーク波形処理装置 |
| US20170067865A1 (en) * | 2014-03-03 | 2017-03-09 | Shimadzu Corporation | Data processing system and program for chromatograph mass spectrometer |
| CN106950315A (zh) * | 2017-04-17 | 2017-07-14 | 宁夏医科大学 | 基于uplc‑qtof快速表征样品中化学成分的方法 |
| WO2017191803A1 (ja) * | 2016-05-02 | 2017-11-09 | 株式会社島津製作所 | データ処理装置 |
| JP2018197662A (ja) * | 2017-05-23 | 2018-12-13 | 株式会社島津製作所 | 質量分析データ解析装置及び質量分析データ解析用プログラム |
| CN112418072A (zh) * | 2020-11-20 | 2021-02-26 | 上海交通大学 | 数据处理方法、装置、计算机设备和存储介质 |
| CN112698333A (zh) * | 2021-03-24 | 2021-04-23 | 成都千嘉科技有限公司 | 一种适用于气体和液体的超声波飞行时间测定方法及系统 |
| JP2022062493A (ja) * | 2020-10-08 | 2022-04-20 | 日本電子株式会社 | マススペクトル処理装置及び方法 |
| JPWO2023062854A1 (ja) * | 2021-10-14 | 2023-04-20 | ||
| WO2023112156A1 (ja) * | 2021-12-14 | 2023-06-22 | 株式会社島津製作所 | 飛行時間型質量分析装置 |
| WO2026002066A1 (zh) * | 2024-06-25 | 2026-01-02 | 复旦大学 | 基于拉曼和质谱的致病菌鉴定及模型生成方法、相关设备 |
Families Citing this family (36)
| Publication number | Priority date | Publication date | Assignee | Title |
|---|---|---|---|---|
| GB201312266D0 (en) * | 2013-07-09 | 2013-08-21 | Micromass Ltd | Method of recording ADC saturation |
| DE112014003223B4 (de) | 2013-07-09 | 2023-05-25 | Micromass Uk Limited | Intelligente Dynamikbereichserweiterung |
| US10354849B2 (en) | 2013-07-09 | 2019-07-16 | Micromass Uk Limited | Method of recording ADC saturation |
| JP6379463B2 (ja) * | 2013-09-18 | 2018-08-29 | 株式会社島津製作所 | 波形処理支援方法および波形処理支援装置 |
| US10115576B2 (en) | 2013-12-12 | 2018-10-30 | Waters Technologies Corporation | Method and an apparatus for analyzing a complex sample |
| US20150311050A1 (en) * | 2014-04-28 | 2015-10-29 | Thermo Finnigan Llc | Method for Determining a Spectrum from Time-Varying Data |
| US10211037B2 (en) | 2014-06-04 | 2019-02-19 | Micromass Uk Limited | Histogramming different ion areas on peak detecting analogue to digital convertors |
| EP3057067B1 (en) * | 2015-02-16 | 2017-08-23 | Thomson Licensing | Device and method for estimating a glossy part of radiation |
| GB201613988D0 (en) | 2016-08-16 | 2016-09-28 | Micromass Uk Ltd And Leco Corp | Mass analyser having extended flight path |
| GB2567794B (en) | 2017-05-05 | 2023-03-08 | Micromass Ltd | Multi-reflecting time-of-flight mass spectrometers |
| GB2563571B (en) | 2017-05-26 | 2023-05-24 | Micromass Ltd | Time of flight mass analyser with spatial focussing |
| US11081332B2 (en) | 2017-08-06 | 2021-08-03 | Micromass Uk Limited | Ion guide within pulsed converters |
| US11817303B2 (en) | 2017-08-06 | 2023-11-14 | Micromass Uk Limited | Accelerator for multi-pass mass spectrometers |
| WO2019030473A1 (en) | 2017-08-06 | 2019-02-14 | Anatoly Verenchikov | FIELDS FOR SMART REFLECTIVE TOF SM |
| EP3662501A1 (en) | 2017-08-06 | 2020-06-10 | Micromass UK Limited | Ion mirror for multi-reflecting mass spectrometers |
| US11211238B2 (en) | 2017-08-06 | 2021-12-28 | Micromass Uk Limited | Multi-pass mass spectrometer |
| EP3662503A1 (en) | 2017-08-06 | 2020-06-10 | Micromass UK Limited | Ion injection into multi-pass mass spectrometers |
| US11295944B2 (en) | 2017-08-06 | 2022-04-05 | Micromass Uk Limited | Printed circuit ion mirror with compensation |
| US10767886B2 (en) * | 2018-02-20 | 2020-09-08 | Johnson Controls Technology Company | Building management system with saturation detection and removal for system identification |
| GB201806507D0 (en) | 2018-04-20 | 2018-06-06 | Verenchikov Anatoly | Gridless ion mirrors with smooth fields |
| GB201807605D0 (en) | 2018-05-10 | 2018-06-27 | Micromass Ltd | Multi-reflecting time of flight mass analyser |
| GB201807626D0 (en) | 2018-05-10 | 2018-06-27 | Micromass Ltd | Multi-reflecting time of flight mass analyser |
| GB201808530D0 (en) | 2018-05-24 | 2018-07-11 | Verenchikov Anatoly | TOF MS detection system with improved dynamic range |
| CN112154464B (zh) * | 2018-06-19 | 2024-01-02 | 株式会社岛津制作所 | 参数搜索方法、参数搜索装置以及参数搜索用程序 |
| GB201810573D0 (en) | 2018-06-28 | 2018-08-15 | Verenchikov Anatoly | Multi-pass mass spectrometer with improved duty cycle |
| JP7225743B2 (ja) * | 2018-12-05 | 2023-02-21 | 株式会社島津製作所 | スペクトル演算処理装置、スペクトル演算処理方法、スペクトル演算処理プログラム、イオントラップ質量分析システムおよびイオントラップ質量分析方法 |
| EP3918623B1 (en) * | 2019-01-31 | 2025-10-29 | DH Technologies Development Pte. Ltd. | Acquisition strategy for top-down analysis with reduced background and peak overlapping |
| GB201901411D0 (en) | 2019-02-01 | 2019-03-20 | Micromass Ltd | Electrode assembly for mass spectrometer |
| GB201903779D0 (en) | 2019-03-20 | 2019-05-01 | Micromass Ltd | Multiplexed time of flight mass spectrometer |
| US11454940B2 (en) | 2019-05-21 | 2022-09-27 | Johnson Controls Tyco IP Holdings LLP | Building control system with heat load estimation using deterministic and stochastic models |
| US11215375B2 (en) | 2019-05-21 | 2022-01-04 | Johnson Controls Tyco IP Holdings LLP | Building control system with heat disturbance estimation and prediction |
| US11085663B2 (en) | 2019-07-19 | 2021-08-10 | Johnson Controls Tyco IP Holdings LLP | Building management system with triggered feedback set-point signal for persistent excitation |
| CN114487073B (zh) * | 2021-12-27 | 2024-04-12 | 浙江迪谱诊断技术有限公司 | 一种飞行时间核酸质谱数据校准方法 |
| CN119301732A (zh) * | 2022-04-26 | 2025-01-10 | Dh科技发展私人贸易有限公司 | 用于确定质谱法中限幅adc离子响应信号的位置和时间的系统和方法 |
| CN117092270A (zh) * | 2023-08-28 | 2023-11-21 | 精智未来(广州)智能科技有限公司 | 一种色谱数据自动异态峰识别与处理的方法与系统 |
| CN118861619B (zh) * | 2024-06-25 | 2025-08-15 | 复旦大学附属华山医院 | 质谱数据的处理方法及其系统、设备以及存储介质 |
Citations (9)
| Publication number | Priority date | Publication date | Assignee | Title |
|---|---|---|---|---|
| JPS61170652A (ja) * | 1985-01-25 | 1986-08-01 | Hitachi Ltd | 質量分析法 |
| JP2002071310A (ja) * | 2000-08-28 | 2002-03-08 | Matsushita Electric Works Ltd | 光学式変位測定装置及びその測定方法 |
| JP2005077094A (ja) * | 2003-08-29 | 2005-03-24 | Shimadzu Corp | クロマトグラフ質量分析装置 |
| JP2005302622A (ja) * | 2004-04-15 | 2005-10-27 | Hitachi High-Technologies Corp | 飛行時間型質量分析装置および分析方法 |
| JP2007024737A (ja) * | 2005-07-20 | 2007-02-01 | Hitachi High-Technologies Corp | 半導体の欠陥検査装置及びその方法 |
| JP2008226095A (ja) * | 2007-03-15 | 2008-09-25 | Natl Inst Of Radiological Sciences | 遺伝子発現変動解析方法及びシステム、並びにプログラム |
| JP2008542767A (ja) * | 2005-06-08 | 2008-11-27 | エムディーエス インコーポレイテッド ドゥーイング ビジネス スルー イッツ エムディーエス サイエックス ディヴィジョン | クロマトグラフィ/質量分析のデータ依存データ収集における動的なバックグラウンド信号の排除 |
| JP2008309733A (ja) * | 2007-06-18 | 2008-12-25 | Shimadzu Corp | クロマトグラフ質量分析装置用データ処理装置 |
| JP2010025749A (ja) * | 2008-07-18 | 2010-02-04 | Horiba Ltd | 元素分析方法または元素分析装置 |
Family Cites Families (3)
| Publication number | Priority date | Publication date | Assignee | Title |
|---|---|---|---|---|
| US7351956B2 (en) | 2004-04-08 | 2008-04-01 | Mdc Inc. | Dynamic background signal exclusion in chromatography/mass spectrometry data-dependent data acquisition |
| JP2008242767A (ja) * | 2007-03-27 | 2008-10-09 | Dainippon Printing Co Ltd | 駐輪場のゲートシステム |
| EP2447979A1 (en) * | 2009-06-22 | 2012-05-02 | Shimadzu Corporation | Mass spectrometer |
-
2010
- 2010-11-30 WO PCT/JP2010/071337 patent/WO2012073322A1/ja not_active Ceased
- 2010-11-30 JP JP2012546604A patent/JP5590145B2/ja active Active
-
2013
- 2013-05-30 US US13/905,535 patent/US9514922B2/en not_active Expired - Fee Related
Patent Citations (9)
| Publication number | Priority date | Publication date | Assignee | Title |
|---|---|---|---|---|
| JPS61170652A (ja) * | 1985-01-25 | 1986-08-01 | Hitachi Ltd | 質量分析法 |
| JP2002071310A (ja) * | 2000-08-28 | 2002-03-08 | Matsushita Electric Works Ltd | 光学式変位測定装置及びその測定方法 |
| JP2005077094A (ja) * | 2003-08-29 | 2005-03-24 | Shimadzu Corp | クロマトグラフ質量分析装置 |
| JP2005302622A (ja) * | 2004-04-15 | 2005-10-27 | Hitachi High-Technologies Corp | 飛行時間型質量分析装置および分析方法 |
| JP2008542767A (ja) * | 2005-06-08 | 2008-11-27 | エムディーエス インコーポレイテッド ドゥーイング ビジネス スルー イッツ エムディーエス サイエックス ディヴィジョン | クロマトグラフィ/質量分析のデータ依存データ収集における動的なバックグラウンド信号の排除 |
| JP2007024737A (ja) * | 2005-07-20 | 2007-02-01 | Hitachi High-Technologies Corp | 半導体の欠陥検査装置及びその方法 |
| JP2008226095A (ja) * | 2007-03-15 | 2008-09-25 | Natl Inst Of Radiological Sciences | 遺伝子発現変動解析方法及びシステム、並びにプログラム |
| JP2008309733A (ja) * | 2007-06-18 | 2008-12-25 | Shimadzu Corp | クロマトグラフ質量分析装置用データ処理装置 |
| JP2010025749A (ja) * | 2008-07-18 | 2010-02-04 | Horiba Ltd | 元素分析方法または元素分析装置 |
Cited By (27)
| Publication number | Priority date | Publication date | Assignee | Title |
|---|---|---|---|---|
| WO2014091243A1 (en) * | 2012-12-14 | 2014-06-19 | Micromass Uk Limited | Correction of time of flight ms adc data on push by push basis |
| GB2512695A (en) * | 2012-12-14 | 2014-10-08 | Micromass Ltd | Correction of time of flight MS ADC data on push by push basis |
| GB2512695B (en) * | 2012-12-14 | 2017-08-09 | Micromass Ltd | Correction of time of flight MS ADC data on push by push basis |
| CN105408743A (zh) * | 2013-07-29 | 2016-03-16 | 株式会社岛津制作所 | 色谱仪用数据处理装置以及数据处理方法 |
| US10697946B2 (en) | 2013-07-29 | 2020-06-30 | Shimadzu Corporation | Data processing system and data processing method for chromatograph |
| CN105518454A (zh) * | 2013-09-02 | 2016-04-20 | 株式会社岛津制作所 | 色谱仪用数据处理装置以及方法 |
| US20170067865A1 (en) * | 2014-03-03 | 2017-03-09 | Shimadzu Corporation | Data processing system and program for chromatograph mass spectrometer |
| US10488376B2 (en) * | 2014-03-03 | 2019-11-26 | Shimadzu Corporation | Data processing system and program for chromatograph mass spectrometer |
| JP2017032465A (ja) * | 2015-08-04 | 2017-02-09 | 株式会社島津製作所 | ピーク波形処理装置 |
| WO2017191803A1 (ja) * | 2016-05-02 | 2017-11-09 | 株式会社島津製作所 | データ処理装置 |
| JPWO2017191803A1 (ja) * | 2016-05-02 | 2018-11-01 | 株式会社島津製作所 | データ処理装置 |
| CN109073615A (zh) * | 2016-05-02 | 2018-12-21 | 株式会社岛津制作所 | 数据处理装置 |
| CN106950315B (zh) * | 2017-04-17 | 2019-03-26 | 宁夏医科大学 | 基于uplc-qtof快速表征样品中化学成分的方法 |
| CN106950315A (zh) * | 2017-04-17 | 2017-07-14 | 宁夏医科大学 | 基于uplc‑qtof快速表征样品中化学成分的方法 |
| JP2018197662A (ja) * | 2017-05-23 | 2018-12-13 | 株式会社島津製作所 | 質量分析データ解析装置及び質量分析データ解析用プログラム |
| US11961726B2 (en) | 2020-10-08 | 2024-04-16 | Jeol Ltd. | Mass spectrum processing apparatus and method |
| JP2022062493A (ja) * | 2020-10-08 | 2022-04-20 | 日本電子株式会社 | マススペクトル処理装置及び方法 |
| JP7249976B2 (ja) | 2020-10-08 | 2023-03-31 | 日本電子株式会社 | マススペクトル処理装置及び方法 |
| CN112418072A (zh) * | 2020-11-20 | 2021-02-26 | 上海交通大学 | 数据处理方法、装置、计算机设备和存储介质 |
| CN112698333A (zh) * | 2021-03-24 | 2021-04-23 | 成都千嘉科技有限公司 | 一种适用于气体和液体的超声波飞行时间测定方法及系统 |
| JPWO2023062854A1 (ja) * | 2021-10-14 | 2023-04-20 | ||
| WO2023062783A1 (ja) * | 2021-10-14 | 2023-04-20 | 株式会社島津製作所 | クロマトグラフ質量分析装置、及びクロマトグラフ質量分析データ処理方法 |
| WO2023062854A1 (ja) * | 2021-10-14 | 2023-04-20 | 株式会社島津製作所 | クロマトグラフ質量分析装置、及びクロマトグラフ質量分析データ処理方法 |
| JP7647913B2 (ja) | 2021-10-14 | 2025-03-18 | 株式会社島津製作所 | クロマトグラフ質量分析装置、及びクロマトグラフ質量分析データ処理方法 |
| WO2023112156A1 (ja) * | 2021-12-14 | 2023-06-22 | 株式会社島津製作所 | 飛行時間型質量分析装置 |
| JP7578203B2 (ja) | 2021-12-14 | 2024-11-06 | 株式会社島津製作所 | 飛行時間型質量分析装置 |
| WO2026002066A1 (zh) * | 2024-06-25 | 2026-01-02 | 复旦大学 | 基于拉曼和质谱的致病菌鉴定及模型生成方法、相关设备 |
Also Published As
| Publication number | Publication date |
|---|---|
| US20130338935A1 (en) | 2013-12-19 |
| JP5590145B2 (ja) | 2014-09-17 |
| JPWO2012073322A1 (ja) | 2014-05-19 |
| US9514922B2 (en) | 2016-12-06 |
Similar Documents
| Publication | Publication Date | Title |
|---|---|---|
| JP5590145B2 (ja) | 質量分析データ処理装置 | |
| JP7377805B2 (ja) | 確実で自動の質量スペクトル分析 | |
| JP6380555B2 (ja) | 分析装置 | |
| US11798795B2 (en) | Mass spectrometer and mass calibration method in mass spectrometer | |
| US20060255258A1 (en) | Chromatographic and mass spectral date analysis | |
| JP6750687B2 (ja) | 質量分析装置 | |
| JP2011512534A (ja) | 質量分析法による定量化法 | |
| JP6158965B2 (ja) | Srmアッセイにおけるバックグラウンド干渉の決定のためのtof−msmsデータの可変xic幅の使用 | |
| JP5464711B2 (ja) | 質量分析法による定量化のための信号対雑音を改善する方法 | |
| CN108982729B (zh) | 用于提取质量迹线的系统和方法 | |
| US20170067865A1 (en) | Data processing system and program for chromatograph mass spectrometer | |
| JP3683749B2 (ja) | 質量分析方法 | |
| JP4256208B2 (ja) | プラズマイオン源質量分析装置を用いた同位体比分析 | |
| US20140005954A1 (en) | Method Of Processing Multidimensional Mass Spectrometry | |
| CN115516302B (zh) | 色谱质量分析数据处理方法、色谱质量分析装置以及色谱质量分析数据处理用程序 | |
| US11217436B2 (en) | Systems and methods for determining mass of an ion species | |
| JP6226823B2 (ja) | クロマトグラフ質量分析装置及びその制御方法 | |
| CN117242543A (zh) | 线性定量动态范围延展方法 | |
| JP7380866B2 (ja) | クロマトグラフ質量分析データ処理方法、クロマトグラフ質量分析装置、及びクロマトグラフ質量分析データ処理用プログラム | |
| JP2016033458A (ja) | 質量分析データ処理方法及び装置 | |
| Wang | Investigation of Deconvolution Approaches in GC-MS Metabolomics Studies | |
| Casas et al. | Automated correction of saturated peaks in untargeted GC-MS: a chemometric approach | |
| JP2008249444A (ja) | 質量分析データ解析方法 |
Legal Events
| Date | Code | Title | Description |
|---|---|---|---|
| 121 | Ep: the epo has been informed by wipo that ep was designated in this application |
Ref document number: 10860136 Country of ref document: EP Kind code of ref document: A1 |
|
| ENP | Entry into the national phase |
Ref document number: 2012546604 Country of ref document: JP Kind code of ref document: A |
|
| NENP | Non-entry into the national phase |
Ref country code: DE |
|
| 122 | Ep: pct application non-entry in european phase |
Ref document number: 10860136 Country of ref document: EP Kind code of ref document: A1 |