WO2012032676A1 - 計算機システムの管理方法、及び管理システム - Google Patents
計算機システムの管理方法、及び管理システム Download PDFInfo
- Publication number
- WO2012032676A1 WO2012032676A1 PCT/JP2010/068130 JP2010068130W WO2012032676A1 WO 2012032676 A1 WO2012032676 A1 WO 2012032676A1 JP 2010068130 W JP2010068130 W JP 2010068130W WO 2012032676 A1 WO2012032676 A1 WO 2012032676A1
- Authority
- WO
- WIPO (PCT)
- Prior art keywords
- event
- conclusion
- failure
- cause
- cause candidate
- Prior art date
Links
Images


Classifications
-
- G—PHYSICS
- G06—COMPUTING; CALCULATING OR COUNTING
- G06F—ELECTRIC DIGITAL DATA PROCESSING
- G06F11/00—Error detection; Error correction; Monitoring
- G06F11/07—Responding to the occurrence of a fault, e.g. fault tolerance
- G06F11/0703—Error or fault processing not based on redundancy, i.e. by taking additional measures to deal with the error or fault not making use of redundancy in operation, in hardware, or in data representation
- G06F11/079—Root cause analysis, i.e. error or fault diagnosis
-
- G—PHYSICS
- G06—COMPUTING; CALCULATING OR COUNTING
- G06F—ELECTRIC DIGITAL DATA PROCESSING
- G06F11/00—Error detection; Error correction; Monitoring
- G06F11/30—Monitoring
- G06F11/32—Monitoring with visual or acoustical indication of the functioning of the machine
- G06F11/324—Display of status information
- G06F11/327—Alarm or error message display
Definitions
- the present invention relates to a computer system management method and management system, for example, a technique for managing a failure of a host computer, a network switch, and a storage system that constitute the computer system.
- a cause event is detected from a plurality of faults detected in the system or its signs. More specifically, in Patent Document 1, management software is used to generate an event that the performance value exceeds the threshold value in the managed device, and information is stored in the event DB.
- this management software has an analysis engine for analyzing the causal relationship of a plurality of failure events occurring in the managed device.
- This analysis engine can access the configuration DB with inventory information of managed devices to recognize in-device components on the path on the I / O path and affect the performance of logical volumes on the host. The components are recognized as a group called “topology”. Then, when an event occurs, the analysis engine applies an analysis rule including a predetermined conditional statement and an analysis result to each topology and constructs an expansion rule.
- This expansion rule includes a cause event that is a cause of performance degradation in another device and a related event group caused by the cause event. Specifically, an event described as the cause of the failure in the THEN part of the rule is a cause event, and an event other than the cause event among the events described in the IF part is a related event.
- failure analysis function In the failure analysis function according to Patent Document 1, a combination of events received from managed devices and failure cause candidates are described as rules in the IF-THEN format.
- the failure analysis function calculates the certainty factor of the failure cause candidate described in the THEN portion by calculating the occurrence rate of the event described in the IF portion of the rule.
- the calculated certainty factor and failure cause candidate are displayed in a GUI according to the user's request.
- the present invention has been made in view of such a situation, and provides a function for shortening the time required to solve a failure in a monitored device.
- the obtained cause candidates are classified for each affected range.
- the cause candidates are classified and grouped according to related failure events, and these are displayed in a GUI. More specifically, when a cause candidate group is inferred as a result of failure cause analysis, the cause candidate group having the same device abnormal state as a derivation basis is classified.
- the cause candidate groups derived from the same device abnormal state are regarded as a set of cause candidates for solving the same failure, and are classified and displayed in the GUI.
- the management system acquires a processing performance value indicating the processing performance of the node device, and detects that a failure has occurred in the node device from the acquired processing performance value. Then, the management system applies the detected failure to an analysis rule indicating a relationship between a combination of one or more condition events that can occur in the node device and a conclusion event that is a cause of the failure of the combination of the condition events. A certainty factor, which is information indicating the possibility of a failure occurring in the apparatus, is calculated. Furthermore, the management system selects one conclusion event that is regarded as the cause of the failure as a starting cause candidate, and extracts a condition event related to the starting cause candidate.
- the management system selects a conclusion event related to the extracted condition event, which is one or a plurality of conclusion events that are different from the conclusion event of the origin cause candidate, as a related cause candidate,
- the conclusion event of the cause candidate and the conclusion event of the related cause candidate are classified and processed separately from the other conclusion events.
- the classified conclusion event is displayed as a GUI on the display screen.
- the inferred failure cause candidate is classified and displayed according to the failure event related to the failure to be solved thereby, so that the administrator can analyze it.
- the response priority of the result can be easily determined, and the load required for analysis result confirmation and failure response can be reduced.
- FIG. 1 It is a figure which shows the physical structural example of a computer system. It is a figure which shows the detailed structural example of a host computer. It is a figure which shows the detailed structural example of a storage apparatus. It is a figure which shows the detailed structural example of a management server. It is a figure which shows the structural example of the apparatus performance management table
- the embodiment of the present invention relates to failure cause analysis for solving IT system failures.
- failure cause candidates are presented to the administrator so that the failure can be dealt with.
- it is impossible to efficiently cope with the failure unless it is understood which cause cause is associated with which cause of the failure.
- failure handling is performed on the top number candidates based on the certainty factor, these candidates may actually be candidates for failure causes due to failures occurring in the same device.
- the candidate should be dealt with at the same level as the higher number candidates. .
- the embodiment of the present invention provides a function for presenting a cause candidate to be dealt with with higher reliability and priority.
- the information used in the present invention is described by the expression “aaa table”.
- expressions such as “aaa table”, “aaa list”, “aaaDB”, “aaa queue”, etc. It may be expressed in other than data structures such as list, DB, and queue. Therefore, in order to show that the information used in the present invention does not depend on the data structure, “aaa table”, “aaa list”, “aaaDB”, “aaa queue”, etc. may be referred to as “aaa information”. is there.
- program or “module” may be described as the subject of operation (subject), but the program or module is defined by being executed by the processor. Since the above processing is performed using the memory and the communication port (communication control device), the processing may be read as processing in which the processor is an operation subject (subject). Further, the processing disclosed with the program or module as the subject may be processing performed by a computer such as a management server or an information processing apparatus. Part or all of the program may be realized by dedicated hardware. Various programs may be installed in each computer by a program distribution server or a storage medium.
- the scale of the system to be managed is not mentioned.
- the larger the system the higher the possibility that multiple failures will occur simultaneously. Therefore, when the present invention is applied to a large-scale system, the effects of the present invention can be enjoyed more.
- 1st Embodiment 1st Embodiment is related with the failure cause candidate display process by management software (for example, contained in a management server).
- FIG. 1 is a diagram showing a physical configuration of a computer system according to the present invention.
- the computer system 1 includes a storage device 20000, a host computer 10000, a management server 30000, a WEB browser activation server 35000, and an IP switch 40000, which are connected by a network 45000. .
- the host computers 10000 to 10010 receive file I / O requests from, for example, client computers (not shown) connected thereto, and realize access to the storage apparatuses 20000 to 20010 based on the received requests.
- the management server (management computer) 30000 manages the operation of the entire computer system.
- the WEB browser activation server 35000 communicates with the GUI display processing module 32400 of the management server 30000 via the network 45000 and displays various information on the WEB browser.
- the user manages the devices in the computer system by referring to the information displayed on the WEB browser on the WEB browser activation server.
- the management server 30000 and the web browser activation server 35000 may be composed of a single server.
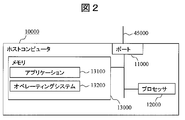
- FIG. 2 is a diagram showing a detailed internal configuration example of the host computer 10000 according to the present invention.
- the host computer 10000 has a port 11000 for connecting to the network 45000, a processor 12000, and a memory 13000 (which may include a disk device as a component), which are connected to each other via a circuit such as an internal bus. It becomes the composition which is done.
- the memory 13000 stores a business application 13100 and an operating system 13200.
- the business application 13100 uses a storage area provided from the operating system 13200, and performs data input / output (hereinafter referred to as I / O) to the storage area.
- I / O data input / output
- the operating system 13200 executes processing for causing the business application 13100 to recognize the logical volumes on the storage apparatuses 20000 to 20010 connected to the host computer 10000 via the network 45000 as storage areas.
- the port 11000 is a single port including an I / O port for communicating with the storage device 20000 by iSCSI and a management port for the management server 30000 to acquire management information in the host computers 10000 to 10010. However, it may be divided into an I / O port for communication by iSCSI and a management port.
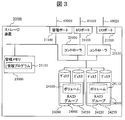
- FIG. 3 is a diagram showing a detailed internal configuration example of the storage apparatus 20000 according to the present invention.
- the storage device 20010 has the same configuration.
- the storage device 20000 stores I / O ports 21000 and 21010 for connecting to the host computer 10000 via the network 45000, a management port 21100 for connecting to the management server 30000 via the network 45000, and various management information.
- the management memory 23000 stores a storage device management program 23100.
- the management program 23100 communicates with the management server 30000 via the management port 21100 and provides the configuration information of the storage device 20000 to the management server 30000.
- Each of the RAID groups 24000 to 24010 includes one or more magnetic disks 24200, 24210, 24220, and 24230. In the case of being constituted by a plurality of magnetic disks, these magnetic disks may have a RAID configuration.
- the RAID groups 24000 to 24010 are logically divided into a plurality of volumes 24100 to 24110.
- the logical volumes 24100 and 24110 need not have a RAID configuration as long as they are configured using storage areas of one or more magnetic disks. Furthermore, as long as a storage area corresponding to a logical volume is provided, a storage device using another storage medium such as a flash memory may be used instead of the magnetic disk.
- the controllers 25000 and 25010 have therein a processor that controls the storage device 20000 and a cache memory that temporarily stores data exchanged with the host computer 10000. Each controller is interposed between the I / O port and the RAID group, and exchanges data between them.
- the storage device 20000 provides a logical volume to any host computer, receives an access request (indicating an I / O request), and reads / writes data from / to a storage device in response to the received access request
- an access request indicating an I / O request
- reads / writes data from / to a storage device in response to the received access request
- the storage controller and the storage device that provides the storage area may be stored in different cases. Good. That is, in the example of FIG. 3, the management memory 23000 and the controllers 25000 and 25110 are provided as separate entities, but may be configured as a storage controller in which they are integrated. Further, in this specification, a storage device may be referred to as a storage system when the storage controller and the storage device are present in the same housing or as an expression including another housing.
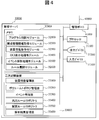
- FIG. 4 is a diagram showing a detailed internal configuration example of the management server 30000 according to the present invention.
- the management server 30000 includes a management port 31000 for connection to the network 45000, a processor 31100, a memory 32000 such as a cache memory, a secondary storage device (secondary storage area) 33000 such as an HDD, and processing results to be described later.
- the memory 32000 stores a program control module 32100, a configuration management information acquisition module 32200, an apparatus performance acquisition module 32300, a GUI display processing module 32400, an event analysis processing module 32500, and a rule expansion module 32600.
- each module is provided as a software module of the memory 32000, but may be provided as a hardware module. Also, the processing performed by each module may be provided as one or more program codes, and there may be no clear boundary between modules. Modules may be read as programs.
- the secondary storage area 33000 stores an apparatus performance management table 33100, a volume topology management table 33200, an event management table 33300, a general rule repository 33400, an expansion rule repository 33500, and an analysis result management table 33600.
- the secondary storage area 33000 is composed of either a semiconductor memory or a magnetic disk, or both a semiconductor memory and a magnetic disk.
- the GUI display processing module 32400 displays the acquired configuration management information via the output device 31200 in response to a request from the administrator via the input device 31300.
- the input device and the output device may be separate devices, or one or more integrated devices.
- the management server (management computer) 30000 has, for example, a keyboard and a pointer device as the input device 31300 and a display, a printer, and the like as the output device 31200, but may be other devices.
- a serial interface or an Ethernet interface is used as an alternative to the input / output device, a display computer having a display or keyboard or pointer device is connected to the interface, and the display information is transmitted to the display computer, or the input information May be displayed by the display computer, or the input and display at the input / output device may be substituted by receiving the input.
- a set of one or more computers that manage the computer system (information processing system) 1 and display display information may be referred to as a management system.
- the management server 30000 displays display information
- the management server 30000 is a management system
- a combination of the management server 30000 and a display computer for example, the WEB browser activation server 35000 in FIG. 1
- processing equivalent to that of the management server may be realized with a plurality of computers.
- the plurality of computers if the display computer performs display, display (Including computers) is the management system.
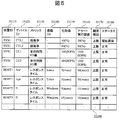
- FIG. 5 is a diagram showing a configuration example of the device performance management table 33100 that the management server 30000 has.
- the device performance management table 33100 includes a field 33110 for registering a device ID that is an identifier of a device to be managed, a field 33120 for registering a device ID that is a device identifier inside the device to be managed, and performance information of the management target device.
- a field 33130 for storing the metric name, a field 33140 for registering the OS type of the device that detected the threshold abnormality (which means “determined to be abnormal based on the threshold”), and the management target device A field 33150 for acquiring and storing the performance value from the corresponding device, and a field 33160 for storing a threshold (alert execution threshold) that is the upper limit or lower limit of the normal range of the performance value of the management target device in response to an input from the user.
- a field for registering whether the threshold is the upper limit or lower limit of the normal value.
- a field 33170 includes a field 33180 for performance value registers whether the abnormal value is a normal value, as configuration items.
- the processor operating rate in the controller CTL1 in the storage device SYS1 is 40% (see 33150) at the present time, and the operating rate of CTL1 is 20%.
- the management server 30000 determines that the controller CTL1 is overloaded when exceeding (see 33160), but in this specific example, it is understood that this performance value is determined to be an abnormal value (see 33180).
- the I / O amount per unit time, the operation rate, and the response time are given as examples of the performance value of the device managed by the management server 30000, but the performance value managed by the management server 30000 may be other than this.
- FIG. 6 is a diagram showing a configuration example of the volume topology management table 33200 that the management server 30000 has.
- the volume topology management table 33200 includes a field 33210 for registering a device ID serving as an identifier of the storage device, a field 33220 for registering a volume ID serving as a volume identifier of the storage device, and an LU (Logical Unit) used by the host computer 10000. ) Field 33230 for registering an LU number as an identifier, a field 33240 for registering an ID of a controller used for communication between a port and a volume, and a field 33250 for registering an identifier of a host computer 10000 to which the volume is connected. And a field 33260 for registering the drive name of the logical volume of the host computer 10000 in which the volume is an entity.
- the volume VOL1 of the storage device SYS1 is provided to the host computer as a logical unit indicated by LU1, and passed through the storage-side controller indicated by CTL1. It can be seen that it is connected to the host computer HOST1 and is recognized as a logical volume (/ var) on the host.
- FIG. 7 is a diagram showing a configuration example of the event management table 33300 that the management server 30000 has. This event management table 33300 is appropriately referred to in failure cause analysis processing and cause candidate classification processing described later.
- the event management table 33300 includes a field 33310 for registering an event ID serving as an identifier of the event itself, a field 33320 for registering a device ID serving as an identifier of a device having an event such as a threshold abnormality in the acquired performance value, and an event occurrence A field 33330 for registering the identifier of the part in the device that has been detected, a field 33340 for registering the name of the metric in which the threshold abnormality is detected, a field 33350 for registering the OS type of the device in which the threshold abnormality is detected, and a part in the device
- the configuration item includes a field 33360 for registering the state when the event occurs, a field 33370 for registering whether the event has been analyzed by the event analysis processing module 32500 described later, and a field 33380 for registering the date and time when the event occurred.
- the management server 30000 detects the threshold abnormality of the processor operation rate in the controller indicated by CTL1 of the storage device SYS1, and the event ID is EV1. It turns out that it is.
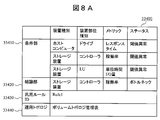
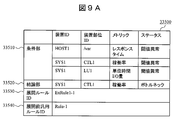
- FIGS. 8A and 8B are diagrams illustrating a configuration example of the general rules in the general rule repository 33400 included in the management server 30000.
- FIG. A general-purpose rule (the same applies to an expansion rule described later) is a combination of one or more condition events that can occur in the node devices constituting the computer system 1 and a conclusion event that is a cause of failure for the combination of condition events. It shows the relationship. That is, the general-purpose rule and the later-described expansion rule indicate that the contents described in the conclusion part can cause a failure when an event in the condition part occurs.
- the event propagation model for identifying the cause in failure analysis is a combination of events that are expected to occur as a result of a failure and the cause in “IF-THEN” format. Yes.
- the general-purpose rules are not limited to those shown in FIGS. 8A and 8B, and there may be more rules.
- the general rule includes a field 33430 for registering a general rule ID as an identifier of the general rule, a field 33410 for registering an observation event corresponding to the IF part of the general rule described in the “IF-THEN” format, and “IF-THEN”.
- a field 33420 for registering the cause event corresponding to the THEN part of the general rule described in the format, and a field 33440 for registering the topology acquired when the general rule is expanded in the real system and the expanded rule is generated. are included as configuration items. If the event of the condition part 33410 is detected, the event of the conclusion part 33420 is the cause of the failure, and if the status of the conclusion part 33420 becomes normal, the problem of the condition part 33410 is also solved. 8A and 8B, three events are described in the condition part 33410, but the number of events is not limited.
- a general-purpose rule whose general-purpose rule ID is Rule1 indicates that a threshold error (related event) of the response time of the logical volume on the host computer as an observation event, and the operating rate of the controller in the storage device (processor usage) Ratio) threshold error (cause event) and LU unit time I / O threshold error (related event) in the storage device are detected, the storage device controller operation rate (processor usage rate) bottleneck It can be concluded that is the cause of disability.
- topology information is acquired from the volume topology management table when generating an expansion rule.
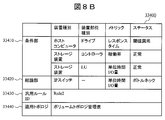
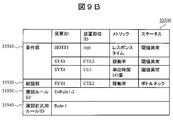
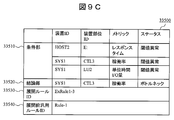
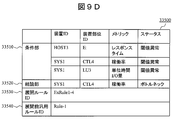
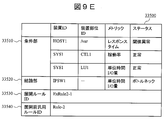
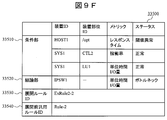
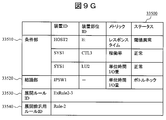
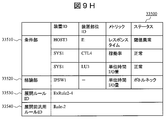
- FIGS. 9A to 9H are diagrams illustrating configuration examples of expansion rules in the expansion rule repository 33500 included in the management server 30000.
- FIG. These expansion rules are generated by inserting items of each entry of the volume topology management table (FIG. 7) into the general-purpose rules (FIGS. 8A and 8B).
- the expansion rule includes a field 33530 for registering an expansion rule ID serving as an expansion rule identifier, a field 33540 for registering a general rule ID serving as a general rule identifier based on the expansion rule, and “IF-THEN”.
- a field 33510 for registering an observation event corresponding to the IF part of the expansion rule described in the format and a field 33520 for registering a cause event corresponding to the THEN part of the expansion rule described in the “IF-THEN” format are configured. Includes as an item.
- the expansion rule of FIG. 9A inserts the controller name 32240, the host ID 32250, the connection destination drive name 32260, and the LU number 32230 of the first entry of FIG. 6 into the device type and device part type in the general rule ID Rule1.
- an expansion rule whose expansion rule ID is ExRule1-1 is expanded based on the general rule whose general rule ID is Rule1, and the response time of the logical volume on the host computer is observed as an observation event.
- FIG. 10 is a diagram showing a configuration example of the analysis result management table 33600 that the management server 30000 has.
- the analysis result management table 33600 registers a field 33610 for registering a device ID that is an identifier of a device in which an event has been determined to be the cause of the failure in the failure cause analysis process, and an identifier of a part in the device in which the event has occurred.
- the management server 30000 fails the threshold abnormality of the processor operation rate in the controller indicated by CTL1 of the storage device SYS1.
- the event IDs EV1, EV3, and EV6 are received as the basis, that is, the occurrence rate of the conditional event is 3/3.
- the program control module 32100 instructs the configuration information acquisition module 32200 to periodically acquire configuration management information from the storage device 20000, the host computer 10000, and the IP switch 40000 in the computer system 1 by, for example, polling processing.
- the configuration management information acquisition module 32200 acquires configuration management information from the storage device 20000, the host computer 10000, and the IP switch 40000, and updates the volume topology management table 33200.
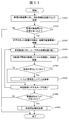
- FIG. 11 is a flowchart for explaining a normal device performance information acquisition process executed by the device performance acquisition module 32300 of the management server 30000.
- the program control module 32100 instructs the device performance acquisition module 32300 to execute the device performance information acquisition process at the time of starting the program or every time a predetermined time elapses from the previous device performance information acquisition processing. It should be noted that when the execution instruction is repeatedly issued, it is not necessarily strictly every fixed period, and it is only necessary to repeat it.
- the device performance information acquisition module 32300 repeats the following series of processes for each device to be monitored.
- the device performance information acquisition module 32300 first instructs each device to be monitored to transmit the configuration management information (step 61010).
- the device performance information acquisition module 32300 determines whether or not there is a response from the monitoring target device (step 61020). If there is a response of the device performance information from the device (Yes in step 61020), the acquired device performance information is displayed. The information is stored in the device performance management table 33100 (step 61030). If there is no response for configuration management information from the device (No in step 61020), the configuration management information acquisition process ends.
- the device performance acquisition module 32300 refers to the device performance information stored in the device performance management table 33100, and repeats the processing from step 61050 to step 61070 for each performance value (step 61040).
- the device performance acquisition module 32300 checks whether the performance value exceeds the threshold, and updates the state registered in the device performance management table 33100 (Step 61050). Then, the device performance acquisition module 32300 determines whether or not the state has changed from normal to threshold abnormality or from threshold abnormality to normal (step 61060). If the state has changed (Yes in step 61060), the event An event is registered in the management table 33700 (step 61070). If the state has not changed (No in step 61060), the processing returns to step 61050 if the state confirmation processing has not been completed for all performance values.
- the device performance acquisition module 32300 determines whether or not there is a newly added event in a series of processing (step 61080). If there is an additional event (for example, when a new abnormality occurs during processing), the program control module 32100 instructs the event analysis processing module 32500 to perform the failure cause analysis processing shown in FIG. 12 ( Step 61090).
- the above is the device performance information acquisition process performed by the device performance acquisition module 32300.
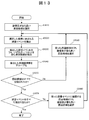
- FIG. 12 is a flowchart for explaining the details of the failure cause analysis processing (step 61090 in FIG. 11) executed by the event analysis processing module 32500 of the management server 30000.
- the event analysis processing module 32500 acquires an event whose analyzed flag is not Yes from the event management table 33300 (Step 62010).
- the event analysis processing module 32500 repeats the processing from step 62020 to step 62040 for each expansion rule in the expansion rule repository 33500 (step 62020).
- the event analysis processing module 32500 first calculates the number of occurrences in the past certain period for each event corresponding to the condition part described in the expansion rule (step 62030). Subsequently, the event analysis processing module 32500 executes cause candidate classification processing (FIG. 13) (step 62050). Then, the event analysis processing module 32500 determines whether or not the number of event occurrences counted in the processing of step 62030 exceeds a certain ratio in all events described in the condition part.
- the display processing module 32400 is instructed to display the event causing the failure based on the classification performed in Step 62050 together with the event occurrence ratio in the conditional sentence (Step 62060). Thereafter, with reference to the event management table 33300, the analyzed flag 33370 is set to Yes for the event acquired in step 622010 (step 62070).
- the event analysis processing module 32500 writes, in the analysis result management table 33600, each of the expansion rules in the expansion rule repository that has a certainty factor that is not 0 (step 62080).
- the condition part includes “abnormal response time threshold value of logical volume (/ var) in host computer HOST1” and “abnormal threshold value operation rate of controller CTL1 in storage device SYS1”. “And“ abnormal threshold value of unit time I / O amount of logical unit LU1 in storage device SYS1 ”are defined.
- the event analysis processing is performed when “the threshold abnormality of the operation rate of the controller CTL1 in the storage device SYS1” (occurrence date and time: 2010-01-015: 0015: 05: 00) is registered.
- the module 32500 refers to the event management table 33300 after waiting for a certain period of time, and acquires events that have occurred in the past certain period.
- the event analysis processing module 32500 calculates the number of occurrences in the past fixed period for each event corresponding to the condition part described in the expansion rule ExRule1-1 of the expansion rule repository 33500.
- "Threshold error of logical volume (/ var) response time on host computer HOST1" (related event) and “Threshold error of logical unit LU1 unit time I / O amount” (related event) are also in the past certain period Therefore, the number of occurrences of each event (cause event and related event) corresponding to the condition part described in the expansion rule ExRule1-1 in the past certain period occupies in all the events described in the condition part The ratio will be 3/3.
- the event analysis processing module 32500 instructs the GUI display processing module 32400 to display the event causing the failure together with the event occurrence ratio in the conditional statement.
- the constant value here is 30%, for example, in this specific example, the occurrence ratio of each event in the condition part of the expansion rule ExRule1-1 in the past certain period is 3/3, that is, 100%. Will be displayed in the GUI.
- the above is the failure cause analysis processing performed by the event analysis processing module 32500.
- the failure analysis function according to Patent Document 1 when a plurality of failures frequently occur in a short period, the number of failure analysis results to be stored increases.
- the administrator makes an analogy as to which failure cause candidate corresponds to which failure can be resolved immediately. It is difficult, and it takes a long time for the administrator to refer to the analysis result that should be preferentially taken. As a result, there is a problem that it takes a long time to resolve the failure.
- a cause candidate classification process is newly provided so that a large number of analysis results can be classified and displayed.
- the cause candidate classification process is based on an event included in a cause candidate as a starting point (for example, a cause candidate with the highest certainty), and if there is another cause candidate including the event, it is a cause candidate for the same cause of failure. This is the process of classifying (grouping) by assuming that Since related cause candidates are grouped together, it becomes possible to know candidates to be dealt with preferentially.
- FIG. 13 is a flowchart for explaining the details of the cause candidate classification process (step 63050) performed by the event analysis processing module 32500 of the management server 30000 in the first embodiment.
- the event analysis processing module 32500 selects a cause candidate with the highest certainty factor in a certain period (for example, one polling period) from the analysis result management table 33600 (step 63010). Then, “Yes” is registered in the classification starting point flag field 33690 of the analysis result management table 33600 for the selected cause candidate entry.
- the event analysis processing module 32500 acquires the reception event ID included in the selected candidate from the analysis result management table 33600 (step 63020). Then, the event analysis processing module 32500 acquires from the analysis result management table 33600 a cause candidate that includes any one or more of the same reception event IDs among the acquired reception event IDs (step 63030).
- the event analysis processing module 32500 acquires a list of group IDs used from the field 33680 for registering group IDs in the analysis result management table 33600, creates a group ID that does not overlap, and in step 63010 Regarding the selected cause candidate and the entry of the cause candidate acquired in step 63030, the contents of the field 33680 are updated to the created group ID (step 63040).
- the event analysis processing module 32500 checks whether there is an entry in which the group ID is not described in the field 33680 from the analysis result management table 33600. If such an entry exists (in the case of No in step 63050), the cause candidate having the highest certainty among such entries is selected (step 63060), and the cause candidate selected in the analysis result management table 33600 is selected. For the entry, Yes is registered in the classification start flag field 33690. And the process after step 63020 is performed again with respect to the selected candidate.
- the event analysis processing module 32500 receives the received event ID field of the analysis result management table 33600. All reception event IDs are acquired from 33660. Next, an entry in which Yes is described in the classification start flag field 33690 of the analysis result management table 33600 is acquired, and it is checked whether or not all received event IDs are included in the acquired entry.
- the event analysis processing module 32500 When there is one or more reception IDs not included in the entry (No in step 63070), the event analysis processing module 32500 includes the cause candidate entries including the cause candidates including those reception IDs. Then, the cause candidate with the highest certainty factor is selected (step 63080), and Yes is registered in the classification start point flag field 33690 for the selected cause candidate entry in the analysis result management table 33600. And the process after step 63020 is performed again with respect to the selected candidate.
- the event analysis processing module 32500 has the highest certainty factor from the analysis result management table 33600. From the first level (first entry) of the analysis result management table, the event analysis processing module 32500 has the CTL1 failure cause candidate of the SYS1 device. Select an entry. Next, EV1, EV3, and EV6, which are failure events included in this candidate, are extracted. Then, the second-stage entry (SYS1 / CTL2) and the fifth-stage entry (IPSW1) are selected as other failure cause candidates including these failure events. These three entries are grouped, GR1 is generated as a group ID, and the generated group ID is registered in the group ID registration field 33680 of the analysis result management table for these entries. Further, since the first-stage entry is treated as a reference for classification, Yes is recorded in the classification start flag 33690 of the first-stage entry, and No is recorded in the classification start flag 33690 of the remaining two entries.
- the third entry (SYS1 / CTL3) is selected as an entry with a high certainty factor. Then, the failure events included in this candidate are extracted as EV2, EV4, and EV8.
- the fifth entry (IPSW1) is selected as another failure cause candidate including these failure events. Then, these two entries are grouped, GR2 is generated as a group ID, and the generated group ID is registered in the group ID registration field 33680 of the analysis result management table of these entries. Note that the group ID is already registered in the fifth row entry, but it is additionally registered to indicate that it belongs to a plurality of groups. For this purpose, the group ID registration field 33680 is structured so that a plurality of IDs can be registered. Furthermore, since the third-stage entry is handled as a reference for classification, Yes is recorded in the classification start flag 33690 of the third-stage entry.
- EV7 is extracted as not included in the entry in which Yes is recorded in the classification start flag 33690.
- cause candidates including EV7 there are a second-stage entry (SYS1 / CTL2) and a fifth-stage entry (IPSW1). If the same grouping is performed starting from the second-stage entry (SYS1 / CTL2) with a high degree of certainty, these two entries and the first-stage entry (SYS1 / CTL1) can be newly grouped. .
- all these entries are included in the group GR1.
- a group starting from the second-stage entry (SYS1 / CTL2) is also generated separately from GR1 so that all faults can be repaired by dealing with one entry of each group.
- GR4 is generated as the group ID, and the generated group ID is registered in the group ID registration field 33680 of the analysis result management table of these entries. Since each group already has a group ID registered, it is additionally registered. Further, since the second-stage entry is treated as a reference for classification, Yes is recorded in the classification start flag 33690 of the second-stage entry.
- FIG. 14 is a diagram illustrating a display example 71000 of a failure analysis result display screen that the management server 30000 displays to the user (administrator).
- the analysis results defined in the analysis result management table are displayed together with the group IDs that match.
- entries classified into a plurality of groups are displayed in duplicate in the plurality of groups.
- the cause candidate that is the starting point for grouping in each group is displayed at the top of the group.
- the other candidates are displayed in descending order of certainty.
- all the cause candidate groups are displayed on the same screen. However, since it is only necessary to divide and display each cause group, each group can be displayed on a separate screen and switched by a tab or the like. May be implemented.
- the administrator is likely to be able to efficiently remove the cause of the failure if he / she deals with the top candidate of each cause candidate group displayed on the screen of the management server 30000. I can know that.
- the classification results may be automatically collected. In this process, for example, first, it is determined whether or not a certain percentage or more of the condition events included in a certain classification result group is included in another classification result group. When condition events having a certain percentage of abnormality are included in different classification result groups, the cause candidates included in these groups are grouped into one group.
- the management software of the management server 30000 classifies the inferred failure cause candidates after the failure cause analysis processing shown in FIG. To display.
- classification can be performed so that all faults can be repaired by dealing with one entry at the top of each group.
- the cause candidate classification process is not performed, the contents of the list shown in FIG. 10 are displayed as they are as inferred failure cause candidates.
- Second Embodiment after presenting a cause candidate to the administrator according to the first embodiment, the cause candidate classification process is performed again based on the failure handling procedure performed by the administrator. Is. Since the system configuration and the configuration of each device are the same as those in the first embodiment, description thereof will be omitted.
- processing performed based on the operation of the administrator after the failure analysis result is displayed on the screen as shown in FIG. 14 according to the first embodiment will be described.
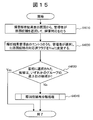
- FIG. 15 is a flowchart for explaining processing when the administrator performs a failure response using a failure analysis result in the second embodiment.
- the event analysis module 32500 has already dealt with the candidate selected by the administrator.
- the flag is changed to Yes (step 64020).
- classification is performed so that all faults can be repaired by dealing with one entry at the top of each group. Therefore, if the candidate selected first at the time of failure handling is the highest candidate in any group, the classification is performed so as to match the intention of the manager and the actual configuration status.
- the event analysis module 32500 performs cause candidate reclassification processing (steps 64030 to 64040).
- cause candidate reclassification processing steps 64030 to 64040.
- the fact that a candidate other than the top candidate has been selected indicates that the administrator does not trust the first classification result based on his / her own experience, etc. Classification is performed so that the administrator can deal with the cause candidates more efficiently.
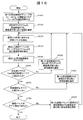
- FIG. 16 is a flowchart for explaining the details of the cause candidate reclassification process (step 64040) according to the second embodiment.
- the cause candidate reclassification process of this embodiment is the same as the process performed for the cause candidate classification process (steps 63010 to 63080) in the first embodiment, with the corresponding flag set to Yes. Priority should be given to the candidates that are present.
- the event analysis processing module 32500 first deletes the values of all candidate group ID fields 33680 and the classification start flag field 33690 as pre-processing (step 65005).
- the event analysis processing module 32500 selects, from the analysis result management table 33600, a cause candidate having the highest certainty among candidates whose corresponding flag field 33670 is set to Yes (step 65010). Then, the event analysis processing module 32500 registers Yes for the selected cause candidate entry in the classification start flag field 33690 of the analysis result management table 33600.
- the event analysis processing module 32500 acquires the reception event ID included in the selected candidate from the analysis result management table 33600 (step 65020). Then, the event analysis processing module 32500 acquires a cause candidate including any one or more of the same reception event IDs from the acquired reception event IDs from the analysis result management table 33600 (step 65030).
- the event analysis processing module 32500 acquires a list of group IDs used from the field 33680 for registering group IDs in the analysis result management table 33600, creates non-overlapping group IDs, and in step 65010 With respect to the selected cause candidate and the cause candidate entry acquired in step 65030, the contents of the field 33680 are updated to the created group ID (step 65040).
- the event analysis processing module 32500 determines from the analysis result management table 33600 whether there is an entry in which the group ID is not described in the field 33680 from among candidates whose corresponding flag field 33670 is set to Yes. To check. When such an entry exists (in the case of No in step 65050), a cause candidate having the highest certainty is selected from such entries (step 65060), and the cause candidate selected in the analysis result management table 33600 is selected. For the entry, Yes is registered in the classification start flag field 33690. And the process after step 65020 is performed again with respect to the selected candidate.
- the event analysis processing module 32500 When it is determined that all the cause candidates of the handled flag Yes are classified (Yes in Step 65050), the event analysis processing module 32500 has a group ID described in the field 33680 from the analysis result management table 33600. Check for missing entries. When such an entry exists (No in step 65070), the event analysis processing module 32500 selects a cause candidate having the highest certainty among such entries (step 65080), and an analysis result management table. For the selected cause candidate entry 33600, Yes is registered in the classification start flag field 33690. And the process after step 65020 is performed again with respect to the selected candidate.
- the event analysis processing module 32500 receives the received event of the analysis result management table 33600. All received event IDs are acquired from the ID field 33660.
- the event analysis processing module 32500 acquires an entry in which Yes is described in the classification start flag field 33690 of the analysis result management table 33600, and checks whether all received event IDs are included in the acquired entries. To do.
- the event analysis processing module 32500 When one or more reception IDs not included in the entry exist (No in step 65090), the event analysis processing module 32500 includes the cause candidate entries including the cause candidates including those reception IDs. Then, the cause candidate having the highest certainty factor is selected (step 65095), and Yes is registered in the classification starting point flag field 33690 for the entry of the selected cause candidate in the analysis result management table 33600. Then, the event analysis processing module 32500 performs the processing from step 65020 on the selected candidate again.
- the event analysis processing module 32500 acquires an entry in which Yes is described in the classification start flag field 33690 of the analysis result management table 33600, and if all received event IDs are included in the acquired entries (Yes in step 65090). ), The cause candidate reclassification process is terminated.
- the cause candidate reclassification processing performed by the event analysis processing module 32500.
- the relationship between the timing at which the handled flag is set to Yes and the timing at which the cause candidate reclassification processing is executed is not specified, but the administrator handles several cause candidates.
- the cause candidate reclassification process (FIG. 16) may be executed in accordance with an instruction from the administrator, or each time the handled flag is changed to Yes, the cause candidate reclassification process May be executed.
- the event analysis processing module 32500 first deletes all the cause candidate group ID fields and classification start flag field values in the analysis result management table 33600. Next, from the analysis result management table 33600, the entry with the highest certainty among the cause candidates whose corresponding flag is Yes is the entry of the IPSW device from the fifth row (fifth entry) of the analysis result management table. Select a failure cause candidate entry.
- the event analysis processing module 32500 extracts EV6, EV7, EV8, and EV9, which are failure events included in this candidate.
- the first row entry (SYS1 / CTL1)
- the second row entry (SYS1 / CTL2)
- the third row entry (SYS1 / CTL3)
- the fourth row Select the first entry (SYS1 / CTL4).
- these five entries are grouped, GR1 is generated as a group ID, and the generated group ID is registered in the group ID registration field 33680 of the analysis result management table of these entries.
- Yes is recorded in the classification start flag 33690 of the fifth row entry, and No is recorded in the remaining four entry classification start flag 33690.
- the event analysis processing module 32500 extracts a failure event that was not referred to when grouping.
- EV1, EV2, EV3, EV4, and EV5 are extracted as those not included in the entry whose Yes is recorded in the classification start flag 33690. Is done.
- the event analysis processing module 32500 groups these three entries, generates GR2 as a group ID, and registers the generated group ID in the group ID registration field 33680 of the analysis result management table of these entries. Further, since the event analysis processing module 32500 has handled the first-stage entry as a reference for performing classification, Yes is recorded in the classification start flag 33690 of the first-stage entry.
- the event analysis processing module 32500 assumes that all event IDs included in the received event ID field 33660 of the analysis result management table 33600 are not included in the entry whose Yes is recorded in the classification start flag 33690, EV2, EV4, Extract EV5. There are two entries, the third row entry and the fourth row entry, as cause candidates including them. If the same grouping is performed starting from the entry of the third level with a high certainty among these, the event analysis processing module 32500 will display the fifth level as other failure cause candidates including the failure events EV2, EV4, and EV8. Select the entry (IPSW1).
- the event analysis processing module 32500 groups these two entries, generates GR3 as a group ID, and registers the generated group ID in the group ID registration field 33680 of the analysis result management table of these entries. Further, since the third-stage entry has been handled as a reference for classification, the event analysis processing module 32500 records Yes in the classification start flag 33690 of the third-stage entry.
- the event analysis processing module 32500 determines that EV5 is not included in the entry whose Yes is recorded in the classification start flag 33690 among all event IDs included in the reception event ID field 33660 of the analysis result management table 33600. Extract. Further, when the event analysis processing module 32500 performs the same grouping starting from the entry in the fourth row as the cause candidates including them, the event analysis processing module 32500 sets the fifth step as other failure cause candidates including the failure events EV5 and EV9. Select the entry (IPSW1). The event analysis processing module 32500 groups these two entries, generates GR4 as the group ID, and registers the generated group ID in the group ID registration field 33680 of the analysis result management table of these entries. Furthermore, since the event analysis processing module 32500 has handled the fourth-stage entry as a reference for performing classification, Yes is recorded in the classification start flag 33690 of the fourth-stage entry.
- the event analysis processing module 32500 Since all the event IDs included in the received event ID field 33660 of the analysis result management table 33600 are not included in the entry whose Yes is recorded in the classification start flag 33690, the event analysis processing module 32500 causes the cause The candidate reclassification process is terminated.
- FIG. 17 is a diagram illustrating a display example 72000 of a failure analysis result display screen that the management server 30000 displays to the user (administrator) after the cause candidate reclassification processing.
- the analysis results defined in the analysis result management table are displayed together with the group IDs that match.
- entries classified into a plurality of groups are displayed in duplicate in the plurality of groups.
- the cause candidate that is the starting point for grouping in each group is displayed at the top of the group.
- the other candidates are displayed in descending order of certainty.
- all the cause candidate groups are displayed on the same screen. However, since the groups may be displayed separately for each group, a separate screen is displayed for each group. You may implement so that it may be displayed and switched with a tab etc.
- the management software of the management server 30000 allows the administrator to first select the cause of failure that was not displayed at the top of the group in the first embodiment.
- the failure cause candidate classification is executed again based on the failure cause.
- the management software of the present invention does not grasp that the administrator has selected IPSW1 displayed at the bottom of each group.
- the grouping is dynamically reconfigured according to the administrator's selection as in the second embodiment.
- IPSW1 causes of failure occurring in IPSW1
- it is classified and displayed which other cause of failure should be preferentially dealt with.
- the classification can be corrected accordingly, and the load required for handling the failure of the administrator can be reduced. it can.
- failure cause analysis After inferring the cause of the failure, a failure event applied to the analysis rule in the derivation process is acquired for each failure cause candidate inferred in the management server. Then, the failure cause candidates are classified based on the certainty factor of each cause candidate and the failure event that is the basis for derivation thereof.
- the present invention classifies cause candidates that commonly include failure events that are actually occurring as the same group. As a result, even when a plurality of failures due to different causes occur, it is possible to classify the cause candidates in a probable combination.
- the failure event may not be resolved even if the failure cause candidates of all the groups are dealt with.
- some other failure event causes the only candidate cause that can resolve this failure event to be accidentally categorized into a group, the only cause in the group that can be resolved for a particular failure event It may be considered that the failure event is not quickly dealt with because it is identified with many other cause candidates and as a result of the classification.
- a separate group is created for the cause candidate or cause candidate group to solve it. That is, the management server repeats the conclusion event classification process by changing the origin cause candidate, classifies all the conclusion events that are the cause of the failure, and then concludes events other than the conclusion event selected as the origin cause candidate (for example, If the second entry in FIG. 10 includes a residual condition event that is a conditional event other than the conditional event included in the conclusion event selected as the starting cause candidate, the conclusion event including the remaining condition event is set as the starting cause candidate. Further classification processing is executed. By doing this, it is possible to group the cause candidates without omission and to repair all the faults.
- the management server displays a failure analysis result based on such a classification result.
- the display is made so that the administrator can understand which other cause candidates are grouped with each other.
- the cause candidates may be displayed separately on different screens for each group based on the classification result, or displayed so that each group can be recognized after changing the order for each candidate group within the same screen.
- the groups to which the cause belongs may be displayed in each cause candidate entry.
- an abnormal state is detected from the performance value of each node device, and a failure cause candidate is presented to the administrator as an analysis result (calculation of certainty of the abnormal state).
- an event indicating some abnormal state is caused by an event of a specific abnormal state
- the analysis result is displayed in such a way that the administrator can understand the classification. More specifically, in the computer system of this embodiment, the management server (management system) acquires a processing performance value indicating the processing performance of the node device, and a failure has occurred in the node device from the acquired processing performance value.
- one of the conclusion events that are assumed to be the cause of the failure is selected as a starting cause candidate, and a condition event related to the starting cause candidate is extracted.
- the management server selects one or a plurality of conclusion events that are conclusion events related to the extracted condition event and that are different from the conclusion event of the origin cause candidate as related cause candidates, The conclusion event of the cause candidate and the conclusion event of the related cause candidate are classified and processed separately from the other conclusion events. Then, the management server displays the classified conclusion event on the display screen.
- the management server distinguishes the conclusion event that is the cause of the failure for each classification result according to the classification result of the conclusion event corresponding to the origin cause candidate and the related cause candidate and displays them on the display screen. By doing so, it is possible to easily determine the analysis result to be dealt with and manage separately the dealt result and the unhandled result.
- the management server classifies the conclusion event of the related cause candidate including at least one condition event related to the conclusion event of the origin cause candidate in the analysis rule as the same group as the conclusion event of the origin cause candidate To do.
- the classification conditions are clarified, and cause candidates that can be resolved simultaneously when dealing with the starting cause candidates are classified into the same group, so that the burden on the administrator can be reduced. become.
- the conclusion event with the highest certainty factor may be selected as the origin cause candidate.
- the origin cause candidate may be selected as the origin cause candidate.
- the management server that performs failure analysis does not always fully understand the external situation surrounding the management target. Therefore, it cannot be denied that the cause of failure presented by the classification result in the present embodiment may be different from the event that the administrator actually considers as the cause of failure. Therefore, when an administrator selects a cause cause with a low priority (confidence) and performs failure recovery, grouping is dynamically reconfigured according to the administrator's selection (No. 1). 2 embodiment). That is, in the classification result including a plurality of classification groups, the management server executes classification processing again based on information about which classification group is included in the classification group at the time of failure handling. decide. That is, the classification process is executed again with the conclusion event selected at the time of handling the failure as the starting cause candidate. By dynamically executing the classification process again in this manner, the administrator can execute a failure handling based on experience, and can efficiently manage the computer system.
- the present invention can also be realized by a program code of software that realizes the functions of the embodiment.
- a storage medium in which the program code is recorded is provided to the system or apparatus, and the computer (or CPU or MPU) of the system or apparatus reads the program code stored in the storage medium.
- the program code itself read from the storage medium realizes the functions of the above-described embodiments, and the program code itself and the storage medium storing the program code constitute the present invention.
- a storage medium for supplying such program code for example, a flexible disk, CD-ROM, DVD-ROM, hard disk, optical disk, magneto-optical disk, CD-R, magnetic tape, nonvolatile memory card, ROM Etc. are used.
- an OS operating system
- the computer CPU or the like performs part or all of the actual processing based on the instruction of the program code.
- the program code is stored in a storage means such as a hard disk or memory of a system or apparatus, or a storage medium such as a CD-RW or CD-R
- the computer (or CPU or MPU) of the system or apparatus may read and execute the program code stored in the storage means or the storage medium when used.
- Server 20000 Storage device 30000: Management server 35000: Web browser activation server 40000: IP switch 45000: Network
Landscapes
- Engineering & Computer Science (AREA)
- Theoretical Computer Science (AREA)
- Quality & Reliability (AREA)
- Physics & Mathematics (AREA)
- General Engineering & Computer Science (AREA)
- General Physics & Mathematics (AREA)
- Health & Medical Sciences (AREA)
- Biomedical Technology (AREA)
- Debugging And Monitoring (AREA)
- Management, Administration, Business Operations System, And Electronic Commerce (AREA)
Abstract
監視対象の機器における障害を解消させるために要する時間を短くすることができる障害解析結果分類機能を提供する。障害解析処理中に得られた障害解析結果(障害原因候補)を、その導出根拠となった機器異常状態の障害イベントに他のどの障害原因候補が関連しているかを解析することによって、その障害原因候補に対応した場合の影響範囲ごとに、障害原因候補を分類する。さらにその分類結果をGUI表示する。
Description
本発明は、計算機システムの管理方法及び管理システムに関し、例えば、計算機システムを構成するホストコンピュータ、ネットワークスイッチおよびストレージシステムの障害を管理する技術に関する。
計算機システムを管理する場合、例えば特許文献1に示されるように、システム内で検知した複数の障害もしくはその兆候の中から、原因となる事象(イベント)を検出することが行われている。より具体的に、特許文献1では、管理ソフトウェアを用いて、管理下機器における性能値の閾値超過をイベント化し、イベントDBに情報を蓄積する。
また、この管理ソフトウェアは、管理下機器において発生した複数の障害イベントの因果関係を解析するための解析エンジンを持っている。この解析エンジンは、管理下機器のインベントリ情報を持つ構成DBにアクセスして、I/O経路上のパス上にある機器内構成要素を認識し、ホスト上の論理ボリュームの性能に影響を与えうる構成要素を「トポロジ」と呼ばれる一グループとして認識する。そして、解析エンジンは、イベントが発生すると各トポロジに対し、事前に定められた条件文と解析結果からなる解析ルールを適用して展開ルールを構築する。この展開ルールには、他装置における性能低下の原因である原因イベントと、それによって引き起こされている関連イベント群が含まれる。具体的には、ルールのTHEN部に障害の原因として記載されているイベントが原因イベント、IF部に記載されているイベントのうち原因イベント以外のものが関連イベントである。
特許文献1による障害解析機能では、管理対象機器から受信するイベントの組み合わせと、障害の原因候補をIF-THEN形式のルールとして記述しておく。障害解析機能は、ルールのIF部に記載されたイベントの発生割合を計算することで、THEN部に記載された障害原因候補の確信度を算出する。算出した確信度と障害原因候補は、ユーザの求めに応じてGUI表示される。
しかしながら、このような従来の障害解析機能においては、障害が短い期間に頻発すると、保存される障害解析結果の数が多くなってしまい、管理者としてはどれが本当に対処すべき障害なのか判断できないことがある。このため、監視対象の機器における障害を解消するまでに要する時間が長くなってしまい、事態をより深刻にしてしまうことがある。
本発明はこのような状況に鑑みてなされたものであり、監視対象の機器における障害を解消させるために要する時間を短くするための機能を提供するものである。
上記課題を解決するために、本発明では、障害原因解析処理の後に、得られた原因候補を影響範囲ごとに分類する。原因候補が関連する障害イベントによって分類してグループ化し、それらを区別してGUI表示する。より具体的には、まず障害原因解析の結果として原因候補群を推論したとき、導出根拠となる機器異常状態が同一である原因候補群を分類する。そして同一の機器異常状態によって導出された原因候補群を、同一の障害を解決するための原因候補の集合であるとみなし、それらを分類してGUI表示する。
即ち、本発明によれば、管理システムが、ノード装置の処理性能を示す処理性能値を取得し、当該取得した処理性能値から前記ノード装置に障害が発生したことを検知する。そして、管理システムが、検知した障害を、ノード装置で発生し得る1つ以上の条件イベントの組み合わせと条件イベントの組み合わせの障害原因とされる結論イベントとの関係を示す解析ルールに適用し、ノード装置における障害の発生の可能性を示す情報である確信度を算出する。さらに、管理システムは、複数の障害原因とされる結論イベントの1つを起点原因候補として選択し、起点原因候補に関係する条件イベントを抽出する。また、管理システムは、抽出された条件イベントに関係する結論イベントであって、起点原因候補の結論イベントとは異なる1つ又は複数の障害原因とされる結論イベントを関連原因候補として選択し、起点原因候補の結論イベントと前記関連原因候補の結論イベントを、他の結論イベントとは別個に分類処理する。その分類された結論イベントは、表示画面にGUI表示される。
さらなる本発明の特徴は、以下本発明を実施するための形態および添付図面によって明らかになるものである。
本発明によれば、障害解析結果を管理者(ユーザ)に提示する際、推論した障害原因候補を、それによって解決される障害にかかわる障害イベントによって分類して表示することにより、管理者が解析結果の対応優先度を容易に判断でき、解析結果確認と障害対応に要する負荷を軽減することができる。
本発明の実施形態は、ITシステム障害解消のための障害原因解析に関するものである。前述のように、従来技術でも障害原因候補を管理者に提示して障害に対処可能なようにしている。ところが、複数の障害原因によって多数の原因候補が発生した場合、実際に発生しているどの障害原因にどの原因候補が関連するのかを把握しないと、効率的に障害対応を行うことができない。例えば、確信度に基づき、上位数候補に対して障害対応を実施したとしても、それらの候補は実際には同じ装置に発生した障害に起因する障害原因の候補かもしれない。また、他の装置にも障害が発生していて、それに起因する障害原因候補が低い優先度で提示されていたのならば、上位数候補分と同じレベルでその候補についても対応すべきである。しかし、障害原因解析を行うソフトウェアには、複数の障害原因によって多数の原因候補が発生した場合に、それらを原因候補の影響する範囲に応じてグループ化する方法がない。このため管理者は、どの原因候補に優先的に対応すべきか、判断することが困難である。つまり、従来の障害解析結果にはどの障害原因候補が関連しているかを示す情報がないため、管理者が優先的に対策を行うべき解析結果を参照するまでの時間が長くなり、結果的に障害の解消までに要する時間が長くなってしまう。
そこで、本発明の実施形態では、より信頼度が高く優先的に対処すべき原因候補を提示するための機能を提供する。
以下、添付図面を参照して本発明の実施形態について説明する。ただし、本実施形態は本発明を実現するための一例に過ぎず、本発明の技術的範囲を限定するものではないことに注意すべきである。また、各図において共通の構成については同一の参照番号が付されている。
なお、本明細書では「aaa表」という表現によって本発明で用いられる情報について説明しているが、「aaaテーブル」、「aaaリスト」、「aaaDB」、「aaaキュー」等の表現や、テーブル、リスト、DB、キュー等のデータ構造以外で表現されていてもよい。このため、本発明で用いられる情報が、データ構造に依存しないことを示すために、「aaaテーブル」、「aaaリスト」、「aaaDB」、「aaaキュー」等について「aaa情報」と呼ぶことがある。
また、各情報の内容を説明する際に、「識別情報」、「識別子」、「名」、「名前」、「ID」という表現を用いるが、これらについてはお互いに置換が可能である。
さらに、以後の本発明の処理動作の説明では、「プログラム」や「モジュール」を動作主体(主語)として説明を行う場合があるが、プログラムやモジュールは、プロセッサによって実行されることで、定められた処理をメモリ及び通信ポート(通信制御装置)を用いながら行うため、プロセッサを動作主体(主語)とした処理に読み替えても良い。また、プログラムやモジュールを主語として開示された処理は、管理サーバ等の計算機、情報処理装置が行う処理としてもよい。プログラムの一部または全ては専用ハードウェアによって実現されてもよい。また、各種プログラムはプログラム配布サーバや記憶メディアによって各計算機にインストールされてもよい。
また本明細書で記載する実施形態においては、管理対象とするシステムの規模については言及しない。しかし、システムが大規模になればなるほど、同時多発的に障害が複数個所で発生する可能性が高くなる。そのため、大規模システムを対象に本発明を適用した場合には、本発明の効果をより享受できる。
(1)第1の実施形態
第1の実施形態は、管理ソフトウェア(例えば、管理サーバに含まれる)による障害原因候補表示処理に関するものである。
第1の実施形態は、管理ソフトウェア(例えば、管理サーバに含まれる)による障害原因候補表示処理に関するものである。
<システム構成>
図1は、本発明による計算機システムの物理的構成を示す図である。当該計算機システム1は、ストレージ装置20000と、ホストコンピュータ10000と、管理サーバ30000と、WEBブラウザ起動サーバ35000と、IPスイッチ40000とを有し、それらが、ネットワーク45000によって接続される構成となっている。
図1は、本発明による計算機システムの物理的構成を示す図である。当該計算機システム1は、ストレージ装置20000と、ホストコンピュータ10000と、管理サーバ30000と、WEBブラウザ起動サーバ35000と、IPスイッチ40000とを有し、それらが、ネットワーク45000によって接続される構成となっている。
ホストコンピュータ10000乃至10010は、例えば、それらに接続された、図示しないクライアントコンピュータからファイルのI/O要求を受信し、それに基づいてストレージ装置20000乃至20010へのアクセスを実現する。また、管理サーバ(管理計算機)30000は、当該計算機システム全体の運用を管理するものである。
WEBブラウザ起動サーバ35000は、ネットワーク45000を介して、管理サーバ30000のGUI表示処理モジュール32400と通信し、WEBブラウザ上に各種情報を表示する。ユーザはWEBブラウザ起動サーバ上のWEBブラウザに表示された情報を参照することで、計算機システム内の装置を管理する。ただし、管理サーバ30000と、WEBブラウザ起動サーバ35000は1台のサーバから構成されていてもよい。
<ホストコンピュータの内部構成>
図2は、本発明によるホストコンピュータ10000の詳細な内部構成例を示す図である。ホストコンピュータ10000は、ネットワーク45000に接続するためのポート11000と、プロセッサ12000と、メモリ13000とを有し(ディスク装置を構成として含んでも良い)、これらは内部バス等の回路を介して相互に接続される構成となっている。
図2は、本発明によるホストコンピュータ10000の詳細な内部構成例を示す図である。ホストコンピュータ10000は、ネットワーク45000に接続するためのポート11000と、プロセッサ12000と、メモリ13000とを有し(ディスク装置を構成として含んでも良い)、これらは内部バス等の回路を介して相互に接続される構成となっている。
メモリ13000には、業務アプリケーション13100と、オペレーティングシステム13200が格納されている。
業務アプリケーション13100は、オペレーティングシステム13200から提供された記憶領域を使用し、当該記憶領域に対しデータ入出力(以下、I/Oと表記)を行う。
オペレーティングシステム13200は、ネットワーク45000を介してホストコンピュータ10000に接続されたストレージ装置20000乃至20010上の論理ボリュームを記憶領域として業務アプリケーション13100に認識させるための処理を実行する。
ポート11000は、ストレージ装置20000とiSCSIにより通信を行うためのI/Oポートと、管理サーバ30000がホストコンピュータ10000乃至10010内の管理情報を取得するための管理ポートを含む単一のポートとして図2で表現されているが、iSCSIにより通信を行うためのI/Oポートと管理ポートに分かれていてもよい。
<ストレージ装置の内部構成>
図3は、本発明によるストレージ装置20000の詳細な内部構成例を示す図である。ストレージ装置20010も同様の構成を有している。
図3は、本発明によるストレージ装置20000の詳細な内部構成例を示す図である。ストレージ装置20010も同様の構成を有している。
ストレージ装置20000は、ネットワーク45000を介してホストコンピュータ10000に接続するためのI/Oポート21000及び21010と、ネットワーク45000を介して管理サーバ30000に接続するための管理ポート21100と、各種管理情報を格納するための管理メモリ23000と、データを格納するためのRAIDグループ24000乃至24010と、データや管理メモリ内の管理情報を制御するためのコントローラ25000及び25010とを有し、これらが内部バス等の回路を介して相互に接続される構成となっている。なお、RAIDグループ24000乃至24010の接続とは、より正確にはRAIDグループ24000乃至24010を構成する記憶デバイスが他の構成物と接続されていることを指す。
管理メモリ23000には、ストレージ装置の管理プログラム23100が格納される。管理プログラム23100は管理ポート21100を経由して管理サーバ30000と通信し、管理サーバ30000に対しストレージ装置20000の構成情報を提供する。
RAIDグループ24000乃至24010は、それぞれ、1つまたは複数の磁気ディスク24200、24210、24220、及び24230によって構成されている。複数の磁気ディスクによって構成されている場合、それらの磁気ディスクはRAID構成を組んでいてもよい。また、RAIDグループ24000乃至24010は、論理的に複数のボリューム24100乃至24110に分割されている。
なお、論理ボリューム24100及び24110は、1つ以上の磁気ディスクの記憶領域を用いて構成されるのであれば、RAID構成を組まなくてもよい。さらに、論理ボリュームに対応する記憶領域を提供するのであれば、磁気ディスクの代わりとしてフラッシュメモリなど他の記憶媒体を用いた記憶デバイスでも良いものとする。
コントローラ25000及び25010は、その内部に、ストレージ装置20000内の制御を行うプロセッサや、ホストコンピュータ10000との間でやりとりするデータを一時的に記憶するキャッシュメモリを持っている。そして、それぞれのコントローラは、I/OポートとRAIDグループの間に介在し、両者の間でデータの受け渡しを行う。
なお、ストレージ装置20000は、何れかのホストコンピュータに対して論理ボリュームを提供し、アクセス要求(I/O要求を指す)を受信し、受信したアクセス要求に応じて記憶デバイスへの読み書きを行うストレージコントローラと、記憶領域を提供する前述の記憶デバイスを含めば、図3及び上記説明以外の構成でもよく、例えば、ストレージコントローラと記憶領域を提供する記憶デバイスが別な筐体に格納されていてもよい。即ち、図3の例では管理メモリ23000とコントローラ25000及び25110とが別個の存在として設けられているが、それらが一体となったストレージコントローラとして構成しても良い。また、本明細書ではストレージコントローラと記憶デバイスが同じ筐体に存在する場合または別な筐体を含む表現として、ストレージ装置をストレージシステムと呼び変えても良い。
<管理サーバの内部構成>
図4は、本発明による管理サーバ30000の詳細な内部構成例を示す図である。管理サーバ30000は、ネットワーク45000に接続するための管理ポート31000と、プロセッサ31100と、キャッシュメモリ等のメモリ32000と、HDD等の二次記憶装置(二次記憶領域)33000と、後述する処理結果を出力するためのディスプレイ装置等の出力デバイス31200と、ストレージ管理者が指示を入力するためのキーボード等の入力デバイス31300とを有し、これらが内部バス等の回路を介して相互に接続される構成となっている。
図4は、本発明による管理サーバ30000の詳細な内部構成例を示す図である。管理サーバ30000は、ネットワーク45000に接続するための管理ポート31000と、プロセッサ31100と、キャッシュメモリ等のメモリ32000と、HDD等の二次記憶装置(二次記憶領域)33000と、後述する処理結果を出力するためのディスプレイ装置等の出力デバイス31200と、ストレージ管理者が指示を入力するためのキーボード等の入力デバイス31300とを有し、これらが内部バス等の回路を介して相互に接続される構成となっている。
メモリ32000には、プログラム制御モジュール32100と、構成管理情報取得モジュール32200と、装置性能取得モジュール32300と、GUI表示処理モジュール32400と、イベント解析処理モジュール32500と、ルール展開モジュール32600とが格納されている。なお、図4においては、各モジュールはメモリ32000のソフトウェアモジュールとして提供されているが、ハードウェアモジュールとして提供されるものであっても良い。また、各モジュールが行う処理が一つ以上のプログラムコードとして提供されても良く、モジュール間の明確な境界が存在しなくても良い。モジュールは、プログラムと読み替えても良い。
二次記憶領域33000には、装置性能管理表33100と、ボリュームトポロジ管理表33200と、イベント管理表33300と、汎用ルールリポジトリ33400と、展開ルールリポジトリ33500と、解析結果管理表33600が格納されている。なお、二次記憶領域33000は、半導体メモリまたは磁気ディスクのいずれか、もしくは半導体メモリおよび磁気ディスク両方から構成される。
GUI表示処理モジュール32400は、入力デバイス31300を介した管理者からの要求に応じ、取得した構成管理情報を出力デバイス31200を介して表示する。なお、入力デバイスと出力デバイスは別々なデバイスでもよく、一つ以上のまとまったデバイスでもよい。
なお、管理サーバ(管理計算機)30000は、例えば、入力デバイス31300としてキーボードとポインタデバイス等、出力デバイス31200としてディスプレイやプリンタ等とを有しているが、これ以外の装置であってもよい。また、入出力デバイスの代替としてシリアルインターフェースやイーサーネットインターフェースを用い、当該インターフェースにディスプレイ又はキーボード又はポインタデバイスを有する表示用計算機を接続し、表示用情報を表示用計算機に送信したり、入力用情報を表示用計算機から受信することで、表示用計算機で表示を行ったり、入力を受け付けることで入出力デバイスでの入力及び表示を代替してもよい。
本明細書では、計算機システム(情報処理システム)1を管理し、表示用情報を表示する一つ以上の計算機の集合を管理システムと呼ぶことがある。管理サーバ30000が表示用情報を表示する場合は、管理サーバ30000が管理システムであり、また、管理サーバ30000と表示用計算機(例えば図1のWEBブラウザ起動サーバ35000)の組み合わせも管理システムである。また、管理処理の高速化や高信頼化のために複数の計算機で管理サーバと同等の処理を実現してもよく、この場合は当該複数の計算機(表示を表示用計算機が行う場合は表示用計算機も含め)が管理システムである。
<装置性能管理表の構成>
図5は、管理サーバ30000が有する装置性能管理表33100の構成例を示す図である。
図5は、管理サーバ30000が有する装置性能管理表33100の構成例を示す図である。
装置性能管理表33100は、管理対象となる機器の識別子となる装置IDを登録するフィールド33110と、管理対象機器内部のデバイスの識別子であるデバイスIDを登録するフィールド33120と、管理対象デバイスの性能情報のメトリック名称を格納するフィールド33130と、閾値異常(「閾値に基づいて異常であると判断されたもの」の意味である)を検知した機器のOS種別を登録するフィールド33140と、管理対象デバイスの性能値を該当装置から取得して格納するフィールド33150と、管理対象デバイスの性能値の正常範囲の上限もしくは下限である閾値(アラート実行閾値)を、ユーザからの入力を受けて格納するフィールド33160と、閾値が正常値の上限であるのか下限であるのかを登録するためのフィールド33170と、性能値が正常値であるか異常値であるかを登録するためのフィールド33180と、を構成項目として含んでいる。
例えば、図5の第1行目(1つ目のエントリ)からは、ストレージ装置SYS1内のコントローラCTL1におけるプロセッサの稼働率が現時点で40%(33150参照)であり、CTL1の稼働率が20%を超えた場合(33160参照)に管理サーバ30000はコントローラCTL1が過負荷であると判断するが、当該具体例では本性能値が異常値であると判断されている(33180参照)ことが分かる。
なお、ここでは管理サーバ30000が管理するデバイスの性能値として単位時間当たりのI/O量、稼働率やレスポンスタイムを例として挙げたが、管理サーバ30000が管理する性能値はこれ以外でも良い。
<ボリュームトポロジ管理表の構成>
図6は、管理サーバ30000の有するボリュームトポロジ管理表33200の構成例を示す図である。
図6は、管理サーバ30000の有するボリュームトポロジ管理表33200の構成例を示す図である。
ボリュームトポロジ管理表33200は、ストレージ装置の識別子となる装置IDを登録するフィールド33210と、ストレージ装置が有するボリュームの識別子となるボリュームIDを登録するフィールド33220と、ホストコンピュータ10000が利用するLU(Logical Unit)の識別子となるLU番号を登録するフィールド33230と、ポートとボリュームとの通信の際に使用するコントローラのIDを登録するフィールド33240と、ボリュームが接続するホストコンピュータ10000の識別子を登録するフィールド33250と、ボリュームが実体となるホストコンピュータ10000の論理ボリュームのドライブ名を登録するフィールド33260とを構成項目として含んでいる。
例えば、図6の第1行目(1つ目のエントリ)からは、ストレージ装置SYS1のボリュームVOL1を、LU1で示される論理ユニットとしてホストコンピュータに提供し、 CTL1で示されるストレージ側のコントローラを介してホストコンピュータHOST1と接続し、ホスト上で論理ボリューム(/var)として認識されていることが分かる。
<イベント管理表の構成>
図7は、管理サーバ30000が有するイベント管理表33300の構成例を示す図である。このイベント管理表33300は、後述する障害原因解析処理、原因候補分類処理において適宜参照されるものである。
図7は、管理サーバ30000が有するイベント管理表33300の構成例を示す図である。このイベント管理表33300は、後述する障害原因解析処理、原因候補分類処理において適宜参照されるものである。
イベント管理表33300は、イベント自身の識別子となるイベントIDを登録するフィールド33310と、取得した性能値に閾値異常といったイベントの発生した機器の識別子となる装置IDを登録するフィールド33320と、イベントの発生した機器内の部位の識別子を登録するフィールド33330と、閾値異常を検知したメトリックの名称を登録するフィールド33340と、閾値異常が検知された機器のOS種別を登録するフィールド33350と、機器内の部位のイベント発生時の状態を登録するフィールド33360と、イベントが後述するイベント解析処理モジュール32500によって解析済みかどうかを登録するフィールド33370と、イベントが発生した日時を登録するフィールド33380とを構成項目として含んでいる。
例えば、図7の第1行目(1つ目のエントリ)からは、管理サーバ30000が、ストレージ装置SYS1の、CTL1で示されるコントローラにおけるプロセッサ稼働率の閾値異常を検知し、そのイベントIDはEV1であることが分かる。
<汎用ルールの構成>
図8A及びBは、管理サーバ30000が有する汎用ルールリポジトリ33400内の汎用ルールの構成例を示す図である。汎用ルール(後述の展開ルールも同様)は、計算機システム1を構成するノード装置で発生し得る1つ以上の条件イベントの組み合わせとその条件イベントの組み合わせに対して障害原因とされる結論イベントとの関係を示すものである。つまり、汎用ルール及び後述の展開ルールは、条件部におけるイベントが発生したときに、結論部に記述された内容が障害原因となりうることを示すものである。
図8A及びBは、管理サーバ30000が有する汎用ルールリポジトリ33400内の汎用ルールの構成例を示す図である。汎用ルール(後述の展開ルールも同様)は、計算機システム1を構成するノード装置で発生し得る1つ以上の条件イベントの組み合わせとその条件イベントの組み合わせに対して障害原因とされる結論イベントとの関係を示すものである。つまり、汎用ルール及び後述の展開ルールは、条件部におけるイベントが発生したときに、結論部に記述された内容が障害原因となりうることを示すものである。
一般的に、障害解析において原因を特定するためのイベント伝播モデルは、ある障害の結果発生することが予想されるイベントの組み合わせと、その原因を”IF-THEN”形式で記載するものとなっている。なお、汎用ルールは図8A及びBに挙げられたものに限られず、さらに多くのルールがあっても構わない。
汎用ルールは、汎用ルールの識別子となる汎用ルールIDを登録するフィールド33430と、”IF-THEN”形式で記載した汎用ルールのIF部に相当する観測事象を登録するフィールド33410と、”IF-THEN”形式で記載した汎用ルールのTHEN部に相当する原因事象を登録するためのフィールド33420と、汎用ルールを実システムに展開し、展開ルールを生成する際に取得するトポロジを登録するためのフィールド33440とを構成項目として含んでいる。条件部33410のイベントが検知されたら結論部33420のイベントが障害の原因であり、結論部33420のステータスが正常になれば、条件部33410の問題も解決しているという関係にあるものである。図8A及びBの例では、条件部33410には3つのイベントが記述されているが、イベント数に制限はない。
例えば、図8Aからは、汎用ルールIDがRule1で示される汎用ルールが、観測事象としてホストコンピュータ上の論理ボリュームのレスポンスタイムの閾値異常(関連イベント)と、ストレージ装置におけるコントローラの稼働率(プロセッサ使用率)の閾値異常(原因イベント)と、ストレージ装置におけるLUの単位時間のI/O量の閾値異常 (関連イベント)を検知したとき、ストレージ装置のコントローラの稼働率(プロセッサ使用率)のボトルネックが障害の原因であると結論付けられるということが分かる。
なお、展開ルールを生成する際にはボリュームトポロジ管理表からトポロジ情報を取得する。また、観測事象に含まれるイベントとして、ある条件が正常であることを定義してもよい。図8Bに示す汎用ルールの例では、ストレージ装置のコントローラのプロセッサ使用率や、ストレージ装置におけるLUの単位時間のI/O量が正常であることを観測事象として定義している。
<展開ルールの構成>
図9A乃至Hは、管理サーバ30000が有する展開ルールリポジトリ33500内の展開ルールの構成例を示す図である。これらの展開ルールは、汎用ルール(図8A及びB)にボリュームトポロジ管理表(図7)の各エントリの項目を挿入することによって生成される。
図9A乃至Hは、管理サーバ30000が有する展開ルールリポジトリ33500内の展開ルールの構成例を示す図である。これらの展開ルールは、汎用ルール(図8A及びB)にボリュームトポロジ管理表(図7)の各エントリの項目を挿入することによって生成される。
展開ルールは、展開ルールの識別子となる展開ルールIDを登録するフィールド33530と、展開ルールの基となった汎用ルールの識別子となる汎用ルールIDを登録するためのフィールド33540と、”IF-THEN”形式で記載した展開ルールのIF部に相当する観測事象を登録するフィールド33510と、”IF-THEN”形式で記載した展開ルールのTHEN部に相当する原因事象を登録するためのフィールド33520とを構成項目として含んでいる。
例えば、図9Aの展開ルールは、汎用ルールIDがRule1における装置種別及び装置部位種別に、図6の第1エントリのコントローラ名32240とホストID32250と、接続先ドライブ名32260とLU番号32230を挿入することによって生成される。そして、図9Aからは、展開ルールIDがExRule1-1で示される展開ルールが、汎用ルールIDがRule1で示される汎用ルールを基に展開され、観測事象としてホストコンピュータ上の論理ボリュームのレスポンスタイムの閾値異常と、ストレージ装置におけるコントローラの稼働率(プロセッサの使用率)の閾値異常と、ストレージ装置におけるLUの単位時間のI/O量の閾値異常を検知したとき、ストレージ装置のコントローラの稼働率(プロセッサ使用率)のボトルネックが障害原因と結論付けられることが分かる。
<解析結果管理表の構成>
図10は、管理サーバ30000の有する解析結果管理表33600の構成例を示す図である。
図10は、管理サーバ30000の有する解析結果管理表33600の構成例を示す図である。
解析結果管理表33600は、障害原因解析処理において障害の原因と判断されたイベントの発生した機器の識別子となる装置IDを登録するフィールド33610と、イベントの発生した機器内の部位の識別子を登録するフィールド33620と、閾値異常を検知したメトリックの名称を登録するフィールド33630と、展開ルールにおいて条件部に記載されたイベントの発生割合を登録するフィールド33640と、イベントを障害の原因と判断した根拠となる展開ルールのIDを登録するフィールド33650と、展開ルールにおいて条件部に記載されたイベントのうち、実際に受信したイベントのIDを登録するフィールド33660と、該解析結果を基にユーザである管理者が実際に障害対応を行ったかどうかを登録するフィールド33670と、分類したグループIDを登録するフィールド33680と、分類の際に該解析結果から開始して行ったかどうかを登録するフィールド33690と、イベント発生に伴う障害解析処理を開始した日時を登録するフィールド33695とを構成項目として含んでいる。
例えば、図10の第1段目(1つ目のエントリ)からは、展開ルールExRule1-1に基づき、管理サーバ30000がストレージ装置SYS1の、CTL1で示されるコントローラにおけるプロセッサ稼働率の閾値異常を障害原因として判断し、その根拠としてイベントIDがEV1およびEV3およびEV6で示されるイベントを受信し、すなわち条件イベントの発生割合が3/3であることが分かる。
<構成管理情報の取得処理及び、ボリュームトポロジ管理表の更新処理>
プログラム制御モジュール32100は、例えばポーリング処理によって、構成情報取得モジュール32200に対し、計算機システム1内のストレージ装置20000、ホストコンピュータ10000およびIPスイッチ40000から、構成管理情報を定期的に取得するよう指示する。
プログラム制御モジュール32100は、例えばポーリング処理によって、構成情報取得モジュール32200に対し、計算機システム1内のストレージ装置20000、ホストコンピュータ10000およびIPスイッチ40000から、構成管理情報を定期的に取得するよう指示する。
構成管理情報取得モジュール32200は、ストレージ装置20000およびホストコンピュータ10000およびIPスイッチ40000から構成管理情報を取得するとともに、ボリュームトポロジ管理表33200を更新する。
<装置性能情報取得処理及びイベント解析処理>
図11は、管理サーバ30000の装置性能取得モジュール32300が実行する通常の装置性能情報取得処理を説明するためのフローチャートである。プログラム制御モジュール32100は、プログラムの起動時、もしくは前回の装置性能情報取得処理から一定時間経過するたびに、装置性能取得モジュール32300に対し、装置性能情報取得処理を実行するよう指示する。なお、当該実行指示を繰り返し出す場合は厳密に一定期間毎である必要は無く、繰り返しさえしていればよい。
図11は、管理サーバ30000の装置性能取得モジュール32300が実行する通常の装置性能情報取得処理を説明するためのフローチャートである。プログラム制御モジュール32100は、プログラムの起動時、もしくは前回の装置性能情報取得処理から一定時間経過するたびに、装置性能取得モジュール32300に対し、装置性能情報取得処理を実行するよう指示する。なお、当該実行指示を繰り返し出す場合は厳密に一定期間毎である必要は無く、繰り返しさえしていればよい。
装置性能情報取得モジュール32300は、監視対象の各装置に対し、以下の一連の処理を繰り返す。
装置性能情報取得モジュール32300は、まず、監視対象の各装置に対し、構成管理情報を送信するよう指示する(ステップ61010)。
装置性能情報取得モジュール32300は、監視対象装置からの応答があったか否か判断し(ステップ61020)、装置から装置性能情報の応答があれば(ステップ61020でYesの場合)、取得した装置性能情報を装置性能管理表33100に格納する(ステップ61030)。装置から構成管理情報の応答がなかった場合(ステップ61020でNoの場合)、構成管理情報取得処理は終了する。
次に、装置性能取得モジュール32300は、装置性能管理表33100に格納された装置性能情報を参照し、各性能値に対してステップ61050からステップ61070の処理を繰り返す(ステップ61040)。装置性能取得モジュール32300は、性能値が閾値を超過しているかを確認し、装置性能管理表33100に登録された状態を更新する(ステップ61050)。そして、装置性能取得モジュール32300は、状態が正常から閾値異常に、或いは閾値異常から正常に変化したか否か判断し(ステップ61060)、状態が変化した場合(ステップ61060でYesの場合)、イベント管理表33700にイベントを登録する(ステップ61070)。状態が変化していない場合(ステップ61060でNoの場合)、全ての性能値に対する状態確認処理が終わっていなければ、処理はステップ61050に戻る。
全ての性能値に対する上記の処理が終了した後、装置性能取得モジュール32300は、一連の処理で新規に追加したイベントがあるか否か判断する(ステップ61080)。追加イベントがあれば(例えば、処理中に新たな異常が発生したような場合)、プログラム制御モジュール32100は、イベント解析処理モジュール32500に対し、図12に示す障害原因解析処理を行なうよう指示する(ステップ61090)。
以上が、装置性能取得モジュール32300が実施する装置性能情報取得処理である。
<障害解析処理(ステップ61090)の詳細>
図12は、管理サーバ30000のイベント解析処理モジュール32500が実行する障害原因解析処理(図11のステップ61090)の詳細を説明するためのフローチャートである。
図12は、管理サーバ30000のイベント解析処理モジュール32500が実行する障害原因解析処理(図11のステップ61090)の詳細を説明するためのフローチャートである。
イベント解析処理モジュール32500は、イベント管理表33300より、解析済フラグがYesになっていないイベントを取得する(ステップ62010)。
次に、イベント解析処理モジュール32500は、展開ルールリポジトリ33500内の各展開ルールに対し、ステップ62020からステップ62040の処理を繰り返す(ステップ62020)。イベント解析処理モジュール32500は、まず、展開ルールに記載された条件部に対応する各イベントについて、過去一定期間の発生件数を算出する(ステップ62030)。
続いて、イベント解析処理モジュール32500は、原因候補分類処理(図13)を実行する(ステップ62050)。そして、イベント解析処理モジュール32500は、ステップ62030の処理において集計したイベント発生数が、条件部に記載された全イベントにおいて一定の比率を超過したか否か判断し、超過している場合には GUI表示処理モジュール32400に対し、障害原因になるイベントを、条件文中のイベント発生割合と共に、ステップ62050で行った分類に基づいて表示するよう指示する(ステップ62060)。その後イベント管理表33300を参照して、ステップ62010で取得したイベントについて解析済フラグ33370をYesに設定する(ステップ62070)。
続いて、イベント解析処理モジュール32500は、原因候補分類処理(図13)を実行する(ステップ62050)。そして、イベント解析処理モジュール32500は、ステップ62030の処理において集計したイベント発生数が、条件部に記載された全イベントにおいて一定の比率を超過したか否か判断し、超過している場合には GUI表示処理モジュール32400に対し、障害原因になるイベントを、条件文中のイベント発生割合と共に、ステップ62050で行った分類に基づいて表示するよう指示する(ステップ62060)。その後イベント管理表33300を参照して、ステップ62010で取得したイベントについて解析済フラグ33370をYesに設定する(ステップ62070)。
最後にイベント解析処理モジュール32500は、展開ルールリポジトリ内の各展開ルールのうち、確信度が0でないものを解析結果管理表33600に書き出す(ステップ62080)。
例えば、図9Aに示す展開ルールExRule1-1には、条件部に”ホストコンピュータHOST1における論理ボリューム(/var)のレスポンスタイムの閾値異常”と、”ストレージ装置SYS1におけるコントローラCTL1の稼働率の閾値異常”と、”ストレージ装置SYS1における論理ユニットLU1の単位時間I/O量の閾値異常”が定義されている。
そして、図7に示すイベント管理表33300に、”ストレージ装置SYS1におけるコントローラCTL1の稼働率の閾値異常”(発生日時:2010-01-01 15:05:00)が登録されると、イベント解析処理モジュール32500は、一定時間待機した後にイベント管理表33300を参照し、過去一定期間に発生したイベントを取得する。
次に、イベント解析処理モジュール32500は、展開ルールリポジトリ33500の展開ルールExRule1-1に記載された条件部に対応する各イベントについて、過去一定期間の発生件数を算出する。その結果、”ホストコンピュータHOST1における論理ボリューム(/var)のレスポンスタイムの閾値異常”(関連イベント)と、”論理ユニット LU1の単位時間I/O量の閾値異常”(関連イベント)も過去一定期間に発生していることから、展開ルールExRule1-1に記載された条件部に対応する各イベント(原因イベントと関連イベント)の過去一定期間の発生数が、条件部に記載された全イベントにおいて占める割合は3/3となる。
以上のようにして算出された割合が一定値を超過した場合、イベント解析処理モジュール32500は、GUI表示処理モジュール32400に対し、障害原因となるイベントを、条件文中のイベント発生割合と共に表示するよう指示する。ここでいう一定値を例えば30%とした場合、当該具体例では、展開ルールExRule1-1の条件部の各イベントの過去一定期間の発生割合が3/3、すなわち100%であるので、解析結果がGUIに表示されることになる。
上記の処理を、展開ルールリポジトリ33500に定義された全ての展開ルールに対し実行することになる。
以上が、イベント解析処理モジュール32500が実施する障害原因解析処理である。上述したように、特許文献1による障害解析機能では、複数の障害が短い期間に頻発すると、保存される障害解析結果の数が多くなる。しかし、複数の障害に対して多数の原因候補を推論した場合に、実際に発生しているどの障害にどの原因候補が関連するのかを提示する方法がない。特に多量の障害イベントが発生して多数の障害原因候補が推論された場合は、どの障害原因候補に対応すればどの箇所で発生している障害を直ぐに解決することができるのか、管理者が類推困難であり、管理者が優先的に対策を行うべき解析結果を参照するまでの時間が長くなる。その結果、障害の解消までに要する時間が長くなるという課題が存在する。
そこで、本発明による実施形態では、多数の解析結果を分類して表示できるようにするために、原因候補分類処理を新たに提供する。
<原因候補分類処理の内容>
従来技術における課題を解決するため、本発明の第1の実施形態では管理サーバ30000における原因候補分類処理が追加されている。以下、当該原因候補分類処理の動作の詳細について説明する。
従来技術における課題を解決するため、本発明の第1の実施形態では管理サーバ30000における原因候補分類処理が追加されている。以下、当該原因候補分類処理の動作の詳細について説明する。
原因候補分類処理は、起点となる原因候補(例えば、確信度の一番高い原因候補)に含まれるイベントを基準とし、そのイベントを含む他の原因候補があれば、それは同じ障害原因に対する原因候補であると推測して分類(グルーピング)する処理である。関連する原因候補をグループとしてまとめているので、優先的に対処すべき候補を知ることが出来るようになる。
図13は、第1の実施形態における、管理サーバ30000のイベント解析処理モジュール32500が実施する原因候補分類処理(ステップ63050)の詳細を説明するためのフローチャートである。
イベント解析処理モジュール32500は、解析結果管理表33600より、一定期間(例えば、一回のポーリング期間)において確信度が最も高い原因候補を選択する(ステップ63010)。そして、選択した原因候補のエントリについて、解析結果管理表33600の分類起点フラグフィールド33690に、Yesを登録する。イベント解析処理モジュール32500は、選択した候補に含まれる受信イベントIDを、解析結果管理表33600より取得する(ステップ63020)。そしてイベント解析処理モジュール32500は、取得した受信イベントIDのうち、いずれか一つ以上の同一受信イベントIDを含む原因候補を、解析結果管理表33600より取得する(ステップ63030)。原因候補の取得後、イベント解析処理モジュール32500は、解析結果管理表33600のグループIDを登録するフィールド33680より利用されているグループIDのリストを取得し、重複しないグループIDを作成し、ステップ63010で選択した原因候補およびステップ63030で取得した原因候補のエントリに関して、フィールド33680の内容を作成したグループIDに更新する (ステップ63040)。
次に、イベント解析処理モジュール32500は、解析結果管理表33600より、フィールド33680にグループIDが記載されていないエントリが存在するかどうかチェックする。そのようなエントリが存在した場合 (ステップ63050でNoの場合)、そのようなエントリのうち、確信度が最も高い原因候補を選択し (ステップ63060)、解析結果管理表33600の選択した原因候補のエントリについて、分類起点フラグフィールド33690に、Yesを登録する。そして、選択した候補に対して、ステップ63020以降の処理を再度行う。
解析結果管理表33600のフィールド33680を参照し、全てのエントリにグループIDが記載されていた場合(ステップ63050でYesの場合)、イベント解析処理モジュール32500は、解析結果管理表33600の受信イベントIDフィールド33660から、全ての受信イベントIDを取得する。次に解析結果管理表33600の分類起点フラグフィールド33690にYesが記載されているエントリを取得し、全ての受信イベントIDが取得したエントリに含まれているかどうかをチェックする。
エントリに含まれていない一つないし一つ以上の受信IDが存在する場合(ステップ63070でNoの場合)、イベント解析処理モジュール32500は、それらの受信IDを含む原因候補を含む原因候補エントリのうち、確信度が最も高い原因候補を選択し(ステップ63080)、解析結果管理表33600の選択した原因候補のエントリについて、分類起点フラグフィールド33690に、Yesを登録する。そして、選択した候補に対して、ステップ63020以降の処理を再度行う。
解析結果管理表33600の分類起点フラグフィールド33690にYesが記載されているエントリが取得され、全ての受信イベントIDが取得したエントリに含まれていた場合(ステップ63070でYesの場合)、原因候補分類処理は終了する。
以上が、イベント解析処理モジュール32500が実施する原因候補分類処理である。
以下に、原因候補分類処理の具体例について説明する。なお、処理開始当初の解析結果管理表は図10、展開ルールは図9、イベント管理表は図7に示す通りのものであるとする。そして、図12のステップ62050の直前までは、処理が終了しているものとする。
イベント解析処理モジュール32500は、解析結果管理表33600より、確信度が最も高いエントリとして、解析結果管理表の第1段目(1つ目のエントリ)から、SYS1の装置の、CTL1の障害原因候補エントリを選択する。つぎに、この候補に含まれる障害イベントである、EV1、EV3、EV6を抽出する。そして、これらの障害イベントを含む他の障害原因候補として、2段目のエントリ(SYS1/CTL2)と5段目のエントリ(IPSW1)を選択する。そして、これら3つのエントリをグループ化し、グループIDとしてGR1を生成してこれらのエントリの解析結果管理表のグループID登録用のフィールド33680に生成したグループIDを登録する。さらに1段目のエントリを、分類を行う際の基準として扱ったので、1段目のエントリの分類起点フラグ33690にはYesを、残りの2エントリの分類起点フラグ33690にはNoを記録する。
解析結果管理表にはまだグループ化されていない残りのエントリ(3段目、4段目)が存在するため、それらについてここまでの作業を繰り返す。まず、確信度の高いエントリとして、3段目のエントリ(SYS1/CTL3)を選択する。そしてこの候補に含まれる障害イベントである EV2、EV4、EV8を抽出する。これらの障害イベントを含む他の障害原因候補として、5段目のエントリ(IPSW1)を選択する。そして、これら2つのエントリをグループ化し、グループIDとしてGR2を生成してこれらのエントリの解析結果管理表のグループID登録用のフィールド33680に生成したグループIDを登録する。なお、5段目のエントリには既にグループIDが登録されているが、複数のグループに所属していることを示すため、追加して登録する。このために、グループID登録用のフィールド33680は、複数のIDを登録できるような構造にする。さらに3段目のエントリを、分類を行う際の基準として扱ったので、3段目のエントリの分類起点フラグ33690にはYesを記録する。
さらに解析結果管理表にはまだグループ化されていない残りのエントリ(4段目)が存在する。このエントリについても同様の作業を繰り返す。そしてこの候補に含まれる障害イベントであるEV5、EV9を抽出する。これらの障害イベントを含む他の障害原因候補として、5段目のエントリ(IPSW1) を選択する。そして、これら2つのエントリをグループ化し、グループIDとしてGR3を生成してこれらのエントリの解析結果管理表のグループID登録用のフィールド33680に生成したグループIDを登録する。なお、5段目のエントリには既にグループIDが登録されているため、追加して登録する。さらに4段目のエントリを、分類を行う際の基準として扱ったので、4段目のエントリの分類起点フラグ33690にはYesを記録する。
ここまでの処理により、解析結果管理表のすべてのエントリはグループ化された。
次に、グループ化の際に参照されなかった障害イベントを抽出する。解析結果管理表33600の受信イベントIDフィールド33660に含まれる全てのイベントIDのうち、分類起点フラグ33690にYesが記録されているエントリに含まれないものとして、EV7を抽出する。EV7を含む原因候補として、2段目のエントリ(SYS1/CTL2)と5段目のエントリ(IPSW1)が存在する。このうち確信度の高い2段目のエントリ(SYS1/CTL2)を起点に、同様のグループ化を行うと、これら2つのエントリと、1段目のエントリ(SYS1/CTL1)を新たにグループ化できる。なお、ここでこれらのエントリは全てグループGR1に含まれる。GR1に着目して障害対応を行うことを考えると、GR1の起点となった1段目のエントリを解決するためにSYS1/CTL1の障害に対応しても、2段目のエントリに含まれるEV7については解決できない可能性がある。本実施形態では、各グループの一つのエントリについて対処すれば全ての障害を修復できるよう、2段目のエントリ(SYS1/CTL2)を起点にしたグループも、GR1とは別に生成する。そしてグループIDとしてGR4を生成してこれらのエントリの解析結果管理表のグループID登録用のフィールド33680に生成したグループIDを登録する。なお、各エントリには既にグループIDが登録されているため、追加して登録する。さらに2段目のエントリを、分類を行う際の基準として扱ったので、2段目のエントリの分類起点フラグ33690にはYesを記録する。
これにより、解析結果管理表33600の受信イベントIDフィールド33660に含まれる全てのイベントIDのうち、分類起点フラグ33690にYesが記録されているエントリに含まれないものが無くなったため、原因候補分類処理を終了する。
<障害解析結果表示画面の構成>
図14は、管理サーバ30000がユーザ(管理者)に対して表示する、障害解析結果表示画面の表示例71000を示す図である。
図14は、管理サーバ30000がユーザ(管理者)に対して表示する、障害解析結果表示画面の表示例71000を示す図である。
障害解析結果表示画面71000では、解析結果管理表に定義された解析結果をグループIDが一致するものをまとめて表示する。その際に、複数のグループに分類されているエントリは、複数のグループに重複して表示する。また、各グループにおいてグループ化の際に起点とした原因候補を、そのグループの最上位に表示する。そしてそれ以外の候補は、確信度の高い順に表示している。
なお、本実施形態では同一画面に全ての原因候補のグループを表示しているが、グループごとに分割して表示されれば良いので、グループごとに別画面で表示し、タブ等で切り替えられるように実施してもよい。
以上の障害解析結果表示によれば、例えば、管理者は、管理サーバ30000の画面に表示された各原因候補グループの最上位の候補から対処していけば効率よく障害原因を取り除ける可能性が高いことを知ることができる。
<変形例>
上述の分類処理の結果生成されたグループの数が多すぎると、却ってグループ化することにより障害結果の確認が困難になる場合がある。そこで、分類処理で生成されたグループ数が所定数以上の場合(グループ数については管理者が設定可能)、分類結果を自動的にまとめるようにしても良い。その際の処理は、例えば、まず、ある分類結果のグループに含まれる条件イベントのうちの一定割合以上が別の分類結果のグループに含まれるか否かを判断する。そして、一定割合異常の条件イベントが別の分類結果のグループに含まれる場合には、それらのグループに含まれる原因候補を1つのグループにまとめて、グループ化する。このようにするのは、あるグループの条件イベントの一定以上の割合が別のグループにも含まれる場合には、双方のグループに含まれる障害イベントが同じ装置に発生した障害に起因して発生している可能性が高く、同一のグループとして扱っても問題がない可能性が高いからである。
上述の分類処理の結果生成されたグループの数が多すぎると、却ってグループ化することにより障害結果の確認が困難になる場合がある。そこで、分類処理で生成されたグループ数が所定数以上の場合(グループ数については管理者が設定可能)、分類結果を自動的にまとめるようにしても良い。その際の処理は、例えば、まず、ある分類結果のグループに含まれる条件イベントのうちの一定割合以上が別の分類結果のグループに含まれるか否かを判断する。そして、一定割合異常の条件イベントが別の分類結果のグループに含まれる場合には、それらのグループに含まれる原因候補を1つのグループにまとめて、グループ化する。このようにするのは、あるグループの条件イベントの一定以上の割合が別のグループにも含まれる場合には、双方のグループに含まれる障害イベントが同じ装置に発生した障害に起因して発生している可能性が高く、同一のグループとして扱っても問題がない可能性が高いからである。
<原因候補分類処理の効果>
以上、第1の実施形態によれば、管理サーバ30000の管理ソフトウェアは、図12に示す障害原因解析処理の後、推論した障害原因候補を、それによって解決される障害にかかわる障害イベントによって分類して表示する。第1の実施形態による分類法と、その結果の表示形式では、各グループの上位の1つのエントリについて対処すれば全ての障害を修復できるよう、分類することができる。従来、原因候補分類処理を行わない場合は、推論した障害原因候補として、図10に示すリストの内容をそのまま表示している。原因候補分類処理を行うことによって、管理者がどの原因候補に優先的に対応すべきか容易に判断でき、解析結果確認と障害対応に要する負荷を軽減することができる。
以上、第1の実施形態によれば、管理サーバ30000の管理ソフトウェアは、図12に示す障害原因解析処理の後、推論した障害原因候補を、それによって解決される障害にかかわる障害イベントによって分類して表示する。第1の実施形態による分類法と、その結果の表示形式では、各グループの上位の1つのエントリについて対処すれば全ての障害を修復できるよう、分類することができる。従来、原因候補分類処理を行わない場合は、推論した障害原因候補として、図10に示すリストの内容をそのまま表示している。原因候補分類処理を行うことによって、管理者がどの原因候補に優先的に対応すべきか容易に判断でき、解析結果確認と障害対応に要する負荷を軽減することができる。
そして、図14のようにグループに分類して各原因候補を表示することにより、管理者としては優先度の高い原因候補(優先的に対処すべき候補)をバランスよく検証することができ、よって障害対応の時間を短縮することができるようになる。
(2)第2の実施形態
第2の実施形態は、第1の実施形態により管理者に原因候補を提示した後、管理者が実施した障害対応手順に基づき、原因候補分類処理を再度実施するものである。システム構成や各装置の構成は第1の実施形態と同じであるので、説明は省略する。以降、第2の実施形態の説明では、第1の実施形態によって図14のように障害解析結果を画面表示した後で、管理者の操作に基づいて行う処理を記載する。
第2の実施形態は、第1の実施形態により管理者に原因候補を提示した後、管理者が実施した障害対応手順に基づき、原因候補分類処理を再度実施するものである。システム構成や各装置の構成は第1の実施形態と同じであるので、説明は省略する。以降、第2の実施形態の説明では、第1の実施形態によって図14のように障害解析結果を画面表示した後で、管理者の操作に基づいて行う処理を記載する。
<原因候補対処時の処理>
図15は、第2の実施形態において、管理者が障害解析結果を利用して障害対応を行う時の処理を説明するためのフローチャートである。管理者は、例えば、障害解析結果表示画面71000から、原因候補を選択して障害対応を行ったことを検知する(ステップ64010)と、イベント解析モジュール32500は、管理者が選択した候補の対応済フラグをYesに変更する(ステップ64020)。第1の実施形態では、各グループの上位の一つのエントリについて対処すれば全ての障害を修復できるように分類した。したがって、障害対応時に最初に選択された候補がいずれかのグループの最上位の候補であれば、分類が管理者の意図や実際の構成状況に合致するように行われていることになる。逆にいずれのグループの最上位でもない候補を最初に選択した場合は、分類が適切に行われていなかったことになる。そのため、最初に管理者に選択された候補がいずれのグループの最上位でもなかった場合、イベント解析モジュール32500は、原因候補再分類処理を行う(ステップ64030~64040)。つまり、最上位以外の候補が選択されたということは、管理者が自身の経験等に基づいて1回目の分類結果を信用していないことを示しており、このような事態に対応して再分類を行い、管理者がより効率よく原因候補に対処できるようにしている。
図15は、第2の実施形態において、管理者が障害解析結果を利用して障害対応を行う時の処理を説明するためのフローチャートである。管理者は、例えば、障害解析結果表示画面71000から、原因候補を選択して障害対応を行ったことを検知する(ステップ64010)と、イベント解析モジュール32500は、管理者が選択した候補の対応済フラグをYesに変更する(ステップ64020)。第1の実施形態では、各グループの上位の一つのエントリについて対処すれば全ての障害を修復できるように分類した。したがって、障害対応時に最初に選択された候補がいずれかのグループの最上位の候補であれば、分類が管理者の意図や実際の構成状況に合致するように行われていることになる。逆にいずれのグループの最上位でもない候補を最初に選択した場合は、分類が適切に行われていなかったことになる。そのため、最初に管理者に選択された候補がいずれのグループの最上位でもなかった場合、イベント解析モジュール32500は、原因候補再分類処理を行う(ステップ64030~64040)。つまり、最上位以外の候補が選択されたということは、管理者が自身の経験等に基づいて1回目の分類結果を信用していないことを示しており、このような事態に対応して再分類を行い、管理者がより効率よく原因候補に対処できるようにしている。
<原因候補再分類処理の詳細>
図16は、第2の実施形態による原因候補再分類処理(ステップ64040)の詳細を説明するためのフローチャートである。本実施形態の原因候補再分類処理は、第1の実施形態での原因候補分類処理(ステップ63010~63080)に対して行った処理と同等の分類処理を、対応済フラグがYesに設定されている候補から優先的に実施する。
図16は、第2の実施形態による原因候補再分類処理(ステップ64040)の詳細を説明するためのフローチャートである。本実施形態の原因候補再分類処理は、第1の実施形態での原因候補分類処理(ステップ63010~63080)に対して行った処理と同等の分類処理を、対応済フラグがYesに設定されている候補から優先的に実施する。
イベント解析処理モジュール32500は、まず、事前処理として全ての候補のグループIDフィールド33680と、分類起点フラグフィールド33690の値を削除する(ステップ65005)。
次に、イベント解析処理モジュール32500は、解析結果管理表33600より、対応済フラグフィールド33670がYesに設定されている候補のうちで、確信度が最も高い原因候補を選択する(ステップ65010)。そして、イベント解析処理モジュール32500は、選択した原因候補のエントリについて、解析結果管理表33600の分類起点フラグフィールド33690に、Yesを登録する。
イベント解析処理モジュール32500は、選択した候補に含まれる受信イベントIDを、解析結果管理表33600より取得する(ステップ65020)。そして、イベント解析処理モジュール32500は、取得した受信イベントIDのうち、いずれか一つ以上の同一受信イベントIDを含む原因候補を、解析結果管理表33600より取得する(ステップ65030)。
原因候補の取得後、イベント解析処理モジュール32500は、解析結果管理表33600のグループIDを登録するフィールド33680より利用されているグループIDのリストを取得し、重複しないグループIDを作成し、ステップ65010で選択した原因候補およびステップ65030で取得した原因候補のエントリに関して、フィールド33680の内容を作成したグループIDに更新する (ステップ65040)。
続いて、イベント解析処理モジュール32500は、解析結果管理表33600より、対応済フラグフィールド33670がYesに設定されている候補のうちで、フィールド33680にグループIDが記載されていないエントリが存在するかどうかチェックする。そのようなエントリが存在した場合(ステップ65050でNoの場合)、そのようなエントリのうち、確信度が最も高い原因候補を選択し(ステップ65060)、解析結果管理表33600の選択した原因候補のエントリについて、分類起点フラグフィールド33690に、Yesを登録する。そして、選択した候補に対して、ステップ65020以降の処理を再度行う。
対応済みフラグYesの原因候補が全て分類済であると判断された場合(ステップ65050でYesの場合)、イベント解析処理モジュール32500は、解析結果管理表33600より、フィールド33680にグループIDが記載されていないエントリが存在するかどうかチェックする。そのようなエントリが存在した場合(ステップ65070でNoの場合)、イベント解析処理モジュール32500は、そのようなエントリのうち、確信度が最も高い原因候補を選択し(ステップ65080)、解析結果管理表33600の選択した原因候補のエントリについて、分類起点フラグフィールド33690に、Yesを登録する。そして、選択した候補に対して、ステップ65020以降の処理を再度行う。
さらに、解析結果管理表33600のフィールド33680を参照し、全てのエントリにグループIDが記載されていた場合(ステップ65070でYesの場合)、イベント解析処理モジュール32500は、解析結果管理表33600の受信イベントIDフィールド33660から、全ての受信イベントIDを取得する。
次に、イベント解析処理モジュール32500は、解析結果管理表33600の分類起点フラグフィールド33690にYesが記載されているエントリを取得し、全ての受信イベントIDが取得したエントリに含まれているかどうかをチェックする。
エントリに含まれていない1つないし1つ以上の受信IDが存在する場合(ステップ65090でNoの場合)、イベント解析処理モジュール32500は、それらの受信IDを含む原因候補を含む原因候補エントリのうち、確信度が最も高い原因候補を選択し(ステップ65095)、解析結果管理表33600の選択した原因候補のエントリについて、分類起点フラグフィールド33690に、Yesを登録する。そして、イベント解析処理モジュール32500は、選択した候補に対して、ステップ65020以降の処理を再度行う。
イベント解析処理モジュール32500は、解析結果管理表33600の分類起点フラグフィールド33690にYesが記載されているエントリを取得し、全ての受信イベントIDが取得したエントリに含まれていた場合(ステップ65090でYesの場合)、原因候補再分類処理を終了する。
以上が、イベント解析処理モジュール32500が実施する原因候補再分類処理である。なお、図16では、対処済フラグをYesにしたタイミングと原因候補再分類処理を実行するタイミングとの関係については明記していないが、管理者がいくつかの原因候補について対応し、いくつかの対応済フラグがYesになった後、管理者の指示に従って原因候補再分類処理(図16)を実行するようにしても良いし、対応済フラグがYesに変更される都度、原因候補再分類処理を実行するようにしても良い。
以下に、原因候補再分類処理の具体例について説明する。なお、第1の実施形態と同様に、処理開始当初の解析結果管理表は図10、展開ルールは図9、イベント管理表は図7に示す通りのものであるとする。なお、図15のステップ64040の実行の直前までは処理が終了しているものとする、その過程において、管理者は図14の結果画面表示で、最初にIPSW1の障害原因を選択しており、図10の対応済フラグフィールド33670には、5段目のエントリ(IPSW1)の部分にのみYesが記録されているものとする。
イベント解析処理モジュール32500は、まず、解析結果管理表33600の全ての原因候補のグループIDフィールドと、分類起点フラグフィールドの値を削除する。次に、解析結果管理表33600より、対応済フラグがYesの原因候補のうち、確信度が最も高いエントリとして、解析結果管理表の第5段目(5つ目のエントリ)から、IPSW装置の障害原因候補エントリを選択する。
次に、イベント解析処理モジュール32500は、この候補に含まれる障害イベントである、EV6、EV7、EV8、EV9を抽出する。そして、これらの障害イベントを含む他の障害原因候補として、1段目のエントリ(SYS1/CTL1)、2段目のエントリ(SYS1/CTL2)、3段目のエントリ(SYS1/CTL3)、4段目のエントリ(SYS1/CTL4)選択する。そして、これら5つのエントリをグループ化し、グループIDとしてGR1を生成してこれらのエントリの解析結果管理表のグループID登録用のフィールド33680に生成したグループIDを登録する。さらに5段目のエントリを、分類を行う際の基準として扱ったので、5段目のエントリの分類起点フラグ33690にはYesを、残りの4エントリの分類起点フラグ33690にはNoを記録する。
ここまでの処理により、解析結果管理表のすべてのエントリはグループ化された。
続いて、イベント解析処理モジュール32500は、グループ化の際に参照されなかった障害イベントを抽出する。解析結果管理表33600の受信イベントIDフィールド33660に含まれる全てのイベントIDのうち、分類起点フラグ33690にYesが記録されているエントリに含まれないものとしてEV1、EV2、EV3、EV4、EV5が抽出される。それらを含む原因候補として、1段目のエントリ~4段目のエントリまでの4エントリが存在する。このうち確信度の高い1段目のエントリを起点に、同様のグループ化を行うと、イベント解析処理モジュール32500は、障害イベントEV1、EV3、EV6を含む他の障害原因候補として、2段目のエントリ(SYS1/CTL2)と5段目のエントリ(IPSW1)を選択する。そして、イベント解析処理モジュール32500は、これら3つのエントリをグループ化し、グループIDとしてGR2を生成してこれらのエントリの解析結果管理表のグループID登録用のフィールド33680に生成したグループIDを登録する。さらに、イベント解析処理モジュール32500は、分類を行う際の基準として1段目のエントリを扱ったので、1段目のエントリの分類起点フラグ33690にはYesを記録する。
イベント解析処理モジュール32500は、解析結果管理表33600の受信イベントIDフィールド33660に含まれる全てのイベントIDのうち、分類起点フラグ33690にYesが記録されているエントリに含まれないものとしてEV2、EV4、EV5を抽出する。それらを含む原因候補として、3段目のエントリ、4段目のエントリの2エントリが存在する。このうち確信度の高い3段目のエントリを起点に、同様のグループ化を行うと、イベント解析処理モジュール32500は、障害イベントEV2、EV4、EV8を含む他の障害原因候補として、5段目のエントリ(IPSW1)を選択する。そして、イベント解析処理モジュール32500は、これら2つのエントリをグループ化し、グループIDとしてGR3を生成してこれらのエントリの解析結果管理表のグループID登録用のフィールド33680に生成したグループIDを登録する。さらに、分類を行う際の基準として3段目のエントリを、扱ったので、イベント解析処理モジュール32500は、3段目のエントリの分類起点フラグ33690にはYesを記録する。
さらに、イベント解析処理モジュール32500は、解析結果管理表33600の受信イベントIDフィールド33660に含まれる全てのイベントIDのうち、分類起点フラグ33690にYesが記録されているエントリに含まれないものとしてEV5を抽出する。また、イベント解析処理モジュール32500は、それらを含む原因候補として、4段目のエントリを起点に同様のグループ化を行うと、障害イベントEV5、EV9を含む他の障害原因候補として、5段目のエントリ(IPSW1)を選択する。そして、イベント解析処理モジュール32500は、これら2つのエントリをグループ化し、グループIDとしてGR4を生成してこれらのエントリの解析結果管理表のグループID登録用のフィールド33680に生成したグループIDを登録する。さらに、イベント解析処理モジュール32500は、分類を行う際の基準として4段目のエントリを、扱ったので、4段目のエントリの分類起点フラグ33690にはYesを記録する。
解析結果管理表33600の受信イベントIDフィールド33660に含まれる全てのイベントIDのうち、分類起点フラグ33690にYesが記録されているエントリに含まれないものが無くなったため、イベント解析処理モジュール32500は、原因候補再分類処理を終了する。
<障害解析結果表示画面の構成>
図17は管理サーバ30000が原因候補再分類処理後にユーザ(管理者)に対して表示する、障害解析結果表示画面の表示例72000を示す図である。
図17は管理サーバ30000が原因候補再分類処理後にユーザ(管理者)に対して表示する、障害解析結果表示画面の表示例72000を示す図である。
第1の実施形態と同様に、障害解析結果表示画面72000では、解析結果管理表に定義された解析結果をグループIDが一致するものをまとめて表示する。その際に、複数のグループに分類されているエントリは、複数のグループに重複して表示する。また、各グループにおいてグループ化の際に起点とした原因候補を、そのグループの最上位に表示する。そしてそれ以外の候補は、確信度の高い順に表示している。
なお、第1の実施形態と同様に、本実施形態では同一画面に全ての原因候補のグループを表示しているが、グループごとに分割して表示されれば良いので、グループごとに別画面で表示し、タブ等で切り替えられるように実施してもよい。
<原因候補再分類処理の効果>
以上、第2の実施形態によれば、管理サーバ30000の管理ソフトウェアは、図15に示すように、第1の実施形態でグループの最上位に表示しなかった障害原因候補を管理者が最初に障害原因として選択した場合に、それを基準に障害原因候補の分類を再度実行する。第1の実施形態(図14)のように分類された状況で、それぞれのグループの最下位に表示されていたIPSW1を管理者が選択したということは、本発明の管理ソフトウェアが把握していないが管理者が把握している状況としてIPSW1が障害の原因であると管理者に推測させるような外部的な状況が存在するのかもしれない。そのような場合に、管理者の選択に合わせて第2の実施形態のように、動的にグループ化を再構成している。
以上、第2の実施形態によれば、管理サーバ30000の管理ソフトウェアは、図15に示すように、第1の実施形態でグループの最上位に表示しなかった障害原因候補を管理者が最初に障害原因として選択した場合に、それを基準に障害原因候補の分類を再度実行する。第1の実施形態(図14)のように分類された状況で、それぞれのグループの最下位に表示されていたIPSW1を管理者が選択したということは、本発明の管理ソフトウェアが把握していないが管理者が把握している状況としてIPSW1が障害の原因であると管理者に推測させるような外部的な状況が存在するのかもしれない。そのような場合に、管理者の選択に合わせて第2の実施形態のように、動的にグループ化を再構成している。
その結果、まずIPSW1に発生している障害原因に対応した場合に、他にどの障害原因に優先的に対応すべきなのかを分類して表示している。このため、第1の実施形態の提示した結果が仮に管理者の意図と異なっていた場合にも、それに合わせて分類を修正することができ、管理者の障害対応に要する負荷を軽減することができる。
(3)まとめ
障害原因解析では、障害原因の推論の後で、管理サーバにおいて推論した障害原因候補それぞれに対して導出過程で解析ルールに適用した障害イベントを取得する。そして個々の原因候補の確信度と、その導出根拠となる障害イベントに基づいて、障害原因候補を分類する。しかし、異なった原因に起因する複数の障害が短い期間に頻発すると、保存される障害解析結果の数が多くなり、どの障害原因候補が実際に発生するどの障害に関して推論されたのか、管理者に判断できないことがある。本発明ではそのような場合に、実際に発生している障害イベントが共通して含まれる原因候補を、同一グループとして分類する。これにより、異なった原因に起因する複数の障害が発生した際にも、確からしい組み合わせで原因候補を分類することができる。
障害原因解析では、障害原因の推論の後で、管理サーバにおいて推論した障害原因候補それぞれに対して導出過程で解析ルールに適用した障害イベントを取得する。そして個々の原因候補の確信度と、その導出根拠となる障害イベントに基づいて、障害原因候補を分類する。しかし、異なった原因に起因する複数の障害が短い期間に頻発すると、保存される障害解析結果の数が多くなり、どの障害原因候補が実際に発生するどの障害に関して推論されたのか、管理者に判断できないことがある。本発明ではそのような場合に、実際に発生している障害イベントが共通して含まれる原因候補を、同一グループとして分類する。これにより、異なった原因に起因する複数の障害が発生した際にも、確からしい組み合わせで原因候補を分類することができる。
なお、ある1つの原因候補にしか関連していない障害イベントが存在する場合は、障害イベント発生の原因となる障害を解決するためには、その原因候補を利用するほかに手段がない。このような場合には、複数の原因候補が障害イベントに関連していないため、この障害イベントを基準に分類されたグループが存在しない。そのため、すべてのグループの障害原因候補に対応しても、この障害イベントを解決できないことがある。特に、何らかの別の障害イベントによって、この障害イベントを解決できる唯一の原因候補が、たまたまあるグループに分類されていた場合、特定の障害イベントに関して解決できる唯一の原因候補にもかかわらず、グループ内の他の多数の原因候補と同一視され、その結果分類を行ったことによりその障害イベントに関する対応が迅速に行われなくなることも考えられる。それを防止するため、本発明では障害原因候補分類の根拠として利用しなかった障害イベントが存在する場合には、それを解決する原因候補や原因候補群について、さらに別個のグループを作成する。つまり、管理サーバは、起点原因候補を変えて結論イベントの分類処理を繰り返し、全ての障害原因とされる結論イベントを分類した後、起点原因候補として選択された結論イベント以外の結論イベント(例えば、図10の2段目のエントリ)が起点原因候補として選択された結論イベントに含まれる条件イベント以外の条件イベントである残余条件イベントを含む場合に、この残余条件イベントを含む結論イベントを起点原因候補としてさらに分類処理を実行する。こうすることにより、漏れなく原因候補をグループ化することができ、全ての障害を修復することが可能となる。
さらに、本発明では、管理サーバはこのような分類結果に基づいて、障害解析結果の表示を行う。この際に、それぞれの障害原因候補が他のどの原因候補とグループ化されているのか、管理者が理解できるように表示する。例えば、分類結果に基づきグループごとに別画面に分けて原因候補を表示しても良いし、同一の画面内で候補グループごとに順番を入れ替えた上でそれぞれのグループを認識できるように表示したり、同様に同一の画面内で確信度等のグループとは関係ない順序で原因候補を表示した上で、属するグループを各原因候補エントリに表示したりしても良い。
本実施形態では、各ノード装置の性能値から異常状態を検知し、その解析結果(異常状態の確信度を演算)として障害原因の候補を管理者に提示する。その際に、いくつかの異常状態を示すイベントが、ある特定の異常状態の事象により引き起こされる場合を想定し、確信度の最も高い障害原因と共通した異常状態を含む障害原因の候補を分類する。そして、障害解析結果表示画面では、その分類を管理者が理解できるような方法で、解析結果の表示を行う。より具体的には、本実施形態の計算機システムでは、管理サーバ(管理システム)が、ノード装置の処理性能を示す処理性能値を取得し、当該取得した処理性能値からノード装置に障害が発生したことを検知し、複数の障害原因とされる結論イベントの1つを起点原因候補として選択し、起点原因候補に関係する条件イベントを抽出する。また、管理サーバは、抽出された条件イベントに関係する結論イベントであって、起点原因候補の結論イベントとは異なる1つ又は複数の障害原因とされる結論イベントを関連原因候補として選択し、起点原因候補の結論イベントと前記関連原因候補の結論イベントを、他の結論イベントとは別個に分類処理する。そして、管理サーバは、分類された結論イベントを表示画面に表示する。このようにすることにより、管理者は、解析結果の対応優先度を容易に判断でき、解析結果確認と障害対応に要する負荷を軽減することができる。
また、管理サーバは、起点原因候補及び関連原因候補に対応する結論イベントの分類結果に従って、障害原因とされる結論イベントを分類結果ごとに区別して表示画面に表示する。このようにすることにより、対処すべき解析結果が容易に判断することができると共に、対処済の結果と未対処の結果を区別して管理することが可能となる。
また、管理サーバは、起点原因候補の結論イベントに関係する条件イベントと同一の条件イベントを解析ルールに少なくとも1つ含む関連原因候補の結論イベントを、起点原因候補の結論イベントと同一のグループとして分類する。このようにすることにより、分類の条件が明確になり、起点となる原因候補を対処したときに同時に解決されうる原因候補を同一グループに分類するので、管理者の負担を軽減することができるようになる。
なお、起点原因候補として、確信度が最も高い結論イベントを選択するようにしても良い。これにより、対応優先度が高いと考えられる解析結果を軸として自動的に分類処理することが可能となり、効率的に障害対応をすることができるようになる。
また、障害解析を行う管理サーバは、管理対象を取り巻く外部的な状況を必ずしも完全に把握できるとは限らない。したがって、本実施形態での分類結果により提示される障害原因と、実際に管理者が障害原因と考えている事象が異なる可能性があることを否定できない。そのため、優先度(確信度)の低い原因候補を管理者が選択し、障害復旧を行った場合に、管理者の選択に合わせて、動的にグループ化を再構成するようにしている(第2の実施形態参照)。即ち、管理サーバは、複数の分類グループを含む前記分類結果において、障害対応時にどの分類グループに含まれる前記結論イベントが管理者によって選択されたかについての情報に基づいて、再度分類処理を実行するか決定する。つまり、障害対応時に選択された結論イベントを起点原因候補として分類処理を再度実行する。このように動的に分類処理を再度実行することにより、管理者は経験に基づいた障害対処を実行することができ、効率的に計算機システムを管理することができるようになる。
なお、本発明は、実施形態の機能を実現するソフトウェアのプログラムコードによっても実現できる。この場合、プログラムコードを記録した記憶媒体をシステム或は装置に提供し、そのシステム或は装置のコンピュータ(又はCPUやMPU)が記憶媒体に格納されたプログラムコードを読み出す。この場合、記憶媒体から読み出されたプログラムコード自体が前述した実施形態の機能を実現することになり、そのプログラムコード自体、及びそれを記憶した記憶媒体は本発明を構成することになる。このようなプログラムコードを供給するための記憶媒体としては、例えば、フレキシブルディスク、CD-ROM、DVD-ROM、ハードディスク、光ディスク、光磁気ディスク、CD-R、磁気テープ、不揮発性のメモリカード、ROMなどが用いられる。
また、プログラムコードの指示に基づき、コンピュータ上で稼動しているOS(オペレーティングシステム)などが実際の処理の一部又は全部を行い、その処理によって前述した実施の形態の機能が実現されるようにしてもよい。さらに、記憶媒体から読み出されたプログラムコードが、コンピュータ上のメモリに書きこまれた後、そのプログラムコードの指示に基づき、コンピュータのCPUなどが実際の処理の一部又は全部を行い、その処理によって前述した実施の形態の機能が実現されるようにしてもよい。
また、実施の形態の機能を実現するソフトウェアのプログラムコードを、ネットワークを介して配信することにより、それをシステム又は装置のハードディスクやメモリ等の記憶手段又はCD-RW、CD-R等の記憶媒体に格納し、使用時にそのシステム又は装置のコンピュータ(又はCPUやMPU)が当該記憶手段や当該記憶媒体に格納されたプログラムコードを読み出して実行するようにしても良い。
10000:サーバ
20000:ストレージ装置
30000:管理サーバ
35000:WEBブラウザ起動サーバ
40000:IPスイッチ
45000:ネットワーク
20000:ストレージ装置
30000:管理サーバ
35000:WEBブラウザ起動サーバ
40000:IPスイッチ
45000:ネットワーク
Claims (13)
- 監視の対象となるノード装置と、ネットワークを介して前記ノード装置に接続され、前記ノード装置を監視及び管理する管理システムと、を有する計算機システムの管理方法であって、
前記管理システムが、前記ノード装置の処理性能を示す処理性能値を取得し、当該取得した処理性能値から前記ノード装置に障害が発生したことを検知し、
前記管理システムが、前記検知した障害を、前記ノード装置で発生し得る1つ以上の条件イベントの組み合わせと前記条件イベントの組み合わせの障害原因とされる結論イベントとの関係を示す解析ルールに適用し、前記ノード装置における障害の発生の可能性を示す情報である確信度を算出し、
前記管理システムが、複数の障害原因とされる結論イベントの1つを起点原因候補として選択し、前記起点原因候補に関係する前記条件イベントを抽出し、
前記管理システムが、抽出された前記条件イベントに関係する結論イベントであって、前記起点原因候補の結論イベントとは異なる1つ又は複数の障害原因とされる結論イベントを関連原因候補として選択し、
前記管理システムが、前記起点原因候補の結論イベントと前記関連原因候補の結論イベントを、他の結論イベントとは別個に分類処理し、
前記管理システムが、前記分類された結論イベントを表示画面に表示する、
ことを特徴とする計算機システムの管理方法。 - 請求項1において、
前記管理システムは、前記起点原因候補及び前記関連原因候補に対応する結論イベントの分類結果に従って、前記障害原因とされる結論イベントを分類結果ごとに区別して前記表示画面に表示することを特徴とする計算機システムの管理方法。 - 請求項1において、
前記管理システムは、前記起点原因候補の結論イベントに関係する前記条件イベントと同一の条件イベントを前記解析ルールに少なくとも1つ含む前記関連原因候補の結論イベントを、前記起点原因候補の結論イベントと同一のグループとして分類することを特徴とする計算機システムの管理方法。 - 請求項1において、
前記管理システムは、前記確信度が最も高い前記結論イベントを前記起点原因候補として選択し、当該起点原因候補の結論イベントに関係する前記条件イベントによって前記関連原因候補の結論イベントを分類することを特徴とする計算機システムの管理方法。 - 請求項1において、
前記管理システムは、前記複数の障害原因とされる結論イベントにおいて前記起点原因候補を変えて結論イベントの分類処理を繰り返し、全ての前記障害原因とされる結論イベントを分類した後、前記起点原因候補として選択された結論イベント以外の結論イベントが前記起点原因候補として選択された結論イベントに含まれる前記条件イベント以外の条件イベントである残余条件イベントを含むか否か判断し、前記残余条件イベントを含む結論イベントを前記起点原因候補としてさらに分類処理を実行することを特徴とする計算機システムの管理方法。 - 請求項2において、
前記管理システムは、複数の分類グループを含む前記分類結果において、障害対応時にどの分類グループに含まれる前記結論イベントが管理者によって選択されたかについての情報に基づいて、再度分類処理を実行するか決定することを特徴とする計算機システムの管理方法。 - 請求項6において、
前記管理システムは、前記障害対応時に選択された前記結論イベントを前記起点原因候補として前記分類処理を再度実行することを特徴とする計算機システムの管理方法。 - 監視対象のノード装置とネットワークを介して接続され、前記ノード装置を管理する管理システムであって、
前記ノード装置の処理性能を示す処理性能値を取得し、当該取得した処理性能値から前記ノード装置の状態を検知するプロセッサと、
前記ノード装置で発生し得る1つ以上の条件イベントの組み合わせと前記条件イベントの組み合わせの障害原因とされる結論イベントとの関係を示す解析ルールを格納するメモリと、を有し、
前記プロセッサは、
前記検知した状態を前記解析ルールに適用し、前記ノード装置における障害の発生の可能性を示す情報である確信度を算出し、
複数の障害原因とされる結論イベントの1つを起点原因候補として選択し、前記起点原因候補に関係する前記条件イベントを抽出し、
抽出された前記条件イベントに関係する結論イベントであって、前記起点原因候補の結論イベントとは異なる1つ又は複数の障害原因とされる結論イベントを関連原因候補として選択し、
前記起点原因候補の結論イベントと前記関連原因候補の結論イベントを、他の結論イベントとは別個に分類処理し、
前記分類された結論イベントを表示画面に表示する、
ことを特徴とする管理システム。 - 請求項8において、
前記プロセッサは、前記起点原因候補及び前記関連原因候補に対応する結論イベントの分類結果に従って、前記障害原因とされる結論イベントを分類結果ごとに区別して前記表示画面に表示することを特徴とする管理システム。 - 請求項8において、
前記プロセッサは、前記起点原因候補の結論イベントに関係する前記条件イベントと同一の条件イベントを前記解析ルールに少なくとも1つ含む前記関連原因候補の結論イベントを、前記起点原因候補の結論イベントと同一のグループとして分類することを特徴とする管理システム。 - 請求項8において、
前記プロセッサは、前記確信度が最も高い前記結論イベントを前記起点原因候補として選択し、当該起点原因候補の結論イベントに関係する前記条件イベントによって前記関連原因候補の結論イベントを分類することを特徴とする管理システム。 - 請求項8において、
前記プロセッサは、前記複数の障害原因とされる結論イベントにおいて前記起点原因候補を変えて結論イベントの分類処理を繰り返し、全ての前記障害原因とされる結論イベントを分類した後、前記起点原因候補として選択された結論イベント以外の結論イベントが前記起点原因候補として選択された結論イベントに含まれる前記条件イベント以外の条件イベントである残余条件イベントを含むか否か判断し、前記残余条件イベントを含む結論イベントを前記起点原因候補としてさらに分類処理を実行することを特徴とする管理システム。 - 請求項9において、
前記プロセッサは、複数の分類グループを含む前記分類結果において、障害対応時にどの分類グループに含まれる前記結論イベントが管理者によって選択されたかについての情報に基づいて、再度分類処理を実行するか決定し、前記分類処理を再度実行すると決定した場合には、前記障害対応時に選択された前記結論イベントを前記起点原因候補として前記分類処理を再度実行することを特徴とする管理システム。
Priority Applications (1)
| Application Number | Priority Date | Filing Date | Title |
|---|---|---|---|
| US13/055,440 US8819220B2 (en) | 2010-09-09 | 2010-10-15 | Management method of computer system and management system |
Applications Claiming Priority (2)
| Application Number | Priority Date | Filing Date | Title |
|---|---|---|---|
| JP2010202274A JP5432867B2 (ja) | 2010-09-09 | 2010-09-09 | 計算機システムの管理方法、及び管理システム |
| JP2010-202274 | 2010-09-09 |
Publications (1)
| Publication Number | Publication Date |
|---|---|
| WO2012032676A1 true WO2012032676A1 (ja) | 2012-03-15 |
Family
ID=45810290
Family Applications (1)
| Application Number | Title | Priority Date | Filing Date |
|---|---|---|---|
| PCT/JP2010/068130 WO2012032676A1 (ja) | 2010-09-09 | 2010-10-15 | 計算機システムの管理方法、及び管理システム |
Country Status (2)
| Country | Link |
|---|---|
| JP (1) | JP5432867B2 (ja) |
| WO (1) | WO2012032676A1 (ja) |
Cited By (3)
| Publication number | Priority date | Publication date | Assignee | Title |
|---|---|---|---|---|
| WO2014068659A1 (ja) * | 2012-10-30 | 2014-05-08 | 株式会社日立製作所 | 管理計算機およびルール生成方法 |
| CN113361722A (zh) * | 2020-03-06 | 2021-09-07 | 华晨宝马汽车有限公司 | 辅助解决生产设备故障的方法和装置及存储介质 |
| CN113361722B (zh) * | 2020-03-06 | 2024-05-31 | 华晨宝马汽车有限公司 | 辅助解决生产设备故障的方法和装置及存储介质 |
Families Citing this family (11)
| Publication number | Priority date | Publication date | Assignee | Title |
|---|---|---|---|---|
| US9130850B2 (en) | 2012-07-20 | 2015-09-08 | Hitachi, Ltd. | Monitoring system and monitoring program with detection probability judgment for condition event |
| JP5719974B2 (ja) * | 2012-09-03 | 2015-05-20 | 株式会社日立製作所 | 複数の監視対象デバイスを有する計算機システムの管理を行う管理システム |
| JP2014126948A (ja) | 2012-12-25 | 2014-07-07 | International Business Maschines Corporation | 管理対象の状態に基づいて管理情報を出力する装置、方法およびプログラム |
| WO2014162595A1 (ja) * | 2013-04-05 | 2014-10-09 | 株式会社日立製作所 | 管理システム及び管理プログラム |
| DE112013006475T5 (de) * | 2013-11-29 | 2015-10-08 | Hitachi, Ltd. | Verwaltungssystem und Verfahren zur Unterstützung einer Analyse in Bezug auf eine Hauptursache eines Ereignisses |
| JP5993052B2 (ja) * | 2015-03-23 | 2016-09-14 | 株式会社日立製作所 | 複数の監視対象デバイスを有する計算機システムの管理を行う管理システム |
| US10055275B2 (en) * | 2015-07-14 | 2018-08-21 | Sios Technology Corporation | Apparatus and method of leveraging semi-supervised machine learning principals to perform root cause analysis and derivation for remediation of issues in a computer environment |
| JP6181134B2 (ja) * | 2015-11-02 | 2017-08-16 | 株式会社東芝 | 要因解析装置、要因解析方法、及びプログラム |
| JP7025646B2 (ja) * | 2018-11-02 | 2022-02-25 | 日本電信電話株式会社 | 監視保守方法、監視保守装置及び監視保守プログラム |
| JP7208505B2 (ja) * | 2019-03-11 | 2023-01-19 | 富士通株式会社 | 判定方法、情報処理装置および判定プログラム |
| JP7012778B2 (ja) * | 2020-05-14 | 2022-01-28 | 株式会社日立製作所 | 監視システム、監視装置及び監視方法 |
Citations (3)
| Publication number | Priority date | Publication date | Assignee | Title |
|---|---|---|---|---|
| JPH03145846A (ja) * | 1989-11-01 | 1991-06-21 | Hitachi Ltd | 障害診断方法 |
| JP2007249741A (ja) * | 2006-03-17 | 2007-09-27 | Fujitsu Ltd | 被疑箇所特定装置および処理方法 |
| JP2008059102A (ja) * | 2006-08-30 | 2008-03-13 | Fujitsu Ltd | コンピュータ資源監視プログラム |
Family Cites Families (2)
| Publication number | Priority date | Publication date | Assignee | Title |
|---|---|---|---|---|
| JP2000020428A (ja) * | 1998-07-07 | 2000-01-21 | Sumitomo Electric Ind Ltd | ネットワーク管理システム |
| JP5215895B2 (ja) * | 2009-02-04 | 2013-06-19 | 株式会社日立ソリューションズ | 障害原因解析システム及びプログラム |
-
2010
- 2010-09-09 JP JP2010202274A patent/JP5432867B2/ja active Active
- 2010-10-15 WO PCT/JP2010/068130 patent/WO2012032676A1/ja active Application Filing
Patent Citations (3)
| Publication number | Priority date | Publication date | Assignee | Title |
|---|---|---|---|---|
| JPH03145846A (ja) * | 1989-11-01 | 1991-06-21 | Hitachi Ltd | 障害診断方法 |
| JP2007249741A (ja) * | 2006-03-17 | 2007-09-27 | Fujitsu Ltd | 被疑箇所特定装置および処理方法 |
| JP2008059102A (ja) * | 2006-08-30 | 2008-03-13 | Fujitsu Ltd | コンピュータ資源監視プログラム |
Cited By (4)
| Publication number | Priority date | Publication date | Assignee | Title |
|---|---|---|---|---|
| WO2014068659A1 (ja) * | 2012-10-30 | 2014-05-08 | 株式会社日立製作所 | 管理計算機およびルール生成方法 |
| JPWO2014068659A1 (ja) * | 2012-10-30 | 2016-09-08 | 株式会社日立製作所 | 管理計算機およびルール生成方法 |
| CN113361722A (zh) * | 2020-03-06 | 2021-09-07 | 华晨宝马汽车有限公司 | 辅助解决生产设备故障的方法和装置及存储介质 |
| CN113361722B (zh) * | 2020-03-06 | 2024-05-31 | 华晨宝马汽车有限公司 | 辅助解决生产设备故障的方法和装置及存储介质 |
Also Published As
| Publication number | Publication date |
|---|---|
| JP2012059063A (ja) | 2012-03-22 |
| JP5432867B2 (ja) | 2014-03-05 |
Similar Documents
| Publication | Publication Date | Title |
|---|---|---|
| JP5432867B2 (ja) | 計算機システムの管理方法、及び管理システム | |
| US8819220B2 (en) | Management method of computer system and management system | |
| JP5684946B2 (ja) | イベントの根本原因の解析を支援する方法及びシステム | |
| US11061756B2 (en) | Enabling symptom verification | |
| US9003230B2 (en) | Method and apparatus for cause analysis involving configuration changes | |
| US9619314B2 (en) | Management system and management program | |
| JP5222876B2 (ja) | 計算機システムにおけるシステム管理方法、及び管理システム | |
| JP6009089B2 (ja) | 計算機システムを管理する管理システム及びその管理方法 | |
| WO2014188502A1 (ja) | 管理システム、管理プログラム及び管理方法 | |
| JP6988304B2 (ja) | 運用管理システム、監視サーバ、方法およびプログラム | |
| JP5419819B2 (ja) | 計算機システムの管理方法、及び管理システム | |
| JP4383484B2 (ja) | メッセージ解析装置、制御方法および制御プログラム | |
| US9021078B2 (en) | Management method and management system | |
| JP7387469B2 (ja) | 通信装置、監視サーバ及びログ収集方法 | |
| JP6845657B2 (ja) | 管理サーバ、管理方法及びそのプログラム | |
| JP2019009726A (ja) | 障害切り分け方法および管理サーバ | |
| JP2018063518A5 (ja) | ||
| WO2021053801A1 (ja) | 情報分析装置、方法およびプログラム |
Legal Events
| Date | Code | Title | Description |
|---|---|---|---|
| WWE | Wipo information: entry into national phase |
Ref document number: 13055440 Country of ref document: US |
|
| 121 | Ep: the epo has been informed by wipo that ep was designated in this application |
Ref document number: 10857017 Country of ref document: EP Kind code of ref document: A1 |
|
| NENP | Non-entry into the national phase |
Ref country code: DE |
|
| 122 | Ep: pct application non-entry in european phase |
Ref document number: 10857017 Country of ref document: EP Kind code of ref document: A1 |