WO2012008176A1 - 監視システムおよび監視方法 - Google Patents
監視システムおよび監視方法 Download PDFInfo
- Publication number
- WO2012008176A1 WO2012008176A1 PCT/JP2011/055533 JP2011055533W WO2012008176A1 WO 2012008176 A1 WO2012008176 A1 WO 2012008176A1 JP 2011055533 W JP2011055533 W JP 2011055533W WO 2012008176 A1 WO2012008176 A1 WO 2012008176A1
- Authority
- WO
- WIPO (PCT)
- Prior art keywords
- optical flow
- determination
- unsteady state
- block
- flows
- Prior art date
- Legal status (The legal status is an assumption and is not a legal conclusion. Google has not performed a legal analysis and makes no representation as to the accuracy of the status listed.)
- Ceased
Links
Images








Classifications
-
- H—ELECTRICITY
- H04—ELECTRIC COMMUNICATION TECHNIQUE
- H04N—PICTORIAL COMMUNICATION, e.g. TELEVISION
- H04N7/00—Television systems
- H04N7/18—Closed-circuit television [CCTV] systems, i.e. systems in which the video signal is not broadcast
-
- G—PHYSICS
- G06—COMPUTING OR CALCULATING; COUNTING
- G06V—IMAGE OR VIDEO RECOGNITION OR UNDERSTANDING
- G06V20/00—Scenes; Scene-specific elements
- G06V20/50—Context or environment of the image
- G06V20/52—Surveillance or monitoring of activities, e.g. for recognising suspicious objects
- G06V20/53—Recognition of crowd images, e.g. recognition of crowd congestion
-
- G—PHYSICS
- G06—COMPUTING OR CALCULATING; COUNTING
- G06T—IMAGE DATA PROCESSING OR GENERATION, IN GENERAL
- G06T7/00—Image analysis
- G06T7/20—Analysis of motion
- G06T7/269—Analysis of motion using gradient-based methods
-
- G—PHYSICS
- G08—SIGNALLING
- G08B—SIGNALLING SYSTEMS, e.g. PERSONAL CALLING SYSTEMS; ORDER TELEGRAPHS; ALARM SYSTEMS
- G08B13/00—Burglar, theft or intruder alarms
- G08B13/18—Actuation by interference with heat, light, or radiation of shorter wavelength; Actuation by intruding sources of heat, light, or radiation of shorter wavelength
- G08B13/189—Actuation by interference with heat, light, or radiation of shorter wavelength; Actuation by intruding sources of heat, light, or radiation of shorter wavelength using passive radiation detection systems
- G08B13/194—Actuation by interference with heat, light, or radiation of shorter wavelength; Actuation by intruding sources of heat, light, or radiation of shorter wavelength using passive radiation detection systems using image scanning and comparing systems
- G08B13/196—Actuation by interference with heat, light, or radiation of shorter wavelength; Actuation by intruding sources of heat, light, or radiation of shorter wavelength using passive radiation detection systems using image scanning and comparing systems using television cameras
- G08B13/19602—Image analysis to detect motion of the intruder, e.g. by frame subtraction
- G08B13/19613—Recognition of a predetermined image pattern or behaviour pattern indicating theft or intrusion
-
- H—ELECTRICITY
- H04—ELECTRIC COMMUNICATION TECHNIQUE
- H04N—PICTORIAL COMMUNICATION, e.g. TELEVISION
- H04N7/00—Television systems
- H04N7/18—Closed-circuit television [CCTV] systems, i.e. systems in which the video signal is not broadcast
- H04N7/183—Closed-circuit television [CCTV] systems, i.e. systems in which the video signal is not broadcast for receiving images from a single remote source
-
- G—PHYSICS
- G06—COMPUTING OR CALCULATING; COUNTING
- G06T—IMAGE DATA PROCESSING OR GENERATION, IN GENERAL
- G06T2207/00—Indexing scheme for image analysis or image enhancement
- G06T2207/10—Image acquisition modality
- G06T2207/10016—Video; Image sequence
-
- G—PHYSICS
- G06—COMPUTING OR CALCULATING; COUNTING
- G06T—IMAGE DATA PROCESSING OR GENERATION, IN GENERAL
- G06T2207/00—Indexing scheme for image analysis or image enhancement
- G06T2207/20—Special algorithmic details
- G06T2207/20021—Dividing image into blocks, subimages or windows
-
- G—PHYSICS
- G06—COMPUTING OR CALCULATING; COUNTING
- G06T—IMAGE DATA PROCESSING OR GENERATION, IN GENERAL
- G06T2207/00—Indexing scheme for image analysis or image enhancement
- G06T2207/30—Subject of image; Context of image processing
- G06T2207/30232—Surveillance
Definitions
- the present invention relates to a monitoring system and a monitoring method for detecting various states including stationary / unsteady from crowd images taken by a monitoring camera.
- Patent Document 1 in order to detect a motion different from a steady state during random particle motion, the observation region is divided into small regions, and regions where the time change of the number of particles in the small region is larger than others are It is detected as an abnormal region where particles exist.
- the present invention relates to a method and a program for detecting a human who moves differently from others by group concentration.
- Patent Document 2 calculates an optical flow from video data, and detects that the state of the crowd has changed locally from the average and variance of the size (speed) of the flow.
- Patent Document 1 Since the conventional technique disclosed in Patent Document 1 is based on the premise that random movement or movement in one direction is steady, it cannot be applied to a crowd scene in which movement in various directions is mixed. It can only be used to detect motions that are different from others.
- Patent Document 2 since the conventional technique disclosed in Patent Document 2 only looks at the magnitude of the optical flow, it cannot detect an anomaly related to the reverse direction or the like. In addition, since it only determines the difference between the areas, such as the average value of the flow size of the area and the statistics such as variance, it can only be detected whether or not an abnormality has occurred. Yes, it is not possible to detect what kind of state has occurred.
- the present invention is an invention for solving the above-described problem, and can generally detect various states including stationary / unsteady from a crowd image captured by a monitoring camera and monitoring. It aims to provide a method.
- a monitoring system of the present invention is a monitoring system for inputting an image obtained by photographing a crowd including a plurality of moving bodies and detecting an unsteady state of the crowd from motion information on the image.
- Video unit for capturing and inputting crowd images; optical flow calculating unit for calculating optical flow from input images captured at different times; Judgment block setting means to be set for a block, optical flow attribute aggregation means for aggregating optical flow attributes generated for each decision block, and stationarity for evaluating the degree of stationarity of the judgment block from the aggregated optical flow attributes
- the stationary degree evaluation index calculating means for calculating the evaluation value of the evaluation index and the evaluation block non-determining from the evaluation value of the stationary degree evaluation index
- a non-steady state determining means for determining a normal state, characterized in that it comprises an output means for outputting on the video image the result of the determination in unsteady state determining means.
- the optical flow attribute counting means quantizes the attribute of the direction of the optical flow generated in the determination block and totals it in the distribution by direction, and the stationarity evaluation index calculation means calculates the upper two directions with the largest number of flows from the distribution by direction. Calculates the evaluation values of the three types of steadyness evaluation indices: the direction concentration degree indicating the degree of concentration of the number of flows in the upper two directions, the angle formed by the upper two directions, and the retrograde degree indicating the ratio of the number of flows in the upper two directions.
- the unsteady state determination means is characterized in that the reverse of the mainstream flow is determined as the unsteady state based on the evaluation values of the three types of steady state evaluation indexes. Other means will be described later.
- FIG. 1 It is a block diagram which shows the structure of 1st embodiment of the monitoring system by this invention. It is a figure which shows the example which displayed the result of having calculated the optical flow superimposed on the image. It is a figure which shows the example which set the determination block to the image. It is a figure for demonstrating the encoding method classified by direction of an optical flow at the time of calculating distribution according to direction. It is a figure which shows the example of distribution according to direction as a result of totaling the generation number of the optical flow according to direction code, (a), (b), (c) is each of the determination blocks 31, 32, and 34 shown in FIG.
- FIG. 11B is a diagram showing a histogram of the velocity distribution of the optical flow in the region shown in the determination block 10f of FIG. It is a figure which shows the example of a screen output on a monitor in 3rd embodiment.
- FIG 15 is a figure which shows the flow of a process of the monitoring system MS which inputs the image
- FIG. 15 It is a figure for demonstrating the storage item of a stationary degree evaluation index kind storage means and a stationary degree evaluation index value storage means, (a) is a figure which shows the example of the stationary degree evaluation index kind storage means 15u, b) is a figure which shows the example of the storage item of the stationary degree evaluation index value storage means 15v. It is a figure for demonstrating the storage item of a non-stationary determination type storage means and a non-stationary determination result storage means, (a) is a figure which shows the example of the non-stationary determination type storage means 15w, (b) is It is a figure which shows the example of the non-stationary determination result storage means 15x. It is a figure which shows the example of the output method of a determination result in case a some non-stationary determination flag is 1.
- FIG. 1 It is a figure for demonstrating the storage item of a stationary degree evaluation index kind storage means and a stationary degree evaluation index value storage means.
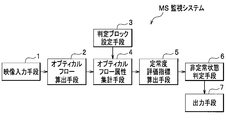
- FIG. 1 is a block diagram showing a configuration of a first embodiment of a monitoring system according to the present invention.
- the monitoring system MS shown in FIG. 1 includes a video input unit 1, an optical flow calculation unit 2, a determination block setting unit 3, an optical flow attribute totaling unit 4, a stationary degree evaluation index calculation unit 5, and an unsteady state determination. Means 6 and output means 7 are provided.
- the monitoring system MS monitors a crowd including a plurality of moving bodies.
- the moving bodies are not limited to people, but may be animals, bicycles on which people ride, and the like.
- the video input means 1 captures an area to be monitored such as a station, an airport, a plaza, a hall, etc. from above or from the vicinity with a camera.
- the image is stored after A / D (analog / digital) conversion.
- the video is continuously captured in time series, and is stored in the image storage means in order as an image at time t, an image at time t-1, and an image at time t-2, where t is the current time.
- the optical flow calculation means 2 is a means for calculating the optical flow from the input image.
- the same object is associated between two images taken at different times, and the movement amount is expressed as vector data.
- a specific calculation method is described in CG-ARTS Association “Digital Image Processing” p243-245.
- the purpose is to obtain the characteristics of the crowd movement by calculating the optical flow, so any calculation method may be used.
- FIG. 2 is a diagram showing an example in which the result of calculating the optical flow is displayed superimposed on the image.
- arrows up to 22, 23, ..., 29, 2a, ..., 2n are optical flows.
- the letter 2L in the code is written in uppercase letters because it is unclear whether it is English letters or numbers if lowercase letters are used.
- FIG. 2 shows an example in which one optical flow is calculated for one person for the sake of simplicity.
- a plurality of optical flows may be calculated for each person, and feature areas such as corners are detected and tracked.
- a large number of optical flows may be calculated without being limited to one per person.
- the present invention is effective. Note that the directions of the arrows 22 to 2n indicate the movement direction.
- the determination block setting means 3 is a means for presetting a block area for determining whether or not an unsteady state has occurred in the input image. A method for setting a determination block area will be described with reference to FIG.
- FIG. 3 is a diagram illustrating an example in which a determination block is set in an image.
- the figure shown in FIG. 3 shows an example in which a determination block is set in the image shown in FIG.
- Each area shown in 31, 32, 33, and 34 obtained by dividing the screen into four is a determination block (hereinafter also referred to as a block).
- the occurrence state of the optical flow in each of these blocks is analyzed.
- the block size is set based on the type of unsteady state to be detected, the resolution, and the like.
- the block sizes are set to be the same. However, the block sizes may be arbitrarily changed according to the attributes of the scene to be monitored. In this example, which block a person belongs to is based on the position of the person's feet. It is also effective to convert the field of view on the screen into the real coordinate system of the scene being photographed and divide it into block units representing the same area on the real coordinates. Alternatively, the entire screen may be handled as a large block.
- the optical flow attribute aggregation means 4 aggregates, for each block, attributes such as the number of generated optical flows, the direction of the optical flow, and the speed of the optical flow for each optical flow calculated by the optical flow calculation means 2. This is a means for calculating as a feature amount.
- an example of detecting a state in which a different flow with respect to the main flow, such as “reverse”, is detected is shown as an example, and the “direction” of the optical flow is counted as an attribute.
- Other attributes will be shown in other embodiments.
- each of the determination blocks 31 to 34 set by the determination block setting means 3 includes 22 to 2n optical flows.
- the optical flow attribute aggregation means 4 aggregates the optical flows generated in the block into a direction-specific distribution.
- a method according to Non-Patent Document 1 is known for encoding information with direction by direction. This method encodes an image brightness gradient as data called a direction code.
- Non-Patent Document 1 ULLAH Farhan, S.Kaneko and S.Igarashi, “Orientation code matching for robust object search”, IEICE Trans.on Inf. & Sys., Vol.E84-D, No.8, pp.999 -1006,2001.
- FIG. 4 is a diagram for explaining a direction-specific encoding method of an optical flow when calculating a direction-specific distribution.
- An optical flow direction-specific encoding method for calculating the direction-specific distribution will be described with reference to FIG.
- a method of encoding the direction of the optical flow in 8 directions is shown.
- directions 41 to 48 are directions of an optical flow that becomes a reference when encoding by direction.
- the direction of the optical flow calculated by the optical flow calculation means 2 is obtained as a continuous value of 0 to 360 degrees when any one direction is used as a reference. This is quantized into an integer value at a constant angular interval.
- the optical flow included between the respective angles is quantized in increments of 45 ° with the rightward direction 41 in the horizontal direction as a reference (0 ° (0 degree)).
- an optical flow with an angle of 20 ° is represented by a code ‘0’
- an optical flow at 100 ° is represented by a symbol ‘2’.
- the number of occurrences of the optical flow included in the block is counted for each direction code of 0 to 7.
- FIG. 5 is a diagram showing an example of distribution by direction as a result of counting the number of occurrences of optical flows by direction code. 5 (a), 5 (b), and 5 (c), for each area of the determination blocks 31, 32, and 34 shown in FIG. An example of distribution is shown.
- the histogram 51 (see FIG. 5A) is the totaled result of the distribution by optical flow direction of the decision block 31 in FIG. 3
- the histogram 52 (see FIG. 5B) is the optical flow of the decision block 32 in FIG.
- the histogram 53 is the tabulation result of the distribution by optical flow direction of the determination block 34 in FIG.
- the graph is like a histogram 51.
- the optical flows 27 to 29, 2a, and 2b are oriented in the same direction with some variations, but the distribution is as shown in the histogram 52.
- the optical flows of 2g, 2h, 2i, 2L, and 2n are directed in the same direction, whereas the optical flows of 2j and 2k are directed in the opposite direction to the other five flows. Therefore, a distribution like a histogram 53 is obtained.
- the direction-specific code is quantized in 8 directions.
- the present invention is not limited to this, and 16 directions may be used.
- the degree of detail of quantization is determined according to the contents of the unsteady state to be detected.
- an example in which the attributes of optical flows generated in one frame are totaled is used.
- a means for totaling the attributes of optical flows generated in several consecutive frames is also effective.
- the image input means 1 captures 30 frames per second, for example, if the attributes of optical flows in 10 consecutive frames of images are counted, the flow information generated in 0.33 seconds can be counted. . From the viewpoint of noise removal and data smoothing, it is effective to add up the optical flows for several frames.
- the stationarity evaluation index calculation unit 5 is a unit that calculates an index for evaluating stationarity from the optical flow attributes (distribution by direction in the embodiment) tabulated by the optical flow attribute tabulation unit 4.
- the index is set based on the content of the event to be detected. In this embodiment, an index for detecting “occurrence of retrograde with respect to the main flow” will be described.
- the optical flows 2g, 2h, 2i, 2n, and 2L are directed in the upper left direction of the screen, while the optical flows 2j and 2k are directed in the lower right direction of the screen. ing.
- the result of aggregating the optical flow direction attributes of this block is a histogram 53 shown in FIG.
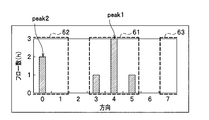
- FIG. 6 is a diagram showing how to obtain the top two peaks.
- the top two directions with the largest number of flows are obtained from the distribution by direction.
- the maximum value of the number of flows is the position where the direction code is 4, and is indicated by “peak1” in the figure.
- the maximum flow number h (peak 1) and the second maximum flow number h (peak 2) at this time are obtained.
- the number of flows of only the corresponding bin may be obtained, but if a slight error is allowed in the definition of the direction, a method of summing bins on both sides of the corresponding bin may be taken.
- the maximum flow number h (peak 1) is the number of flows having the width shown by 61 in FIG. 6, and the second maximum flow number h (peak 2) is the figure. 6 is a region where 62 and 63 are combined.
- the bin means that the histogram has a numerical value in a certain finite range, but the range is divided into appropriate numerical regions.
- Direction concentration degree The ratio of the number of optical flows in the upper two directions with the largest number of cases out of the number of optical flows in the entire block. When the flow direction is distributed in multiple directions, the value of this index decreases. When the flow direction is concentrated in two or less directions, the value of this index increases.
- the above index is calculated based on the direction distribution data.
- the means for calculating the one or a plurality of indexes that can represent the event to be detected based on the attributes based on the attributes tabulated by the optical flow attribute tabulating unit 4 is the process of the stationarity evaluation index calculating unit.
- the unsteady state determination unit 6 is a unit that determines whether the state of the block is steady or unsteady based on the evaluation index calculated by the steady degree evaluation index calculation unit 5.
- the determination method is determined based on the contents of the unsteady state to be detected.
- a method of determining by comparing with a preset threshold value can be adopted.
- a method of comparing with evaluation values of other blocks in the same screen can be adopted. Further, when it is desired to see the state change in time series, there is a method of comparing with the past evaluation value of the same block.
- the retrograde is determined by comparing each of the “direction concentration degree”, “angle”, and “reverse degree” indices calculated by the stationarity evaluation index calculating means 5 with a threshold value.
- the determination condition with the threshold is set as follows, for example.
- the angle is an index of whether or not the angle formed by the two directions is reversed, so for example, a range from 150 degrees to 210 degrees is reversed.
- the actual determination process will be described by taking as an example a case where the areas of the determination block 31 and the determination block 34 in FIG. 3 are evaluated.
- the evaluation index calculated from the histogram 51 of FIG. 5, which is the distribution by direction of the determination block 31 of FIG. 3, is as follows.
- the determination block 34 determines as “retrograde”. As described above, an example in which the determination is non-steady and a case in which the determination is steady is shown. Similarly, it is assumed that the steady / non-stationary determination is performed for all blocks. The above is the contents of the processing of the unsteady state determination means 6.
- the output means 7 is means for outputting the unsteady state determined by the unsteady state determination means 6.
- this means there is a method of drawing and outputting a processing progress and a determination result on a monitor screen by superimposing on an input image. An example of the output screen will be described with reference to FIGS.
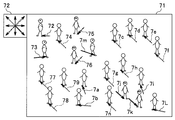
- FIG. 7 is a diagram showing an example in which the optical flow calculated by the optical flow calculation means 2 is displayed on the input image 71 by color coding according to the encoded direction.
- Reference numerals 72 to 79 and 7a to 7n are drawn by superimposing the optical flows calculated by the optical flow calculation means 2 on the screen, but the colors are changed in each encoded direction based on the legend shown in the rectangle 72. I'm drawing. By drawing in this way, there is an effect that the spatial distribution in the flow direction can be displayed visually and easily. Color coding is more effective when color display is used.
- FIG. 8 is a diagram showing an example in which the result obtained by the optical flow attribute counting means 4 is displayed so as to be superimposed on the input image.
- the circles 85, 86, 87, and 88 indicate the distribution of the optical flow generated in each of the included determination blocks 81, 82, 83, and 84 in each direction.
- the direction of the arrow indicating each direction and the color coding are based on the legend shown in 89, and the length of the arrow indicates the number of flows in each direction.
- FIG. 9 is a diagram showing an example in which the value of the evaluation index calculated by the steady-state evaluation index calculation unit 5 and the result of determination by the unsteady state determination unit 6 are superimposed on the input image.
- the values (evaluation values) of the evaluation indices (direction concentration degree, angle, and retrograde degree) calculated for each block by the stationary degree evaluation index calculation means 5 are superimposed on the input image shown in FIG. 93, 94. Further, there is a realization method in which the region determined as “unsteady” by the unsteady state determination means 6 is highlighted with a bold rectangle indicated by 95 and the unsteady type is displayed as indicated by 96.
- the evaluation indexes 91 to 94 include a method of making it easy to visually grasp the state by displaying different indicators that exceed the threshold and those that do not exceed the threshold. It is also effective to draw a display of 95 unsteady region rectangles and 96 unsteady state types with conspicuous colors.
- the drawing colors 95 and 96 are distinguished from other unsteady states, which will be described later in the embodiment, so that the colors are classified according to the types of unsteady states in order to show the determination result more effectively. It is valid.
- an example of drawing on different screens has been shown.
- three types of monitors are prepared and output to each, or three types are displayed side by side on one monitor.
- the output example on the screen has been described above, but the present invention is not necessarily limited to this description, and other methods that can expect the same effect may be used.
- the output means 7 when an unsteady state occurs, an image is stored in a recording means (not shown) together with data such as a determination block in which the unsteady state has occurred, time, and unsteady type. There is also a way to do it. This method is effective when a monitoring person is not permanently installed and the situation is confirmed later when an incident or accident occurs, or when unsteady state data that is likely to occur in the monitoring area is collected. Further, the output to the monitor and the output to the recording apparatus may be used together.
- the monitoring system MS when the monitoring system MS is configured such that the monitoring cameras are installed in many places and connected to the center via a network, the detailed contents of the unsteady state are not output, but the unsteady state is not output.
- a method of outputting only the occurrence to the center side is also effective.
- Non-Patent Document 2 shows a method for calculating the richness from the direction-specific distribution of the lightness gradient and the distribution by direction.
- Non-Patent Document 2 Hidenori Takashi, Shunichi Kaneko, Takayuki Tanaka, “Robust Tagging in Unknown Environment”, IEEJ Transactions (C), Vol25, No6, pp.926-934, 2005.
- the abundance R is calculated by the following formula from the distribution of the optical flow of a certain block in each direction, which is aggregated by the optical flow attribute aggregation means 4.
- the calculated richness R takes a value from 0 to 1, and the closer to 0, the more the direction of the optical flow is biased, and the closer to 1, the index indicates that the direction of the optical flow is disturbed.
- the flow state of the determination block 31 in which the flow direction is disturbed and the flow state of the determination block 32 biased in one direction can be distinguished using the richness R, for example, a threshold is appropriately set (for example, 0.5), and the richness A non-steady state determination can be issued for a block in which R is a certain value or more.
- the evaluation based on the richness R is applied to an area where the direction of flow is relatively fixed, such as a communication passage of a station, for example, and is effective in detecting that an unsteady state has occurred and the direction of human flow is disturbed. Is.
- the stationarity evaluation index calculation unit 5 calculates entropy from the direction-specific distribution, and the unsteady state determination unit 6 sets the region where the entropy is large as the region where the flow is disturbed. It can be determined as a state.
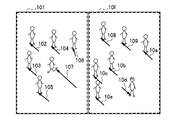
- FIG. 10 is a diagram illustrating an example in which the optical flow calculated by the optical flow calculation unit 2 is superimposed on the video input by the video input unit 1 and drawn.
- Optical flows 102 to 107 are calculated in the determination block 101, and optical flows 108 to 109 and 10a to 10e are calculated in the determination block 10f.
- the number of optical flows calculated from one person is one, but a plurality of optical flows may be calculated from one person as in the first embodiment.
- the crowd is walking at approximately the same speed.
- the decision block 101 includes a running person, an optical flow 107 larger than the others is generated.
- the optical flow attribute totaling means 4 totals the distributions by speed, detects outliers based on the distributions, and if an outlier occurs, it is assumed that a flow with a different speed distribution has occurred. “Steady”.
- FIG. 11 is a diagram showing a histogram of the result of the optical flow calculated by the optical flow calculation means 2 being aggregated into the speed-specific distribution by the optical flow attribute aggregation means 4.
- the optical flow velocity distribution in the region shown in the determination block 101 in FIG. 10 is shown in the histogram 111 in FIG. 11A, and the optical flow velocity distribution in the region shown in the determination block 10f in FIG. 10 is shown in the histogram in FIG. 112.
- the optical flows for the past several frames are aggregated.
- the camera is installed at a sufficiently high position and the crowd is viewed from above, so it is assumed that the resolution at the top and bottom of the screen is not significantly different, and the optical flow is on the screen.
- the number of pixels at is the “speed” of the speed distribution. If the camera installation position is low and the resolution is greatly different between the upper and lower parts of the screen, the length of the optical flow is converted to the actual coordinate system using the camera parameters at the time of shooting, and the actual moving speed is obtained. It is more desirable to convert and aggregate.
- the stationary degree evaluation index calculating means 5 obtains an average value ⁇ and a standard deviation ⁇ from the speed distribution obtained by the optical flow attribute counting means 4, and obtains an evaluation value in a steady speed range based on these values.
- the lower limit value and the upper limit values ⁇ 2 ⁇ and ⁇ + 2 ⁇ that include 95% of the normal distribution are obtained, and the ranges are determined as the upper limit value and lower limit evaluation index of the speed steady range at this time of the block.
- the value is not necessarily limited to this.
- the shape of the velocity distribution may not follow the normal distribution, so apply such as changing to ⁇ -3 ⁇ to ⁇ + 3 ⁇ . Set as appropriate depending on the location and time of day.
- the upper limit value and lower limit value evaluation indices of the steady speed range calculated by the steady degree evaluation index calculation means 5 are compared with the speeds of the individual optical flows, and if there is a flow that falls outside the steady range. Suppose that a state where a flow having a speed different from the surrounding speed is mixed occurs.
- 113 in the histogram 111 is the position of the average ⁇ of this distribution, and the range of the arrow 114 is the range of ⁇ 2 ⁇ to ⁇ + 2 ⁇ .
- 115 in the histogram 112 is the position of the average ⁇ of this distribution, and the range of arrow 116 is the range of ⁇ 2 ⁇ to ⁇ + 2 ⁇ .
- the determination block 10f in FIG. 10 is determined as “normal”.
- the optical flow in the range indicated by 117 exceeds the steady range indicated by 114, it is determined as “unsteady”.
- the determination process is obtained by obtaining the maximum value and the minimum value of the speed distribution and comparing this with the upper limit value and the lower limit value of the speed steady range.
- the output means 7 can employ a method of outputting the processing progress and determination result on a monitor and a method of recording on a recording device.
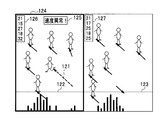
- FIG. 12 is a diagram showing an example of a screen output on the monitor in the third embodiment.
- the velocity distribution is displayed on the screen.
- the average value ⁇ , the steady range lower limit value ⁇ 2 ⁇ , the steady range upper limit value ⁇ + 2 ⁇ , the minimum value of the velocity distribution, the maximum value, etc. calculated by the steady degree evaluation index calculation means 5 are used.
- the evaluation value is displayed on the screen.
- the unsteady state determination means 6 determines that the state is unsteady
- the optical flow at a speed exceeding the steady range is indicated by other optical flows and colors (indicated by broken lines in the drawing). .) Is also effective in confirming the position of optical flow with different speeds.
- the unsteady state determination means 6 determines that the block is unsteady
- the block is surrounded by a bold rectangle as indicated by 124 and the unsteady content is displayed as indicated by 125.
- the colors of the rectangle 124 and the character 125 are displayed in different colors for each non-stationary type, it is easy for the monitor to intuitively confirm the unsteady type.
- the output example on the monitor is drawn on the same screen, but as in the first embodiment, it is drawn on a different screen and displayed on another monitor.
- a display method such as switching and displaying by keyboard operation may be used. The above is the third embodiment.
- optical flow attribute counting means 4 may count the velocity distribution after converting the size of the optical flow generated in the determination block into a distance on the world coordinates.
- the fourth embodiment is an example in which an unsteady state is detected by a temporal change in an optical flow attribute total value calculated for each block.
- “sudden change” in which the number of flows generated in a block changes rapidly is detected as an unsteady state.
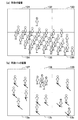
- FIG. 13 is a diagram illustrating an example in which the optical flow calculated by the optical flow calculation unit 2 is drawn on the video input by the video input unit 1 at different times.
- the image in FIG. 13A is captured and input at time t
- the image in FIG. 13B is an image captured and input at time t + n, n frames after the image in FIG. is there.
- the determination block 131 in FIG. 13A and the determination block 137 in FIG. 13B are areas of the same block taken at times different by n frames.
- the determination block 132, the determination block 138, and the determination block 133 are the same. The same applies to the determination block 139 and the like.
- the image at time t in FIG. 13A In the scene of the image at time t in FIG. 13A, during an event, the crowd is stopped and the optical flow is not calculated.
- the image at time t + n in FIG. 13B is a scene where the event has ended and the crowd has started to move.
- the optical flow attribute counting means 4 counts the number of flows generated in each block every frame or every several frames.
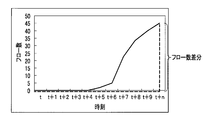
- FIG. 14 is a diagram for explaining changes in the number of time-series flows in the fourth embodiment.
- the graph of FIG. 14 shows changes in the number of time-series flows in the determination block 131, and the number of flows in the past several frames is totaled for each frame. Specifically, referring to FIG. 14, the number of flows was 0 (zero) at time t, but the number of flows increased from time t + 4, and the number of flows reached 45 at time t + n. Recognize.
- the stationarity evaluation index calculation means 5 obtains the difference between the number of flows at the current time and the number of flows before n frames as an evaluation value (n is a constant). In this example, the difference in the number of flows is 45 as described above.
- the unsteady state determination means 6 makes an unsteady determination that the amount of human movement has suddenly changed when the difference in the number of flows obtained by the steady degree evaluation index calculation means 5 exceeds a threshold value. For example, if the threshold is set to 40, the difference in the number of flows exceeds the threshold at time t + n, and the “unsteady” determination is issued. In this example, the case where the number of flows suddenly increases has been described, but an absolute value may be taken so that both can be detected when it suddenly increases or when it suddenly decreases.
- the output means 7 displays the difference in the number of flows, which is the attribute total value of the processing progress, the number of flows in the evaluation value, the determination result, and the like on the monitor screen in the same manner as in the embodiment described above.
- the above is the fourth embodiment.
- the present embodiment is an example in which optical flow attribute total values are compared in time series and are set to “unsteady” when a change is detected.
- the number of flows was explained as an example of the optical flow attribute aggregation value, but the above-mentioned aggregation distribution by direction and velocity distribution were compared with data at different times in the same block in the same way, and when a difference occurred It may be “unsteady”.
- the fifth embodiment is an example in which a total value of optical flows calculated for each block is compared with a total value of other blocks in the same frame, and an unsteady state is detected when there is a difference.
- an example will be described in which “avoidance” in which the number of flows is extremely different between adjacent blocks is detected as an unsteady state.
- the optical flow attribute counting means 4 calculates the number of flows of all the determination blocks in the screen.
- the stationarity evaluation index calculation means 5 obtains an evaluation value for comparing the number of flows of a certain determination block with the number of flows of surrounding determination blocks. For example, the evaluation value for a certain determination block is obtained by multiplying the average value of the number of flows of adjacent determination blocks by a coefficient.
- the evaluation index of the determination block 138 is an average of the number of flows of the determination blocks 137, 139, 13a, 13b, and 13c around the determination block 138.
- the coefficient is a threshold value for measuring the difference in the number of flows with the surrounding blocks.
- the unsteady state determination unit 6 compares the evaluation value calculated by the steady degree evaluation index calculation unit 5 with the number of flows of the block, and sets the state to be “unsteady” when the number of flows is smaller than the evaluation value. That is, if the number of flows is less than half of the average number of surrounding flows, it is assumed that the number of flows of the block is extremely smaller than the surrounding blocks.
- the value of the evaluation index is drawn in each determination block, and when it is determined that it is non-stationary, a color-coded frame is displayed, and non-stationary contents are displayed. To do.
- the above is the content of the fifth embodiment.
- a direction-by-speed distribution by combining a direction-by-direction distribution and a velocity distribution is calculated, and a non-stationary determination is issued when a flow in a specific direction / speed occurs.
- This embodiment is also conceivable.
- the sixth embodiment is an embodiment relating to a monitoring system that realizes a plurality of types of non-stationary determinations described in the above embodiments. This embodiment is realized by the configuration of FIG.
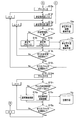
- FIG. 15 and 16 are diagrams showing the flow of processing of the monitoring system MS that inputs video from the monitoring camera, executes a plurality of unsteady determinations, and outputs them. Reference is made to FIG. 1 as appropriate.
- S151 and S152 in the process flow are processes executed by the video input means 1
- S153 is a process executed by the optical flow calculation means 2
- S154 to S158 are optical flow attribute aggregations.
- S159 and S15a to S15d are processes executed by the stationary degree evaluation index calculating means 5.
- S15e to S15L are processes executed by the unsteady state determination means 6
- S15m to S15q are processes executed by the output means 7.
- a list of optical flow attributes is stored in the optical flow attribute type storage unit 15s
- a stationarity evaluation index is stored in the stationarity evaluation index type storage unit 15u.
- the list of non-stationary determinations to be executed is stored in the non-steady state determination type storage unit 15w.
- the items described in the list are sequentially processed. Thereby, a plurality of unsteady determinations and evaluation indexes for determination can be executed in parallel.
- by changing the list of flow attributes, evaluation indexes, and determination types to be aggregated it is possible to change or add the types of unsteady determinations to be performed.
- the video input means 1 clears the time counter to 0 at the start of processing, and in S152, inputs the image at time t and stores it in the image storage means 15r.
- step S153 the optical flow calculation unit 2 calculates an optical flow from the current time t stored in the image storage unit 15r and the image at the past time tn, and stores the optical flow in the optical flow storage unit 15z. It is assumed that the contents of the optical flow storage unit 15z store information on the calculated start / end point coordinates of each optical flow at time t.
- step S154 the optical flow attribute counting unit 4 clears the counter i of the determination block on the image set by the determination block setting unit 3 to 0, and the subsequent processes in steps S155 to S157 are performed for each block. Specifically, in step S155, the optical flow attribute counter j is cleared to zero.
- step S156 the j-th optical flow attribute type stored in the optical flow attribute type storage unit 15s (see FIG. 17) is read, and the optical flow attribute totaling unit 4 totals the attributes. For example, summing up the attributes means summing up the number of flows in each direction shown in FIG. 4 in the case of distribution by direction. In the case of velocity distribution, this means that the number of flows is totaled for each length of the number of optical flows.
- FIG. 17 is a diagram for explaining the storage items of the optical flow attribute type storage means and the optical flow attribute total result storage means.
- the contents of the optical flow attribute type storage means 15s are shown in FIG.
- the optical flow attribute type storage unit 15s includes an attribute type ID and an attribute type.
- the attribute counting process (specific processing contents are described in the first to fifth embodiments) corresponding to each attribute ID is included in the optical flow attribute counting means 4.
- a new attribute can also be added by adding an attribute ID and attribute type to this list and adding a corresponding aggregation process to the optical flow attribute aggregation means 4.
- the optical flow attribute totaling unit 4 stores the optical flow attribute totaled in S156 in the optical flow attribute totaling result storage unit 15t.
- FIG. 17B shows an example of items stored in the optical flow attribute tabulation result storage unit 15t.
- a count result is stored for each block and each attribute type for each time.
- the optical flow attribute totaling unit 4 determines whether all the optical flow attributes have been totaled. If it has been counted (S157, Yes), the process proceeds to S158, and if it has not been completed (S157, No), the attribute counter j is incremented by 1 and the process returns to S156.
- step S158 the optical flow attribute totalization unit 4 determines whether or not the attribute totalization processing for all the blocks has been completed. If completed (S158, Yes), the process proceeds to S159. If not completed (S158, No), the block counter i is incremented by 1, and the process returns to S155.
- the stationarity evaluation index calculation means 5 executes the following processes of S159 to S15d. Specifically, the stationarity evaluation index calculation unit 5 clears the counter i of the determination block on the image set by the determination block setting unit 3 to 0 in S159, and sets the counter k of the stationarity evaluation index in S15a. Clear to zero.
- the stationarity evaluation index calculation unit 5 reads the kth index stored in the stationarity evaluation index type storage unit 15u, and the stationarity evaluation index calculation unit 5 calculates the evaluation index k. At the time of calculation, a necessary value is read and calculated from the attribute total value stored in the optical flow attribute total result storage unit 15t. For example, when calculating the “direction concentration degree”, the distribution by direction of the block I at time t is read and calculated.
- FIG. 18 is a diagram for explaining storage items of the stationarity evaluation index type storage means and the stationarity evaluation index value storage means.
- An example of the stationarity evaluation index type storage unit 15u is shown in FIG.
- the stationarity evaluation index type storage unit 15u includes a stationarity evaluation index type ID and a stationarity evaluation index type.
- Stationary degree evaluation index calculation processing (specific processing is described in the first to fifth embodiments) corresponding to each index ID is included in the stationary degree evaluation index calculation means 5.
- a stationarity evaluation index can be added by adding a stationarity evaluation index ID and an attribute type to this list and adding a corresponding tabulation process to the stationarity evaluation index calculation means 5.
- the stationarity evaluation index calculation unit 5 stores the stationarity evaluation index calculated in S15b in the stationarity evaluation index value storage unit 15v.
- FIG. 18B shows an example of storage items of the stationarity evaluation index value storage unit 15v. For each time, a calculation result is stored for each block and each stationary degree evaluation index.
- the stationarity evaluation index calculation unit 5 determines whether all the stationarity evaluation indices have been calculated. If it has been calculated (S15c, Yes), the process proceeds to S15d, and if it has not been completed (S15c, No), the index counter k is advanced by 1 and the process returns to S15b.
- the stationarity evaluation index calculation means 5 determines whether or not the attribute aggregation processing for all the blocks has been completed in S15d. If completed (S15d, Yes), the process proceeds to S15e. If not completed (S15d, No), the block counter i is incremented by 1, and the process returns to S15a.
- the unsteady state determination means 6 executes the following processes S15e to S15L. Specifically, the unsteady state determination unit 6 clears the counter i of the determination block on the image set by the determination block setting unit 3 to 0 in S15e, and sets the unsteady determination counter L to 0 in S15f. clear.
- the unsteady state determination unit 6 reads the L-th unsteady determination stored in the unsteady determination type storage unit 15w, and the unsteady state determination unit 6 performs the unsteady determination.
- a necessary index is read from the stationarity evaluation index value storage unit 15v for determination. For example, in the case of “retrograde” determination, “direction concentration”, “angle”, and “retrograde” of block I at time t are read and calculated.
- FIG. 19 is a diagram for explaining storage items of the non-stationary determination type storage means and the non-stationary determination result storage means.
- An example of the unsteady determination type storage means 15w is shown in FIG.
- the non-stationary determination type storage unit 15w includes a non-stationary determination type ID and a non-stationary determination type.
- Unsteady state determination processing (specific processing contents are described in the first to fifth embodiments) corresponding to each index ID is included in the unsteady state determination means 6.
- An unsteady determination can also be added by adding the unsteady determination ID and the unsteady determination type to this list and adding a corresponding determination process to the unsteady state determination means 6.
- the unsteady state determination means 6 determines in S15h whether or not the unsteady state determination performed in S15g is “true”. If “true” (S15h, Yes), it is determined that an unsteady state L has occurred, and the process proceeds to S15i. If it is “false” (S15h, No), it is determined that the unsteady state L has not occurred, and the process proceeds to S15j.
- the unsteady state determination means 6 assumes that an unsteady state L has occurred in the block I, sets the unsteady state determination L flag to “1”, and stores it in the unsteady state determination result storage means 15x.
- the unsteady state determination unit 6 determines that the unsteady state L has not occurred in the block I, sets the flag of the unsteady state determination L to “0”, and stores it in the unsteady state determination result storage unit 15x.
- An example of the unsteady determination result storage means 15x is shown in FIG. A flag of 0 or 1 is stored for each block and for each non-stationary determination type for each time.
- the unsteady state determination means 6 determines whether or not all unsteady state determinations have been performed in S15k. If it is determined (S15k, Yes), the process proceeds to S15L, and if there is a non-steady determination that has not been determined (S15k, No), the counter L of the non-steady determination type is advanced by 1 and returns to S15g.
- the unsteady state determination means 6 determines whether or not unsteady state determination processing has been completed for all blocks in S15L. If completed (S15L, Yes), the process proceeds to S15m. If not completed (S15L, No), the block counter i is incremented by 1, and the process returns to S15f.
- the output means 7 executes the following processes S15m to S15q. Specifically, the output unit 7 clears the counter i of the determination block on the image set by the determination block setting unit 3 to 0 in S15m.
- step S15n the output unit 7 reads the non-stationary determination result storage unit 15x, and determines whether or not the block I at the current time t has a non-stationary determination flag of “1”, that is, has a non-stationary determination. . If there is even one non-stationary determination with a flag of 1 (S15n, Yes), the process proceeds to S15o, and if all non-stationary determinations are 0 (S15n, No), the process proceeds to S15p.
- step S15o the output unit 7 draws a non-steady state determination screen and outputs it to the monitor or storage unit. In the drawing screen example, as shown in 95 and 96 of FIG.
- FIG. 20 is a diagram illustrating an example of a determination result output method when a plurality of non-stationary determination flags is 1. As shown in FIG. 20, when a plurality of non-stationary determination flags are 1 for the same determination block, a plurality of drawings 191 and 192 are drawn so that the type of the non-stationary determination that has occurred is known. Alternatively, when priorities are determined between non-stationary determination types, priorities may be determined in advance, and one type of non-stationary determination with a high priority may be drawn.
- the output means 7 performs a process of drawing a stationary screen when the unsteady determination flag is 0 for all the non-stationary determination types in S15p.
- An example of the steady screen is a drawing without unsteady determination as shown on the screen including the rectangles 91, 92, and 93 in FIGS. 7, 8, and 9, or the screen including 123 and 127 in FIG.
- the contents of the regular drawing the default drawing contents are determined, and a mouse or keyboard input or a dedicated switching menu interface is prepared as necessary so that the display can be switched according to the input from the user.
- the output unit 7 determines whether or not the output processing of all the blocks has been completed in S15q. If completed (S15q, Yes), the process returns to the process of S152 shown in FIG. 15, and the process at the next time t is executed. If not completed (S15q, No), the block counter i is incremented by 1, and the process returns to S15n.
- the above is the sixth embodiment of the monitoring system MS.
- the sixth embodiment an example is shown in which all non-stationary determinations are performed in all blocks in all time zones. However, this is performed for each time zone, for each block, etc., depending on the characteristics of the monitored location. It is also possible to take an execution form such as changing the type or priority of non-stationary determination. For example, if you know the characteristics of the monitoring area, such as the flow of people changing from time to time and the age of people passing by, you can change the type of unsteady judgment for each time zone, and even within the same image Also, operation such as changing the priority of the type of non-stationary determination for each block is possible.
- the list of optical flow attribute type storage means 15s, stationary degree evaluation index type storage means 15u, non-stationary determination type storage means 15w is set for each time zone and each block, and for each corresponding time zone and block. This can be achieved by processing the items listed.
- the monitoring system MS shown in the first embodiment captures images of a crowd including a plurality of moving objects and inputs them at different input times.
- an optical flow calculation unit 2 that calculates an optical flow from the recorded video
- a determination block setting unit 3 that divides a region on the video into blocks of non-stationary determination units in advance
- Optical flow attribute counting means 4 for counting the attributes of the optical flow
- stationarity evaluation index calculating means 5 for calculating an evaluation value of the stationarity evaluation index for evaluating the stationarity of the block from the tabulated attributes of the optical flow.
- an unsteady state determination means 6 for determining the unsteady state of the block from the evaluation value of the steady state evaluation index, and an unsteady state determination means And an output means 7 for outputting the result of the determination. As shown in FIG. 9, the output means 7 can highlight the area where the unsteady state has occurred.
- the output means 7 sets the color corresponding to each direction of the quantized distribution according to the direction shown in the first embodiment, draws the individual optical flows by the direction-specific color coding, and displays them overlaid on the video. it can. Further, the output means 7 can also superimpose and display the quantized distribution by direction on the corresponding block on the video.
- the output unit 7 can also display a block in which the unsteady state is generated in a different color depending on the type of the unsteady state. Further, the output means 7 draws the evaluation value calculated by the stationary degree evaluation index calculation means 5 on the corresponding block on the video, and when the evaluation value exceeds the threshold value by the unsteady state determination means, It can also be displayed in different colors.
- the stationarity evaluation index calculation unit 5 calculates entropy from the direction-specific distribution, and the unsteady state determination unit 6 determines that the region where the entropy is large is a region where the flow is disturbed. It can be determined as a steady state.
- the optical flow attribute counting means 4 can count the magnitude of the optical flow generated in the determination block into the speed distribution, and the output means 7 outputs the crowd speed distribution to the monitor. be able to.
- the stationarity evaluation index calculation means 5 calculates the average value ⁇ and standard deviation ⁇ of the velocity distribution, calculates ⁇ 2 ⁇ to ⁇ + 2 ⁇ , or ⁇ 3 ⁇ to ⁇ + 3 ⁇ , and sets the unsteady state.
- the determination unit 6 sets the range of ⁇ 2 ⁇ to ⁇ + 2 ⁇ or ⁇ 3 ⁇ to ⁇ + 3 ⁇ as a steady range, and when there is an optical flow that is out of the range, the speed at which motion of a speed different from others exists in the block. It can be determined as an unsteady state that is abnormal.
- the optical flow attribute counting means 4 may calculate the velocity distribution after converting the size of the optical flow generated in the block into a distance in world coordinates. Further, the output means 7 may draw an optical flow in which the magnitude of the velocity is out of the steady range with a color different from the others, and may output it superimposed on the video.
- the optical flow attribute counting means 4 counts the number of optical flows generated in the determination block, and the unsteady state determination means 6 determines the difference from the past number of flows before a certain frame. Can exceed the threshold value, it can be determined as an unsteady state of “sudden change”.
- the optical flow attribute counting means 4 counts the number of optical flows generated in the determination block, and the unsteady state determination means 6 has a difference between the number of flows in the surrounding blocks exceeding the threshold value. Can be determined as an unsteady state of “avoidance”.
- the output means 7 may draw the determined steady or unsteady state on the video and output it to the monitor or recording means.
- the state in a crowd scene, the state can be quantified from the distribution of motion attributes, and a region where an unsteady motion has occurred can be detected.
Landscapes
- Engineering & Computer Science (AREA)
- Multimedia (AREA)
- Physics & Mathematics (AREA)
- General Physics & Mathematics (AREA)
- Computer Vision & Pattern Recognition (AREA)
- Theoretical Computer Science (AREA)
- Signal Processing (AREA)
- Image Analysis (AREA)
- Closed-Circuit Television Systems (AREA)
- Emergency Alarm Devices (AREA)
- Image Processing (AREA)
Abstract
Description
<<第一の実施形態>>
図1は、本発明による監視システムの第一の実施形態の構成を示すブロック図である。図1に示す監視システムMSは、映像入力手段1と、オプティカルフロー算出手段2と、判定ブロック設定手段3と、オプティカルフロー属性集計手段4と、定常度評価指標算出手段5と、非定常状態判定手段6と、出力手段7とを有している。
定常度評価指標算出手段5は、オプティカルフロー属性集計手段4で集計したオプティカルフローの属性(実施形態では方向別分布)から、定常度を評価する指標を算出する手段である。指標は、検出する事象の内容に基づき設定する。本実施形態では、「主流な流れに対する逆行の発生」を検出するための指標について説明する。
(a)2方向に大きなピークがあること、
(b)2方向のピークの為す角が180°位であることである。
このことから、方向別分布より、下記(1)~(3)の3種類の評価値(方向集中度、角度、逆行度)を求めることで、逆行が検出できる。
(1)方向集中度:ブロック全体のオプティカルフロー数のうち、件数の多い上位2方向のオプティカルフロー数が占める割合である。フローの方向が多方向に分散していると、この指標は値が小さくなり、フローの方向が2方向以下に集中していると、この指標は値が大きくなる。
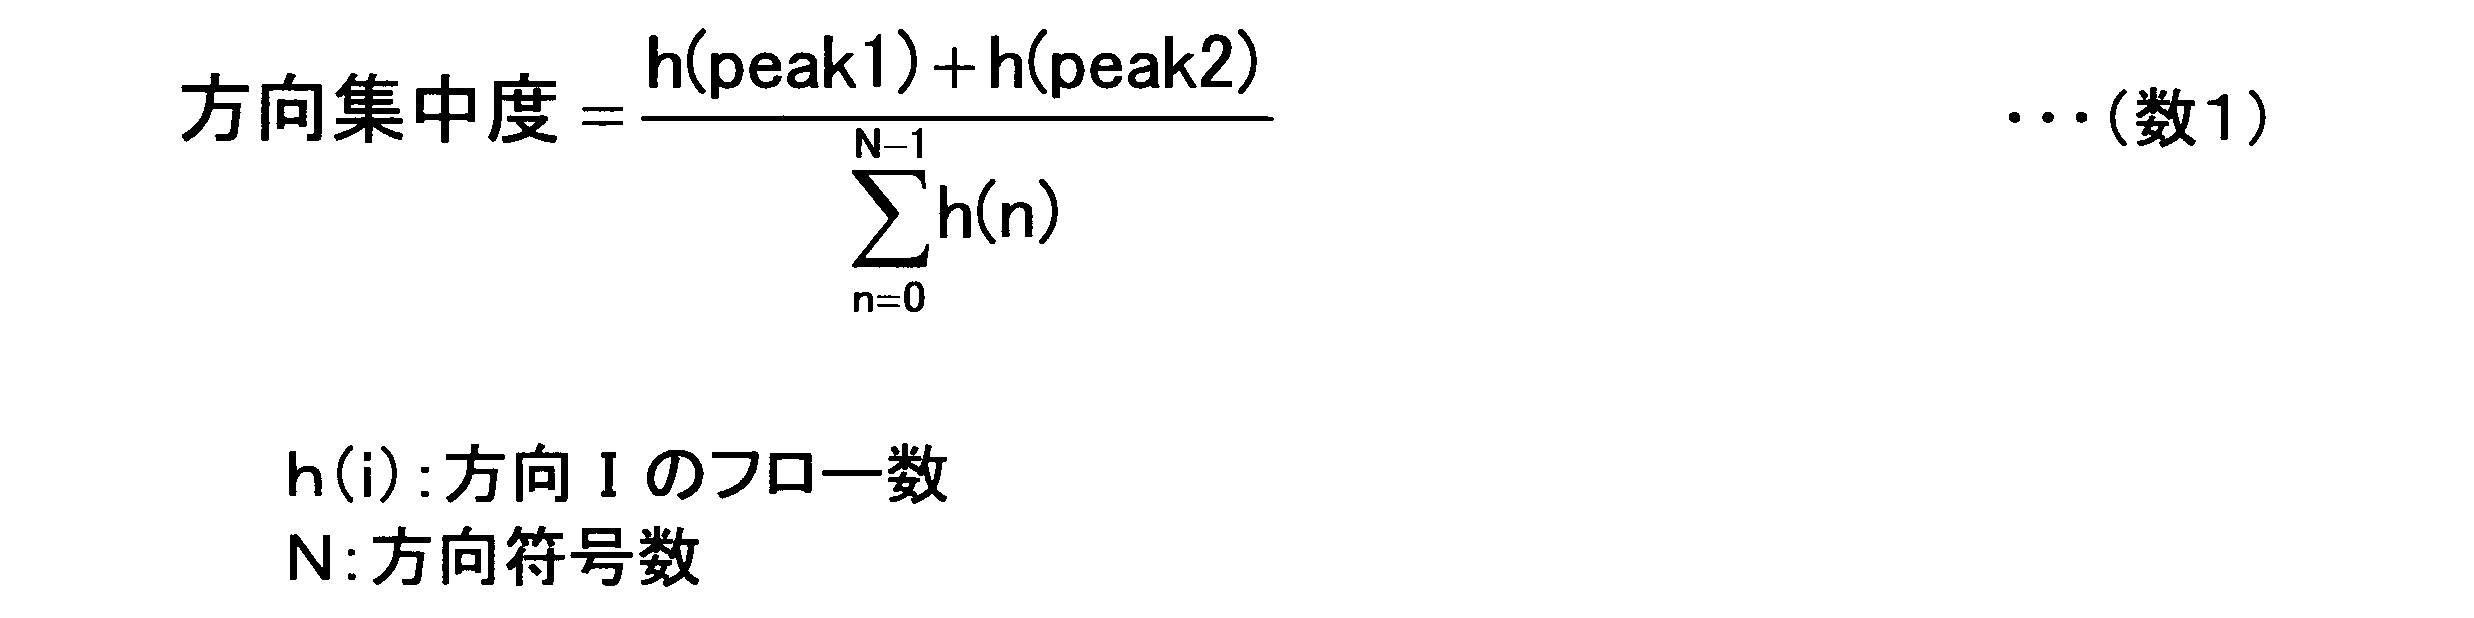


非定常状態判定手段6は、定常度評価指標算出手段5で算出した評価指標に基づき、当該ブロックの状態が定常であるか非定常であるかを判定する手段である。判定方法は、検出する非定常状態の内容に基づき決めるが、評価値の値により決められる場合には、予め設定した閾値との比較で判定する方法が採れる。一方、周囲と比較して異なる事象を判定したい場合、同一画面中の他のブロックの評価値と比較する方法が採れる。また、時系列での状態変化を見たい場合には、同一ブロックの過去の評価値と比較する方法などがある。
条件(i) 方向集中度 > th1
条件(ii) th2 < 角度 < th3
条件(iii) th4 < 逆行度 < th5
if(i)and(ii)and(iii)then“逆行”
else“定常”
th1=0.8
などに設定する。
th2=150
th3=210
などに設定する。
th4=0.1
th5=0.5
などと設定する。
方向集中度=(h(2)+h(5))/6=(2+2)/6=0.66
角度=abs(θ(2)-θ(5))=135°
逆行度=h(5)/h(2)=1.0
3種類の指標のうち、いずれの条件も判定条件を満たさないので、判定ブロック31は“定常”として判定する。
方向集中度=(h(4)+h(0))/7=(5+2)/7=1.0
角度=abs(θ(4)-θ(0))=180°
逆行度=h(0)/h(4)=2/5=0.4
3種類の指標の全てが条件を満たすので、判定ブロック34は“逆行”として判定する。以上のように、非定常判定になる場合と、定常判定になる場合の例を示したが、同様に、すべてのブロックについて定常/非定常判定を実施するとする。以上が、非定常状態判定手段6の処理の内容である。
次に、第二の実施形態につき説明する。
第二の実施形態では、オプティカルフローの方向別分布から、方向の乱れを示す「豊富度」の評価値を算出し、「群衆の動きの乱れ」を検出する実施形態である。明度勾配を方向符号化し、方向別分布から、豊富度を算出する手法については、非特許文献2に手法が示される。

判定ブロック31の豊富度R=0.51
判定ブロック32の豊富度R=0
(但し、閾値係数αは0.5とする。)
次に、第三の実施形態につき説明する。第一の実施形態、第二の実施形態では、方向別分布を求めることで、「逆行」、「人の流れの乱れ」などの非定常状態を検出する方法を示したが、第三の実施形態では、速度分布を求めることで、周囲の速度と異なる速度の流れが混在する状態を検出する例を示す。図1の構成のうち、オプティカルフロー算出手段2までは、第一の実施形態の構成と同じであるので説明を省略する。
次に、第四の実施形態につき説明する。第四の実施形態は、ブロックごとに算出されるオプティカルフロー属性集計値の、時間的変化により非定常状態を検出する例である。ここでは、ブロック内で発生するフロー数が急激に変化する「急変」を非定常状態として検出する例を説明する。
次に、第五の実施形態について説明する。第五の実施形態は、ブロックごとに算出されるオプティカルフローの集計値を、同じフレームの他のブロックの集計値と比較し、差がある場合に非定常状態を検出する例である。ここでは、隣接するブロック間でフロー数に極端に差が出る「回避」を非定常状態として検出する例を説明する。
次に、第六の実施形態について説明する。第六の実施形態は、前記実施形態で述べてきた複数種類の非定常判定を実現する監視システムに関する実施形態である。本実施形態は、図1の構成で実現する。
映像入力手段1は、S151において、処理の開始時に時刻のカウンタを0にクリアし、S152において、時刻tの画像を入力し、画像格納手段15rに格納する。
2 オプティカルフロー算出手段
3 判定ブロック設定手段
4 オプティカルフロー属性集計手段
5 定常度評価指標算出手段
6 非定常状態判定手段
7 出力手段
15r 画像格納手段
15z オプティカルフロー格納手段
15s オプティカルフロー属性種類格納手段
15t オプティカルフロー属性集計結果格納手段
15u 定常度評価指標種類格納手段
15v 定常度評価指標値格納手段
15w 非定常判定種類格納手段
15x 非定常判定結果格納手段
15y 記録手段
MS 監視システム
Claims (17)
- 複数の移動体を含んでなる群集を撮影した映像を入力し、映像上の動き情報から前記群集の非定常状態を検出する監視システムであって、
前記群集の映像を撮影し入力する映像入力手段と、
前記入力した異なる時刻に撮影された映像から、オプティカルフローを算出するオプティカルフロー算出手段と、
前記映像上の監視領域を、非定常判定する単位の判定ブロックに設定する判定ブロック設定手段と、
前記判定ブロックごとに発生する前記オプティカルフローの属性を集計するオプティカルフロー属性集計手段と、
前記集計したオプティカルフローの属性から、前記判定ブロックの定常度を評価するための定常度評価指標の評価値を算出する定常度評価指標算出手段と、
前記定常度評価指標の評価値から、前記判定ブロックの前記非定常状態を判定する非定常状態判定手段と、
前記非定常状態判定手段の判定の結果を前記映像上に出力する出力手段と、
を備えることを特徴とする監視システム。 - 前記オプティカルフロー属性集計手段は、前記判定ブロック内で発生する前記オプティカルフローの方向の属性を量子化し方向別分布に集計する
ことを特徴とする請求の範囲第1項に記載の監視システム。 - 前記定常度評価指標算出手段は、前記量子化した方向別分布から、フロー数の多い上位2方向を求め、前記上位2方向へのフロー数の集中度を表す方向集中度、前記上位2方向のなす角度、前記上位2方向のフロー数の比率を表す逆行度の3種類の前記定常度評価指標の評価値を算出し、
前記非定常状態判定手段は、前記3種類の定常度評価指標の評価値に基づいて、主流な流れに対する逆行を前記非定常状態として判定する
ことを特徴とする請求の範囲第2項に記載の監視システム。 - 前記出力手段は、前記量子化した方向別分布に対し各方向別に対応する色を設定し、個々の前記オプティカルフローを方向別に色分けして描画し前記映像上に重ね表示する
ことを特徴とする請求の範囲第2項に記載の監視システム。 - 前記出力手段は、前記量子化した方向別分布を、前記映像上の該当する前記判定ブロック上に重ね表示する
ことを特徴とする請求の範囲第2項に記載の監視システム。 - 前記オプティカルフロー属性集計手段は、前記判定ブロック内で発生する前記オプティカルフローの大きさを速度分布に集計する
ことを特徴とする請求の範囲第1項に記載の監視システム。 - 前記定常度評価指標算出手段は、前記定常度評価指標の評価値として、前記速度分布の平均値μ、前記速度分布の標準偏差σ、定常範囲の下限値μ-2σから定常範囲の上限値μ+2σの範囲、もしくは、定常範囲の下限値μ-3σから定常範囲の上限値μ+3σの範囲を算出し、
前記非定常状態判定手段は、前記範囲を外れる前記オプティカルフローが存在する場合に、当該ブロック内に他と異なる速度の動きが存在する速度異常である前記非定常状態として判定する
ことを特徴とする請求の範囲第6項に記載の監視システム。 - 前記オプティカルフロー属性集計手段は、前記判定ブロック内で発生する前記オプティカルフローの大きさを、ワールド座標上の距離に変換した上で、速度分布を集計する
ことを特徴とする請求の範囲第6項に記載の監視システム。 - 前記出力手段は、速度の大きさが前記定常範囲を外れる前記オプティカルフローを、他と異なる色で描画し、前記映像上に重ねて出力する
ことを特徴とする請求の範囲第7項に記載の監視システム。 - 前記オプティカルフロー属性集計手段は、前記判定ブロック内で発生する前記オプティカルフローのフロー数を集計し、
前記非定常状態判定手段は、前記判定ブロック内の過去の一定時間前のフロー数との差が閾値を超えた場合に前記非定常状態として判定する
ことを特徴とする請求の範囲第1項に記載の監視システム。 - 前記オプティカルフロー属性集計手段は、前記判定ブロック内で発生する前記オプティカルフローのフロー数を集計し、
前記非定常状態判定手段は、対象とする判定ブロックのフロー数が周囲の判定ブロックのフロー数との差が閾値を超えた場合に前記非定常状態として判定する
ことを特徴とする請求の範囲第1項に記載の監視システム。 - 前記出力手段は、前記非定常状態判定手段が前記非定常状態と判定した場合に、前記非定常状態の種類により異なる色で前記非定常状態の発生した前記判定ブロックを強調的に矩形表示する
ことを特徴とする請求の範囲第1項に記載の監視システム。 - 前記出力手段は、前記定常度評価指標算出手段で算出した評価値を、映像上の該当ブロック上に描画し、前記非定常状態判定手段により前記算出した評価値が閾値を超えていると判定された場合に、異なる色で表示する
ことを特徴とする請求の範囲第1項に記載の監視システム。 - 前記定常度評価指標算出手段は、前記方向別分布から、エントロピーを算出し、
前記非定常状態判定手段は、該エントロピーの大きい領域を、流れに乱れが発生した領域である前記非定常状態として判定する
ことを特徴とする請求の範囲第2項に記載の監視システム。 - 前記出力手段は、前記非定常状態判定手段が判定した定常状態もしくは前記非定常状態を、前記映像上に描画しモニタもしくは記録手段に出力する
ことを特徴とする請求の範囲第1項に記載の監視システム。 - 複数の移動体を含んでなる群集を撮影した映像を入力し、映像上の動き情報から前記群集の非定常状態を検出する監視システムを用いて、前記群集の動きを監視する監視方法であって、
映像入力手段は、前記群集の映像を撮影し入力し、
オプティカルフロー算出手段は、前記入力した異なる時刻に撮影された映像から、オプティカルフローを算出し、
判定ブロック設定手段は、前記映像上の監視領域を、非定常判定する単位の判定ブロックに設定し、
オプティカルフロー属性集計手段は、前記判定ブロックごとに発生する前記オプティカルフローの属性を集計し、
定常度評価指標算出手段は、前記集計したオプティカルフローの属性から、前記判定ブロックの定常度を評価するための定常度評価指標の評価値を算出し、
非定常状態判定手段は、前記定常度評価指標の評価値から、前記判定ブロックの前記非定常状態を判定し、
出力手段は、前記非定常状態判定手段の判定の結果を前記映像上に出力する
ことを特徴とする監視方法。 - 前記オプティカルフロー属性集計手段は、前記判定ブロック内で発生する前記オプティカルフローの方向の属性を量子化し方向別分布に集計し、
前記定常度評価指標算出手段は、前記方向別分布から、フロー数の多い上位2方向を求め、前記上位2方向へのフロー数の集中度を表す方向集中度、前記上位2方向のなす角度、前記上位2方向のフロー数の比率を表す逆行度の3種類の前記定常度評価指標の評価値を算出し、
前記非定常状態判定手段は、前記3種類の定常度評価指標の評価値に基づいて、主流な流れに対する逆行を前記非定常状態として判定し、
前記出力手段は、前記定常度評価指標算出手段で算出した前記3種類の定常度評価指標の評価値を、前記映像上の該当する判定ブロック上に描画し、前記非定常状態判定手段が前記非定常状態と判定した場合に、前記判定ブロックを強調的に矩形表示する
ことを特徴とする請求の範囲第16項に記載の監視方法。
Priority Applications (2)
| Application Number | Priority Date | Filing Date | Title |
|---|---|---|---|
| CN201180034000.8A CN103003844B (zh) | 2010-07-12 | 2011-03-09 | 监视系统及监视方法 |
| US13/809,587 US9420236B2 (en) | 2010-07-12 | 2011-03-09 | Monitoring system and monitoring method |
Applications Claiming Priority (2)
| Application Number | Priority Date | Filing Date | Title |
|---|---|---|---|
| JP2010-157668 | 2010-07-12 | ||
| JP2010157668A JP5400718B2 (ja) | 2010-07-12 | 2010-07-12 | 監視システムおよび監視方法 |
Publications (1)
| Publication Number | Publication Date |
|---|---|
| WO2012008176A1 true WO2012008176A1 (ja) | 2012-01-19 |
Family
ID=45469190
Family Applications (1)
| Application Number | Title | Priority Date | Filing Date |
|---|---|---|---|
| PCT/JP2011/055533 Ceased WO2012008176A1 (ja) | 2010-07-12 | 2011-03-09 | 監視システムおよび監視方法 |
Country Status (4)
| Country | Link |
|---|---|
| US (1) | US9420236B2 (ja) |
| JP (1) | JP5400718B2 (ja) |
| CN (1) | CN103003844B (ja) |
| WO (1) | WO2012008176A1 (ja) |
Cited By (5)
| Publication number | Priority date | Publication date | Assignee | Title |
|---|---|---|---|---|
| WO2016061724A1 (zh) * | 2014-10-20 | 2016-04-28 | 中国科学院自动化研究所 | 一种基于深度学习的全天候视频监控方法 |
| CN110262950A (zh) * | 2019-05-21 | 2019-09-20 | 阿里巴巴集团控股有限公司 | 基于多项指标的异动检测方法和装置 |
| CN111008545A (zh) * | 2018-10-08 | 2020-04-14 | 上海申通地铁集团有限公司 | 轨道交通系统的客流的检测系统和方法 |
| WO2025115364A1 (ja) * | 2023-12-01 | 2025-06-05 | 株式会社日立製作所 | 分析システムおよび分析プログラム |
| US12380667B2 (en) | 2020-08-19 | 2025-08-05 | Nec Corporation | Reference state deciding device, state determination system, reference state deciding method, and non-transitory computer readable medium |
Families Citing this family (58)
| Publication number | Priority date | Publication date | Assignee | Title |
|---|---|---|---|---|
| JP2013246490A (ja) * | 2012-05-23 | 2013-12-09 | Nippon Telegr & Teleph Corp <Ntt> | 推定装置、推定方法及びコンピュータプログラム |
| KR102070562B1 (ko) * | 2012-06-19 | 2020-01-30 | 삼성전자주식회사 | 이벤트 기반 이미지 처리 장치 및 그 장치를 이용한 방법 |
| US9794524B2 (en) * | 2013-01-10 | 2017-10-17 | Mitsubishi Electric Corporation | In-vehicle monitoring system and in-vehicle monitoring method |
| US9946921B2 (en) | 2013-04-26 | 2018-04-17 | Nec Corporation | Monitoring device, monitoring method and monitoring program |
| US9946952B2 (en) * | 2013-06-25 | 2018-04-17 | University Of Central Florida Research Foundation, Inc. | Multi-source, multi-scale counting in dense crowd images |
| WO2014207991A1 (ja) | 2013-06-28 | 2014-12-31 | 日本電気株式会社 | 教師データ生成装置、方法、プログラム、および群衆状態認識装置、方法、プログラム |
| JP6405606B2 (ja) * | 2013-07-12 | 2018-10-17 | オムロン株式会社 | 画像処理装置、画像処理方法、および画像処理プログラム |
| US10104394B2 (en) * | 2014-01-31 | 2018-10-16 | Here Global B.V. | Detection of motion activity saliency in a video sequence |
| JP6337544B2 (ja) * | 2014-03-19 | 2018-06-06 | オムロン株式会社 | 画像処理装置、移動速度判定方法、および移動速度判定プログラム |
| FR3020699A1 (fr) * | 2014-04-30 | 2015-11-06 | Centre Nat Rech Scient | Procede de suivi de forme dans une scene observee par un capteur asynchrone de lumiere |
| US10277805B2 (en) * | 2014-05-30 | 2019-04-30 | Hitachi Kokusai Electric Inc. | Monitoring system and camera device |
| WO2015198767A1 (ja) * | 2014-06-27 | 2015-12-30 | 日本電気株式会社 | 異常検知装置及び異常検知方法 |
| US11138443B2 (en) * | 2014-06-30 | 2021-10-05 | Nec Corporation | Guidance processing apparatus and guidance method |
| WO2016002408A1 (ja) * | 2014-06-30 | 2016-01-07 | 日本電気株式会社 | 画像処理装置、監視システム、画像処理方法、及びプログラム |
| JP2016024651A (ja) * | 2014-07-22 | 2016-02-08 | 沖電気工業株式会社 | 状態判定システム、状態判定方法及びプログラム |
| JP6597611B2 (ja) * | 2014-07-25 | 2019-10-30 | 日本電気株式会社 | 画像処理装置、監視システム、画像処理方法、及びプログラム |
| JP6478643B2 (ja) * | 2015-01-09 | 2019-03-06 | キヤノン株式会社 | 情報処理装置、情報処理方法及びプログラム |
| WO2016117401A1 (ja) * | 2015-01-20 | 2016-07-28 | 日立オートモティブシステムズ株式会社 | 車載用カメラ装置 |
| JP6577397B2 (ja) * | 2015-08-27 | 2019-09-18 | 株式会社東芝 | 画像解析装置、画像解析方法、画像解析プログラム、および画像解析システム |
| US10289884B2 (en) | 2015-08-27 | 2019-05-14 | Kabushiki Kaisha Toshiba | Image analyzer, image analysis method, computer program product, and image analysis system |
| JP6806066B2 (ja) * | 2015-09-11 | 2021-01-06 | 日本電気株式会社 | 物体計数装置、物体計数方法、物体計数プログラム、および物体計数システム |
| US9600896B1 (en) * | 2015-11-04 | 2017-03-21 | Mitsubishi Electric Research Laboratories, Inc. | Method and system for segmenting pedestrian flows in videos |
| US10643338B2 (en) * | 2015-12-02 | 2020-05-05 | Mitsubishi Electric Corporation | Object detection device and object detection method |
| KR101766467B1 (ko) | 2016-02-15 | 2017-08-08 | 광주과학기술원 | 이벤트 발생 알림 장치, 이벤트 발생 알림 방법, 및 이벤트 발생 판단 모델 제공 방법 |
| JP2017151875A (ja) * | 2016-02-26 | 2017-08-31 | 三菱電機株式会社 | 滞留判定装置及び滞留判定プログラム |
| CN107229894B (zh) * | 2016-03-24 | 2020-09-22 | 上海宝信软件股份有限公司 | 基于计算机视觉分析技术的智能视频监控方法及系统 |
| JP6609505B2 (ja) * | 2016-04-06 | 2019-11-20 | Kddi株式会社 | 画像合成装置及びプログラム |
| EP3457358B1 (en) | 2016-05-13 | 2026-01-21 | Hitachi, Ltd. | Congestion analysis device, congestion analysis method, and congestion analysis program |
| US10936882B2 (en) | 2016-08-04 | 2021-03-02 | Nec Corporation | People flow estimation device, display control device, people flow estimation method, and recording medium |
| JP6713905B2 (ja) * | 2016-10-20 | 2020-06-24 | 株式会社日立国際電気 | 映像監視システム |
| JP6914699B2 (ja) * | 2017-04-04 | 2021-08-04 | キヤノン株式会社 | 情報処理装置、情報処理方法及びプログラム |
| JP2018186397A (ja) * | 2017-04-26 | 2018-11-22 | キヤノン株式会社 | 情報処理装置、映像監視システム、情報処理方法及びプログラム |
| JP6751691B2 (ja) * | 2017-06-15 | 2020-09-09 | ルネサスエレクトロニクス株式会社 | 異常検出装置及び車両システム |
| JP6935690B2 (ja) * | 2017-07-03 | 2021-09-15 | 富士通株式会社 | 検出プログラム、方法、及び装置 |
| WO2019053789A1 (ja) * | 2017-09-12 | 2019-03-21 | 日本電気株式会社 | 情報処理装置、制御方法、及びプログラム |
| US10509969B2 (en) * | 2017-09-12 | 2019-12-17 | Cisco Technology, Inc. | Dynamic person queue analytics |
| WO2019082318A1 (ja) * | 2017-10-25 | 2019-05-02 | 株式会社ソシオネクスト | 動画像処理装置、動画像処理システム、及び動画像処理方法 |
| JP6947005B2 (ja) * | 2017-12-20 | 2021-10-13 | コニカミノルタ株式会社 | 属性認識装置、属性認識方法、及び機械学習装置 |
| KR101975967B1 (ko) * | 2018-04-10 | 2019-05-07 | 주식회사 이엠따블유 | 열 감지 센서를 이용한 범죄 위험 감지 시스템 및 방법 |
| JP7237499B2 (ja) * | 2018-09-19 | 2023-03-13 | 株式会社東芝 | 画像センサ、センシング方法、制御システム及びプログラム |
| JP6818965B2 (ja) * | 2018-10-30 | 2021-01-27 | 三菱電機株式会社 | 異常検出装置、異常検出プログラム及び異常検出方法 |
| KR102101623B1 (ko) * | 2018-11-16 | 2020-04-17 | 주식회사 에스원 | 영상 정보를 이용하여 이상 상황을 감지하는 방법 및 장치 |
| JP7170574B2 (ja) * | 2019-03-28 | 2022-11-14 | 能美防災株式会社 | 異常検出装置 |
| JP7314645B2 (ja) * | 2019-06-25 | 2023-07-26 | 富士通株式会社 | 物体検出プログラム、物体検出方法、及び、物体検出装置 |
| JP7443002B2 (ja) | 2019-09-13 | 2024-03-05 | キヤノン株式会社 | 画像解析装置、画像解析方法、及びプログラム |
| CN111010546A (zh) * | 2019-12-20 | 2020-04-14 | 浙江大华技术股份有限公司 | 监控预置点的调整方法、装置及存储介质 |
| WO2021156907A1 (ja) * | 2020-02-03 | 2021-08-12 | 日本電気株式会社 | 流量情報出力装置、制御方法、及びプログラム |
| CN111401220B (zh) * | 2020-03-12 | 2021-03-19 | 重庆特斯联智慧科技股份有限公司 | 一种用于智慧安防的人群聚合特征分析方法和系统 |
| JP6880338B1 (ja) * | 2020-04-06 | 2021-06-02 | 三菱電機株式会社 | フィルタ、空気調和機およびフィルタの製造方法 |
| CN111539301B (zh) * | 2020-04-20 | 2023-04-18 | 贵州安防工程技术研究中心有限公司 | 一种基于视频分析技术的场景混乱程度判别方法 |
| CA3119583A1 (en) * | 2020-05-25 | 2021-11-25 | PatriotOne Technologies | System and method for multi-sensor threat detection platform |
| JP2022086742A (ja) * | 2020-11-30 | 2022-06-09 | 株式会社 日立産業制御ソリューションズ | 映像解析サーバ、映像解析方法、および、映像解析プログラム |
| CN112669601B (zh) * | 2020-12-16 | 2022-04-15 | 阿波罗智联(北京)科技有限公司 | 交通溢流检测方法、装置、电子设备及路侧设备 |
| JP2022114383A (ja) * | 2021-01-26 | 2022-08-05 | 株式会社東芝 | 監視装置および監視方法 |
| JP2022138975A (ja) * | 2021-03-11 | 2022-09-26 | 株式会社日立国際電気 | 群衆検知システム |
| CN114170629A (zh) * | 2021-12-01 | 2022-03-11 | 贵州师范学院 | 一种基于视觉的摔倒检测方法及监测预警系统 |
| CN114677638B (zh) * | 2022-03-16 | 2024-04-05 | 西安电子科技大学广州研究院 | 一种基于深度学习和聚类人群异常聚集的检测方法 |
| JP7730782B2 (ja) * | 2022-04-11 | 2025-08-28 | 株式会社日立製作所 | レーン形成判定装置および方法 |
Citations (6)
| Publication number | Priority date | Publication date | Assignee | Title |
|---|---|---|---|---|
| JP2006099241A (ja) * | 2004-09-28 | 2006-04-13 | Ntt Data Corp | 異常検知装置、異常検知方法および異常検知プログラム |
| WO2006080367A1 (ja) * | 2005-01-28 | 2006-08-03 | Olympus Corporation | 粒子群運動解析システム、粒子群運動解析方法及びプログラム |
| JP2007243342A (ja) * | 2006-03-06 | 2007-09-20 | Yokogawa Electric Corp | 画像監視装置及び画像監視システム |
| JP2008269063A (ja) * | 2007-04-17 | 2008-11-06 | Softopia Japan Foundation | 多重分割画像を用いた異常動作検出装置、異常動作検出方法及び異常動作検出用プログラム |
| JP2010079655A (ja) * | 2008-09-26 | 2010-04-08 | Canon Inc | 画像処理装置及び画像処理方法及び撮像装置及びプログラム |
| JP2010225118A (ja) * | 2009-03-25 | 2010-10-07 | Toshiba Corp | 画像処理装置、方法及びプログラム |
Family Cites Families (20)
| Publication number | Priority date | Publication date | Assignee | Title |
|---|---|---|---|---|
| KR100415313B1 (ko) * | 2001-12-24 | 2004-01-16 | 한국전자통신연구원 | 동영상에서 상관 정합과 시스템 모델을 이용한 광류와카메라 움직임 산출 장치 |
| JP2006085366A (ja) * | 2004-09-15 | 2006-03-30 | Oki Electric Ind Co Ltd | 速度分布分析装置 |
| KR100738522B1 (ko) * | 2004-12-21 | 2007-07-11 | 삼성전자주식회사 | 비디오 감시 시스템에서 카메라/물체 움직임 구분 및 객체추출 장치 및 그 방법 |
| WO2006068223A1 (ja) * | 2004-12-24 | 2006-06-29 | National University Corporation Yokohama National University | 画像処理装置 |
| US20080166020A1 (en) * | 2005-01-28 | 2008-07-10 | Akio Kosaka | Particle-Group Movement Analysis System, Particle-Group Movement Analysis Method and Program |
| US7804980B2 (en) * | 2005-08-24 | 2010-09-28 | Denso Corporation | Environment recognition device |
| JP4740723B2 (ja) * | 2005-11-28 | 2011-08-03 | 富士通株式会社 | 画像解析プログラム、該プログラムを記録した記録媒体、画像解析装置、および画像解析方法 |
| WO2007114305A1 (ja) * | 2006-03-31 | 2007-10-11 | National University Corporation Kyoto Institute Of Technology | 画像処理装置、およびそれを備えた超音波撮像装置、並びに画像処理方法 |
| JP4919036B2 (ja) * | 2007-01-30 | 2012-04-18 | アイシン精機株式会社 | 移動物体認識装置 |
| JP5192701B2 (ja) * | 2007-01-30 | 2013-05-08 | パナソニック株式会社 | 人体検出装置 |
| WO2008099399A2 (en) * | 2007-02-14 | 2008-08-21 | Technion Research And Development Foundation Ltd. | Over-parameterized variational optical flow method |
| US7659967B2 (en) * | 2007-03-05 | 2010-02-09 | Geoffrey Louis Barrows | Translational optical flow sensor |
| EP2179398B1 (en) * | 2007-08-22 | 2011-03-02 | Honda Research Institute Europe GmbH | Estimating objects proper motion using optical flow, kinematics and depth information |
| JP4883415B2 (ja) * | 2007-09-27 | 2012-02-22 | サクサ株式会社 | 監視装置及びプログラム |
| JP4966820B2 (ja) * | 2007-10-29 | 2012-07-04 | パナソニック株式会社 | 混雑推定装置および方法 |
| US8195598B2 (en) * | 2007-11-16 | 2012-06-05 | Agilence, Inc. | Method of and system for hierarchical human/crowd behavior detection |
| US8686326B1 (en) * | 2008-03-26 | 2014-04-01 | Arete Associates | Optical-flow techniques for improved terminal homing and control |
| US8946606B1 (en) * | 2008-03-26 | 2015-02-03 | Arete Associates | Determining angular rate for line-of-sight to a moving object, with a body-fixed imaging sensor |
| US8977665B2 (en) * | 2009-05-27 | 2015-03-10 | Prioria Robotics, Inc. | Fault-aware matched filter and optical flow |
| US8564657B2 (en) * | 2009-05-29 | 2013-10-22 | Honda Research Institute Europe Gmbh | Object motion detection system based on combining 3D warping techniques and a proper object motion detection |
-
2010
- 2010-07-12 JP JP2010157668A patent/JP5400718B2/ja not_active Expired - Fee Related
-
2011
- 2011-03-09 US US13/809,587 patent/US9420236B2/en not_active Expired - Fee Related
- 2011-03-09 WO PCT/JP2011/055533 patent/WO2012008176A1/ja not_active Ceased
- 2011-03-09 CN CN201180034000.8A patent/CN103003844B/zh not_active Expired - Fee Related
Patent Citations (6)
| Publication number | Priority date | Publication date | Assignee | Title |
|---|---|---|---|---|
| JP2006099241A (ja) * | 2004-09-28 | 2006-04-13 | Ntt Data Corp | 異常検知装置、異常検知方法および異常検知プログラム |
| WO2006080367A1 (ja) * | 2005-01-28 | 2006-08-03 | Olympus Corporation | 粒子群運動解析システム、粒子群運動解析方法及びプログラム |
| JP2007243342A (ja) * | 2006-03-06 | 2007-09-20 | Yokogawa Electric Corp | 画像監視装置及び画像監視システム |
| JP2008269063A (ja) * | 2007-04-17 | 2008-11-06 | Softopia Japan Foundation | 多重分割画像を用いた異常動作検出装置、異常動作検出方法及び異常動作検出用プログラム |
| JP2010079655A (ja) * | 2008-09-26 | 2010-04-08 | Canon Inc | 画像処理装置及び画像処理方法及び撮像装置及びプログラム |
| JP2010225118A (ja) * | 2009-03-25 | 2010-10-07 | Toshiba Corp | 画像処理装置、方法及びプログラム |
Cited By (5)
| Publication number | Priority date | Publication date | Assignee | Title |
|---|---|---|---|---|
| WO2016061724A1 (zh) * | 2014-10-20 | 2016-04-28 | 中国科学院自动化研究所 | 一种基于深度学习的全天候视频监控方法 |
| CN111008545A (zh) * | 2018-10-08 | 2020-04-14 | 上海申通地铁集团有限公司 | 轨道交通系统的客流的检测系统和方法 |
| CN110262950A (zh) * | 2019-05-21 | 2019-09-20 | 阿里巴巴集团控股有限公司 | 基于多项指标的异动检测方法和装置 |
| US12380667B2 (en) | 2020-08-19 | 2025-08-05 | Nec Corporation | Reference state deciding device, state determination system, reference state deciding method, and non-transitory computer readable medium |
| WO2025115364A1 (ja) * | 2023-12-01 | 2025-06-05 | 株式会社日立製作所 | 分析システムおよび分析プログラム |
Also Published As
| Publication number | Publication date |
|---|---|
| US9420236B2 (en) | 2016-08-16 |
| CN103003844A (zh) | 2013-03-27 |
| JP2012022370A (ja) | 2012-02-02 |
| CN103003844B (zh) | 2016-01-06 |
| US20130113934A1 (en) | 2013-05-09 |
| JP5400718B2 (ja) | 2014-01-29 |
Similar Documents
| Publication | Publication Date | Title |
|---|---|---|
| JP5400718B2 (ja) | 監視システムおよび監視方法 | |
| AU2012340862B2 (en) | Geographic map based control | |
| US8121424B2 (en) | System, computer program product and associated methodology for video motion detection using spatio-temporal slice processing | |
| JP2017191501A (ja) | 情報処理装置、情報処理方法及びプログラム | |
| Xu et al. | Dynamic obstacle detection based on panoramic vision in the moving state of agricultural machineries | |
| CN102087746A (zh) | 图像处理装置、图像处理方法和程序 | |
| JP4613230B2 (ja) | 移動物体監視装置 | |
| CN107480653A (zh) | 基于计算机视觉的客流量检测方法 | |
| CN103489012B (zh) | 一种基于支持向量机的人群密集度检测方法及系统 | |
| Chen et al. | A Cost-Effective People-Counter for a Crowd of Moving People Based on Two-Stage Segmentation. | |
| CN105930814A (zh) | 基于视频监控平台的人员异常聚集行为的检测方法 | |
| KR101125936B1 (ko) | 엘리베이터 보안을 위한 지능형 영상 감시시스템 및 그 방법 | |
| KR20100093797A (ko) | 카메라의 영상을 이용한 보행자 계수 방법 및 장치 | |
| CN104657975B (zh) | 一种视频图像横向条纹扰动检测的方法 | |
| Lee et al. | Crowd behavior representation using motion influence matrix for anomaly detection | |
| Tsai et al. | Design of fall detection system using computer vision technique | |
| US10916016B2 (en) | Image processing apparatus and method and monitoring system | |
| CN119205839A (zh) | 一种基于大数据的监控图像处理系统及方法 | |
| AlGhamdi et al. | Automatic motion tracking of a human in a surveillance video | |
| Yogameena et al. | Ma-Th algorithm for people count in a dense crowd and their behaviour classification | |
| Sehairi et al. | A Real-Time Implementation of Moving Object Action Recognition System Based on Motion Analysis | |
| JP2017220020A (ja) | 動体検知システム及び動体検知方法 | |
| Ji et al. | Design and implementation of smoke early warning system based on video analysis technology | |
| Zhao et al. | Monitoring the safety operations of escalators using a multi-level fusion network | |
| Miyahara et al. | A study on intelligent security camera for crime scene detection |
Legal Events
| Date | Code | Title | Description |
|---|---|---|---|
| WWE | Wipo information: entry into national phase |
Ref document number: 201180034000.8 Country of ref document: CN |
|
| 121 | Ep: the epo has been informed by wipo that ep was designated in this application |
Ref document number: 11806509 Country of ref document: EP Kind code of ref document: A1 |
|
| WWE | Wipo information: entry into national phase |
Ref document number: 13809587 Country of ref document: US |
|
| NENP | Non-entry into the national phase |
Ref country code: DE |
|
| 122 | Ep: pct application non-entry in european phase |
Ref document number: 11806509 Country of ref document: EP Kind code of ref document: A1 |