WO2011027564A1 - 視差算出方法、および視差算出装置 - Google Patents
視差算出方法、および視差算出装置 Download PDFInfo
- Publication number
- WO2011027564A1 WO2011027564A1 PCT/JP2010/005416 JP2010005416W WO2011027564A1 WO 2011027564 A1 WO2011027564 A1 WO 2011027564A1 JP 2010005416 W JP2010005416 W JP 2010005416W WO 2011027564 A1 WO2011027564 A1 WO 2011027564A1
- Authority
- WO
- WIPO (PCT)
- Prior art keywords
- point
- evaluation value
- value distribution
- corresponding point
- reference point
- Prior art date
Links
Images


Classifications
-
- G—PHYSICS
- G08—SIGNALLING
- G08G—TRAFFIC CONTROL SYSTEMS
- G08G1/00—Traffic control systems for road vehicles
- G08G1/16—Anti-collision systems
- G08G1/168—Driving aids for parking, e.g. acoustic or visual feedback on parking space
-
- G—PHYSICS
- G01—MEASURING; TESTING
- G01S—RADIO DIRECTION-FINDING; RADIO NAVIGATION; DETERMINING DISTANCE OR VELOCITY BY USE OF RADIO WAVES; LOCATING OR PRESENCE-DETECTING BY USE OF THE REFLECTION OR RERADIATION OF RADIO WAVES; ANALOGOUS ARRANGEMENTS USING OTHER WAVES
- G01S11/00—Systems for determining distance or velocity not using reflection or reradiation
- G01S11/12—Systems for determining distance or velocity not using reflection or reradiation using electromagnetic waves other than radio waves
-
- G—PHYSICS
- G06—COMPUTING; CALCULATING OR COUNTING
- G06T—IMAGE DATA PROCESSING OR GENERATION, IN GENERAL
- G06T7/00—Image analysis
- G06T7/50—Depth or shape recovery
- G06T7/55—Depth or shape recovery from multiple images
- G06T7/593—Depth or shape recovery from multiple images from stereo images
-
- G—PHYSICS
- G08—SIGNALLING
- G08G—TRAFFIC CONTROL SYSTEMS
- G08G1/00—Traffic control systems for road vehicles
- G08G1/16—Anti-collision systems
-
- G—PHYSICS
- G08—SIGNALLING
- G08G—TRAFFIC CONTROL SYSTEMS
- G08G1/00—Traffic control systems for road vehicles
- G08G1/16—Anti-collision systems
- G08G1/165—Anti-collision systems for passive traffic, e.g. including static obstacles, trees
-
- H—ELECTRICITY
- H04—ELECTRIC COMMUNICATION TECHNIQUE
- H04N—PICTORIAL COMMUNICATION, e.g. TELEVISION
- H04N13/00—Stereoscopic video systems; Multi-view video systems; Details thereof
- H04N13/20—Image signal generators
-
- G—PHYSICS
- G06—COMPUTING; CALCULATING OR COUNTING
- G06T—IMAGE DATA PROCESSING OR GENERATION, IN GENERAL
- G06T2207/00—Indexing scheme for image analysis or image enhancement
- G06T2207/30—Subject of image; Context of image processing
- G06T2207/30248—Vehicle exterior or interior
- G06T2207/30252—Vehicle exterior; Vicinity of vehicle
- G06T2207/30261—Obstacle
Definitions
- the present invention is a method of calculating parallax by stereo matching using an on-vehicle stereo camera for measuring distance and detecting a vehicle in front of the host vehicle or one existing in a road environment such as a pedestrian, a wall, a fence or an embedment. And the field of equipment.
- corresponding points corresponding to respective points of reference image data which are stereo image data captured by one lens, of stereo image data captured by a stereo camera equipped with two lenses, of stereo image data
- the search is performed from a search area of reference image data which is stereo image data captured by the other lens.
- a determination method of corresponding points a small area is extracted centering on a reference point which is each point of reference image data, and the extracted small area is compared with the small area in the search area, and the image luminance pattern of each small area
- the evaluation values such as sum of absolute differences (SAD), sum of squared differences (SSD), normalized cross correlation (NCC), and the like of image brightness
- SAD sum of absolute differences
- SSD sum of squared differences
- NCC normalized cross correlation
- the object to be measured includes an object including a continuous similar pattern such as a pedestrian crossing, a fence, or the like in which a bar-like or rectangular pattern is repeated, corresponding points in SAD, SSD, NCC. Is calculated, and it is difficult in principle to calculate the correct corresponding point.
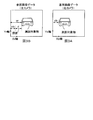
- FIG. 12 shows a conventional stereo matching method described in Patent Document 2. As shown in FIG.
- a stereo image data acquisition unit 1202 generates reference image data captured by one lens and a reference image captured by the other lens as a pair of image data captured simultaneously by a stereo camera equipped with two lenses. Get data and
- the stereo matching unit 1203 calculates the difference in image brightness between each point in the reference image data and the search point in the search area of the reference image data by SAD, and sets the set of similarities in the search area as the evaluation value distribution. calculate.
- the corresponding point candidate plural existence determination unit 1204 determines whether or not a plurality of corresponding point candidates exist from the evaluation value distribution.
- the evaluation value minimum corresponding point calculation unit 1205 calculates, as the corresponding point candidate, a search point at which the evaluation value which is the difference degree of the image luminance is minimized with respect to the reference point determined that the plurality of corresponding point candidates do not exist.
- the control mode data acquisition unit 1206 acquires control mode data representing a mode of the control mode.
- the control mode corresponding point calculation unit 1207 selects the corresponding point candidate with the longest distance when the control mode is the pre-crash control with respect to the reference points determined to have a plurality of corresponding point candidates, and the control mode is the inter-vehicle In the case of control, the closest corresponding point candidate is selected, and in the case where the control mode is parking assist control, the closest corresponding point candidate is selected.
- the disparity data output unit 1208 substitutes the corresponding point with the minimum evaluation value for the reference point determined that the plurality of corresponding point candidates do not exist, and the reference point determined that the plurality of corresponding transfer candidates exist In other words, the parallax data for the reference image is calculated by substituting corresponding points selected according to the control mode.
- the control mode determines the position of the corresponding point.
- the distance between continuous similar patterns included in an object located at a distance of 5.7 m from the own vehicle is 10 cm
- the distance between two lenses constituting a stereo camera is Assuming that the base length is 0.12 m and the focal length of the camera is 1000 pixels, a plurality of corresponding point candidates with parallaxes of 5, 21 and 37 are calculated because the local pattern position in the search area is minimized. .
- the brake control is performed even if there is precrash control of the control mode. May not work well.
- the control mode is the inter-vehicle control, there is a possibility that the vehicle does not decelerate sufficiently, and when the control mode is the parking assist control, it may be difficult to park in an appropriate place.
- An object of the present invention is to provide a parallax calculation method and apparatus for calculating correct parallax even when there is an object including a continuous similar pattern.
- a disparity calculating apparatus includes a first imaging system and a second imaging system, and data of a reference image obtained by imaging an object using the first imaging system, and an object A difference in image brightness between a stereo image data acquisition unit for acquiring data of a reference image captured using the second imaging system, a reference point of the reference image, and a plurality of search points of the reference image
- a search point having a minimum evaluation value is detected from a stereo matching unit that calculates an evaluation value distribution indicating a degree and a search point included in the evaluation value distribution, and detection is performed when the number of detected search points is more than one.
- An evaluation value map calculation unit that calculates an evaluation value map indicating a relationship between coordinate variation values of the first reference point and the second reference point and a plurality of corresponding point candidates based on the value distribution;
- a corresponding point determination unit that determines a corresponding point candidate having the smallest coordinate variation value as the corresponding point, and a difference between a coordinate point in the reference image of the corresponding point and a coordinate point in the reference image of the first reference point
- a parallax data output unit that outputs
- the range of the peripheral region is determined based on the number of search points at which the evaluation value included in the minimum value distribution of the first reference point becomes minimum and the interval. It is.
- the size of each object can be calculated with higher accuracy when there are a plurality of objects including continuous similar patterns in the reference image and the distances between the objects are different.
- the corresponding point determination unit determines that the number of corresponding point candidates for the first reference point is different from the number of corresponding point candidates for the second reference point
- the corresponding points are determined except for the corresponding point candidates included only in any of the first reference point and the minimum value distribution according to the second reference point.
- the load of information processing applied to the disparity calculation apparatus can be reduced, and correct disparity can be calculated.
- the corresponding point determination unit performs the Hough transform on the evaluation value map to extract a corresponding point candidate having the smallest coordinate variation value as a corresponding point. It is a thing.
- the first imaging system includes the first lens
- the second imaging system includes the second lens
- the peripheral region is the first lens.
- the evaluation value map calculation unit determines the first evaluation value distribution, the second evaluation value distribution, and the reference existing in the peripheral area.
- the evaluation value map is calculated based on the local minimum value distribution corresponding to the third reference point existing in the direction perpendicular to the arrangement direction of the first lens and the second lens with respect to the point. is there.
- the range of the peripheral region is a plurality of searches for the evaluation value distribution corresponding to the first reference point and the evaluation value distribution corresponding to the second reference point It is determined based on the sum of differences in the degree of difference in image brightness corresponding to a point.
- data of a reference image obtained by imaging an object using a first imaging system, and a reference image obtained by imaging an object using a second imaging system The evaluation value distribution indicating the degree of difference in image brightness between the reference point of the reference image and the plurality of search points of the reference image is calculated, and the search points included in the evaluation value distribution are A search point at which the evaluation value is minimized is detected, and when there are a plurality of detected search points, a plurality of detected search points are output as corresponding point candidates, and an evaluation value distribution including the corresponding point candidates Is a local minimum distribution showing coordinate distribution of corresponding point candidates, and is present in a first local minimum distribution corresponding to a first reference point, and in a peripheral region of a reference image including the first reference point, Calculating a second minimum value distribution corresponding to a plurality of second reference points; Based on the minimum value distribution and the second minimum value distribution, an evaluation value map indicating the relationship between coordinate variation values of the first and second reference points
- the corresponding point candidate having the smallest coordinate variation value is determined as the corresponding point, and the parallax value which is the difference between the coordinate point in the reference image of the corresponding point and the coordinate point in the reference image of the first reference point It is an output.
- corresponding points in comparison in a small area not only corresponding points in comparison in a small area but also comparative information on peripheral areas is added to determine corresponding points, so that continuous similarity which is difficult to calculate in stereo matching Since correct parallax can be calculated for an object including an image pattern, and distances such as guard rails often present in traffic environments and fences present in many parking lots can be stably measured, control of own vehicle, alarm, etc. Can also work properly.
- FIG. 1 shows the block configuration of the parallax calculation apparatus in Embodiment 1 of this invention.
- Diagram showing processing flow of disparity calculation method Diagram showing the position of objects in stereo images Diagram for explaining the evaluation value distribution for each reference point in an arbitrary range of the reference image Diagram for explaining the evaluation value distribution for each reference point in an arbitrary range of the reference image Diagram for explaining the evaluation value distribution for each reference point in an arbitrary range of the reference image
- a schematic diagram showing the procedure for calculating the evaluation value map A schematic diagram showing the relationship between the minimum value distribution in the case where the number of minimum values in Hm (xbn) is different from the number of minimum values in Hm (xb1)
- a schematic diagram showing an example of an object of a fence reflected in a reference image and an obtained evaluation value map Schematic diagram showing superposition of evaluation value distributions in the
- FIG. 1 is a block diagram of disparity calculation apparatus 100 according to Embodiment 1 of the present invention.
- the disparity calculating apparatus 100 illustrated in FIG. 1 is configured to include a disparity calculating unit 101, a stereo image data obtaining unit 102, and a disparity data output unit 103.
- the parallax calculation unit 101 includes the stereo matching unit 104, the corresponding point candidate number determination unit 105, the minimum value distribution calculation unit 106, the evaluation value map calculation unit 107, and the corresponding point determination unit 108. is there.
- the disparity calculating unit 101 performs disparity calculation based on the stereo image obtained by the stereo image data obtaining unit 102, and the disparity data output unit 103 outputs disparity data.
- FIG. 2 is a process flowchart of the disparity calculating method of the disparity calculating apparatus 100 shown in FIG.
- the parallax calculation method and the parallax calculation apparatus according to the first embodiment will be described.
- the stereo image data acquisition unit 102 acquires a pair of stereo image data simultaneously captured by a stereo camera equipped with two lenses arranged side by side (S201).
- the stereo image data includes data of a reference image which is data of a reference image photographed by one lens, and reference image data which is data of a reference image photographed by the other lens.
- the stereo camera has been described as a camera equipped with two lenses arranged side by side, the present invention is not limited to this, and two cameras can be substituted.
- FIG. 3 shows stereo images in the case where the object to be measured is a front vehicle body
- FIG. 3A shows a reference image
- FIG. 3B shows a reference image.
- an image taken by the right lens toward the object to be measured is referred to as the reference image and the left lens.
- the photographed image will be described as a reference image.
- the position of the distance measurement target photographed in the reference image is shifted to the right as compared with the position of the distance measurement target photographed in the reference image.
- This shift is parallax, and changes with the distance of the object to be measured.
- the parallax d of the left end of the ranging object is the difference between the coordinate positions And xr-xb.
- Lens distortion can be corrected by a method that performs distortion correction using a correction conversion table that uses lens design values, or a method that performs correction by parameter estimation using a radial distortion model. Can be implemented in any way that corrects, not limiting of the invention.
- the collimation correction of the optical axis can be realized by any method for collimating the optical axis of the stereo camera, and does not limit the present invention.
- the parallelization correction may be performed also by a method of installing a grid pattern in the common field of view of the stereo camera, calculating the relative relationship of the stereo camera from the correlated grid point position, and performing the parallelization correction of the optical axis. it can.
- the parallax calculating unit 101 causes the stereo matching unit 104 to perform stereo matching between the reference image and the reference image acquired by the stereo image data acquisition unit 102 (S202).
- the stereo matching unit 104 determines the image brightness of each reference point included in an arbitrary range of each reference image and a search point included in a search area including a coordinate point corresponding to the reference point of the reference image in the reference image. An evaluation value distribution indicating the degree of difference is calculated.
- the search area is an area having an arbitrary range.
- the calculated evaluation value distribution for each reference point is recorded in a memory incorporated in the stereo matching unit 104.
- the corresponding point candidate number determination unit 105 determines whether or not there are a plurality of corresponding point candidates for which the evaluation value is minimized in the evaluation value distribution of each reference point (S203).
- the parallax data output unit 103 determines the corresponding point candidate position and the coordinate point identical to the reference value in the reference image for the reference point determined to have only one corresponding point candidate. And the difference between the coordinate point located at the position of Then, the parallax data output unit 103 outputs the parallax data (S208).
- the local minimum value distribution calculation unit 106 calculates the corresponding point candidate for which the evaluation value is minimized in the evaluation value distribution, for the reference points determined to have multiple corresponding point candidates. , Minimum value distribution is calculated (S204).
- the evaluation value map calculation unit 107 calculates an evaluation value map (S205).
- the evaluation value map is based on the minimum value distribution of the reference point determined to have a plurality of corresponding point candidates and the minimum value distribution of another reference point located in the peripheral area including the reference point in the reference image. It is a map which shows the fluctuation value for every corresponding point candidate of the parallax value of each corresponding point candidate to each reference point.
- the corresponding point determination unit 108 extracts line segments that are most linearly continuous in the evaluation value map (S206), and determines the coordinate points of the extracted corresponding point candidates as corresponding points (S207).
- the stereo matching unit 104 performs stereo matching between the reference image and the reference image. That is, an evaluation value indicating the degree of difference in image brightness between each reference point included in an arbitrary range of the reference image and each search point in the search area including the same coordinate point as each reference point in the reference image The distribution is calculated (S202).
- the range of the search area is arbitrary, and is determined by geometrical parameters including the range of the measured object distance, the baseline length of the stereo camera, and the focal distance of the camera.
- FIG. 4 shows a reference image when calculating the evaluation value distribution
- FIG. 4B shows a reference image
- FIG. 4C shows the evaluation value distribution for each reference point in an arbitrary range of the reference image. It is.
- the calculation procedure of the evaluation value distribution for the reference point will be described.
- an arbitrary range of the reference image is described as a partial range as illustrated, but may be the entire range.
- the coordinates of the reference point for calculating the evaluation value distribution are (xb1, yb1)
- the stereo image data is described as being subjected to parallelization correction.
- the Y coordinate of the object in the reference image is the same as the Y coordinate of the object in the reference image.
- FIG. 4 the area shown by a square is one pixel, and one pixel is a reference point. The same applies to the following description of the drawings.
- the search area is an area having a constant width on the Yr axis, that is, in the lateral direction, in the reference image.
- the search area is in the lateral direction of the reference image because the stereo camera arranges the lenses in the lateral direction.
- the range of the search point on the reference image is (xb1, yb1) which is the coordinates of the reference point on the reference image
- the range of the search point on the reference image is the minimum value / maximum value of the distance for distance measurement necessary for the application.
- the search width determined based on R is (xr1, yr1), (xr1 + 1, yr1), (xr1 + 2, yr1),..., (Xr1 + R, yr1).
- the coordinates (xb1, yb1) on the reference image and the coordinates (xr1, yr1) on the reference image have the same coordinate position on the image.
- the D axis is obtained by shifting the origin of the Xr axis to the position of xb1, D axis, Xb
- Each of the dimensions of the axis and the Xr axis is a pixel.
- stereo image data is described as being subjected to parallelization correction, but when stereo image data is not subjected to parallelization correction, the stereo image can not be vertically aligned. Since the point of the distance measurement object photographed at the reference point (xb1, yb1) of the reference image is not photographed at the same Y coordinate as the Y coordinate of the coordinate of the reference point in the reference image, the Y axis of the reference point It is set as a search area including orientation alignment.
- the evaluation value distribution H (xb1) obtained by stereo matching is a one-dimensional distribution in which the horizontal axis is the D axis and the vertical axis is the degree of difference in image brightness between the reference point and the search point.
- the difference in image brightness between the 8 ⁇ 8 small area centered on the reference point and the 8 ⁇ 8 small area centered on each search point Use SAD).
- the degree of difference in image luminance used as an evaluation value can be replaced with any degree of difference, such as the sum of squared differences (SSD), that minimizes when the values completely match.
- SSD sum of squared differences
- NCC normalized correlation
- the above process is performed for each reference point, and the calculated evaluation value distribution for each reference point is stored in a memory incorporated in the stereo matching unit 104.
- the corresponding point candidate number determination unit 105 searches for a minimum value in the evaluation value distribution H (xb1).
- the search point having the minimum evaluation value is determined as the corresponding point (S203: No), and the corresponding point candidate position is determined. Recording is performed as the disparity value of the reference point, and disparity data is output (S208).
- FIG. 5 shows the case where the object to be measured is a vehicle body located forward
- FIG. 5A shows a reference image
- FIG. 5B shows a reference image
- FIG. 5C shows an evaluation value distribution.
- FIG. 5C in the case where the object is not an object including a continuous similar pattern like a car body, a small region including the reference point (xb1, yb1) and a corresponding point candidate having the same image brightness are shown on FIG. There is only one in.
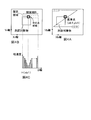
- FIG. 6 shows the case where the object to be measured is a fence located forward
- FIG. 6A shows a reference image
- FIG. 6B shows a reference image
- FIG. 6C shows an evaluation value distribution
- corresponding point candidates having the same image brightness as the reference point (xb1, yb1) in the reference image are displayed on the reference screen as shown in FIG. 6C. There are multiple.
- the method of determining whether or not there are a plurality of corresponding point candidates calculates the minimum value of the evaluation value distribution, and determines based on how many minimum values exist, etc.
- One-dimensional distribution, cyclic distribution It is also possible to implement other methods of determining whether or not
- the local minimum value distribution calculation unit 106 when multiple local minimum values are detected in the evaluation value distribution as a result of the corresponding point candidate number determination unit 105 searching for local minimum values, coordinates of corresponding point candidates for which the evaluation value becomes local minimum It extracts and the minimum value distribution Hm (xb1) which shows only distribution of minimum values is calculated (S204).
- the evaluation value distribution H (xb1) is a distribution having local minima at a plurality of positions as shown in FIG. 6C.
- the minimum value distribution calculation unit 106 calculates a distribution obtained by extracting only the positions of a plurality of minimum values in the evaluation value distribution H (xb1), and as shown in FIG. 6D, at the position of the minimum value of the calculated evaluation value distribution. Substituting the value of -1 and the value of 0 at other positions, the minimum value distribution Hm (xb1) is calculated.
- the position of the minimum value of the minimum value distribution Hm (xb1) shown in FIG. 6D indicates the position of the corresponding point candidate in the reference image with the left end of the search area for the reference point (xb1, yb1) as the origin. .
- the constant of the position of the minimum value used when calculating the minimum value distribution and the value of the constant of the other positions are merely examples, and the present invention is not limited thereto.
- a predetermined threshold value is provided on the evaluation value axis, and search points having the predetermined threshold values below are set as corresponding point candidates. It may be This makes it possible to exclude from the corresponding point candidates search points that are search points having a high degree of difference and become minimum points, and can improve the determination accuracy of the corresponding point candidates.
- FIG. 7 shows the minimum value distribution Hm (xb1) of the reference points (xb1, yb1) in which a plurality of corresponding point candidates exist, and another reference point (xb2, yb1) adjacent to the reference points (xb1, yb1) in the reference image.
- Hm (xb2) of yb2 7A shows the reference image
- FIG. 7B shows the reference image
- FIG. 7C shows the minimum value distribution Hm (xb1) of the reference points (xb1, yb1)
- FIG. 7D shows the minimum values of the reference points (xb2, yb2) Distribution Hm (xb2) is shown
- FIG. 7E shows corresponding point candidates for the reference point (xb1, yb1) in the reference image shown in FIG. 7B and corresponding point candidates for the reference point (xb2, yb2).
- the relationship between the minimum value distribution of the reference point (xb1, yb1) and the reference point (xb2, yb2) adjacent to the reference point will be described below.
- the corresponding point candidates for the reference points (xb1, yb1) shown in FIGS. 7A and 7E are the corresponding point candidate 1 shown in FIG. 7B to the corresponding point candidates 4 and the reference points (xb2 shown in FIGS. 7A and 7E).
- Yb 2) are described as the corresponding point candidate 5 to the corresponding point candidate 8 shown in FIG. 7B.
- corresponding point candidates 1 to 4 are indicated by dotted lines.
- the reference points (xb2, yb2) are selected as reference points adjacent to the reference points (xb1, yb1).
- the search area for the reference point (xb2, yb2) shown in FIG. 7B is an area shifted to the Xr axis by the difference between xb2 and xb1 with respect to the search area for the reference point (xb1, yb1).
- corresponding points with respect to the reference point (xb2, yb2) are shifted from the coordinates of the corresponding point candidate 3 with respect to the reference point (xb1, yb1) by the difference between xb2 and xb1 on the Xr axis. Since the candidates 7 are present and the distances of the points imaged at adjacent reference points are considered to be approximately equal, it means that each corresponding point candidate is likely to be a correct corresponding point.
- the corresponding point candidate 5 for the reference point (xb2, yb2) is at a position shifted on the Xr axis by the difference between xb2 and xb1 from the coordinates of the corresponding point candidate 1 for the reference point (xb1, yb1) in FIG. 7E. Since it does not exist, it means that the corresponding point candidate is not a correct corresponding point.
- the areas of the corresponding point candidate 3 and the corresponding point candidate 7 are the positions of the corresponding points and the correct parallax, and the areas of the corresponding point candidate 1 and the corresponding point candidate 5 are the positions of the correct corresponding points It does not mean that.
- the evaluation value map calculation unit 107 calculates a reference point (xb1, yb1) for which the minimum value distribution has been calculated by the minimum value distribution calculation unit 106, and a position or a plurality of positions in the peripheral region of the reference point xb1 in the reference image.
- An evaluation value map is calculated based on the minimum value distribution with another reference point xbn (n: natural number) (S205).
- the peripheral region is a region including the reference points (xb1, yb1) in the reference image and having an arbitrary width in the Yb axis direction.
- each reference point included in the peripheral area is an area having the same Yb coordinate.
- the peripheral region is set to the horizontal direction in the reference image because setting the search region to the horizontal direction of the reference image with respect to each reference point has the possibility of erroneously detecting a similar pattern in the horizontal direction. .
- the reason why the search area is in the horizontal direction of the reference image is because the stereo cameras are arranged in the horizontal direction.
- the search area is in the vertical direction of the reference image.
- the peripheral area in the reference image also becomes vertical.
- FIG. 8 shows the minimum value distribution Hm (xb1) of the reference point (xb1, yb1) and the minimum value of each reference point (xbn, ybn) (n: natural number) located in the peripheral area of the reference point (xb1, yb1)
- FIG. 8A shows a reference image
- FIG. 8B shows a reference image
- FIG. 8C shows the relationship between the minimum value distribution Hm (xbn) of each reference point (xbn, ybn)
- FIG. 8D shows a reference point (xbn, ybn)
- the evaluation value map calculated by superimposing the minimum value distribution of is shown.
- a method of calculating the evaluation value map shown in FIG. 8 will be described.
- the evaluation value map M (D, Xb) aligns the D axes of the respective minimum value distributions Hm (xbn) (n is an integer from 1 to 4) shown in FIG. 8C, and corresponds to each corresponding point candidate on the D axis with respect to the Xb axis.
- the variation value that is, the variation value of the disparity value is indicated by a line with respect to the Xb axis.
- the dimension of the Xb axis is increased, and the positions of corresponding point candidates are processed as a three-dimensional distribution.
- the evaluation value map M (D, Xb) shows the relationship between coordinate variation values of each reference point and a plurality of corresponding point candidates, based on each minimum value distribution shown in FIG. 8C.
- xb1 represents the X coordinate of the reference point
- xb2,..., Xbn represent the evaluation value map M (D, Xb) when X coordinates of the reference point adjacent to the reference point in the left-right direction are represented.
- the equation to be calculated is as the following equation (1).
- the method of setting the peripheral region is, for example, the feature amount of the evaluation value distribution of the reference point, that is, the number of local minima, the interval between the local minima, and the characteristic amount of Can be selected as the selection range up to the peripheral reference point where the difference between
- the selection range when there are a plurality of objects including continuous similar patterns and the objects are not continuous with each other, the correct parallax of each object can be calculated.
- the corresponding point determination unit 108 selects the line with the strongest linearity among the lines a to d shown in the evaluation value map M (D, Xb), that is, the coordinate variation value of the parallax value among the corresponding point candidates.
- a corresponding point candidate with a small value is calculated as a corresponding point.
- the line c is the straight line with the strongest linear component.
- Hough transform is one of basic image processing for extracting linear components on an image.
- a line with the strongest linear component is extracted.
- the small point of the evaluation value in the evaluation value map is a point representing the existing position of the object, and an object including a continuous similar pattern such as a fence can not necessarily correspond to the support pillar portion at the same position in the reference image and the reference image. As a result, a plurality of candidate object location positions are generated.
- the said part is a part of a pillar of a little different of the thickness of a fence, and, in pedestrian crossing marking, it is a light-colored part. That is, an object such as a fence having a continuous similar pattern is, in fact, disordered in periodicity, the positions of a plurality of corresponding point candidates in the portion, and the corresponding points in a plurality of portions without periodicity The position of the candidate is different. For this reason, objects such as fences that have continuous similar patterns have corresponding points that match only in true parallax when the positions of a plurality of corresponding point candidates are compared between a portion with periodicity and a portion without disturbance. , Not true disparity.
- the true corresponding point position to be obtained is DCorrect (xb1)
- the position of the evaluation value minimum is DM.
- (Xb1) when the position of the calculated straight line is Dline (xb1), the true corresponding points can be expressed by the following equation (2).
- the number of local minimums in the local minimum value distribution Hm (xbn) of another reference point (xbn, ybn) located in the area around the reference point (xb1, yb1), and the reference points (xb1, yb1) The case where the number of local minimums in the local minimum value distribution Hm (xb1) is the same has been described, but the case where the number of local minimums is different will be described below. In such a case, it may be assumed that a corner of an object including a continuous similar pattern such as a fence is a ranging target.
- FIG. 9 is a schematic view showing the relationship between the distribution of minimum values when the number of minimum values in Hm (xbn) is different from the number of minimum values in Hm (xb1).
- FIG. 9A shows a reference image
- FIG. 9B shows a reference image
- FIG. 9C shows the relationship of the minimum value distribution of each reference point (xbn, ybn)
- FIG. 9D shows the minimum value distribution of the reference point (xbn, ybn) Shows the calculated evaluation value map.
- the reference point (xb1, yb1) is located at the rightmost end of the fence shown in the reference image. Therefore, when the search area is limited to a certain width, as shown in FIG. 9B, there may be a search area including three fences, while there may be a search area including two fences. .
- the method of extracting corresponding points from the evaluation value map shown in FIG. 9D may be the same method as the contents described with reference to FIG.
- the method of extracting corresponding points from the evaluation value map shown in FIG. 9D is different from the method described in FIG. It is also possible to perform information processing that is excluded from the candidates. As a result, it is possible to reduce the load required for the disparity calculating apparatus 100 to extract the line with the highest linearity from the evaluation value map.
- FIG. 10 is a schematic view showing an example of an object of a fence shown in a reference image and an obtained evaluation value map.
- 10A shows an evaluation value map
- FIG. 10B shows a reference image rotated 90 degrees counterclockwise
- FIG. 10C shows a minimum value distribution obtained by extracting a part of the evaluation value map.
- the evaluation value map is generated as oblique lines that are not parallel to the Xb axis on the evaluation value map. It is possible to extract a line indicating parallax.
- the parallax data output unit 103 calculates the difference d between the Xr coordinate point in the reference image of the corresponding point calculated by the corresponding point determination unit 108 and the Xb coordinate point in the reference image of the predetermined reference point, and the predetermined reference point And the result is output as disparity data.
- the optical axis of the stereo camera and the object are perpendicular
- the present invention can be applied not only to fences and guardrails located in front of the stereo camera but also to fences and guardrails located obliquely.
- Hough transform is used here, other straight line extraction methods such as Canny edge extraction may be used, and the present invention is not limited thereto.
- an arbitrary line may be calculated using dynamic programming.
- it is an example to calculate an arbitrary continuous line of evaluation value minimum using dynamic programming and any continuous line may be derived using a method other than dynamic programming. If you calculate an arbitrary line using dynamic programming, correct parallax will be calculated even when the objects with similar patterns are not only straight objects but also curves along road curves. be able to.
- the method of calculating the evaluation value map shown in FIG. 8D by extracting the minimum value of the evaluation value distribution shown in FIG. 6C to generate the minimum value distribution shown in FIG. 6D has been described.
- the evaluation value map may be calculated using the evaluation value distribution itself which is the value of the degree of difference.
- the evaluation value map shown in FIG. 8D is different in that the evaluation value map is not a binary value of 0 and -1 but a multi-value indicating the degree of difference
- the processing content in the corresponding point determination unit 108 is a small evaluation value It is the same in that continuous straight lines are calculated on straight lines. If valleys of points with low evaluation values are connected in the evaluation value map when using the evaluation value distribution itself, which is the value of the degree of difference, results similar to FIG. 8D are obtained.
- the peripheral area of the reference point (xb1, yb1) is provided in the lateral direction on the Xb axis, and the evaluation value map is calculated based on the minimum value distribution of each reference point existing in the peripheral area.
- the evaluation value map may be calculated based on the minimum value distribution associated with each reference point.
- FIG. 11 is a schematic view showing superposition of evaluation value distributions.
- 11A is a diagram showing the positions of a plurality of reference points in the reference image
- FIG. 11B is a diagram showing a search region for each reference point in the reference image
- FIG. 11C is a diagram showing the evaluation value distribution for each reference point.
- FIG. 11D is a diagram showing the result of superposition of evaluation value distributions.
- the minimum value distribution related to each reference point existing in the peripheral area is By calculating the evaluation value map on the basis of this, there is an effect that the accuracy of corresponding point extraction is improved.
- the peripheral area of the reference point (xb1, yb1) is provided in an arbitrary range in the horizontal direction on the Xb axis, and the evaluation value map is based on the minimum value distribution of each reference point existing in the peripheral area.
- the width in the lateral direction of the peripheral area of the reference point (xb1, yb1) may be a predetermined width.
- the width in the lateral direction of the peripheral region is determined as the peripheral region up to another reference point having an evaluation value distribution pattern similar to the evaluation value distribution pattern at the reference points (xb1, yb1).
- the evaluation value map calculation unit 107 determines the width in the lateral direction of the peripheral region, the minimum value distribution related to each reference point existing in the lateral direction of the reference point (xb1, yb1) and the reference point (xb1, yb1) Determine the similarity of the local minimum value distribution according to The similarity is determined by the sum of differences of each element of the minimum value distribution or the like, and the similarity is determined when the sum of differences is smaller than a predetermined threshold.
- the evaluation value map calculation unit 107 determines an area including the minimum value distribution determined to be similar as a peripheral area, and calculates an evaluation value map.
- the peripheral region of the reference point By setting the peripheral region of the reference point to the entire distance measurement object of the same distance (disparity) including the reference point, the accuracy of corresponding point extraction becomes high.
- the accuracy of estimating the correct disparity value is enhanced, and including the reference point having a different disparity value decreases the accuracy of estimating the correct disparity value.
- the present invention can also be applied to the case where the peripheral region is expanded in the vertical direction of the reference point (xb1, yb1) described in the second embodiment, and the accuracy of the corresponding point extraction can be improved.
- the parallax calculating device has a function of calculating the correct distance even in a repetitive pattern which is difficult to calculate the distance in principle in stereo matching, and is useful as pre-crash safety or parking assistance in a parking lot.
- disparity calculation device 101 disparity calculation unit 102 stereo image data acquisition unit 103 disparity data output unit 104 stereo matching unit 105 correspondence point candidate number determination unit 106 minimum value distribution calculation unit 107 evaluation value map calculation unit 108 correspondence point determination unit 1201 disparity calculation Part 1202 Stereo image data acquisition part 1203 Stereo matching part 1204 Corresponding point candidate multiple existence judgment part 1205 Evaluation value minimum corresponding point calculation part 1206 Control aspect data acquisition part 1207 Control aspect corresponding point calculation part 1208 Parallax data output part
Landscapes
- Physics & Mathematics (AREA)
- General Physics & Mathematics (AREA)
- Engineering & Computer Science (AREA)
- Electromagnetism (AREA)
- Remote Sensing (AREA)
- Radar, Positioning & Navigation (AREA)
- Multimedia (AREA)
- Theoretical Computer Science (AREA)
- Computer Vision & Pattern Recognition (AREA)
- Signal Processing (AREA)
- Measurement Of Optical Distance (AREA)
- Image Processing (AREA)
- Image Analysis (AREA)
- Traffic Control Systems (AREA)
Abstract
連続する類似したパターンを含む物体の距離測定を実現するステレオカメラ。ステレオカメラを用いたステレオマッチングにおいて、基準点に対するSADなどの評価値分布において複数の対応点候補が存在した場合、対応点が複数存在すると判定された基準点の評価値分布と、その基準点の周辺領域に存在する別の各基準点の評価値分布とを重畳して、評価値マップを生成する。これにより、対応点が複数存在すると判定された基準点の周辺の実空間における、物体の形状を表現していることになり、評価値マップ上の最も直線の強い線分を抽出することで、一直線上に連続する柵などの正しい距離を算出することが可能となる。
Description
本発明は、自車両前方の車両、又は歩行者、壁、柵、植込みなどの道路環境に存在するものを、測距、検出するための車載ステレオカメラを用いてステレオマッチングによる視差算出をする方法および装置の分野に関するものである。
ステレオマッチングとは、二つのレンズを搭載したステレオカメラによって測距対象を撮影したステレオ画像データのうち、一方のレンズで撮影したステレオ画像データである基準画像データの各点と対応する対応点を、もう一方のレンズで撮影したステレオ画像データである参照画像データの探索領域から探索するものである。対応点の判定方法としては、基準画像データの各点である基準点を中心に小領域を抽出し、抽出した小領域と探索領域内の小領域と比較して、各小領域の画像輝度パターンが類似しているかを、画像輝度の差分絶対和(SAD:Sum of Absolute Differences)、差分二乗和(SSD:Sum of Squared Differences)、正規化相互相関(NCC:Normalized Cross Correlation)などの評価値の基準を用いて判定する方法が、一般的に用いられている。
しかし、測距対象物が、横断歩道、柵など、棒状、矩形の模様が繰り返されているような、連続した類似パターンを含む物体を含む場合には、SAD、SSD、NCCでは、対応点候補が複数算出され、原理的に正しい対応点を算出することが困難である。
複数の対応点候補が算出された場合における従来の対策として、その基準点の対応点は不明であるとして出力しないという方法がある(例えば、特許文献1参照)。また、プリクラッシュ制御、先行車との車間制御、駐車支援制御などのアプリケーションの制御態様に応じて、対応点を選択するという方法(例えば、特許文献2参照)があった。図12は、特許文献2に記載された従来のステレオマッチング方式を示す。
図12において、ステレオ画像データ取得部1202は、二つのレンズを搭載したステレオカメラで同時に撮影した一対の画像データとして、一方のレンズで撮影した基準画像データと、もう一方のレンズで撮影した参照画像データとを取得する。
ステレオマッチング部1203は、基準画像データの各点と、参照画像データの探索領域内の探索点との画像輝度の相違度をSADにより算出し、探索領域内の類似度の集合を評価値分布として算出する。対応点候補複数存在判定部1204は、評価値分布から複数の対応点候補が存在するか否かについて判定する。
評価値極小対応点算出部1205は、複数の対応点候補が存在しないと判定された基準点に対して、画像輝度の相違度である評価値が極小となる探索点を対応点候補として算出する。制御態様データ取得部1206は、制御態様のモードを表す制御態様データを取得する。
制御態様対応点算出部1207は、複数の対応点候補が存在すると判定された基準点に対して、制御態様がプリクラッシュ制御の場合は最も遠距離の対応点候補を選択し、制御態様が車間制御の場合は最も近距離の対応点候補を選択し、制御態様が駐車支援制御の場合は最も近距離の対応点候補を選択する。
視差データ出力部1208は、複数の対応点候補が存在しないと判定された基準点に対しては評価値最小の対応点を代入し、複数の対応移転候補が存在すると判定された基準点に対しては制御態様によって選択した対応点を代入して、基準画像に対する視差データを算出する。
しかしながら、従来の構成では、制御態様によって対応点の位置を決定するため、正しい距離を測定することは困難であった。例えば、実際には、自車から距離5.7mの位置に存在する物体に含まれる、連続した類似パターンの間隔が10cmである場合において、仮に、ステレオカメラを構成する二つのレンズ間の距離(基線長)を0.12m、カメラの焦点距離を1000pixelとした場合、探索領域内の類似パターン位置で極小となるために、視差が5、21、37となる複数の対応点候補が算出される。係る場合、三角測量の原理から、(視差)=(基線長)×(焦点距離)/(距離)の関係が成り立つことから、視差が0.12×1000/5.7=21の対応点候補が正しい対応点となる。
しかしながら、最も近距離の対応点候補を選択すると、視差が37の対応点候補が選択されるため距離が0.12×1000/37=3.2mと誤算出され、一方で、最も遠距離の対応点候補を選択すると、視差が5の対応点候補が選択されるため0.12×1000/5=24mと誤算出されることになる。
そのため、柵のように、棒状の物体が、10cm間隔で配置され、視差検出装置において、類似画像パターンが連続する物体として認識される場合は、制御態様のプリクラッシュ制御があっても、ブレーキ制御が十分に作動しない可能性もある。また、制御態様が車間制御のときは十分に減速しない可能性があり、制御態様が駐車支援制御のときは、適切なところに駐車することが困難である可能性がある。
さらに、柵のように、連続した類似パターンを含む物体が存在すると、柵の検出が困難になるため、走行路の判定が不十分になる場合があるという課題を有していた。
本発明の目的は、連続した類似パターンを含む物体がある場合においても、正しい視差を算出する視差算出方法および装置を提供することである。
本発明の一態様に係る視差算出装置は、第一の撮像系と第二の撮像系を有し、対象物を、第一の撮像系を用いて撮像した基準画像のデータと、対象物を、第二の撮像系を用いて撮像した参照画像のデータと、を取得するステレオ画像データ取得部と、基準画像が有する基準点と、参照画像が有する複数の探索点との、画像輝度の相違度を示す評価値分布を算出するステレオマッチング部と、評価値分布に含まれる探索点から、評価値が極小となる探索点を検出し、検出した探索点の数量が複数である場合に、検出された複数の探索点を対応点候補として出力する対応点候補数判定部と、対応点候補が含まれる評価値分布から、対応点候補の座標分布を示す極小値分布であり、第一の基準点に対応する第一の極小値分布と、第一の基準点を含む基準画像の周辺領域に存在する、一または複数の第二の基準点に対応する第二の極小値分布と、を算出する極小値分布算出部と、第一の極小値分布と第二の極小値分布とに基づいて、第一の基準点及び第二の基準点と複数の対応点候補との座標変動値の関係を示す評価値マップを算出する評価値マップ算出部と、評価値マップにおいて、座標変動値が最小である対応点候補を、対応点として判定する対応点判定部と、対応点の参照画像における座標点と、第一の基準点の参照画像における座標点との差分である視差値を出力する視差データ出力部と、を備えるものである。
これにより、基準画像において、基準点の周辺領域に存在する別の基準点の情報を重畳することにより、連続する類似したパターンを含む物体の場合に対しても、正しい視差を算出することができるという効果を有する。
また、本発明の一態様に係る視差算出装置は、周辺領域の範囲は、第一の基準点の極小値分布に含まれる評価値が極小となる探索点の数、および間隔に基づいて定まるものである。
これにより、基準画像内で、連続する類似パターンを含む物体が複数存在し、さらに各物体の距離が異なる場合に対して、各物体のサイズをより高精度に算出できるという効果を有する。
また、本発明の一態様に係る視差算出装置は、対応点判定部が、第一の基準点に係る対応点候補の数量と、第二の基準点に係る対応点候補の数量とが異なる場合に、第一の基準点、および第二の基準点に係る極小値分布の何れかにのみ含まれる対応点候補を除いて、対応点を判定するものである。
これにより、視差算出装置に与える情報処理の負荷を軽減し、正しい視差を算出することができるという効果を有する。
また、本発明の一態様に係る視差算出装置は、対応点判定部が、評価値マップに対してハフ変換を行うことにより、座標変動値が最小である対応点候補を、対応点として抽出するものである。
これにより、連続する類似したパターンを含む物体が一直線状に存在する場合に対して、距離をより高精度に算出できるという効果を有する。
また、本発明の一態様に係る視差算出装置は、第一の撮像系は第一のレンズを有し、第二の撮像系は第二のレンズを有し、周辺領域は、第一のレンズと第二のレンズとの配列方向に任意の幅を有する領域である場合において、評価値マップ算出部は、第一の評価値分布と、第二の評価値分布と、周辺領域に存在する基準点に対して、第一のレンズと第二のレンズとの配列方向に対して垂直方向に存在する第三の基準点に対応する極小値分布とに基づいて、評価値マップを算出するものである。
これにより、第一のレンズと第二のレンズとの配列方向に対して垂直方向に存在する別の基準点の極小値分布を重畳してから、周辺領域に存在する各基準点に係る極小値分布に基づいて評価値マップを算出することにより、対応点抽出の確度が向上するという効果を有する。
また、本発明の一態様に係る視差算出装置は、周辺領域の範囲は、第一の基準点に対応する評価値分布と、第二の基準点に対応する評価値分布と、の複数の探索点に対応する画像輝度の相違度の差分和に基づいて定めるものである。
これにより、同じ視差(距離)の基準点を周辺領域として含めることにより、正しい視差値を推定する確度が高まるという効果を有する。
また、本発明の一態様に係る視差算出方法は、対象物を、第一の撮像系を用いて撮像した基準画像のデータと、対象物を、第二の撮像系を用いて撮像した参照画像のデータと、を取得し、基準画像が有する基準点と、参照画像が有する複数の探索点との、画像輝度の相違度を示す評価値分布を算出し、評価値分布に含まれる探索点から、評価値が極小となる探索点を検出し、検出した探索点の数量が複数である場合に、検出された複数の探索点を対応点候補として出力し、対応点候補が含まれる評価値分布から、対応点候補の座標分布を示す極小値分布であり、第一の基準点に対応する第一の極小値分布と、第一の基準点を含む基準画像の周辺領域に存在する、一または複数の第二の基準点に対応する第二の極小値分布と、を算出し、第一の極小値分布と第二の極小値分布とに基づいて、第一の基準点及び第二の基準点と複数の対応点候補との座標変動値の関係を示す評価値マップを算出し、評価値マップにおいて、座標変動値が最小である対応点候補を、対応点として判定し、対応点の参照画像における座標点と、第一の基準点の参照画像における座標点との差分である視差値を出力するものである。
これにより、基準画像において、基準点の周辺領域に存在する別の基準点の情報を重畳することにより、連続する類似したパターンを含む物体の場合に対しても、正しい視差を算出することができるという効果を有する。
本発明によれば、ステレオマッチングにおいて、小領域での比較での対応点探索ではなく、周辺領域の比較情報も付加して対応点を判定することで、ステレオマッチングで算出困難な、連続する類似画像パターンを含む物体に対して正しい視差を算出することができ、交通環境において多く存在するガードレール、駐車場などに多く存在する柵などの距離を安定に測定できるため、自車両の制御、警報なども正しく動作することができる。
以下本発明の実施の形態について、図面を参照しながら説明する。
(実施の形態1)
図1は、本発明の実施の形態1における視差算出装置100のブロック図である。図1に示す視差算出装置100は、視差算出部101と、ステレオ画像データ取得部102と、視差データ出力部103と、を含む構成である。
図1は、本発明の実施の形態1における視差算出装置100のブロック図である。図1に示す視差算出装置100は、視差算出部101と、ステレオ画像データ取得部102と、視差データ出力部103と、を含む構成である。
さらに、視差算出部101は、ステレオマッチング部104と、対応点候補数判定部105と、極小値分布算出部106と、評価値マップ算出部107と、対応点判定部108と、を含む構成である。
視差算出装置100は、ステレオ画像データ取得部102が取得したステレオ画像に基づいて、視差算出部101が視差算出を行い、視差データ出力部103が視差データを出力する。
図2は、図1に示した視差算出装置100の視差算出方法の処理フロー図である。以下、本実施の形態1における、視差算出方法、及び視差算出装置の説明をする。
ステレオ画像データ取得部102では、左右に並んだ二つのレンズを搭載したステレオカメラによって同時に撮影した、一対のステレオ画像データを取得する(S201)。ステレオ画像データは、一方のレンズで撮影した基準画像のデータである基準画像のデータと、もう一方のレンズで撮影した参照画像のデータである参照画像データを含む。なお、ステレオカメラは、左右に並んだ二つのレンズを搭載したカメラであるとして説明したが、この限りではなく、二つのカメラで代替することもできる。
図3は、測距対象物が前方の車体である場合におけるステレオ画像であり、図3Aは基準画像を、図3Bは参照画像を示したものである。二つのレンズのうち、何れのレンズを用いて撮影した画像を基準画像とするかは任意であるが、以下、測距対象物に向かって、右レンズで撮影した画像を基準画像、左レンズで撮影した画像を参照画像として説明する。
参照画像において撮影される測距対象物の位置は、基準画像において撮影される測距対象物の位置と比較して右にずれた位置となる。このズレが視差であり、測距する対象物の距離によって変化する。具体的には、基準画像における測距対象物の左端の座標をxb、参照画像における測距対象物の左端の座標をxrとすると、測距対象物の左端の視差dは、座標位置の差であるxr-xbとなる。
取得したステレオ画像データは、レンズの歪み補正と光軸の平行化補正を施し、補正後のステレオ画像データに変換される。レンズの歪み補正を行う方法は、レンズの設計値を用いた補正変換テーブルを用いた歪み補正を行う方法、半径方向の歪曲収差のモデルを用いたパラメータ推定により補正を行う方法など、レンズの歪みを補正するあらゆる方法で実現可能であり、本発明を限定するものではない。
また、光軸の平行化補正は、ステレオカメラの光軸平行化を行う、あらゆる方法で実現可能であり、本発明を限定するものではない。例えば、ステレオカメラの共通視野に格子パターンを設置し、対応付けされた格子点位置からステレオカメラの相対関係を算出し、光軸の平行化補正を行う方法によっても、平行化補正をすることができる。
視差算出部101は、ステレオマッチング部104において、ステレオ画像データ取得部102で取得した、基準画像と参照画像との間で、ステレオマッチングを行う(S202)。
ステレオマッチング部104は、各基準画像の任意の範囲に含まれる各基準点と、参照画像において、基準画像の基準点に対応する座標点を含む探索領域に含まれる探索点との、画像輝度の相違度を示す評価値分布を算出する。ここで、探索領域は、任意の範囲を有する領域である。
算出した各基準点についての評価値分布は、ステレオマッチング部104に内蔵されるメモリに記録される。
対応点候補数判定部105は、各基準点の評価値分布において、評価値が極小となる対応点候補が複数存在するか否かについて判定する(S203)。
基準画像における各基準点のうち、対応点候補が1つだけ存在すると判定された基準点については、視差データ出力部103が、対応点候補位置と、参照画像において当該基準値と同一の座標点に位置する座標点と、の差分を当該基準点の視差値として記録をする。そして、視差データ出力部103が視差データを出力する(S208)。
一方、基準画像における各基準点のうち、対応点候補が複数存在すると判定された基準点については、極小値分布算出部106が、評価値分布において評価値が極小となる対応点候補を算出し、極小値分布を算出する(S204)。
評価値マップ算出部107は、評価値マップを算出する(S205)。評価値マップは、対応点候補が複数存在すると判定された基準点の極小値分布と、基準画像において、当該基準点を含んだ周辺領域に位置する別の基準点の極小値分布とに基づいて、各基準点に対する各対応点候補の視差値の対応点候補ごとの変動値を示すマップである。
対応点判定部108は、評価値マップにおいて、最も直線状に連続した線分を抽出し(S206)、抽出した対応点候補の座標点を、対応点として判定する(S207)。
以下、視差算出部101の構成要素の各々の機能、および効果について、詳細に説明する。
ステレオマッチング部104は、基準画像と参照画像との間で、ステレオマッチングを行う。すなわち、基準画像の任意の範囲に含まれる各基準点と、参照画像において、各基準点と同一の座標点を含む、探索領域内の各探索点との、画像輝度の相違度を示す評価値分布を算出する(S202)。
ここで、探索領域の範囲は任意であり、計測した物体の距離の範囲、ステレオカメラの基線長、カメラの焦点距離を含む幾何学的パラメータによって決まる。
図4は、基準画像の任意の範囲における各基準点について、図4Aは評価値分布を算出する場合の基準画像を示し、図4Bは参照画像を示し、図4Cは評価値分布を示したものである。以下、基準点についての評価値分布の算出手順について説明する。
なお、説明にあたり、基準画像の任意の範囲は、図示するように一部の範囲として説明するが、全範囲としてもよい。また、評価値分布を算出する基準点の座標を(xb1、yb1)として、ステレオ画像データは、平行化補正されているものとして説明する。ステレオ画像データが平行化補正されている場合は、基準画像における対象物のY座標と、参照画像における対象物のY座標が同じになる。
なお、図4において、四角で示されている領域は1画素であり、1画素が基準点である。以下の図の説明においても同様である。
ステレオマッチング部104は、基準画像における基準点(xb1、yb1)に対応する探索点として、参照画像における、基準点(xb1、yb1)と同じ座標(xr1=xb1、yr1=yb1)に位置する座標点から、X座標方向の一定の範囲(探索幅)を、図4Bに示す探索領域として設定する。
探索領域は、参照画像において、Yr軸上すなわち横方向に一定の幅を有する領域である。探索領域を参照画像の横方向とするのは、ステレオカメラは、レンズを横方向に配列しているためである。
具体的には、基準画像上の基準点の座標である(xb1、yb1)に対して、参照画像上における探索点の範囲は、アプリケーションに必要な測距対象の距離の最小値/最大値に基づいて定まる探索幅をRとしたとき、(xr1、yr1)、(xr1+1、yr1)、(xr1+2、yr1)、…、(xr1+R、yr1)となる。なお、基準画像上の座標(xb1、yb1)と、参照画像上の座標(xr1、yr1)は、画像上の座標位置は同じである。
そして、探索領域内の各探索点と基準点xb1との画像輝度の相違度を算出して、相違度による評価値分布H(xb1)を算出する。
ここで、評価値分布H(xb1)のD軸(Depth軸)と、Xb軸およびXr軸の関係は、Xr軸の原点をxb1の位置にずらしたものがD軸であり、D軸、Xb軸、Xr軸の次元は何れもピクセルである。
なお、上記の説明では、ステレオ画像データは平行化補正されているものとして説明したが、ステレオ画像データが平行化補正されていない場合には、ステレオ画像の上下方向の位置合わせができていないため、基準画像の基準点(xb1、yb1)に撮影される測距対象物の点が、参照画像においては当該基準点の座標のY座標と同一のY座標に撮影されないため、基準点のY軸方向の位置合わせも含めて、探索領域として設定される。
ステレオマッチングによって得られる評価値分布H(xb1)は、横軸がD軸であり、縦軸が基準点とそれに対する探索点との画像輝度の相違度を示す一次元の分布である。基準点と探索点との画像輝度の相違度には、基準点を中心とした8×8の小領域と各探索点を中心とした8×8の小領域の、画像輝度の差分絶対和(SAD)を用いる。
なお、評価値として用いる画像輝度の相違度は、差分二乗和(SSD)など、完全一致した場合に値が最小となる、あらゆる相違度で代替可能である。また、評価値として用いる画像輝度の相違度は、正規化相関(NCC)など、完全一致した場合に、値が最大となる類似度の指標を正負逆にして利用することも可能である。
なお、以上の処理は、各基準点について行われ、算出した各基準点についての評価値分布は、ステレオマッチング部104に内蔵されるメモリに記憶される。
対応点候補数判定部105は、評価値分布H(xb1)において、極小値を探索する。
対応点候補数判定部105が極小値を探索した結果、極小値が1つ存在する場合は、評価値が極小となる探索点を対応点として判定し(S203:No)、対応点候補位置を当該基準点の視差値として記録をし、視差データを出力する(S208)。
図5は、測距対象物が前方に位置する車体である場合であり、図5Aは基準画像を示し、図5Bは参照画像を示し、図5Cは評価値分布を示す。車体のように連続した類似パターンを含む物体ではない場合、基準点(xb1、yb1)を含む小領域と、画像輝度が同程度である対応点候補は、図5Cに示すように、参照画面上に1つだけ存在する。
一方で、対応点候補数判定部105が極小値を探索した結果、評価値分布において複数の極小値が検出された場合は、評価値が極小となる複数の探索点を複数の対応点候補として判定する(S203:Yes)。
図6は、測距対象物が、前方に位置する柵である場合であり、図6Aは基準画像を示し、図6Bは参照画像を示し、図6Cは評価値分布を示し、図6Dは後述する極小値分布Hm(xb1)を示す。柵のように連続した類似パターンを含む物体である場合、基準画像における、基準点(xb1、yb1)と、画像輝度が同程度である対応点候補は、図6Cに示すように、参照画面において複数存在する。
なお、対応点候補が複数存在するか否かの判定方法は、評価値分布の極小値を算出して、極小値がいくつ存在するかにより判定する等、一次元の分布から、周期的な分布であるか否かを判定する他の方法でも実現可能である。
極小値分布算出部106は、対応点候補数判定部105が極小値を探索した結果、評価値分布において複数の極小値が検出された場合に、評価値が極小となる対応点候補の座標を抽出し、極小値の分布のみを示す極小値分布Hm(xb1)を算出する(S204)。
以下、図6を用いて、極小値分布Hm(xb1)の算出手順について説明する。
図6Aに示すように、測距対象が連続する類似パターンを含む柵であるため、評価値分布H(xb1)は、図6Cに示すように、複数の位置において極小値を有する分布となる。
極小値分布算出部106は、評価値分布H(xb1)において複数の極小値の位置のみを抽出した分布を算出し、図6Dに示すように、算出された評価値分布の極小値の位置に-1の値を、それ以外の位置は0の値を代入して、極小値分布Hm(xb1)を算出する。
ここで、図6Dに示す極小値分布Hm(xb1)の極小値の位置は、基準点(xb1、yb1)についての探索領域の左端を原点に、参照画像における対応点候補の位置を示している。
なお、極小値分布を算出する場合に用いる極小値の位置の定数、およびそれ以外の位置の定数の値に関しては一例であり、本発明を限定するものではない。
なお、基準点についての評価値分布について、対応点候補が複数存在するか否かの判定を行い、複数存在する場合には、極小値分布を算出するという一連の手続は、メモリに記憶された全ての各基準点について実施される。
なお、評価値が極小となる複数の探索点を、対応点候補として判定する際に、評価値軸上に所定の閾値を設けて、所定の閾値を以下である探索点を対応点候補とするとしてもよい。これにより、相違度が高い探索点であって極小点となる探索点を、対応点候補から除外することができ、対応点候補の判定精度を向上させることができる。
図7は、複数の対応点候補が存在する基準点(xb1、yb1)の極小値分布Hm(xb1)と、基準画像において、基準点(xb1、yb1)に隣接する別の基準点(xb2、yb2)の極小値分布Hm(xb2)との関係を示す模式図である。図7Aは基準画像を示し、図7Bは参照画像を示し、図7Cは基準点(xb1、yb1)の極小値分布Hm(xb1)を示し、図7Dは基準点(xb2、yb2)の極小値分布Hm(xb2)を示し、図7Eは図7Bに示す参照画像における基準点(xb1、yb1)に対する対応点候補、及び基準点(xb2、yb2)に対する対応点候補を示す。
以下、基準点(xb1、yb1)と、それと隣接する基準点(xb2、yb2)との極小値分布の関係を説明する。なお、図7A、及び図7Eに示す基準点(xb1、yb1)の対応点候補は、図7Bに示す対応点候補1から対応点候補4とし、図7A、及び図7Eに示す基準点(xb2、yb2)の対応点候補は、図7Bに示す対応点候補5から対応点候補8として説明する。また、対応点候補1から対応点候補4は、点線で示す。
図7Aに示す基準画像において、基準点(xb2、yb2)は、基準点(xb1、yb1)に隣接する基準点として選択される。図7Bに示す、基準点(xb2、yb2)に対する探索領域は、基準点(xb1、yb1)に対する探索領域に対して、xb2とxb1の差分だけXr軸にシフトさせた領域である。
ここで、図7Cに示された、基準点(xb1、yb1)の極小値分布Hm(xb1)のD軸上における各極小値の位置と、図7Dに示された、基準点(xb2、yb2)の極小値分布Hm(xb2)のD軸上における各極小値の位置とを比較すると、xb2とxb1の差分だけD軸上をシフトしている極小値もある一方で、xb2とxb1の差分よりも大きく、または小さくシフトしている極小値もある。
図7Eを用いて説明すると、基準点(xb1、yb1)に対する対応点候補3の座標から、xb2とxb1の差分だけXr軸上にシフトさせた位置に、基準点(xb2、yb2)に対する対応点候補7が存在しており、隣接する基準点に撮像されている点の距離はほぼ等しいと考えられるため、各対応点候補は正しい対応点である可能性が高いことを意味する。
一方、図7Eの基準点(xb1、yb1)に対する対応点候補1の座標から、xb2とxb1の差分だけXr軸上にシフトさせた位置に、基準点(xb2、yb2)に対する対応点候補5が存在していないため、対応点候補は正しい対応点ではないことを意味する。係る場合、対応点候補3と対応点候補7の領域は、正しい対応点の位置であり正しい視差であるということになり、対応点候補1と対応点候補5の領域は、正しい対応点の位置ではないということになる。
評価値マップ算出部107は、極小値分布算出部106において極小値分布が算出された基準点(xb1、yb1)と、基準画像において、当該基準点xb1の周辺領域に存在する位置、または複数の別の基準点xbn(n:自然数)との極小値分布に基づいて、評価値マップを算出する(S205)。
ここで、周辺領域とは、基準画像において基準点(xb1、yb1)を含み、Yb軸方向に任意の幅を有する領域である。原則として、周辺領域に含まれる各基準点は、Yb座標が同一である領域である。周辺領域を、基準画像において横方向とするのは、各基準点に対して、探索領域を参照画像の横方向に設定することにより、横方向に類似パターンを誤検出する蓋然性が生じるためである。
なお、探索領域を参照画像の横方向とするのは、ステレオカメラを横方向に配列しているためであり、ステレオカメラを縦方向に配列した場合は、探索領域は参照画像の縦方向となり、基準画像における周辺領域も縦方向になる。
図8は、基準点(xb1、yb1)の極小値分布Hm(xb1)と、基準点(xb1、yb1)の周辺領域に位置する各基準点(xbn、ybn)(n:自然数)の極小値分布Hm(xbn)に基づいて、評価値マップを算出する手順を示す模式図である。図8Aは基準画像を示し、図8Bは参照画像を示し、図8Cは各基準点(xbn、ybn)の極小値分布Hm(xbn)の関係を示し、図8Dは基準点(xbn、ybn)の極小値分布を重畳させることで算出した評価値マップを示す。以下、図8に示す評価値マップの算出方法について説明する。
図8Aに示す基準画像において、基準点(xb1、yb1)の周辺領域に存在し、別の基準点(xb2、yb2)、(xb3、yb3)、(xb4、yb4)の各々について算出された評価値分布Hm(xbn)は、メモリから読み出される。ここで、各基準点の対応点候補は4つ存在するとして説明するが、本発明を限定するものではない。
図8Cに示すように、各極小値分布Hm(xbn)(n:1から4の整数)に分布する4つの対応点候補のうち、原点からの距離が極小値分布ごとに異なる対応点候補が存在する。図8Cにおいては、線a、b、dで引かれた線上の対応点候補の原点からの距離が、極小値分布ごとに異なっている。これは、各基準点に対する視差値が変動していることを意味する。
評価値マップM(D、Xb)は、図8Cに示す各極小値分布Hm(xbn)(n:1から4の整数)のD軸を揃え、Xb軸に対するD軸上における各対応点候補の変動値、すなわち視差値の変動値を、Xb軸に対する線で示したものである。情報処理としては、Xb軸という次元を増やし、対応点候補の位置を3次元分布として処理したものである。
すなわち、評価値マップM(D、Xb)は、図8Cに示す各極小値分布に基づいて、各基準点と複数の対応点候補との座標変動値の関係を示したものである。
評価値マップM(D、Xb)において、線c上の対応点候補は、各基準点に対する各対応点候補の視差値に変動がなく、すなわち各基準点が同じ視差に存在する、すなわち同じ距離に存在するということであり、正しい視差値を示している。
ここで、xb1は基準点のX座標を表し、xb2、…、xbnは、基準点に対して左右方向に隣接する基準点のX座標を表した場合、評価値マップM(D、Xb)を算出する数式は以下の数式(1)のようになる。
なお、以上の説明では、基準点(xb1,yb1)の周辺領域として、Y座標(yb1)の画像横一列の任意の領域を設定しているが、基準画像におけるY座標(yb1)のXb軸上の全ての基準点を含むとしてもよい。
なお、周辺領域の設定方法は、例えば、基準点の評価値分布の特徴量、すなわち極小値の数や極小値間の間隔と、周辺領域に存在する別の基準点の評価値分布の特徴量との差が、一定の範囲となる周辺基準点までを選択範囲とすることができる。選択範囲を制限することで、連続する類似したパターンを含む物体が複数存在し、かつ、互いに位置が連続していない物体である場合に、各物体の正しい視差を算出することができる。
対応点判定部108は、評価値マップM(D、Xb)において示した線aないしdのうち、最も直線性の強い線、すなわち、各対応点候補のうちで、最も視差値の座標変動値が小さい対応点候補を、対応点として算出する。図8Dに示す評価値マップM(D、Xb)においては、線aから線dのうち、線cが最も直線成分の強い直線である。
具体的には、柵など直線上に連続して存在する物体を抽出するために、評価値マップM(D、Xb)において、評価値の小さな点が一直線上に連続するような、最も直線成分の強い線を、ハフ変換により抽出する(S206)。ハフ変換とは、画像上の直線成分を抽出する基本的な画像処理一つである。ここで、評価値マップ全体についてハフ変換を行った結果として、直線成分が最も強い線を抽出する。
物理的な意味においては、連続する類似パターンを含む物体が、実空間で直線状に並んでいる場合、評価値マップ上では、対応点は、最も直線性の強い線に分布する結果が得られる。
評価値マップにおける評価値の小さな点は、物体の存在位置を表す点であり、柵などの連続する類似パターンを含む物体では、基準画像と参照画像とで必ずしも同じ位置の支柱部分を対応付けできないため、複数の物体存在位置の候補が発生する。
対応点候補が複数存在する場合には、評価値マップ上では複数の線が得られるが、真の視差の位置ではない直線では、評価値マップ上で一部直線性が乱れる部分があり、直線的には分布しない箇所が発生する。
当該部分は、実空間では、柵の太さの少し異なる支柱の部分であり、また、横断歩道標示では、色が薄い部分である。すなわち、柵などの、連続する類似パターンを含む物体は、実際には、周期性に乱れがあり、当該部分の複数ある対応点候補の位置と、周期性の乱れのない部分の複数ある対応点候補の位置とが異なる。このため、柵などの、連続する類似パターンを含む物体は、周期性に乱れのある部分とない部分とで複数の対応点候補の位置を比較すると、真の視差でのみ一致する対応点があり、真の視差以外では一致しない。
評価値マップとして表現すると、真の視差の位置でのみ直線性が保たれ、それ以外の視差の位置では、直線性が乱れた結果が得られることになる。
ここで、図8Aにおける基準点位置(xb1、yb1)、すなわち、評価値マップにおけるxb=xb1の位置に対して、求めるべき真の対応点位置をDCorrect(xb1)、評価値極小の位置をDM(xb1)、算出した直線の位置をDline(xb1)とした場合に、真の対応点は、以下の数式(2)で表すことができる。算出した直線の位置Dline(xb1)は、図8Dにおける線cのxb=xb1となるD軸の値を表している。
数式(2)で表現した処理は、各基準点位置において実行される。本処理は、図8Dにおける線cの位置を、そのままxb=xb1の真の視差にすると、線cを推定する際の誤差が重畳してしまうため、線cを推定する際の誤差に影響されないようにするために必要な処理である。
なお、以上の説明では、基準点(xb1、yb1)の周辺領域に位置する別の基準点(xbn、ybn)の極小値分布Hm(xbn)における極小値の数と、基準点(xb1、yb1)の極小値分布Hm(xb1)における極小値の数とが同じである場合について説明したが、極小値の数が異なる場合について、以下説明する。係る場合は、柵などの連続した類似パターンを含む物体の隅を測距対象とした場合が想定される。
図9は、Hm(xbn)における極小値の数と、Hm(xb1)における極小値の数とが異なる場合における極小値分布の関係を示す模式図である。図9Aは基準画像を示し、図9Bは参照画像を示し、図9Cは各基準点(xbn、ybn)の極小値分布の関係を示し、図9Dは基準点(xbn、ybn)の極小値分布を統合させることで、算出した評価値マップを示す。
図9Aにおいて、基準点(xb1、yb1)は、基準画像に映った柵の最右端に位置している。そのため、探索領域が一定の幅に限られている場合においては、図9Bに示すように、柵を3本含む探索領域も存在する一方で、柵を2本含む探索領域も存在する場合がある。
係る場合、図9Cに示すように、基準点(xb1、yb1)と周辺領域に位置する別の基準点との、それぞれの極小値分布Hm(xbn)に含まれる極小値の数が異なることになる。そのため、図9Dに示すように、直線aにおいて、線分が欠落する部分が生じることになる。
図9Dに示す評価値マップから、対応点を抽出する方法は、図8について説明した内容と同様の方法であってもよい。
また、図9Dに示す評価値マップから、対応点を抽出する方法は、図8について説明した内容と異なる方法として、対応点判定部108が、線分の一部が欠落した線を、対応点候補から外すような情報処理をすることもできる。これにより、視差算出装置100が、評価値マップから最も直線性の強い線を抽出するのに要する負荷を軽減することができる。
なお、図9Dにおいては、線分の一部が欠落した線aは直線ではないとして説明したが、線分の一部が欠落した線が直線であっても同様に、対応点候補から外す情報処理をすることもできる。
なお、以上の説明では、柵の連続する方向がレンズの光軸に対して垂直である場合について説明したが、垂直でない場合においても、正しい視差値を算出することができる。
図10は、基準画像に映る柵の物体と、得られる評価値マップの例を示す模式図である。図10Aは評価値マップを示し、図10Bは反時計回りに90度回転した基準画像を示し、図10Cは評価値マップの一部を抽出した極小値分布を示す。柵の連続する方向がレンズ光軸に垂直でない場合であっても評価値マップ上ではXb軸に平行でない斜線として評価値マップが生成されるため、斜線の直線成分についてハフ変換を行えば、正しい視差を示す線を抽出することが可能となる。
従って、図10に示すように、柵の連続する方向がレンズの光軸に対して垂直でない場合であっても、正しい距離を算出することが可能である。
視差データ出力部103では、対応点判定部108で算出した対応点の参照画像におけるXr座標点と、所定の基準点の基準画像におけるXb座標点との差分dを算出し、当該所定の基準点における視差dとし、その結果を視差データとして出力する。
以上のように、係る構成によれば、基準画像において、基準点の周辺領域に存在する別の基準点の情報を重畳することにより、連続する類似したパターンを含む物体の場合に対しても、正しい視差を算出することができる。
なお、ここでは、ステレオカメラの光軸と物体が垂直の場合について説明したが、垂直でない場合でも適用することは可能であり、連続する類似パターンを含む物体の位置には依存しない。具体的には、ステレオカメラ正面に位置する柵やガードレールだけではなく、斜めに位置する柵やガードレールに対しても適用することが可能である。
なお、ここではハフ変換を用いたが、Cannyエッジ抽出など、それ以外の直線を抽出する方法を用いても良く、本発明を限定するものではない。
なお、ここでは、Xb軸の方向に連続する任意の線を算出するために、ダイナミックプログラミングを用いて任意の線を算出しても良い。また、ダイナミックプログラミングを用いて評価値最小の任意の連続する線を算出することは一例であり、ダイナミックプログラミング以外の方法を用いて任意の連続する線を導出しても良い。ダイナミックプログラミングを用いて任意の線を算出すると、似たパターンが連続する物体が直線状に連続する物体だけではなく、道路のカーブに沿って曲線となった場合であっても正しい視差を算出することができる。
なお、ここでは、図6Cに示す評価値分布の極小値を抽出して、図6Dに示す極小値分布を生成して、図8Dに示す評価値マップを算出する方法を説明したが、極小値分布の代わりに、相違度の値である評価値分布そのものを使って、評価値マップを算出してもよい。
係る場合、図8Dに示す評価値マップが0と-1の二値ではなく、相違度を示す多値となる点で異なるが、対応点判定部108における処理内容は、評価値の小さな点が一直線上に連続した直線を算出するという点で同じである。相違度の値である評価値分布そのものを使用した場合の評価値マップにおいて、評価値の低い点の谷を接続すると図8Dと同様な結果となる。
(実施の形態2)
実施の形態1では、基準点(xb1、yb1)の周辺領域をXb軸上の横方向に設けて、周辺領域に存在する各基準点に係る極小値分布に基づいて評価値マップを算出することについて説明したが、図11に示すように、基準点(xb1、yb1)のYb軸上の縦方向に位置する位置、または複数の基準点の極小値分布を重畳してから、周辺領域に存在する各基準点に係る極小値分布に基づいて評価値マップを算出するとしてもよい。
実施の形態1では、基準点(xb1、yb1)の周辺領域をXb軸上の横方向に設けて、周辺領域に存在する各基準点に係る極小値分布に基づいて評価値マップを算出することについて説明したが、図11に示すように、基準点(xb1、yb1)のYb軸上の縦方向に位置する位置、または複数の基準点の極小値分布を重畳してから、周辺領域に存在する各基準点に係る極小値分布に基づいて評価値マップを算出するとしてもよい。
図11は、評価値分布の重ね合わせを示す模式図である。図11Aは基準画像における複数の基準点の位置を示す図であり、図11Bは参照画像における各基準点に対する探索領域を示す図であり、図11Cは各基準点に対する評価値分布を示す図であり、図11Dは評価値分布を重ね合わせた結果を示す図である。
図11Dに示すように、極小値を重ね合わせて生成した評価値マップを使用した場合、画像のノイズに対して、よりロバストになるため、直線の確度が向上する。
各周辺基準点に対する極小値分布Hm(Xb)の各成分を重ね合わせたものを、評価値分布として利用する。
ここで、Rを評価値分布の成分個数とした場合において、基準点における極小値分布Hm1(Xb)と、基準画像における縦方向に存在する基準点における極小値分布HmR(Xb)との重ね合わせによる極小値分布H(Xb)の算出式を数式(3)に示す。
以上のように、基準画像において、基準点(xb1、yb1)の縦方向に存在する別の基準点の極小値分布を重畳してから、周辺領域に存在する各基準点に係る極小値分布に基づいて評価値マップを算出することにより、対応点抽出の確度が向上するという効果がある。
(実施の形態3)
実施の形態1では、基準点(xb1、yb1)の周辺領域をXb軸上の横方向の任意の範囲に設けて、周辺領域に存在する各基準点に係る極小値分布に基づいて評価値マップを算出することについて説明したが、基準点(xb1、yb1)の周辺領域の横方向の幅を所定の幅としても良い。
実施の形態1では、基準点(xb1、yb1)の周辺領域をXb軸上の横方向の任意の範囲に設けて、周辺領域に存在する各基準点に係る極小値分布に基づいて評価値マップを算出することについて説明したが、基準点(xb1、yb1)の周辺領域の横方向の幅を所定の幅としても良い。
本実施の形態においては、周辺領域の横方向の幅は、基準点(xb1、yb1)における評価値分布パターンと類似した評価値分布パターンをもつ、他の基準点までを周辺領域として決定する。
評価値マップ算出部107は、周辺領域の横方向の幅を定める際に、基準点(xb1、yb1)の横方向に存在する各基準点に係る極小値分布と、基準点(xb1、yb1)に係る極小値分布の類似性を判定する。類似性は、極小値分布の要素ごとの差分和などにより判定し、差分和が所定の閾値より小さい場合に類似と判定する。
そして、評価値マップ算出部107は、類似していると判定された極小値分布を含む領域を周辺領域と決定し、評価値マップを算出する。
基準点の周辺領域は、基準点を含む同じ距離(視差)の測距対象物全体に設定することで対応点抽出の確度が高くなる。同じ視差の基準点を周辺領域として含めることにより、正しい視差値を推定する確度が高まり、異なる視差値をもつ基準点を含めると正しい視差値を推定する確度が低下することになるためである。
同様に、実施の形態2で記述した、周辺領域を基準点(xb1、yb1)の縦方向に拡大させる場合においても適用することができ、対応点抽出の確度を向上させることができる。
2009年9月7日出願の特願2009-205466の日本出願に含まれる明細書、図面および要約書の開示内容は、すべて本願に援用される。
本発明にかかる視差算出装置は、ステレオマッチングにおいて原理的に距離算出困難な繰り返しパターンにおいても正しい距離を算出できる機能を有し、プリクラッシュセーフティや駐車場における駐車支援等として有用である。
100 視差算出装置
101 視差算出部
102 ステレオ画像データ取得部
103 視差データ出力部
104 ステレオマッチング部
105 対応点候補数判定部
106 極小値分布算出部
107 評価値マップ算出部
108 対応点判定部
1201 視差算出部
1202 ステレオ画像データ取得部
1203 ステレオマッチング部
1204 対応点候補複数存在判定部
1205 評価値極小対応点算出部
1206 制御態様データ取得部
1207 制御態様対応点算出部
1208 視差データ出力部
101 視差算出部
102 ステレオ画像データ取得部
103 視差データ出力部
104 ステレオマッチング部
105 対応点候補数判定部
106 極小値分布算出部
107 評価値マップ算出部
108 対応点判定部
1201 視差算出部
1202 ステレオ画像データ取得部
1203 ステレオマッチング部
1204 対応点候補複数存在判定部
1205 評価値極小対応点算出部
1206 制御態様データ取得部
1207 制御態様対応点算出部
1208 視差データ出力部
Claims (7)
- 第一の撮像系と第二の撮像系を有し、対象物を、前記第一の撮像系を用いて撮像した基準画像のデータと、前記対象物を、前記第二の撮像系を用いて撮像した参照画像のデータと、を取得するステレオ画像データ取得部と、
前記基準画像が有する基準点と、前記参照画像が有する複数の探索点との、画像輝度の相違度を示す評価値分布を算出するステレオマッチング部と、
前記評価値分布に含まれる探索点から、前記評価値が極小となる探索点を検出し、前記検出した探索点の数量が複数である場合に、前記検出された複数の探索点を対応点候補として出力する対応点候補数判定部と、
前記評価値分布に前記対応点候補が含まれる場合、前記対応点候補の座標分布を示す極小値分布であり、第一の基準点に対応する第一の極小値分布と、前記第一の基準点を含む前記基準画像の周辺領域に存在し、一または複数の第二の基準点に対応する第二の極小値分布と、を算出する極小値分布算出部と、
前記第一の極小値分布と前記第二の極小値分布とに基づいて、前記第一の基準点及び前記第二の基準点と前記複数の対応点候補との座標変動値の関係を示す評価値マップを算出する評価値マップ算出部と、
前記評価値マップにおいて、前記座標変動値が最小である前記対応点候補を、対応点として判定する対応点判定部と、
前記対応点の前記参照画像における座標点と、前記第一の基準点の前記参照画像における座標点との差分である視差値を出力する視差データ出力部と、
を備えた視差算出装置。 - 前記周辺領域の範囲は、前記第一の基準点の前記極小値分布に含まれる評価値が極小となる探索点の数、および間隔に基づいて定まる範囲である請求項1記載の視差算出装置。
- 前記対応点判定部が、前記第一の基準点に係る前記対応点候補の数量と、前記第二の基準点に係る前記対応点候補の数量とが異なる場合に、前記第一の基準点、および前記第二の基準点に係る前記極小値分布の何れかにのみ含まれる前記対応点候補を除いて、前記対応点を判定する請求項1記載の視差算出装置。
- 前記対応点判定部が、前記評価値マップに対してハフ変換を行うことにより、前記座標変動値が最小である前記対応点候補を、対応点として抽出する請求項1記載の視差算出装置。
- 前記第一の撮像系は第一のレンズを有し、
前記第二の撮像系は第二のレンズを有し、
前記周辺領域は、前記第一のレンズと前記第二のレンズとの配列方向に任意の幅を有する領域である場合において、
前記評価値マップ算出部は、前記第一の評価値分布と、前記第二の評価値分布と、前記周辺領域に存在する基準点に対して、前記第一のレンズと前記第二のレンズとの配列方向に対して垂直方向に存在する第三の基準点に対応する極小値分布とに基づいて、前記評価値マップを算出する請求項1記載の視差算出装置。 - 前記周辺領域の範囲は、前記第一の基準点に対応する評価値分布と、前記第二の基準点に対応する評価値分布と、の前記複数の探索点に対応する画像輝度の相違度の差分和に基づいて定める範囲である請求項1に記載の視差算出装置。
- 対象物を、第一の撮像系を用いて撮像した基準画像のデータと、前記対象物を、第二の撮像系を用いて撮像した参照画像のデータと、を取得し、
前記基準画像が有する基準点と、前記参照画像が有する複数の探索点との、画像輝度の相違度を示す評価値分布を算出し、
前記評価値分布に含まれる探索点から、前記評価値が極小となる探索点を検出し、前記検出した探索点の数量が複数である場合に、前記検出された複数の探索点を対応点候補として出力し、
前記評価値分布に前記対応点候補が含まれる場合、前記対応点候補の座標分布を示す極小値分布であり、第一の基準点に対応する第一の極小値分布と、前記第一の基準点を含む前記基準画像の周辺領域に存在する、一または複数の第二の基準点に対応する第二の極小値分布と、を算出し、
前記第一の極小値分布と前記第二の極小値分布とに基づいて、前記第一の基準点及び第二の基準点と前記複数の対応点候補との座標変動値の関係を示す評価値マップを算出し、前記評価値マップにおいて、前記座標変動値が最小である前記対応点候補を、対応点として判定し、
前記対応点の前記参照画像における座標点と、前記第一の基準点の前記参照画像における座標点との差分である視差値を出力する視差算出方法。
Priority Applications (4)
| Application Number | Priority Date | Filing Date | Title |
|---|---|---|---|
| CN2010800031211A CN102203552B (zh) | 2009-09-07 | 2010-09-02 | 视差计算方法和视差计算装置 |
| US13/125,108 US8743183B2 (en) | 2009-09-07 | 2010-09-02 | Parallax calculation method and parallax calculation device |
| EP10813515.3A EP2476996B1 (en) | 2009-09-07 | 2010-09-02 | Parallax calculation method and parallax calculation device |
| US14/249,721 US9338434B2 (en) | 2009-09-07 | 2014-04-10 | Parallax calculation method and parallax calculation device |
Applications Claiming Priority (2)
| Application Number | Priority Date | Filing Date | Title |
|---|---|---|---|
| JP2009205466A JP5404263B2 (ja) | 2009-09-07 | 2009-09-07 | 視差算出方法、および視差算出装置 |
| JP2009-205466 | 2009-09-07 |
Related Child Applications (2)
| Application Number | Title | Priority Date | Filing Date |
|---|---|---|---|
| US13/125,108 A-371-Of-International US8743183B2 (en) | 2009-09-07 | 2010-09-02 | Parallax calculation method and parallax calculation device |
| US14/249,721 Continuation US9338434B2 (en) | 2009-09-07 | 2014-04-10 | Parallax calculation method and parallax calculation device |
Publications (1)
| Publication Number | Publication Date |
|---|---|
| WO2011027564A1 true WO2011027564A1 (ja) | 2011-03-10 |
Family
ID=43649119
Family Applications (1)
| Application Number | Title | Priority Date | Filing Date |
|---|---|---|---|
| PCT/JP2010/005416 WO2011027564A1 (ja) | 2009-09-07 | 2010-09-02 | 視差算出方法、および視差算出装置 |
Country Status (5)
| Country | Link |
|---|---|
| US (2) | US8743183B2 (ja) |
| EP (3) | EP2476996B1 (ja) |
| JP (1) | JP5404263B2 (ja) |
| CN (2) | CN102203552B (ja) |
| WO (1) | WO2011027564A1 (ja) |
Cited By (4)
| Publication number | Priority date | Publication date | Assignee | Title |
|---|---|---|---|---|
| JP2013021634A (ja) * | 2011-07-14 | 2013-01-31 | Nippon Hoso Kyokai <Nhk> | 視差画像生成装置および視差画像生成プログラム |
| US8782803B2 (en) | 2010-04-14 | 2014-07-15 | Legitmix, Inc. | System and method of encrypting a derivative work using a cipher created from its source |
| JP2016192108A (ja) * | 2015-03-31 | 2016-11-10 | 公益財団法人鉄道総合技術研究所 | ステレオ画像処理方法およびその装置 |
| JP2017199220A (ja) * | 2016-04-27 | 2017-11-02 | 株式会社リコー | 情報処理装置、撮像装置、移動体制御システム、情報処理方法およびプログラム |
Families Citing this family (13)
| Publication number | Priority date | Publication date | Assignee | Title |
|---|---|---|---|---|
| JP2013109010A (ja) * | 2011-11-17 | 2013-06-06 | Canon Inc | 立体映像撮影システム |
| KR101877570B1 (ko) * | 2012-04-04 | 2018-07-11 | 현대자동차주식회사 | Av 영상 기반의 주차위치 설정 장치 및 그 방법 |
| EP2669846B1 (en) * | 2012-06-01 | 2017-11-01 | Ricoh Company, Ltd. | Target recognition system and target recognition method executed by the target recognition system, target recognition program executed on the target recognition system, and recording medium storing the target recognition program |
| TWI502544B (zh) * | 2013-03-07 | 2015-10-01 | Acer Inc | 立體影像的視差估算方法 |
| US9977998B2 (en) | 2015-04-27 | 2018-05-22 | Sony Corporation | Method and system for processing one or more multi-channel images |
| EP3139346B1 (en) * | 2015-09-01 | 2019-01-16 | Veoneer Sweden AB | Vision system for a motor vehicle and method of controlling a vision system |
| JP6668763B2 (ja) * | 2016-01-13 | 2020-03-18 | セイコーエプソン株式会社 | 画像認識装置、画像認識方法および画像認識ユニット |
| US10582179B2 (en) * | 2016-02-01 | 2020-03-03 | Samsung Electronics Co., Ltd. | Method and apparatus for processing binocular disparity image |
| CN107025660B (zh) * | 2016-02-01 | 2020-07-10 | 北京三星通信技术研究有限公司 | 一种确定双目动态视觉传感器图像视差的方法和装置 |
| US10796425B1 (en) * | 2016-09-06 | 2020-10-06 | Amazon Technologies, Inc. | Imagery-based member deformation gauge |
| JP6986683B2 (ja) * | 2018-01-05 | 2021-12-22 | パナソニックIpマネジメント株式会社 | 視差値算出装置、視差値算出方法及びプログラム |
| CN109255387A (zh) * | 2018-09-20 | 2019-01-22 | 珠海市君天电子科技有限公司 | 一种图像匹配方法、装置、电子设备及存储介质 |
| JP6823839B2 (ja) * | 2019-06-17 | 2021-02-03 | 大日本印刷株式会社 | 判定装置、判定装置の制御方法、判定システム、判定システムの制御方法、及び、プログラム |
Citations (6)
| Publication number | Priority date | Publication date | Assignee | Title |
|---|---|---|---|---|
| JPH05141919A (ja) * | 1991-11-01 | 1993-06-08 | Aisin Seiki Co Ltd | 左,右カメラの撮像画像の対応点検索方法 |
| JPH07152914A (ja) * | 1993-11-26 | 1995-06-16 | Fuji Heavy Ind Ltd | 車輌用距離検出装置 |
| JP2000348175A (ja) * | 1999-06-08 | 2000-12-15 | Sony Corp | 対応点検出装置及び方法 |
| JP2001351200A (ja) | 2000-06-09 | 2001-12-21 | Nissan Motor Co Ltd | 車載用物体検知装置 |
| JP2007085773A (ja) | 2005-09-20 | 2007-04-05 | Toyota Motor Corp | 車両用画像処理装置 |
| JP2009205466A (ja) | 2008-02-28 | 2009-09-10 | Seiko Epson Corp | 画像出力方法、画像出力装置および画像出力プログラム |
Family Cites Families (11)
| Publication number | Priority date | Publication date | Assignee | Title |
|---|---|---|---|---|
| JPH0581410A (ja) * | 1991-09-19 | 1993-04-02 | Fujitsu Ltd | 対応点探索方式 |
| JPH05215547A (ja) * | 1992-02-06 | 1993-08-24 | Nippon Telegr & Teleph Corp <Ntt> | ステレオ画像間対応点決定方法 |
| DE19636028C1 (de) | 1996-09-05 | 1997-11-20 | Daimler Benz Ag | Verfahren zur Stereobild-Objektdetektion |
| CN1141670C (zh) * | 2001-07-27 | 2004-03-10 | 南开大学 | 用二维编码对运动物体进行三维跟踪测量的方法 |
| JP3822515B2 (ja) * | 2002-03-29 | 2006-09-20 | 株式会社東芝 | 障害物検知装置及びその方法 |
| JP3977776B2 (ja) * | 2003-03-13 | 2007-09-19 | 株式会社東芝 | ステレオキャリブレーション装置とそれを用いたステレオ画像監視装置 |
| EP1779295A4 (en) | 2004-07-26 | 2012-07-04 | Automotive Systems Lab | SYSTEM FOR PROTECTING USERS OF THE ROAD IN A DANGER SITUATION |
| WO2007124502A2 (en) * | 2006-04-21 | 2007-11-01 | Sarnoff Corporation | Apparatus and method for object detection and tracking and roadway awareness using stereo cameras |
| KR20080076628A (ko) * | 2007-02-16 | 2008-08-20 | 삼성전자주식회사 | 영상의 입체감 향상을 위한 입체영상 표시장치 및 그 방법 |
| CN101321299B (zh) * | 2007-06-04 | 2011-06-01 | 华为技术有限公司 | 视差生成方法、生成单元以及三维视频生成方法及装置 |
| CN100586199C (zh) * | 2008-03-30 | 2010-01-27 | 深圳华为通信技术有限公司 | 视差获取方法和装置 |
-
2009
- 2009-09-07 JP JP2009205466A patent/JP5404263B2/ja not_active Expired - Fee Related
-
2010
- 2010-09-02 CN CN2010800031211A patent/CN102203552B/zh not_active Expired - Fee Related
- 2010-09-02 EP EP10813515.3A patent/EP2476996B1/en not_active Not-in-force
- 2010-09-02 CN CN2013101493105A patent/CN103278133A/zh active Pending
- 2010-09-02 EP EP13175943.3A patent/EP2650639B1/en not_active Not-in-force
- 2010-09-02 EP EP14162784.4A patent/EP2752641A1/en not_active Withdrawn
- 2010-09-02 US US13/125,108 patent/US8743183B2/en not_active Expired - Fee Related
- 2010-09-02 WO PCT/JP2010/005416 patent/WO2011027564A1/ja active Application Filing
-
2014
- 2014-04-10 US US14/249,721 patent/US9338434B2/en active Active
Patent Citations (6)
| Publication number | Priority date | Publication date | Assignee | Title |
|---|---|---|---|---|
| JPH05141919A (ja) * | 1991-11-01 | 1993-06-08 | Aisin Seiki Co Ltd | 左,右カメラの撮像画像の対応点検索方法 |
| JPH07152914A (ja) * | 1993-11-26 | 1995-06-16 | Fuji Heavy Ind Ltd | 車輌用距離検出装置 |
| JP2000348175A (ja) * | 1999-06-08 | 2000-12-15 | Sony Corp | 対応点検出装置及び方法 |
| JP2001351200A (ja) | 2000-06-09 | 2001-12-21 | Nissan Motor Co Ltd | 車載用物体検知装置 |
| JP2007085773A (ja) | 2005-09-20 | 2007-04-05 | Toyota Motor Corp | 車両用画像処理装置 |
| JP2009205466A (ja) | 2008-02-28 | 2009-09-10 | Seiko Epson Corp | 画像出力方法、画像出力装置および画像出力プログラム |
Non-Patent Citations (1)
| Title |
|---|
| See also references of EP2476996A4 |
Cited By (4)
| Publication number | Priority date | Publication date | Assignee | Title |
|---|---|---|---|---|
| US8782803B2 (en) | 2010-04-14 | 2014-07-15 | Legitmix, Inc. | System and method of encrypting a derivative work using a cipher created from its source |
| JP2013021634A (ja) * | 2011-07-14 | 2013-01-31 | Nippon Hoso Kyokai <Nhk> | 視差画像生成装置および視差画像生成プログラム |
| JP2016192108A (ja) * | 2015-03-31 | 2016-11-10 | 公益財団法人鉄道総合技術研究所 | ステレオ画像処理方法およびその装置 |
| JP2017199220A (ja) * | 2016-04-27 | 2017-11-02 | 株式会社リコー | 情報処理装置、撮像装置、移動体制御システム、情報処理方法およびプログラム |
Also Published As
| Publication number | Publication date |
|---|---|
| CN103278133A (zh) | 2013-09-04 |
| EP2650639A1 (en) | 2013-10-16 |
| US20140218485A1 (en) | 2014-08-07 |
| EP2476996B1 (en) | 2014-03-12 |
| EP2650639B1 (en) | 2014-11-26 |
| US9338434B2 (en) | 2016-05-10 |
| EP2752641A1 (en) | 2014-07-09 |
| JP2011058812A (ja) | 2011-03-24 |
| EP2476996A4 (en) | 2013-02-20 |
| CN102203552A (zh) | 2011-09-28 |
| US20110199462A1 (en) | 2011-08-18 |
| CN102203552B (zh) | 2013-06-05 |
| US8743183B2 (en) | 2014-06-03 |
| EP2476996A1 (en) | 2012-07-18 |
| JP5404263B2 (ja) | 2014-01-29 |
Similar Documents
| Publication | Publication Date | Title |
|---|---|---|
| WO2011027564A1 (ja) | 視差算出方法、および視差算出装置 | |
| CN102317954B (zh) | 检测对象的方法 | |
| JP5870273B2 (ja) | 物体検出装置、物体検出方法及びプログラム | |
| JP6151150B2 (ja) | 物体検出装置及びそれを用いた車両 | |
| JP4363295B2 (ja) | ステレオ画像による平面推定方法 | |
| JP4556798B2 (ja) | 画像処理装置 | |
| JP5752618B2 (ja) | ステレオ視差算出装置 | |
| EP2887313B1 (en) | Image processing apparatus, system, image processing method, and computer-readable recording medium | |
| JP2006236104A (ja) | 対象物判定装置 | |
| KR102010823B1 (ko) | 고정형 단일 카메라를 이용한 차량 속도 감지 방법 및 장치 | |
| US11889047B2 (en) | Image processing device and image processing method | |
| TW201433774A (zh) | 車輛規格測量處理裝置、車輛規格測量方法及記錄媒體 | |
| JP5548212B2 (ja) | 横断歩道標示検出方法および横断歩道標示検出装置 | |
| JP2017036981A (ja) | 段差検出装置及び段差検出方法 | |
| JP6543935B2 (ja) | 視差値導出装置、機器制御システム、移動体、ロボット、視差値導出方法、およびプログラム | |
| JP5981284B2 (ja) | 対象物検出装置、及び対象物検出方法 | |
| JP2009092551A (ja) | 障害物計測方法、障害物計測装置及び障害物計測システム | |
| JP6096601B2 (ja) | 駅ホーム転落検知装置 | |
| JP2012159470A (ja) | 車両用画像認識装置 | |
| JP2009186228A (ja) | 3次元計測装置 | |
| JP5579297B2 (ja) | 視差算出方法、および視差算出装置 | |
| KR20160063039A (ko) | 3차원 데이터를 이용한 도로 인식 방법 | |
| JP2001108434A (ja) | 距離測定方法及び距離測定装置 | |
| JP6570321B2 (ja) | 情報処理装置、情報処理方法及びプログラム | |
| JP7066580B2 (ja) | 画像処理装置 |
Legal Events
| Date | Code | Title | Description |
|---|---|---|---|
| WWE | Wipo information: entry into national phase |
Ref document number: 201080003121.1 Country of ref document: CN |
|
| WWE | Wipo information: entry into national phase |
Ref document number: 13125108 Country of ref document: US |
|
| 121 | Ep: the epo has been informed by wipo that ep was designated in this application |
Ref document number: 10813515 Country of ref document: EP Kind code of ref document: A1 |
|
| WWE | Wipo information: entry into national phase |
Ref document number: 2010813515 Country of ref document: EP |
|
| NENP | Non-entry into the national phase |
Ref country code: DE |