WO2010128575A1 - Automatic analysis device and analysis method - Google Patents
Automatic analysis device and analysis method Download PDFInfo
- Publication number
- WO2010128575A1 WO2010128575A1 PCT/JP2010/002631 JP2010002631W WO2010128575A1 WO 2010128575 A1 WO2010128575 A1 WO 2010128575A1 JP 2010002631 W JP2010002631 W JP 2010002631W WO 2010128575 A1 WO2010128575 A1 WO 2010128575A1
- Authority
- WO
- WIPO (PCT)
- Prior art keywords
- parameter
- expression
- abnormality
- value
- automatic analyzer
- Prior art date
Links
Images


Classifications
-
- G—PHYSICS
- G01—MEASURING; TESTING
- G01N—INVESTIGATING OR ANALYSING MATERIALS BY DETERMINING THEIR CHEMICAL OR PHYSICAL PROPERTIES
- G01N35/00—Automatic analysis not limited to methods or materials provided for in any single one of groups G01N1/00 - G01N33/00; Handling materials therefor
- G01N35/00584—Control arrangements for automatic analysers
- G01N35/00594—Quality control, including calibration or testing of components of the analyser
- G01N35/00603—Reinspection of samples
-
- G—PHYSICS
- G01—MEASURING; TESTING
- G01N—INVESTIGATING OR ANALYSING MATERIALS BY DETERMINING THEIR CHEMICAL OR PHYSICAL PROPERTIES
- G01N21/00—Investigating or analysing materials by the use of optical means, i.e. using sub-millimetre waves, infrared, visible or ultraviolet light
- G01N21/17—Systems in which incident light is modified in accordance with the properties of the material investigated
- G01N21/25—Colour; Spectral properties, i.e. comparison of effect of material on the light at two or more different wavelengths or wavelength bands
- G01N21/27—Colour; Spectral properties, i.e. comparison of effect of material on the light at two or more different wavelengths or wavelength bands using photo-electric detection ; circuits for computing concentration
- G01N21/272—Colour; Spectral properties, i.e. comparison of effect of material on the light at two or more different wavelengths or wavelength bands using photo-electric detection ; circuits for computing concentration for following a reaction, e.g. for determining photometrically a reaction rate (photometric cinetic analysis)
Definitions
- the present invention relates to an automatic analyzer for performing qualitative / quantitative analysis of biological samples such as blood and urine, and an analysis method, and more particularly, to an automatic analyzer and a method for analysis having a mechanism for measuring temporal changes in measured values.
- An automatic analyzer for clinical testing dispenses a certain amount of sample and reagent and causes them to stir and react.
- the absorbance of the reaction solution is measured over a certain period of time, and the concentration and activity value of the substance to be measured are determined based on the measurement result.
- reagents for each analysis item for analysis for clinical tests, in addition to the analyzer, reagents for each analysis item, standard solutions for calibrating the reagents, devices under analysis, and quality control samples to be measured to check the status of the reagents are required. It is. Other than these devices are combined to obtain the final analytical performance.
- the factors inside the apparatus that directly affect the analysis performance include, for example, a sampling mechanism, a reagent dispensing mechanism, a stirring mechanism, an optical system, a reaction vessel, and a thermostatic chamber. Further, factors other than the apparatus such as an automatic analyzer include the liquidity of reagents, samples, and control specimens.
- a conventional method for detecting anomalies in data at the time of measurement by the endpoint method includes a pro zone check.
- the protein may precipitate as a precipitate due to the influence of the salt concentration of the reagent composition. This precipitation may cause the reaction process to fluctuate, and in fact, it often appears in the latter half of the reaction time.
- This fluctuation occurs in the photometry point portion used for density calculation, it is impossible to obtain a measured value accurately.
- Patent Document 1 a method for determining the presence or absence of abnormality using reaction process data (absorbance time-series data)
- methods disclosed in Patent Document 1 and Patent Document 2 are known.
- a chemical reaction model is used in advance to generate and store reference time series data, and the reaction process data of the sample is compared with the reference time series data. judge.
- the change in absorbance is approximated by a function stored in advance, and abnormality is determined from the absorbance change calculated by the approximated function and the magnitude of the difference between the actually measured absorbances.
- An automatic analyzer for clinical examination measures the absorbance of a solution obtained by reacting a sample and a reagent at regular intervals, and measures the absorbance change rate and the final absorbance from the time-series absorbance. From these data, the concentration of the substance to be measured and the activity value of the enzyme are calculated.
- the automatic analyzer performs sampling, reagent dispensing, and agitation, and these processes include a plurality of error factors. Especially until now, the presence or level of agitation could not be quantitatively evaluated, and there was no judgment standard, so there was a certain defect such as good reproducibility and POKA (discontinuous measurement values). It was an ambiguous situation such as the presence or absence of clear measured values).
- the automatic analyzer detects abnormalities for the user from factors that directly affect the reaction, such as reagent dilution with reagent probe wash water or if the user accidentally mixes another solution with the reagent. Therefore, it is necessary to encourage re-inspection and equipment maintenance.
- Patent Document 1 discloses the following formula as a chemical reaction model. However, t represents time, x represents absorbance, and A0, A1, and k are parameters.
- Patent Document 2 discloses the following equation in addition to (Equation 1) as a function approximating the change in absorbance.
- t represents time
- x represents absorbance
- A, B, and k are parameters.
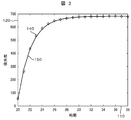
- FIG. 3 shows an example of the reaction process data (absorbance time-series data) for a certain item (TG; neutral fat) in biochemical examination and the result obtained by approximating the reaction process data by (Equation 1).
- the horizontal axis 110 represents the passage of time
- the vertical axis 120 represents the absorbance.
- Symbol 140 represents the absorbance actually measured at each time point
- curve 150 represents the result of approximating the reaction process data by (Equation 1).
- the actual reaction process data is approximated with high accuracy by (Equation 1).
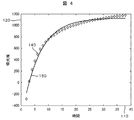
- FIG. 4 shows an example of a result obtained by approximating the reaction process data of another test item (TP: total protein) by (Equation 1).
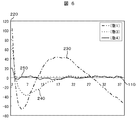
- FIG. 6 shows an error when using (Equation 1) and an error when using (Equation 3).
- the vertical axis 220 represents the error.
- An alternate long and short dash line 230 represents an approximation error at each time point when (Equation 1) is used, and a broken line 240 represents an error when (Equation 3) is used.
- the TP shown as an example that is difficult to approximate is a simple reaction in which the protein in the sample and the biuret reagent react to generate a blue color, but depending on the type of protein contained in the TP (mainly occupied by albumin and globulin) It is known that the reaction rate with the biuret reagent is different, and the reactivity with the reagent varies depending on the contents of albumin and globulin in the sample even if the sample has the same TP concentration. Therefore, when trying to evaluate the reaction based on the reactivity of the sample and the reagent, Patent Document 1 having only one reactivity parameter cannot be approximated accurately, and as an evaluation factor for detecting a reaction abnormality It was insufficient.
- Patent Document 1 and Patent Document 2 compare photometric data at each time with a value calculated by an approximate function, obtain a square error over the entire photometric time, and determine an abnormality based on this value. Therefore, although the magnitude of the divergence between the measured data and the approximate data is known, it is difficult to know the divergence pattern (where the divergence occurs during the measurement time, whether it is larger or smaller than the approximate value), and therefore the divergence occurs. It was also difficult to estimate the cause.
- the configuration of the present invention for solving the above problems is as follows.
- a storage mechanism that stores an approximate expression of a time change of a measurement value that is associated with each measurement item or each sample, and a parameter of the approximate expression that is stored in the storage mechanism so as to correspond to an actual measurement value
- An automatic analyzer comprising: a parameter optimization mechanism; and a determination mechanism that determines whether there is an abnormality based on the parameter optimized by the parameter optimization mechanism.
- the storage mechanism is a mechanism for storing information, and any mechanism that can store information, such as a semiconductor memory, a hard disk storage device, a floppy (registered trademark) disk storage device, a magneto-optical storage device, etc. It may be. Usually, it is often provided inside the housing of the control computer, but may be an independent mechanism.
- the parameter optimization mechanism is a mechanism that determines each parameter of an approximate expression having a plurality of parameters so as to best match actual data by using a parameter fitting algorithm such as a least square method. Usually, it is comprised from the software incorporated in the computer for control, a dedicated computer, etc., and the hardware which operates the software. The mechanism is not limited to this, and any mechanism may be used as long as it can perform parameter fitting and determine parameters.
- the determination mechanism is a determination of whether there is an abnormality in the reaction based on the parameter determined by the parameter optimization mechanism by comparison with a threshold value or multivariate analysis, for example, a method such as Mahalanobis Taguchi method, neural network, or the like, or It is a mechanism for obtaining proof that the reaction has been completed normally. Usually, it is comprised from the software incorporated in the computer for control, a dedicated computer, etc., and the hardware which operates the software. However, the present invention is not limited to this, and any mechanism may be used as long as it is capable of obtaining the presence / absence of an abnormality or a proof that the reaction has been normally completed based on parameters.
- a plurality of approximate expressions that accurately fit the curved curve of the endpoint method are prepared from the reaction process data, and an accurate approximate expression is selected in advance for each item or sample. Calculates parameters that closely match the measured data for the selected approximate expression (coefficients, intercepts, etc. of the approximate expression), and whether or not the reaction was properly performed from the numerical values of the multiple parameters obtained from it Is determined from the deviation from the original value. For example, device abnormalities, reagent deterioration, and accuracy control can be determined for each continuous and single inspection.
- the multiple approximate expressions are, for example, the following expressions.
- the parameters a0, a1, a2, ai, k1, k2, ki, bi, ci, di in the above formula are reduced so that the difference between the measured value of the absorbance at the measurement time and the time series data obtained by the approximate formula becomes small.
- Pi, qi, ri can be calculated and the presence or absence of an abnormality can be determined based on the parameter values.
- the measurement time of the absorbance is t
- the absorbance is x
- the symbol representing multiplication is *
- ⁇ ⁇ is changed from 1 to n in the expression in ⁇
- the symbol representing the sum, ⁇ [n ] Change the i in the expression in ⁇ from 1 to n and add the symbol ⁇ [m] ⁇ to change the i in the expression in ⁇ from 1 to m and add
- the symbol representing the sum, ⁇ [l] ⁇ is changed from i to 1 in the expression in ⁇
- the sum representing the sum, n, m, and l are integers of 1 or more.
- the automatic analysis apparatus and the automatic analysis method of the present invention it is possible to check the abnormality of the apparatus from the daily inspection data for more inspection items than before, which can contribute to maintaining the performance of the apparatus.
- the reaction rate changes compared to the normal case.
- monitoring the parameters related to the reaction rate among the parameters of the approximate function will check the performance of the stirring mechanism over time.
- the need for replacement can be positively notified from the automatic analyzer side to the device user. It is possible to quantify the presence / absence and level of agitation where the evaluation is ambiguous, and it is possible to verify and determine the abnormality parameters of the agitation mechanism and the optimum parameters for each reagent.
- the reaction rate is affected.
- the degree of slowness of the reaction can be quantified, it is possible to detect a reaction abnormality. Reagent performance can be evaluated, reagent deterioration due to human error in daily inspection can be detected, and erroneous data output can be prevented from being overlooked.
- reaction process data makes it possible to evaluate individual measured specimens, and therefore it becomes a new evaluation standard that gives reliability to the measurement results of each specimen, which was not possible with previous evaluation methods. Can do.
- dividing the parameter distribution into an abnormal distribution and a normal distribution in advance it is possible to guarantee the measurement with a quantitative evaluation criterion for the measurement result of the general specimen showing the parameters belonging to the normal distribution. If the measurement result can be guaranteed, it can be expected that there is no need to re-inspect the inspection result that did not match the previous value or the inspection result of the panic value.
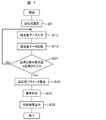
- the figure showing the processing flow of a 1st Example The figure which shows the outline of a structure of the automatic analyzer to which this invention is applied.
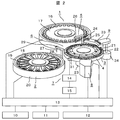
- FIG. 2 is a diagram showing a schematic configuration of a biochemical automatic analyzer to which the present invention is applied.
- 1 is a sample disk
- 2 is a reagent disk
- 3 is a reaction disk
- 4 is a reaction tank
- 5 is a sampling mechanism
- 6 is a pipetting mechanism
- 7 is a stirring mechanism
- 8 is a photometric mechanism
- 9 is a cleaning mechanism
- 10 is a display unit
- 11 is an input unit
- 12 is a storage unit
- 13 is a control unit
- 14 is a piezoelectric element driver
- 15 is a stirring mechanism controller
- 16 is a sample container
- 17 and 19 are circular disks
- 18 is a reagent bottle
- 20 is a cool box
- 21 is a reaction vessel
- 22 is a reaction vessel holder
- 23 is a drive mechanism
- 24 and 27 are probes
- 25 and 28 are support shafts
- 26 and 29 are arms
- 31 is a fixing portion
- 32 is an
- the storage unit stores analysis parameters, the number of times each reagent bottle can be analyzed, the maximum number of times that analysis can be performed, a calibration result, an analysis result, and the like.
- Sample analysis is performed in the order of data processing such as sampling, reagent dispensing, stirring, photometry, washing of the reaction vessel, and concentration conversion as described below.
- the sample disk 1 is controlled by the control unit 13 via the display unit 10.
- a plurality of sample containers 16 are arranged side by side on the circumference, and move below the sampling probe 24 in accordance with the order of samples to be analyzed.
- a predetermined amount of the sample in the sample container 16 is dispensed into the reaction container 21 by a sample pump connected to the sample sampling mechanism 5.
- the reaction vessel 21 into which the sample has been dispensed moves through the reaction tank 4 to the first reagent addition position.
- a predetermined amount of reagent sucked from the reagent container 18 by a reagent pump (not shown) connected to the reagent dispensing probe 6 is added to the moved reaction container 16.
- the reaction vessel 21 after the addition of the first reagent moves to the position of the stirring mechanism 7 and the first stirring is performed. Such reagent addition and stirring is performed for the first to fourth reagents.
- the reaction vessel 21 in which the contents are agitated passes through the light beam emitted from the light source, and the absorbance at this time is detected by the photometric mechanism 8 of the multi-wavelength photometer.
- the detected absorbance signal enters the control unit 13 and is converted into the concentration of the specimen. Further, the control unit 13 simultaneously determines abnormality based on the absorbance.
- the data after concentration conversion is stored in the storage unit 12 and displayed on the display unit. After completion of photometry, the reaction vessel 21 is moved to the position of the cleaning mechanism 9 and cleaned, and used for the next analysis.
- FIG. 1 is a diagram illustrating processing steps of a part related to abnormality determination in the control unit 13.
- an approximate expression corresponding to the test item is selected from a plurality of approximate expressions representing changes in absorbance over time.
- an approximate expression for example, the functions shown in (Expression 1) to (Expression 6) are stored, and the approximate expression most suitable for each inspection item is stored as a table, and the table is used to correspond to the inspection item. Select the approximate expression.
- step S10 absorbance data of one measurement or a plurality of measurement averages is input from the photometry mechanism 8.
- the photometry mechanism 8 In a measurement method that uses two-wavelength light of a wavelength (primary wavelength) where the absorbance largely changes due to a change in color tone due to the reaction between the reagent and the specimen, and a wavelength (subwavelength) light whose absorbance hardly changes, the dominant wavelength
- the difference between the light absorbance and the sub-wavelength light absorbance is input as absorbance data.
- step S15 the inputted absorbance data is stored.
- step S20 it is determined whether or not the absorbance data necessary for the following processing is stored. If not stored, the processing returns to S10, and the absorbance data is input until the necessary number of data is stored. Repeat the memory. If the necessary number of data has been accumulated, the process proceeds to step S25.
- step S25 the value of the parameter in the equation is calculated so that the time change of the absorbance represented by the approximate expression selected in step S5 and the time change of the actual absorbance are as small as possible.
- the parameters in the equation are set so that the square error between the measured and stored absorbance data and the absorbance at the same time as the time at which the absorbance is measured is calculated as much as possible. Determine the value.
- An existing least square calculation method can be used to calculate the parameter value. As a method that can handle various types of mathematical expressions, for example, a parameter value that minimizes the square error is calculated by the steepest descent method.
- step S25 the difference between the absorbance calculated by the approximate expression and the absorbance actually measured needs to be sufficiently small.
- parameters are set so that the difference between the absorbance calculated by the approximate expression with respect to normal data is sufficiently small as shown in FIGS. Was difficult.
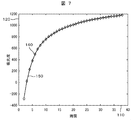
- FIG. 7 shows the result approximated by (Equation 4) using the same data as the absorbance data shown in FIGS.
- a solid line 250 in FIG. 6 represents an approximation error according to (Equation 4). It can be seen that the error can be greatly reduced as compared with the case of using (Equation 1) and (Equation 3) according to the prior art.
- step S30 the presence or absence of abnormality is determined based on the parameter value of the approximate expression calculated in step S25.
- a distribution of parameter values of normal data is obtained in advance, and when a parameter value deviating from this distribution is obtained, it is determined that there is an abnormality.
- FIG. 8 shows the distribution of the parameters k1 and k2 when the data measured normally and the data measured in the state where the stirring condition is abnormal are approximated by (Equation 4).
- the horizontal axis 310 represents the value of k1
- the vertical axis 320 represents the value of k2.
- Symbol 330 represents a parameter value obtained from absorbance data under normal stirring conditions
- symbol 340 represents a parameter value obtained from absorbance data under abnormal stirring conditions.
- An ellipse 360 schematically shows an approximate distribution range of parameter values obtained from absorbance data under normal stirring conditions. When the parameter value obtained from the measured absorbance deviates from this distribution, it can be determined that the stirring is abnormal.
- the Mahalanobis distance between the parameter calculated in step S25 and the parameter value distribution of normally measured data is calculated.
- the distance is a certain value or more, it can be determined as abnormal.
- the determination method in step S30 according to the present invention is not limited to this method.
- a condition such as a threshold value for determining an abnormality in each parameter value may be defined, and an abnormality may be determined when the condition is satisfied with several parameter values.
- a neural network that determines the presence or absence of abnormality from the parameter value may be constructed and used.
- the abnormality may be determined using both the approximate parameter distribution for the data measured as normal data and the parameter distribution for abnormal data.
- normal data and abnormal data collected in advance are used to obtain the parameter distribution of normal data and the parameter distribution of abnormal data, and to identify the parameters of normal data and abnormal data in the parameter space.
- the identification boundary is formed. In the distribution shown in FIG. 8, for example, a broken line 350 is set as an identification boundary. Whether the parameter calculated in step S25 is on the identification boundary or not is determined as abnormal or normal.
- Various existing pattern recognition techniques such as multivariate analysis and neural network can be applied as a method for determining the discrimination boundary.
- the cause of an abnormality by collecting in advance anomaly data whose cause is known. For example, the parameter distribution of normal data, the parameter distribution of abnormal stirring data, and the parameter distribution of data at the time of reagent deterioration are obtained in advance, and the distribution closest to the parameter calculated in step S25 is examined.
- it is closest to the parameter distribution of the stirring abnormality data it can be estimated that stirring is abnormal
- it is closest to the parameter distribution of the data at the time of reagent deterioration it can be estimated that the reagent is deteriorated.
- reagent deterioration and stirring abnormality are given as examples, but various abnormal causes can be similarly estimated.
- various existing pattern recognition techniques such as multivariate analysis and neural network can be applied.
- step S35 the normal / abnormal determination result in step S30 is output.
- the determination result output method various methods can be used depending on the type of abnormality to be detected.
- FIG. 9 shows the result of examining the parameter distribution by approximating the same data as the absorbance data under normal stirring conditions and the absorbance data under abnormal stirring conditions used in FIG.
- the horizontal axis 410 represents the value of A1
- the vertical axis 420 represents the value of k.
- Symbol 430 represents a parameter value obtained from the absorbance data under normal stirring conditions
- symbol 440 represents a parameter value obtained from the absorbance data under abnormal stirring conditions.
- the first embodiment of the present invention described above can be used as follows in the daily operation of the automatic analyzer.
- Performance evaluation of agitation mechanism based on daily inspection data The parameter value of the approximate expression is calculated from the reaction process of daily inspection data, quality control sample data, and patient specimen data. The parameter value is stored and the daily parameter value is monitored. If an abnormality is detected based on the parameter value, it is possible to indicate the possibility of a failure of the stirring mechanism or the like.
- performance management of a stirring mechanism and the like can be performed based on changes in parameter values over time, which can contribute to maintaining the performance of the apparatus.
- the reactivity of the reagent can be evaluated by monitoring the approximate expression parameter from the result of the quality control sample and the patient specimen data in the daily examination. it can. If the user accidentally mixes another reagent or the reagent in the reagent bottle is diluted, the reaction becomes slow, and the present invention can detect the slow reaction as reagent deterioration. It becomes possible. Approximate formula calculation parameters for each item are recorded in the device every day, and when deviating from the approximate formula calculation parameter values determined in advance in a test, reagent deterioration is detected and an alarm is issued to inform the user of the device. Can do.
- the threshold value may be automatically determined from approximate formula calculation parameters for each item for several days instead of a predetermined numerical value.
- the device user managed reagent lot change information in a list outside the device, but since the device detects a reagent lot change by installing the function of the present invention, the reagent is based on that record. It is possible to recognize the usage frequency of the reagent and assist in ordering the reagent order and the inventory status.
- (4) Evaluation of reagent reactivity According to the present invention, when examining a reagent to be purchased, an approximate expression parameter is calculated from a plurality of types of reagents in the same item, and the reactivity evaluation based on the parameter value becomes possible. Also, in reagent development, it is possible to evaluate the reactivity of the reagent by the approximate equation parameter, and the reaction is good and a stable reagent standard can be determined.
- Index of quality control an approximate expression parameter is calculated from the reaction process of the standard solution and the control in each measurement item, and it can be used as an index of the quality control sample by monitoring it.
- Evaluation method of characteristics and stirring level of each reagent According to the evaluation method of the present invention, an optimal stirring level can be examined for the characteristics of each reagent of each measurement item.
- Detection of reagent dilution by washing water of reagent probe It is difficult to notice that the measured value is high because the slow reaction caused by the reagent dilution cannot be checked with the measured value alone.
- the slowness of the reaction can be evaluated by the numerical value of the approximate expression calculation parameter obtained from the reaction process. By displaying the evaluation value of the degree of slowness together with the measured value, the reaction situation can be grasped, so that an accurate result can be reported.
- the ability to detect slow reactions is to enable the following functions: -Quantitative evaluation function for reagent deterioration-Function for detecting that the reagent has been diluted with wash water-Function for detecting that the user has mixed another reagent by mistake (8) Reliability of test data Guarantee Since the approximate expression calculation parameters are evaluated using the reaction process of each test data, it can be an evaluation value of the certainty of normal reaction for the measurement result of the analyzed patient specimen. For example, if the previous value of a certain item differs from the current measured value in the measurement of a patient sample by a biochemical automatic analyzer, the laboratory technician will look at other related items and the reaction process of that item to determine whether to retest to decide. If the value of the approximate expression calculation parameter exists within the normal reaction distribution as one of the indices in that case, the result of reporting that the reactivity between the sample and the sample is not problematic without re-examination. it can.
- FIG. 2 The outline of the configuration of the biochemical automatic analyzer according to the second embodiment of the present invention is shown in FIG. 2 as in the first embodiment. Since the operation other than the control unit 13 is the same as that of the first embodiment, detailed description thereof is omitted.
- FIG. 1 Details of the process for determining the presence or absence of an abnormality from the absorbance in the second embodiment will be described with reference to FIG. 1 is the same as the process indicated by the same reference numeral as in FIG. 1, and detailed description thereof will be omitted below.
- step S110 the parameter value of the approximate expression calculated in step S25 is stored.
- measurement is performed a plurality of times on a specific sample such as a quality control sample.
- step S120 it is determined whether or not a plurality of measurements on the same specific sample have been completed. For example, the number of measurements to be performed may be determined in advance, and it may be determined whether or not the predetermined number of measurements have been completed. If the measurement is completed, the process proceeds to step S140. If not completed, the process waits for the start of the next measurement in step S130. When the measurement is started, the process proceeds to step S10, and input of absorbance data in the next measurement is started.
- step S140 the distribution of the parameter values stored in step S110 is obtained. Specifically, an average value, variance, covariance, etc. are obtained. A histogram may be calculated.
- step S150 the presence / absence of an abnormality is determined based on the numerical value obtained in step S140.
- the same sample is measured a plurality of times in advance while the apparatus is in a normal state, parameter values of approximate expressions are obtained, and parameter value distributions are stored.
- the parameter value distribution obtained in step S140 is compared with the stored parameter value distribution. When the distribution is the same, it is determined that the distribution is normal, and when the distribution is different, it is determined that the distribution is abnormal.
- a statistical test method can be used to determine whether the distributions are different. Further, a threshold value may be provided for the average value or variance of the parameters, and it may be determined whether the distribution is different depending on whether it is larger than the threshold value.
- the parameter value distribution for the same sample in a state where the apparatus is abnormal is obtained and stored in advance, and the normal distribution depends on whether the parameter value distribution obtained in step S140 is close to the normal distribution or the abnormal distribution.
- An abnormality may be determined. It is also possible to store a plurality of parameter distributions at the time of an abnormal condition whose cause of abnormality is known, and investigate which distribution the parameter value distribution obtained in step S140 is closest to. When the closest distribution is a distribution in an abnormal state, the cause of the abnormality causing the distribution is set as an estimated abnormality cause.
- the stirring mechanism at the time of shipment can be inspected quantitatively.
- a predetermined sample is measured to obtain a reaction process.
- the approximate expression in the obtained reaction process is calculated, and the calculation parameters are calculated. Measure multiple times using similar reagents and samples to check the numerical values and variations of the calculation parameters.
- the performance of the stirring mechanism can be confirmed by comparing with a set reference value. Not only variations in measured values, but also variations and magnitudes of approximate expression calculation parameters are criteria for evaluating whether normal stirring is being performed. Until now, the presence or absence of agitation could not be evaluated, and there was no criteria for judgment, so the evaluation of reproducibility was unclear. According to the present invention, it is possible to quantitatively evaluate the presence or absence of stirring, the difference in stirring level, and the like.
- the apparatus configuration shown in FIG. 2 and the processing steps shown in FIG. 1 are the same as those in the first embodiment. Since only the approximate expression parameter calculation method in step S25 is different from the approximate expression selected in step S5 in FIG. 1, these two types of processing steps will be described in detail.
- a mathematical expression expressing the absorbance x as a function of time t is used as a mathematical expression that can be selected in step S5.
- a differential equation is used as the mathematical expression.
- a differential equation is often used, but in this embodiment, the theoretical equation can be used as it is.
- time is t
- absorbance is x
- ⁇ ⁇ is changed from i in the expression in ⁇ from 0 to n
- a sum representing the sum n is an integer of 1 or more
- fi (t, x) is t
- a function including a time derivative of x or any order of x and fi (t, x) includes a case where it is a constant
- qi is a parameter
- a differential equation of the form expressed by the following expression is Is available.
- step S25 the value of the parameter included in (Expression 7) is determined using the stored absorbance data. Since the absorbance is stored as time series data, it is possible to approximately calculate the time derivative by calculating the difference. Therefore, since values corresponding to fi (t, x) in (Expression 7) at time t at which the absorbance was measured are obtained, if these values are obtained at a plurality of time points, (Equation 7) becomes fi (t, Since it is expressed in the form of a linear combination of x), the value of the parameter qi can be easily obtained by the least square method.
- the change in absorbance x with time is expressed by the mathematical formula shown in (Formula 8).
- (Formula 8) can be transformed into the form of (Formula 9) by setting x (t) as the left side and the remaining term as the right side.
- the differential equation derived from the chemical reaction kinetics can be used as it is by making the equation representing the change in absorbance with time into a differential equation, Compared to the case where the absorbance is expressed as a function of time t, the least square method for determining the parameters can be easily calculated.
- the automatic analyzer to which the present invention is applied can check the abnormality of the apparatus from the daily inspection data in more inspection items than before, and the apparatus Can contribute to the maintenance of performance.
- Axis 330 representing symbol 340 representing the values of approximate equation parameters k1, k2 under normal stirring conditions
- Symbol 350 representing values of approximate equation parameters k1, k2 under abnormal stirring conditions Approximate parameters and parameters under normal stirring conditions
- Example of straight line for identifying approximate expression parameter in condition 360 Distribution range 410 of approximate expression parameter in normal stirring condition
- Axis 420 representing the value of parameter A1 of
- Axis 430 representing the value of parameter k in Equation 1
- Symbol 440 representing the value of approximate expression parameter A1, k under normal stirring conditions Approximate expression parameter A1, under abnormal stirring conditions
Abstract
Description
(1)標準液を使用したキャリブレーション
各項目の試薬ボトルごとに校正を実施する。ブランク液と標準液を測定して、原点の決定,単位濃度あたりの吸光度を算出し、換算係数(Kファクターと以下は略す。)を算出する。一般的には、吸光度の大きさ,Kファクターの経時的な変動を臨床検査技師が確認して、キャリブレーション結果の良否を判断する。
(2)精度管理
キャリブレーション後に濃度既知の精度管理試料を測定し、基準値との差を確認する。また、患者検体を測定中は、一定時間ごとに定期的に精度管理試料を測定して、許容値とのずれを確認する。許容値を超えたときに、試薬,装置、いずれかに問題が発生しているとして点検する。 When an automated analyzer is used daily, it is necessary to check these factors to determine whether a clinical test can be performed normally. The factor is confirmed as follows, for example.
(1) Calibration using standard solution Calibration is performed for each reagent bottle of each item. The blank solution and the standard solution are measured, the origin is determined, the absorbance per unit concentration is calculated, and the conversion factor (K factor and hereinafter abbreviated) is calculated. In general, a clinical technician confirms the change in the magnitude of absorbance and the K factor over time, and determines the quality of the calibration result.
(2) Accuracy control After calibration, measure an accuracy-controlled sample with a known concentration and confirm the difference from the reference value. In addition, during measurement of a patient sample, the quality control sample is measured periodically at regular time intervals to check for deviation from the allowable value. If the allowable value is exceeded, check that there is a problem with the reagent or the device.
x=A/(1+kt)+B …(数3) x = −kt + B (Equation 2)
x = A / (1 + kt) + B (Expression 3)
…(数4)
x=a0+Σ{ai*exp(-ki*t)} …(数5)
x=a0+Σ[n]{ai*exp(-ki*t)}
+Σ[m]{bi/(ci+di*t)}
+Σ[l]{(pi/(exp(qi*t)+ri)) …(数6) x = a0 + a1 * exp (−k1 * t) + a2 * exp (−k2 * t)
... (Equation 4)
x = a0 + Σ {ai * exp (−ki * t)} (Formula 5)
x = a0 + Σ [n] {ai * exp (−ki * t)}
+ Σ [m] {bi / (ci + di * t)}
+ Σ [l] {(pi / (exp (qi * t) + ri)) (Expression 6)
が記憶されたかどうかを判定し、記憶されていない場合には処理をS10に戻し、必要なデータ数が記憶されるまで、吸光度データの入力,記憶を繰り返す。必要なデータ数が蓄積された場合には処理をステップS25に移す。 The absorbance is measured a plurality of times as time passes. In step S10, absorbance data of one measurement or a plurality of measurement averages is input from the photometry mechanism 8. In a measurement method that uses two-wavelength light of a wavelength (primary wavelength) where the absorbance largely changes due to a change in color tone due to the reaction between the reagent and the specimen, and a wavelength (subwavelength) light whose absorbance hardly changes, the dominant wavelength The difference between the light absorbance and the sub-wavelength light absorbance is input as absorbance data. In step S15, the inputted absorbance data is stored. In step S20, it is determined whether or not the absorbance data necessary for the following processing is stored. If not stored, the processing returns to S10, and the absorbance data is input until the necessary number of data is stored. Repeat the memory. If the necessary number of data has been accumulated, the process proceeds to step S25.
(1)日常の検査データで攪拌機構の性能評価
日常の検査データ,精度管理試料データ,患者検体データの反応過程から近似式のパラメータ値を算出する。パラメータ値は記憶され日々のパラメータ値をモニタリングする。パラメータ値に基づき異常が検出された場合には、攪拌機構などの不良の可能性を指し示すことができる。本発明によれば、パラメータ値の経時変化から攪拌機構などの性能管理が可能になり装置の性能維持に貢献することができる。
(2)試薬劣化の検知
本発明によれば、試薬の反応性を精度管理試料の結果や日常の検査における患者検体データから近似式パラメータをモニタリングすることによって、試薬の反応性を評価することができる。装置使用者が誤って、別の試薬を混入させてしまった場合や試薬ボトル中の試薬が希釈されてしまった場合、反応が緩慢になり本発明によってその緩慢反応を試薬劣化として検知することが可能になる。装置には日々の各項目の近似式計算パラメータが記録されており、あるテストにおいてあらかじめ定められた近似式計算パラメータの数値から逸脱した場合、試薬劣化を検知しアラームを発し装置使用者に知らせることができる。あらかじめ定められた数値ではなく、数日間分の各項目における近似式計算パラメータからその閾値を自動的に定めるようにしてもよい。
(3)試薬ロット変更の記録
本発明によれば、装置使用者が前回と異なるロットの試薬を補充すると試薬の反応性が異なり、近似式パラメータによって検知することができる。試薬のロットが変わるときキャリブレーションを行わないと間違った測定値が算出されてしまう危険性がある。本発明を搭載した装置では、試薬ロットの変更を自動検知しキャリブレーションが行われなかった場合にアラームを発し、キャリブレーションを行うように促し間違った測定値の算出を防ぐことが可能になる。試薬ロット変更およびキャリブレーションの実施は装置の記憶部に記録される。これまでは装置使用者が試薬のロット変更情報を装置外のリストで管理していたが、本発明の機能を搭載することによって装置が試薬ロット変更を検知するため、その記録をもとに試薬の使用頻度を認識し試薬発注や在庫状況の把握を支援することが可能になる。
(4)試薬反応性の評価
本発明によれば、購入する試薬を検討する際に同一項目において複数種類の試薬から近似式パラメータを算出し、パラメータ値に基づいた反応性評価が可能になる。また、試薬開発においても近似式パラメータにより試薬の反応性を評価することが可能になり反応が良く、安定的な試薬の基準を定めることができる。
(5)精度管理の指標
本発明によれば、各測定項目において標準液とコントロールの反応過程から近似式パラメータを算出し、それをモニタリングすることにより精度管理試料の指標とすることができる。
(6)各試薬の特性と攪拌レベルの評価方法
本発明の評価方法によれば、各測定項目の各試薬の特性に対して最適な攪拌レベルを検討することができる。
(7)試薬プローブの洗浄水による試薬希釈検知
測定値だけでは試薬が希釈されたことにより生じた緩慢反応をチェックできず測定値が高値になってしまっていることに気付き難い。日常業務において臨床検査技師が全テストの反応過程を目視チェックすることは困難であり、特に緩慢反応は測定値が正常値の範囲以内であれば見落とされ、精確性の低い結果を出してしまう可能性がある。本発明によれば、試薬プローブの洗浄水によって試薬が希釈されてしまった場合、反応過程から得られた近似式計算パラメータの数値で反応の緩慢度を数値で評価することができる。測定値と一緒に緩慢度の評価値を表示させることにより反応状況を把握することができるため精確な結果を報告することができる。緩慢反応を検知できることは、下記の機能を可能にすることである。
・試薬劣化の定量的評価機能
・洗浄水で試薬が希釈されたことを検知する機能
・装置使用者が、誤って別の試薬を混入させたことを検知する機能
(8)検査データの信頼性保証
近似式計算パラメータは、各検査データの反応過程を用いて各々を評価するため、分析した患者検体の測定結果について正常反応の確信度の評価値と成り得る。例えば生化学自動分析装置による患者検体の測定においてある項目の前回値と今回の測定値が異なった場合、検査技師はその他の関連する項目やその項目の反応過程を見て、再検するかどうかを判断する。その場合の指標の1つとして近似式計算パラメータの値が正常反応の分布内に存在する場合にはわざわざ再検することなく、試料と検体との反応性に問題はないという結果を報告することができる。 The first embodiment of the present invention described above can be used as follows in the daily operation of the automatic analyzer.
(1) Performance evaluation of agitation mechanism based on daily inspection data The parameter value of the approximate expression is calculated from the reaction process of daily inspection data, quality control sample data, and patient specimen data. The parameter value is stored and the daily parameter value is monitored. If an abnormality is detected based on the parameter value, it is possible to indicate the possibility of a failure of the stirring mechanism or the like. According to the present invention, performance management of a stirring mechanism and the like can be performed based on changes in parameter values over time, which can contribute to maintaining the performance of the apparatus.
(2) Detection of reagent deterioration According to the present invention, the reactivity of the reagent can be evaluated by monitoring the approximate expression parameter from the result of the quality control sample and the patient specimen data in the daily examination. it can. If the user accidentally mixes another reagent or the reagent in the reagent bottle is diluted, the reaction becomes slow, and the present invention can detect the slow reaction as reagent deterioration. It becomes possible. Approximate formula calculation parameters for each item are recorded in the device every day, and when deviating from the approximate formula calculation parameter values determined in advance in a test, reagent deterioration is detected and an alarm is issued to inform the user of the device. Can do. The threshold value may be automatically determined from approximate formula calculation parameters for each item for several days instead of a predetermined numerical value.
(3) Recording of reagent lot change According to the present invention, when an apparatus user replenishes a reagent of a lot different from the previous time, the reactivity of the reagent is different and can be detected by an approximate expression parameter. If calibration is not performed when the reagent lot changes, there is a risk that an incorrect measurement value is calculated. In the apparatus equipped with the present invention, it is possible to automatically detect the change of the reagent lot and issue an alarm when the calibration is not performed, prompt the user to perform the calibration, and prevent the wrong measurement value from being calculated. The reagent lot change and calibration are recorded in the storage unit of the apparatus. Previously, the device user managed reagent lot change information in a list outside the device, but since the device detects a reagent lot change by installing the function of the present invention, the reagent is based on that record. It is possible to recognize the usage frequency of the reagent and assist in ordering the reagent order and the inventory status.
(4) Evaluation of reagent reactivity According to the present invention, when examining a reagent to be purchased, an approximate expression parameter is calculated from a plurality of types of reagents in the same item, and the reactivity evaluation based on the parameter value becomes possible. Also, in reagent development, it is possible to evaluate the reactivity of the reagent by the approximate equation parameter, and the reaction is good and a stable reagent standard can be determined.
(5) Index of quality control According to the present invention, an approximate expression parameter is calculated from the reaction process of the standard solution and the control in each measurement item, and it can be used as an index of the quality control sample by monitoring it.
(6) Evaluation method of characteristics and stirring level of each reagent According to the evaluation method of the present invention, an optimal stirring level can be examined for the characteristics of each reagent of each measurement item.
(7) Detection of reagent dilution by washing water of reagent probe It is difficult to notice that the measured value is high because the slow reaction caused by the reagent dilution cannot be checked with the measured value alone. It is difficult for clinical technologists to visually check the reaction process of all tests in daily work, especially slow reactions can be overlooked if the measured values are within the normal range, and can give less accurate results. There is sex. According to the present invention, when the reagent is diluted with the washing water of the reagent probe, the slowness of the reaction can be evaluated by the numerical value of the approximate expression calculation parameter obtained from the reaction process. By displaying the evaluation value of the degree of slowness together with the measured value, the reaction situation can be grasped, so that an accurate result can be reported. The ability to detect slow reactions is to enable the following functions:
-Quantitative evaluation function for reagent deterioration-Function for detecting that the reagent has been diluted with wash water-Function for detecting that the user has mixed another reagent by mistake (8) Reliability of test data Guarantee Since the approximate expression calculation parameters are evaluated using the reaction process of each test data, it can be an evaluation value of the certainty of normal reaction for the measurement result of the analyzed patient specimen. For example, if the previous value of a certain item differs from the current measured value in the measurement of a patient sample by a biochemical automatic analyzer, the laboratory technician will look at other related items and the reaction process of that item to determine whether to retest to decide. If the value of the approximate expression calculation parameter exists within the normal reaction distribution as one of the indices in that case, the result of reporting that the reactivity between the sample and the sample is not problematic without re-examination. it can.
+q3*x[2](t)=0 …(数8) q0 + q1 * x (t) + q2 * x [1] (t)
+ Q3 * x [2] (t) = 0 (Equation 8)
1 x′2 x″2
1 x′3 x″3
: : :
1 x′(m-1) x″(m-1)
X=AR …(数11) 1 x'1 x "1
1 x'2 x "2
1 x'3 x "3
:::
1 x ′ (m−1) x ″ (m−1)
X = AR (Equation 11)
2 試薬ディスク
3 反応ディスク
4 反応槽
5 サンプリング機構
6 ピペッティング機構
7 攪拌機構
8 測光機構
9 洗浄機構
10 表示部
11 入力部
12 記憶部
13 制御部
14 圧電素子ドライバ
15 攪拌機構コントローラ
16 試料容器
17,19 円形ディスク
18 試薬ボトル
20 保冷庫
21 反応容器
22 反応容器ホルダ
23 駆動機構
24,27 プローブ
25,28 支承軸
26,29 アーム
31 固定部
32 電極
33 ノズル
34 上下駆動機構
110 時間の経過を表す軸
120 吸光度を表す軸
140 各時点において計測された吸光度を表す記号
150 近似式による算出された吸光度を表す曲線
220 計測された吸光度と近似式により算出された吸光度の誤差を表す軸
230 (数1)を近似式として用いた場合の計測された吸光度と近似式により算出された吸光度の誤差を表す曲線
240 (数2)を近似式として用いた場合の計測された吸光度と近似式により算出された吸光度の誤差を表す曲線
250 (数4)を近似式として用いた場合の計測された吸光度と近似式により算出された吸光度の誤差を表す曲線
310 (数4)のパラメータk1の値を表す軸
320 (数4)のパラメータk2の値を表す軸
330 正常な攪拌条件における近似式パラメータk1,k2の値を表す記号
340 異常な攪拌条件における近似式パラメータk1,k2の値を表す記号
350 正常な攪拌条件における近似式パラメータと、異常な攪拌条件における近似式パラメータとを識別するための直線の例
360 正常な攪拌条件における近似式パラメータの分布範囲
410 (数1)のパラメータA1の値を表す軸
420 (数1)のパラメータkの値を表す軸
430 正常な攪拌条件における近似式パラメータA1,kの値を表す記号
440 異常な攪拌条件における近似式パラメータA1,kの値を表す記号 DESCRIPTION OF SYMBOLS 1
Claims (11)
- 測定項目毎、または検体毎に対応付けられた、測定値の時間変化の近似式を記憶する記憶機構と、
実測値に対応するように前記記憶機構に記憶された近似式のパラメータを最適化するパラメータ最適化機構と、
前記パラメータ最適化機構で最適化されたパラメータに基づき異常の有無を判定する判定機構と、
を備えたことを特徴とする自動分析装置。 A storage mechanism for storing an approximate expression of a time change of a measurement value associated with each measurement item or each sample;
A parameter optimization mechanism for optimizing the parameters of the approximate expression stored in the storage mechanism so as to correspond to the actual measurement values;
A determination mechanism for determining the presence or absence of abnormality based on the parameter optimized by the parameter optimization mechanism;
An automatic analyzer characterized by comprising: - 請求項1記載の自動分析装置において、
前記近似式の1つが、測定時刻をt、計算値をx、乗算を表す記号を*とする時、式
x=a0+a1*exp(-k1*t)
+a2*exp(-k2*t)
であり、測定時刻における実測値と、上記近似式で求められる計算値との差が小さくなるように該式中のパラメータa0,a1,a2,k1,k2の値を算出し、該パラメータの値に基づき、前記判定機構で異常の有無を判定することを特徴とする自動分析装置。 The automatic analyzer according to claim 1, wherein
When one of the approximate expressions is t, the measurement time is x, the calculated value is x, and the symbol representing multiplication is *, the expression x = a0 + a1 * exp (−k1 * t)
+ A2 * exp (-k2 * t)
The values of the parameters a0, a1, a2, k1, k2 in the equation are calculated so that the difference between the actually measured value at the measurement time and the calculated value obtained by the approximate equation is small, and the value of the parameter And determining whether there is an abnormality by the determination mechanism. - 請求項1記載の自動分析装置において、
前記近似式の1つが、測定時刻をt、計算値をxとし、Σ{ }を{ }内の式のiを1からnまで変化させ、加算した和を表す記号とし、nを1以上の整数とし、乗算を表す記号を*とする時、式
x=a0+Σ{ai*exp(-ki*t)}
であり、測定時刻における実測値と、上記近似式で求められる計算値との差が小さくなるように前記式中のパラメータa0,ai,kiの値を算出し、該パラメータの値に基づき、前記判定機構で異常の有無を判定することを特徴とする自動分析装置。 The automatic analyzer according to claim 1, wherein
One of the approximate expressions is that the measurement time is t, the calculated value is x, Σ {} is a symbol representing the sum obtained by changing i of the expression in {} from 1 to n, and n is one or more When it is an integer and the symbol representing multiplication is *, the expression x = a0 + Σ {ai * exp (−ki * t)}
The values of the parameters a0, ai, ki in the equation are calculated so that the difference between the actually measured value at the measurement time and the calculated value obtained by the approximate equation is small, and based on the parameter values, An automatic analyzer characterized by determining the presence or absence of an abnormality with a determination mechanism. - 請求項1記載の自動分析装置において、
前記近似式の1つが、測定時刻をt、計算値をxとし、Σ[n]{ }を{ }内の式のiを1からnまで変化させ、加算した和を表す記号とし、Σ[m]{ }を{ }内の式のiを1からmまで変化させ、加算した和を表す記号とし、Σ[l]{ }を{ }内の式のiを1からlまで変化させ、加算した和を表す記号とし、n,m,lを1以上の整数とし、乗算を表す記号を*とする時、式
x=a0+Σ[n]{ai*exp(-ki*t)}
+Σ[m]{bi/(ci+di*t))
+Σ[l]{(pi/(exp(qi*t)+ri))
であり、測定時刻における実測値と、上記近似式で求められる計算値との差が小さくなるように前記式中のパラメータa0,ai,ki,bi,ci,di,pi,qi,riの値を算出し、該パラメータの値に基づき、前記判定機構で異常の有無を判定することを特徴とする自動分析装置。 The automatic analyzer according to claim 1, wherein
One of the approximate expressions is that the measurement time is t, the calculated value is x, and Σ [n] {} is a symbol representing the sum obtained by changing i in the expression in {} from 1 to n, and Σ [ m] {} is changed to a symbol representing the sum obtained by changing i in the expression in {} from 1 to m, and Σ [l] {} is changed from 1 to 1 in the expression in {}, When the added sum is a symbol, n, m, l are integers of 1 or more, and the multiplication symbol is *, the expression x = a0 + Σ [n] {ai * exp (−ki * t)}
+ Σ [m] {bi / (ci + di * t))
+ Σ [l] {(pi / (exp (qi * t) + ri))
And the values of the parameters a0, ai, ki, bi, ci, di, pi, qi, ri in the equation so that the difference between the actually measured value at the measurement time and the calculated value obtained by the above approximate equation becomes small. The automatic analyzer is characterized in that, based on the value of the parameter, the presence or absence of an abnormality is determined by the determination mechanism. - 請求項1記載の自動分析装置において、
前記近似式の一次または二次以上の時間微分を計算し、測定時刻をt、計算値をxとし、該計算値の時刻tにおけるn次時間微分をx[n](t)、Σ{ }を{ }内の式のiを0からnまで変化させ、加算した和を表す記号、nを整数、乗算を表す記号を*とする時、式
p+Σ{pi*x[n](t)}=0
となるようなパラメータp,piの値を算出し、前記パラメータの値に基づき異常の有無を判定することを特徴とする自動分析装置。 The automatic analyzer according to claim 1, wherein
The first or second or higher time derivative of the approximate expression is calculated, the measurement time is t, the calculated value is x, and the nth time derivative of the calculated value at time t is x [n] (t), Σ {} Is changed from i to 0 to n in the expression in {}, a symbol representing the sum, n being an integer, and a symbol representing multiplication being *, the expression p + Σ {pi * x [n] (t)} = 0
An automatic analyzer characterized in that the values of parameters p and pi are calculated and the presence / absence of an abnormality is determined based on the parameter values. - 請求項1記載の自動分析装置において、
前記近似式の一次または二次以上の時間微分を計算し、測定時刻をt、計算値をxとし、Σ{ }を{ }内の式のiを0からnまで変化させ、加算した和を表す記号、nを1以上の整数、fi(t,x)をtまたはxまたはxの任意の次数の時間微分を含む関数,
乗算を表す記号を*とし、fi(t,x)は定数である場合も含む時、式
Σ{qi*fi(t,x)}=0
となるようパラメータqiの値を算出し、前記パラメータの値に基づき異常の有無を判定することを特徴とする自動分析装置。 The automatic analyzer according to claim 1, wherein
The first or second order time derivative of the approximate expression is calculated, the measurement time is t, the calculated value is x, Σ {} is changed from 0 to n in the expression in {}, and the sum obtained is added. A symbol that represents, n is an integer greater than or equal to 1, fi (t, x) is a function that includes time derivatives of t or any order of x or x,
When the symbol representing multiplication is * and fi (t, x) includes a case where it is a constant, the expression Σ {qi * fi (t, x)} = 0
An automatic analyzer characterized in that the value of the parameter qi is calculated so that the presence or absence of abnormality is determined based on the value of the parameter. - 請求項1記載の自動分析装置において、
前記判定機構は、前記パラメータ最適化機構で最適化されたパラメータを、正常な状態において得られたパラメータの分布と比較し、異常の有無を判定することを特徴とする自動分析装置。 The automatic analyzer according to claim 1, wherein
The automatic analysis apparatus characterized in that the determination mechanism compares the parameter optimized by the parameter optimization mechanism with a parameter distribution obtained in a normal state to determine whether there is an abnormality. - 請求項1記載の自動分析装置において、
前記判定機構は、前記パラメータ最適化機構で最適化されたパラメータを、正常な状態において得られたパラメータ値の分布と、異常な状態において得られたパラメータ値の分布の双方と比較し、異常の有無を判定することを特徴とする自動分析装置。 The automatic analyzer according to claim 1, wherein
The determination mechanism compares the parameter optimized by the parameter optimization mechanism with both the parameter value distribution obtained in a normal state and the parameter value distribution obtained in an abnormal state. An automatic analyzer characterized by determining presence or absence. - 請求項1記載の自動分析装置において、
前記判定機構は、前記パラメータ最適化機構で最適化されたパラメータを、異常原因がわかっている異常な状態において得られたパラメータ値の分布と比較し、異常の原因を推定する異常原因推定機構を備えたことを特徴とする自動分析装置。 The automatic analyzer according to claim 1, wherein
The determination mechanism includes an abnormality cause estimation mechanism that compares the parameter optimized by the parameter optimization mechanism with a distribution of parameter values obtained in an abnormal state in which the cause of the abnormality is known, and estimates the cause of the abnormality. An automatic analyzer characterized by comprising. - 測定項目毎、または検体毎に記憶された測定値の時間変化の近似式に基づき、実測値に対応するように前記記憶機構に記憶された近似式のパラメータを最適化するパラメータ最適化ステップと、
前記パラメータ最適化ステップで最適化されたパラメータに基づき異常の有無を判定する判定ステップと、
を備えたことを特徴とする分析方法。 A parameter optimization step for optimizing the parameters of the approximate expression stored in the storage mechanism so as to correspond to the actual measurement values based on the approximate expression of the time change of the measurement values stored for each measurement item or for each specimen;
A determination step of determining the presence or absence of an abnormality based on the parameter optimized in the parameter optimization step;
An analysis method characterized by comprising: - 請求項10記載の分析方法において、
前記判定ステップは更に、前記パラメータ最適化ステップで得られたパラメータ値を、異常原因がわかっている異常な状態において得られたパラメータ値の分布と比較し、異常原因を推定する異常原因推定ステップを有することを特徴とする分析方法。 The analysis method according to claim 10,
The determination step further includes an abnormality cause estimation step for comparing the parameter value obtained in the parameter optimization step with a distribution of parameter values obtained in an abnormal state in which the cause of abnormality is known, and estimating an abnormality cause. An analysis method characterized by comprising:
Priority Applications (3)
| Application Number | Priority Date | Filing Date | Title |
|---|---|---|---|
| CN201080020330.7A CN102422162B (en) | 2009-05-08 | 2010-04-12 | Automatic analysis device and analysis method |
| US13/318,535 US9310388B2 (en) | 2009-05-08 | 2010-04-12 | Automatic analyzer and analysis method |
| EP10772102.9A EP2428802B1 (en) | 2009-05-08 | 2010-04-12 | Automatic analysis device and analysis method |
Applications Claiming Priority (2)
| Application Number | Priority Date | Filing Date | Title |
|---|---|---|---|
| JP2009113138A JP5193937B2 (en) | 2009-05-08 | 2009-05-08 | Automatic analyzer and analysis method |
| JP2009-113138 | 2009-05-08 |
Publications (1)
| Publication Number | Publication Date |
|---|---|
| WO2010128575A1 true WO2010128575A1 (en) | 2010-11-11 |
Family
ID=43050086
Family Applications (1)
| Application Number | Title | Priority Date | Filing Date |
|---|---|---|---|
| PCT/JP2010/002631 WO2010128575A1 (en) | 2009-05-08 | 2010-04-12 | Automatic analysis device and analysis method |
Country Status (5)
| Country | Link |
|---|---|
| US (1) | US9310388B2 (en) |
| EP (1) | EP2428802B1 (en) |
| JP (1) | JP5193937B2 (en) |
| CN (1) | CN102422162B (en) |
| WO (1) | WO2010128575A1 (en) |
Cited By (3)
| Publication number | Priority date | Publication date | Assignee | Title |
|---|---|---|---|---|
| CN103091287A (en) * | 2011-10-31 | 2013-05-08 | 深圳迈瑞生物医疗电子股份有限公司 | Self-diagnosis method for measure result of blood analyzer, and device thereof |
| CN103534596A (en) * | 2011-05-16 | 2014-01-22 | 株式会社日立高新技术 | Automatic analysis device and automatic analysis program |
| WO2020195783A1 (en) * | 2019-03-26 | 2020-10-01 | 株式会社日立ハイテク | Data analysis method, data analysis system, and computer |
Families Citing this family (12)
| Publication number | Priority date | Publication date | Assignee | Title |
|---|---|---|---|---|
| JP5193940B2 (en) * | 2009-05-11 | 2013-05-08 | 株式会社日立ハイテクノロジーズ | Automatic analyzer |
| JP5520519B2 (en) | 2009-05-20 | 2014-06-11 | 株式会社日立ハイテクノロジーズ | Automatic analyzer and analysis method |
| JP5953089B2 (en) * | 2012-03-30 | 2016-07-13 | 株式会社Lsiメディエンス | Method for detecting measurement data abnormality and measurement data abnormality detection device |
| JP5953164B2 (en) * | 2012-07-30 | 2016-07-20 | 株式会社日立ハイテクノロジーズ | Data processing apparatus and automatic analyzer using the same |
| JP2014202608A (en) * | 2013-04-04 | 2014-10-27 | 日本光電工業株式会社 | Method of displaying data for evaluation of external precision management |
| CN106104259B (en) * | 2014-03-14 | 2018-11-09 | 泰尔茂株式会社 | Component measuring device, method and storage medium |
| US10678543B2 (en) * | 2014-11-07 | 2020-06-09 | Bl Technologies, Inc. | Analytic engine for use with remote monitoring data and imperfect asset models |
| JP5891288B2 (en) * | 2014-12-08 | 2016-03-22 | 株式会社日立ハイテクノロジーズ | Automatic analyzer and automatic analysis program |
| CN108318436B (en) * | 2018-02-06 | 2021-05-04 | 迈克医疗电子有限公司 | Reaction curve generation method and device and optical detection system |
| JP7299914B2 (en) * | 2018-10-17 | 2023-06-28 | 株式会社日立ハイテク | Abnormality determination method and automatic analyzer |
| CN111381055A (en) * | 2018-12-29 | 2020-07-07 | 深圳迈瑞生物医疗电子股份有限公司 | Calibration data display method and sample analysis device |
| WO2023153032A1 (en) * | 2022-02-09 | 2023-08-17 | 株式会社日立ハイテク | Data analysis method, data analysis system, and computer |
Citations (6)
| Publication number | Priority date | Publication date | Assignee | Title |
|---|---|---|---|---|
| JPH06194313A (en) * | 1992-12-24 | 1994-07-15 | Jeol Ltd | Reactive measurement method |
| JPH08219984A (en) * | 1995-02-13 | 1996-08-30 | Jeol Ltd | Biochemical analyzer |
| JP2003057248A (en) * | 2001-08-21 | 2003-02-26 | Hitachi Ltd | Autoanalyzer and control method for accuracy of chemical analytical method |
| JP2004347385A (en) | 2003-05-21 | 2004-12-09 | Hitachi Ltd | Anomaly detection system and anomaly detecting method |
| JP2006337125A (en) | 2005-06-01 | 2006-12-14 | Hitachi High-Technologies Corp | Automatic analyzer, and analysis method using the automatic analyzer |
| JP2009047638A (en) * | 2007-08-22 | 2009-03-05 | Toshiba Corp | Automatic analyzer |
Family Cites Families (14)
| Publication number | Priority date | Publication date | Assignee | Title |
|---|---|---|---|---|
| JPS57147039A (en) * | 1981-03-09 | 1982-09-10 | Hitachi Ltd | Data discriminating device for photometer |
| JPH0627743B2 (en) * | 1985-03-25 | 1994-04-13 | 株式会社日立製作所 | Automatic analyzer |
| JPH0359461A (en) * | 1989-07-27 | 1991-03-14 | Shimadzu Corp | Automatic biochemical analysis apparatus |
| JP2934653B2 (en) * | 1990-06-20 | 1999-08-16 | 株式会社ニッテク | Automatic analyzer |
| JPH06249856A (en) * | 1993-02-26 | 1994-09-09 | Shimadzu Corp | Measurement of automatic biochemical analyzing device |
| JP2001083081A (en) * | 1999-09-17 | 2001-03-30 | Hitachi Ltd | Method for preparing nonlinear calibration curve in automatic chemical analysis device |
| JP4287753B2 (en) * | 2004-01-19 | 2009-07-01 | 株式会社日立ハイテクノロジーズ | Analysis equipment |
| EP1802726B1 (en) * | 2004-09-02 | 2011-11-30 | Advanced Polymerik Pty Ltd | Photochromic compounds comprising polymeric substituents and methods for preparation and use thereof |
| WO2007076439A2 (en) * | 2005-12-22 | 2007-07-05 | Abbott Laboratories | Methods and marker combinations for screening for predisposition to lung cancer |
| US20080133141A1 (en) * | 2005-12-22 | 2008-06-05 | Frost Stephen J | Weighted Scoring Methods and Use Thereof in Screening |
| JP2009002864A (en) * | 2007-06-22 | 2009-01-08 | Olympus Corp | Analysis apparatus and analysis method |
| WO2009021178A1 (en) * | 2007-08-08 | 2009-02-12 | Chemimage Corporation | Raman difference spectra based disease classification |
| MX2010004464A (en) * | 2007-10-25 | 2010-06-07 | Scripps Research Inst | Genetic incorporation of 3-aminotyrosine into reductases. |
| JP4654256B2 (en) * | 2008-02-28 | 2011-03-16 | 株式会社日立ハイテクノロジーズ | Automatic analyzer |
-
2009
- 2009-05-08 JP JP2009113138A patent/JP5193937B2/en active Active
-
2010
- 2010-04-12 CN CN201080020330.7A patent/CN102422162B/en active Active
- 2010-04-12 US US13/318,535 patent/US9310388B2/en active Active
- 2010-04-12 WO PCT/JP2010/002631 patent/WO2010128575A1/en active Application Filing
- 2010-04-12 EP EP10772102.9A patent/EP2428802B1/en active Active
Patent Citations (6)
| Publication number | Priority date | Publication date | Assignee | Title |
|---|---|---|---|---|
| JPH06194313A (en) * | 1992-12-24 | 1994-07-15 | Jeol Ltd | Reactive measurement method |
| JPH08219984A (en) * | 1995-02-13 | 1996-08-30 | Jeol Ltd | Biochemical analyzer |
| JP2003057248A (en) * | 2001-08-21 | 2003-02-26 | Hitachi Ltd | Autoanalyzer and control method for accuracy of chemical analytical method |
| JP2004347385A (en) | 2003-05-21 | 2004-12-09 | Hitachi Ltd | Anomaly detection system and anomaly detecting method |
| JP2006337125A (en) | 2005-06-01 | 2006-12-14 | Hitachi High-Technologies Corp | Automatic analyzer, and analysis method using the automatic analyzer |
| JP2009047638A (en) * | 2007-08-22 | 2009-03-05 | Toshiba Corp | Automatic analyzer |
Non-Patent Citations (1)
| Title |
|---|
| YOSHIKAZU YAMAMOTO: "Jido Bunseki Sochi Joho o Mochiita Kensa Data no Hosho Hanno Katei o Mochiita Hannokei ni Kiin suru Ijo no Kenshutsu", JAPANESE JOURNAL OF CLINICAL LABORATORY AUTOMATION, vol. 34, no. 2, 1 April 2009 (2009-04-01), pages 163 - 169, XP008168318 * |
Cited By (9)
| Publication number | Priority date | Publication date | Assignee | Title |
|---|---|---|---|---|
| CN103534596A (en) * | 2011-05-16 | 2014-01-22 | 株式会社日立高新技术 | Automatic analysis device and automatic analysis program |
| EP2711713A1 (en) * | 2011-05-16 | 2014-03-26 | Hitachi High-Technologies Corporation | Automatic analysis device and automatic analysis program |
| EP2711713A4 (en) * | 2011-05-16 | 2015-04-22 | Hitachi High Tech Corp | Automatic analysis device and automatic analysis program |
| US9562917B2 (en) | 2011-05-16 | 2017-02-07 | Hitachi High-Technologies Corporation | Automatic analysis device and automatic analysis program |
| CN103091287A (en) * | 2011-10-31 | 2013-05-08 | 深圳迈瑞生物医疗电子股份有限公司 | Self-diagnosis method for measure result of blood analyzer, and device thereof |
| CN103091287B (en) * | 2011-10-31 | 2015-04-01 | 深圳迈瑞生物医疗电子股份有限公司 | Self-diagnosis method for measure result of blood analyzer, and device thereof |
| US10114006B2 (en) | 2011-10-31 | 2018-10-30 | Shenzhen Mindray Bio-Medical Electronics Co., Ltd. | Self-diagnosis method and apparatus for measuring results from blood analyzers |
| WO2020195783A1 (en) * | 2019-03-26 | 2020-10-01 | 株式会社日立ハイテク | Data analysis method, data analysis system, and computer |
| JP7448521B2 (en) | 2019-03-26 | 2024-03-12 | 株式会社日立ハイテク | Data analysis methods, data analysis systems, and calculators |
Also Published As
| Publication number | Publication date |
|---|---|
| JP2010261822A (en) | 2010-11-18 |
| EP2428802A4 (en) | 2017-10-18 |
| CN102422162A (en) | 2012-04-18 |
| US20120109534A1 (en) | 2012-05-03 |
| EP2428802B1 (en) | 2019-01-30 |
| US9310388B2 (en) | 2016-04-12 |
| EP2428802A1 (en) | 2012-03-14 |
| CN102422162B (en) | 2014-05-07 |
| JP5193937B2 (en) | 2013-05-08 |
Similar Documents
| Publication | Publication Date | Title |
|---|---|---|
| JP5193937B2 (en) | Automatic analyzer and analysis method | |
| JP4654256B2 (en) | Automatic analyzer | |
| JP5520519B2 (en) | Automatic analyzer and analysis method | |
| JP5562421B2 (en) | Automatic analyzer, analysis method and information processing apparatus | |
| US9383376B2 (en) | Automatic analyzer | |
| JP5193940B2 (en) | Automatic analyzer | |
| JP4276894B2 (en) | Anomaly detection system and anomaly detection method | |
| JP5932540B2 (en) | Automatic analyzer | |
| JP2006023214A (en) | Abnormality existence determining method of measurement reaction process, automatic analyzer executing this method, and storage medium stored with program of this method | |
| WO2020195783A1 (en) | Data analysis method, data analysis system, and computer | |
| JP2006292698A (en) | Precision management method of autoanalyzer for clinical inspection, and the autoanalyzer | |
| JP2005127757A (en) | Automatic analyzer | |
| WO2022019064A1 (en) | Automated analyzer and automated analysis method | |
| JP7299914B2 (en) | Abnormality determination method and automatic analyzer | |
| JP2021117191A (en) | Automatic analyzer and method for determining reaction abnormality |
Legal Events
| Date | Code | Title | Description |
|---|---|---|---|
| WWE | Wipo information: entry into national phase |
Ref document number: 201080020330.7 Country of ref document: CN |
|
| 121 | Ep: the epo has been informed by wipo that ep was designated in this application |
Ref document number: 10772102 Country of ref document: EP Kind code of ref document: A1 |
|
| WWE | Wipo information: entry into national phase |
Ref document number: 8580/DELNP/2011 Country of ref document: IN |
|
| NENP | Non-entry into the national phase |
Ref country code: DE |
|
| WWE | Wipo information: entry into national phase |
Ref document number: 2010772102 Country of ref document: EP |
|
| WWE | Wipo information: entry into national phase |
Ref document number: 13318535 Country of ref document: US |