WO2010106760A1 - Method and device for diagnosing driving operation - Google Patents
Method and device for diagnosing driving operation Download PDFInfo
- Publication number
- WO2010106760A1 WO2010106760A1 PCT/JP2010/001671 JP2010001671W WO2010106760A1 WO 2010106760 A1 WO2010106760 A1 WO 2010106760A1 JP 2010001671 W JP2010001671 W JP 2010001671W WO 2010106760 A1 WO2010106760 A1 WO 2010106760A1
- Authority
- WO
- WIPO (PCT)
- Prior art keywords
- driving
- score
- vehicle
- fuel consumption
- data
- Prior art date
Links
- 238000000034 method Methods 0.000 title claims description 20
- 239000000446 fuel Substances 0.000 claims abstract description 121
- 238000003745 diagnosis Methods 0.000 claims abstract description 19
- 238000011156 evaluation Methods 0.000 claims abstract description 15
- 238000002405 diagnostic procedure Methods 0.000 claims 2
- 238000012423 maintenance Methods 0.000 abstract description 5
- 230000003319 supportive effect Effects 0.000 abstract 1
- 230000001133 acceleration Effects 0.000 description 27
- 238000004364 calculation method Methods 0.000 description 20
- 238000006243 chemical reaction Methods 0.000 description 11
- 238000001514 detection method Methods 0.000 description 8
- 230000006870 function Effects 0.000 description 7
- 230000010354 integration Effects 0.000 description 7
- 238000012937 correction Methods 0.000 description 6
- 230000008569 process Effects 0.000 description 6
- ZAKOWWREFLAJOT-CEFNRUSXSA-N D-alpha-tocopherylacetate Chemical compound CC(=O)OC1=C(C)C(C)=C2O[C@@](CCC[C@H](C)CCC[C@H](C)CCCC(C)C)(C)CCC2=C1C ZAKOWWREFLAJOT-CEFNRUSXSA-N 0.000 description 5
- 230000007423 decrease Effects 0.000 description 5
- 230000006872 improvement Effects 0.000 description 5
- 230000006399 behavior Effects 0.000 description 4
- 238000010586 diagram Methods 0.000 description 4
- 238000004088 simulation Methods 0.000 description 4
- 230000012447 hatching Effects 0.000 description 3
- 238000002347 injection Methods 0.000 description 3
- 239000007924 injection Substances 0.000 description 3
- 230000008859 change Effects 0.000 description 2
- 238000004590 computer program Methods 0.000 description 2
- 238000003825 pressing Methods 0.000 description 2
- 229930091051 Arenine Natural products 0.000 description 1
- 238000004891 communication Methods 0.000 description 1
- 238000007796 conventional method Methods 0.000 description 1
- 230000003247 decreasing effect Effects 0.000 description 1
- 230000000994 depressogenic effect Effects 0.000 description 1
- 238000013461 design Methods 0.000 description 1
- 238000005516 engineering process Methods 0.000 description 1
- 238000002474 experimental method Methods 0.000 description 1
- 239000004973 liquid crystal related substance Substances 0.000 description 1
- 230000007257 malfunction Effects 0.000 description 1
- 238000003032 molecular docking Methods 0.000 description 1
- 230000008450 motivation Effects 0.000 description 1
- 238000012545 processing Methods 0.000 description 1
- 230000009467 reduction Effects 0.000 description 1
- 230000004044 response Effects 0.000 description 1
- 239000007787 solid Substances 0.000 description 1
- 230000003068 static effect Effects 0.000 description 1
Images


Classifications
-
- G—PHYSICS
- G07—CHECKING-DEVICES
- G07C—TIME OR ATTENDANCE REGISTERS; REGISTERING OR INDICATING THE WORKING OF MACHINES; GENERATING RANDOM NUMBERS; VOTING OR LOTTERY APPARATUS; ARRANGEMENTS, SYSTEMS OR APPARATUS FOR CHECKING NOT PROVIDED FOR ELSEWHERE
- G07C5/00—Registering or indicating the working of vehicles
- G07C5/08—Registering or indicating performance data other than driving, working, idle, or waiting time, with or without registering driving, working, idle or waiting time
- G07C5/0816—Indicating performance data, e.g. occurrence of a malfunction
- G07C5/0825—Indicating performance data, e.g. occurrence of a malfunction using optical means
-
- B60K35/28—
-
- B—PERFORMING OPERATIONS; TRANSPORTING
- B60—VEHICLES IN GENERAL
- B60R—VEHICLES, VEHICLE FITTINGS, OR VEHICLE PARTS, NOT OTHERWISE PROVIDED FOR
- B60R16/00—Electric or fluid circuits specially adapted for vehicles and not otherwise provided for; Arrangement of elements of electric or fluid circuits specially adapted for vehicles and not otherwise provided for
- B60R16/02—Electric or fluid circuits specially adapted for vehicles and not otherwise provided for; Arrangement of elements of electric or fluid circuits specially adapted for vehicles and not otherwise provided for electric constitutive elements
- B60R16/023—Electric or fluid circuits specially adapted for vehicles and not otherwise provided for; Arrangement of elements of electric or fluid circuits specially adapted for vehicles and not otherwise provided for electric constitutive elements for transmission of signals between vehicle parts or subsystems
- B60R16/0231—Circuits relating to the driving or the functioning of the vehicle
- B60R16/0236—Circuits relating to the driving or the functioning of the vehicle for economical driving
-
- G—PHYSICS
- G07—CHECKING-DEVICES
- G07C—TIME OR ATTENDANCE REGISTERS; REGISTERING OR INDICATING THE WORKING OF MACHINES; GENERATING RANDOM NUMBERS; VOTING OR LOTTERY APPARATUS; ARRANGEMENTS, SYSTEMS OR APPARATUS FOR CHECKING NOT PROVIDED FOR ELSEWHERE
- G07C5/00—Registering or indicating the working of vehicles
- G07C5/004—Indicating the operating range of the engine
-
- B60K2360/174—
-
- Y—GENERAL TAGGING OF NEW TECHNOLOGICAL DEVELOPMENTS; GENERAL TAGGING OF CROSS-SECTIONAL TECHNOLOGIES SPANNING OVER SEVERAL SECTIONS OF THE IPC; TECHNICAL SUBJECTS COVERED BY FORMER USPC CROSS-REFERENCE ART COLLECTIONS [XRACs] AND DIGESTS
- Y02—TECHNOLOGIES OR APPLICATIONS FOR MITIGATION OR ADAPTATION AGAINST CLIMATE CHANGE
- Y02T—CLIMATE CHANGE MITIGATION TECHNOLOGIES RELATED TO TRANSPORTATION
- Y02T10/00—Road transport of goods or passengers
- Y02T10/80—Technologies aiming to reduce greenhouse gasses emissions common to all road transportation technologies
- Y02T10/84—Data processing systems or methods, management, administration
Definitions
- the present invention relates to a method for diagnosing a driving operation of a vehicle for achieving an improvement in fuel consumption in a vehicle dealer, a maintenance plant, or the like, as in the case of ordinary vehicle failure diagnosis.
- Patent Document 1 discloses a method of comparing the current fuel efficiency with a preset target fuel efficiency, making a good / bad determination of the current fuel efficiency, and notifying the occupant of the determination result.
- Patent Document 2 discloses a method of changing at least one of the brightness and the color tone for displaying the fuel efficiency according to the state of the fuel efficiency. For example, each time the fuel consumption decreases by a predetermined value, the brightness or the color tone is changed.
- Patent Document 3 describes that behavior data of a vehicle is received from a car navigation apparatus, a driving attribute of the vehicle is determined from the behavior data, and a safety diagnosis is performed by statistically processing an acceleration distribution. Fuel consumption is determined from the behavior data to diagnose fuel-efficient operation.
- the car navigation system since the car navigation system is used to transmit vehicle behavior data to the driving diagnosis server, not only the load on the car navigation system increases, but in order to adopt this method, the car navigation system itself is changed in design There is a need to.
- the conventional method informs the driver whether the fuel consumption is good or not, and uses brightness and color tone to indicate whether the fuel consumption is decreasing or improving.
- Such "notices" are only for notifying the goodness or badness of the fuel consumption about the operation while driving or the situation of the moment, what kind of driving habits, and what kind of driving operation reduces the fuel consumption Also, no information is provided on how to improve driving.
- an electronic control unit provided with a non-volatile memory for storing driving data indicating the fuel consumption state of the vehicle according to the driving operation for each driving cycle is used to drive the driving data over a plurality of driving cycles.
- Means for reading out, means for creating a chart representing a fuel consumption state for each driving operation by the driver for each driving cycle based on the read driving data, and a display device with the chart as a comparison result for each driving cycle And means for outputting to the printer or the printer.
- a complaint or dissatisfaction with fuel consumption can be diagnosed in a maintenance plant or the like in the same manner as a normal vehicle failure diagnosis, and the diagnosis result is provided to the user along with data backed by evaluation of driving operation and advice. Since it can be presented, the user can be made aware of what kind of driving operation should be performed to obtain better fuel efficiency.
- the driving cycle is a driving period from when the ignition of the vehicle is turned on to when it is turned off, and the electronic control unit determines that at least one of the traveling speed and the traveling distance does not reach a predetermined value.
- the electronic control unit determines that at least one of the traveling speed and the traveling distance does not reach a predetermined value.
- recording of the operation data of this operation cycle in the non-volatile memory is prohibited.
- the driving data includes an evaluation score calculated by the electronic control unit for each driving operation item affecting the fuel consumption of the state of the fuel consumption of the vehicle, and an advice message for presenting the user about the fuel consumption state.
- the diagnostic device visibly outputs an advice message corresponding to a driving operation item having a low evaluation score among the plurality of advice messages read from the electronic control device.
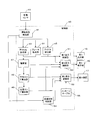
- FIG. 2 is a functional block diagram of a control unit 40 of the in-vehicle system.
- (A) is a figure for demonstrating the method of calculating
- (B) is a figure which shows an example of the map which converts a comprehensive score into the value for calculating a lifetime score.
- 5 is a flowchart illustrating a process of calculating an overall score. The chart which shows the relation between vehicle speed and fuel consumption.
- FIG. 1 is a block diagram showing an overall relationship between an electronic control unit (ECU) mounted on a vehicle and a diagnostic device of the present invention.
- the electronic control unit 14 is a computer that controls fuel injection, air-fuel ratio, etc. of the vehicle, and is a read only memory that provides the CPU 14A, the work area to the CPU, and temporarily stores programs and data, and a computer program.
- a ROM 14C, a rewritable non-volatile memory 14D that maintains storage even after the vehicle is turned off, an input interface 14F, and an output interface 14G are provided.
- the ECU 14 receives an output signal from a sensor provided in each part of the vehicle via the in-vehicle network 11.
- the sensors include a vehicle speed sensor 11A for detecting the vehicle speed, an accelerator opening sensor 11B for detecting the depression amount of the accelerator, a brake sensor 11C for detecting the depression amount of the brake, a throttle opening degree sensor 11E for detecting the opening angle of the throttle, There is a crank angle sensor 11F that detects a crank angle that is the basis of the control timing of the above.
- the service shop 16 is a dealer's shop that provides maintenance service of the vehicle, and includes a diagnosis system (HDS) 16A that reads out recorded data during driving stored in the in-vehicle ECU outside the vehicle and performs diagnosis.
- HDS diagnosis system
- the tablet terminal of the HDS 16A is connected to the ECU 14 of the vehicle brought in to receive the fuel efficiency diagnostic service via a data link connector (hereinafter referred to as DLC).
- DLC data link connector
- the device is connected, and the data stored in the non-volatile memory 14D is read.
- the tablet terminal device of the HDS 16A is a tablet-type portable terminal developed specifically for a diagnostic system, and is connected to an ECU of a vehicle via DLC to read data stored in the ECU.
- the tablet terminal of the HDS 16A was connected to the communication network of the service shop 16 by being coupled to the docking station, and was connected to the personal computer 16B of the service shop that constitutes the diagnostic device integrally with the HDS and read from the ECU 14 The data is provided to the personal computer 16B.
- the HDS 16A tablet terminal converts the read data into an xml file.
- the personal computer 16B edits the data received from the HDS 16A with a viewer program, displays it on a display device 16D such as a liquid crystal monitor, CRT or the like, or prints it out to the printer 16E.
- the personal computer 16B can constitute a portable diagnostic device by using a laptop computer, and a tablet terminal device, a personal computer function and a monitor function (display device without separately providing the personal computer 16B Can be integrated into a tablet type diagnostic device with a monitor function.
- the HDS 16A can execute the normal failure diagnosis function and the fuel efficiency diagnosis function of the present invention by using the same hardware.
- the fuel consumption data stored in the non-volatile memory 14D of the ECU 14 and read by the HDS 16A tablet terminal includes history data over the latest 5 driving cycles (D / C) and data at the end of the latest driving cycle .
- Table 1 shows an example of data items of historical data over five driving cycles. As historical data, data in the latest operation cycle is additionally stored each time the operation cycle ends, and data in the oldest operation cycle (data five times before) is sequentially erased, and the latest data Data of the past 5 driving cycles including is stored.
- Table 2 shows an example of data stored at the end of one latest driving cycle.
- the driving cycle to be stored in the non-volatile memory is 200 meters or more after the vehicle speed is 8 km / h or more, and is a driving cycle in which the rotation of the engine continues for 3 minutes or more from the engine start. is there. It is because the driving cycle which does not satisfy these conditions can not obtain sufficient data from a viewpoint of evaluating fuel consumption, and is unsuitable as an evaluation object of driving operation. Therefore, the electronic control unit according to the present invention can be configured as shown in Table 1 for this driving cycle when at least one of the traveling speed and the traveling distance does not reach the predetermined value or when the engine does not rotate continuously for a predetermined time after the engine is started. , 2 and prohibit the recording of operation data in the non-volatile memory. As a result, only the operation data associated with the evaluation is sorted and sequentially accumulated five times in the non-volatile memory.
- FIG. 2 is a block diagram of the control device 40 mounted on a vehicle and generating driving data according to a driving operation by a user.
- the control device 40 is configured by the electronic control unit (ECU) 14 described with reference to FIG.
- the driving state detection unit 41 detects whether an accelerator operation of the vehicle has been performed and whether a brake operation of the vehicle has been performed.
- Various sensors 65 are mounted on the vehicle. An example of a sensor is shown in FIG.
- the driving state detection unit 41 detects a driving operation based on an output from the sensor 65.
- the driving state detection unit 41 determines the driving state of the vehicle according to the accelerator operation based on the engine speed and the opening degree of the throttle valve.
- the engine rotational speed can be calculated based on a crank angle sensor 11F provided in the vehicle.
- the throttle valve is provided in the intake passage to the engine of the vehicle, and the opening degree can be detected by the throttle opening degree sensor 11E.
- the driving state detection unit 41 determines the driving state of the vehicle according to the brake operation based on the vehicle speed and the negative acceleration.
- the vehicle speed and the acceleration can be detected by a vehicle speed sensor 11A provided in the vehicle.
- An acceleration sensor may be provided, and the acceleration sensor may detect the acceleration of the vehicle.
- Accelerator scoring data The accelerator scoring unit 43 calculates a score (score) for the accelerator operation by evaluating the accelerator operation from the viewpoint of fuel consumption based on the driving state detected according to the accelerator operation.
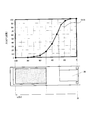
- FIG. 3A shows an example of a map stored in advance in the ROM 14C of the control device 40.
- the horizontal axis of the map indicates the engine speed (rpm), and the vertical axis indicates the throttle opening (deg).
- a thick solid line 111 represents a predetermined optimum value of BSFC (Brake Specific Fuel Consumption, unit [g / kWh]) called net fuel consumption rate, that is, a value set as the best fuel consumption.
- a line representing an operating condition for the vehicle which is predetermined for each engine speed and throttle opening according to the characteristics of the vehicle engine. For example, when the engine speed is 3000 rpm, as indicated by a point 112, if the throttle opening is about 40 degrees, it indicates that an optimum net fuel consumption rate can be realized. .
- FIG. 3 does not show the range where the engine rotational speed is smaller than about 800 rpm, this is a range where the engine is in the idling operation state, and the control when the idling operation state is described later.
- the operating region is divided into three regions in the vertical axis direction. Specifically, the region is divided into a region near the line 111 of the BSFC, a region below the region, and a region above the region, and these regions are separated by the wires 113 and 115. There is. A region below the line 113 is a first region, a region from the line 113 to the line 115 is a second region, and a region above the line 115 is a third region. The first region is set as a region where fuel consumption is good, the third region is a region where fuel consumption is not good, and the second region is set as a region between them that is not good.
- the third region corresponds to an operating region in which an accelerator operation causing sudden acceleration is performed or an accelerator operation with an excessively high vehicle speed is performed.
- the second region corresponds to the driving region of the accelerator operation that provides a moderate acceleration
- the first region corresponds to the driving region in which the accelerator operation is performed such as cruise travel.
- the accelerator scoring unit 43 refers to this map based on the engine speed (NE) detected in response to the accelerator operation and the detected throttle opening (TH), and the length of the bar 39 and the background color 33 described above. Decide. It is assumed that the detected engine speed NE is 2000 rpm. A line 117 indicating the number of revolutions of 2000 rpm is shown in the longitudinal direction. The throttle opening corresponding to the intersection C1 of the line 117 and the line 113 is TH1, the throttle opening corresponding to the intersection C2 of the line 117 and the line 115 is TH2, and the maximum value (90 degrees) of the throttle opening is TH3.
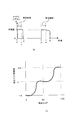
- FIG. 3B shows the acceleration area Ar, and the position in the horizontal axis direction of the acceleration area Ar is expressed with respect to the reference position R.
- the non-hatched area represents the state of accelerator operation with good fuel efficiency, and the hatched area represents the state of accelerator operation with poor fuel efficiency.
- the range from the reference position R to the first position PA1 corresponds to the first region of the map of FIG. 3A
- the range from the first position PA1 to the second position PA2 is the second region
- the range from the second position PA2 to the third position PA3 corresponds to the third region.
- the distances from the reference position to the first to third positions PA1 to PA3 are represented by LA1, LA2 and LA3, respectively. Therefore, when the rotational speed NE is 2000 rpm, the range of the throttle opening from zero to TH1 is allocated to the range from the position R to the position PA1, and the range from the throttle opening TH1 to TH2 is from the position PA1 to the position PA2.
- the range is assigned to the range, and the range of the throttle opening degree TH2 to TH3 is assigned to the range of the position PA2 to the position PA3.
- the accelerator scoring unit 43 calculates, by proportional calculation, in which region of the map of FIG. 3 the operating state represented by the detected engine rotational speed NE and throttle opening TH is present. If it exists in the first area, the length of the bar 39 is calculated by LA1 ⁇ TH / (TH1-0). If it exists in the second area, the length of the bar 39 is calculated by LA1 + (LA2-LA1) ⁇ (TH-TH1) / (TH2-TH1), and if it exists in the third area, LA2 + (LA3) The length of the bar 39 is calculated by-LA2) x (TH-TH2) / (TH3-TH2).
- the bar 39 is an index for displaying the accelerator operation amount or the brake operation amount on the second display unit 15 in real time by extending or contracting the length in the right direction or the left direction in the figure. Description of the display by the bar is omitted because it relates to display and is not directly related to the present invention.
- the accelerator scoring unit 43 further refers to the map 121 of FIG. 4 based on the calculated length of the bar 39 to obtain a score (score) for the current accelerator operation.
- the map is stored in advance in the ROM 14C of the control device 40.
- the possible range of the score is from 0 to 100, 100 corresponds to the reference position R, and the zero corresponds to the position from the reference position R to the length LA3.
- the score according to the length of the bar 39 is 90 points. As shown in FIG. 4, the shorter the length of the bar 39, that is, the better the fuel consumption is in the accelerator operation, the higher the score.
- the score is represented by an integer. Therefore, when the score according to the length of the bar 39 is a decimal point, it is rounded to an integer, for example, by rounding off.
- the accelerator scoring unit 43 calculates a score obtained by evaluating the accelerator operation from the viewpoint of fuel consumption at predetermined time intervals. This score is called an accelerator score (acceleration score).
- the accelerator score is sequentially calculated at predetermined time intervals during the driving cycle of the vehicle, stored in the RAM 14B, and used to calculate an overall score and to calculate an average value of the accelerator score.
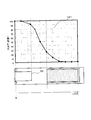
- the brake scoring unit 44 calculates a score (score) for the brake operation by evaluating the brake operation from the viewpoint of fuel consumption based on the driving state detected according to the brake operation.
- (a) shows an example of a map stored in advance in the memory of the control device 40.
- the horizontal axis of the map indicates the vehicle speed (km / h)
- the vertical axis indicates the acceleration (m / sec 2 )
- a line 131 represented by a thick solid line is a value representing an acceleration when a predetermined sudden braking operation is performed when traveling normally (in this example, when the vehicle speed is greater than about 15 km / h) This is determined in advance through simulation and the like.
- -6 m / sec 2 is set, but this is an example, and the present invention is not limited to this value.
- the operating range is 3 in the vertical axis direction. Divided into two areas. Specifically, a third region including the line 131 is set below the line 133 as a region with poor fuel consumption, and the third region corresponds to an operation region in which the brake operation causing the rapid deceleration is performed.
- the first region is set above the line 135 as a region with good fuel consumption, which is a driving region in which a braking operation of a strength that can stop the vehicle can be performed if the inter-vehicle distance is sufficient. It corresponds to A second region is set between the line 133 and the line 135 as a region where the fuel consumption is relatively good and not good.
- the first and second regions are also considered to be driving regions that can more reliably avoid slip on low ⁇ roads (road surfaces with a low coefficient of static friction ⁇ ) if brake operation is performed in these regions. It is set.
- the first and second regions are operation regions where rapid deceleration is not performed, and can be considered as highly safe operation regions. Lines 133 and 135 separating the first to third regions are predetermined through simulation or the like.
- the brake scoring unit 44 refers to the map in which three regions are preset and stored in the memory, based on the vehicle speed (VP) detected according to the brake operation and the detected acceleration (DR), Determine the length of the bar 39 mentioned above.
- the detected vehicle speed VP is 70 km / h.
- a line 137 indicating a vehicle speed of 70 km / h is shown in the vertical direction.
- the acceleration corresponding to the intersection D3 of the line 137 and the line 131 is DR3
- the acceleration corresponding to the intersection D2 of the line 137 and the line 133 is DR2
- the acceleration corresponding to the intersection D1 of the line 137 and the line 135 is DR1.
- the brake area is shown in FIG. 5 (b), and the position of the brake area in the lateral axis direction is expressed with respect to the reference position R.
- the non-hatching area represents the state of the braking operation with good fuel consumption
- the hatching area represents the state of the braking operation with the low fuel consumption.
- the first position PB1 is set at a position corresponding to the end DR1 of the first area of FIG. 5A.
- the second position PB2 is set at a position corresponding to the end DR2 of the second area of FIG. 5A, and the position of the left end of the hatching area is set at the third position PB3.
- the distances from the reference position to the first to third positions PB1 to PB3 are represented by LB1, LB2 and LB3, respectively.
- the range of acceleration from zero to DR1 is assigned to the range from position R to position PB1
- the range from acceleration DR1 to DR2 is from position PB1 to position PB2
- the range is assigned to the range
- the range of acceleration from DR2 to DR3 is assigned to the range from the position PB2 to the position PB3.
- the brake scoring unit 44 determines which region of the map the driving condition represented by the detected vehicle speed VP and the detected acceleration DR is present. If it exists in the first area, the length of the bar 39 is calculated by proportional calculation, LB1 ⁇
- represents an absolute value.
- the length of the bar 39 is calculated by LB1 + (LB2-LB1) ⁇ (
- the length of the bar 39 is calculated by LB2 + (LB3 ⁇ LB2) ⁇ (
- the brake scoring unit 44 further determines a score (score) for the current brake operation with reference to the map 141 of FIG. 6 based on the calculated length of the bar 39.
- the map is stored in advance in the ROM 14C of the control device 40.
- the possible range of the score is from 0 to 100, 100 corresponds to the reference position R, and the zero corresponds to the position from the reference position R to the length LB3.
- the score according to the length of the bar 39 is 70 points. As shown in FIG. 6, the higher the fuel efficiency of the braking operation, the higher the score.
- the score is represented by an integer. Therefore, when the score according to the length of the bar 39 is a decimal point, it is rounded to an integer, for example, by rounding off.
- the brake scoring unit 44 calculates a score obtained by evaluating the brake operation from the viewpoint of fuel consumption. This score is called a brake score (brake scoring).
- the brake score is sequentially calculated at predetermined time intervals during the driving cycle of the vehicle, stored in the RAM 14B, and used to calculate an overall score and an average value of the brake score.
- the operating state detecting unit 41 detects the idling state of the vehicle.
- the idle operation scoring unit 45 sets an initial value to the idle score. Also, each time the idling operation is detected, the idle operation scoring unit 45 starts a timer (not shown) for measuring the elapsed time of the idling operation, and a predetermined time has elapsed since the idling operation was started. After that, the idle score is deducted by a predetermined value at predetermined time intervals.
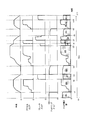
- the driving cycle is started at time t0, and the idling operation is started.
- An initial value (100 points in this embodiment) is set as the idle score.
- the idle score is decremented by a predetermined value at predetermined time intervals from time t1 when a predetermined time (for example, one minute) has elapsed since the start of the idling operation to time t2 when the idling operation is ended.
- the predetermined time is preferably set to correspond to the duration of the idling operation required for temporary stop of the vehicle, waiting for a signal, etc., and can be set based on simulation, experience value, etc. .
- idling operation having a normal duration such as when the vehicle is temporarily stopped or waiting for a signal. Since idling operation having a duration longer than the predetermined time may be considered, for example, parking for some purpose, the value of the idle score is reduced as the duration of the idling operation becomes longer.
- the value of the idle score at time t2 when the idling operation is finished is stored and maintained, for example, in the memory of control device 40.
- the value of the idle score that is, the idle score value at time t2 maintained in the memory is read at time t4 when the predetermined time has elapsed from the start.
- the idle score is decremented by a predetermined value at predetermined time intervals until the end time t5.
- the idle score is reduced according to the duration of the idling operation.
- the idle operation scoring unit 45 calculates an idle score obtained by evaluating the idle operation from the viewpoint of fuel consumption.
- the idle score is sequentially calculated at predetermined time intervals while the vehicle is driving (during a driving cycle) and stored in the RAM 14B, and is used to calculate an overall score and an average idle score.
- the integration unit 47 integrates the accelerator score, the brake score, and the idle score calculated as described above at predetermined time intervals. Integration is performed in this example every driving cycle from start to stop of the vehicle engine (ie, ignition on to off).
- the average score calculation unit 48 divides the score integrated value of each of the three scores integrated by the integration unit 47 by the elapsed time of the corresponding operation to sequentially calculate the average value of each of the three scores. At the same time, the sum of these three scores is similarly integrated and divided by the elapsed time to sequentially calculate a total score. Thus, the average value and the total score of the three individual scores sequentially calculated along the passage of time are stored in the RAM 14B. When the ignition key is turned off and the driving cycle ends, the average value of the three individual scores stored in the RAM 14B and the total score are non-volatile as an accelerator score, a brake score, an idle score and a total score representing this driving cycle. Are stored in the sex memory 14D.
- the ignition is turned on to start the driving cycle.
- idling starts.
- An initial value (for example, 100 points) is set to the idle score.
- the idle score is decremented as time passes.
- the idling operation ends at time t1, and the vehicle speed increases when the accelerator pedal is depressed. While the accelerator operation is performed, as described above, the accelerator score is calculated at predetermined time intervals.
- the accelerator operation is ended and depression of the brake pedal is started. While the brake operation is being performed, the brake score is calculated at predetermined time intervals.
- the brake operation ends, the vehicle speed becomes zero, the vehicle stops, and the idling operation starts again. After a predetermined time has elapsed, decrement of the idle score from the previous value is started. At time t4, the accelerator operation is started again.
- the integrated value is zero.
- the accelerator score, the brake score and the idle score are calculated at each time from time t0 to time t11 when the driving cycle ends, but each time these scores are calculated, the score is added to the previous integrated value
- the integrated value of this time is calculated.
- the integrated value in the figure represents this integration process as an image, and at time t0 to t1, an idle score is integrated, which is represented by area S1.
- the accelerator score is integrated at time t1 to t2, and this is represented by the area S2.
- the integrated score at time t2 is S1 + S2.
- the brake score is integrated at time t2 to t3, which is represented by the area S3.
- the integrated score at time t3 is S1 + S2 + S3.
- a total score is calculated by dividing by the elapsed time from the start t0 of the driving cycle to the present time. For example, the total score at time t2 is calculated by (S1 + S2) / (t2-t0).
- the total score when one driving cycle ends is calculated by dividing the total score integrated in the driving cycle by the driving cycle time length Tdc. In the example of FIG. 8, it is calculated by (S1 + S2 +... + S11) / Tdc.
- the total score at the end of the driving cycle represents the average fuel consumption state in this driving cycle.
- the total score at the end of the driving cycle is stored in the non-volatile memory 14D of the control device 40.
- the average score calculation unit 48 calculates an average score for each of the three individual scores at the same timing as the calculation of the total score. That is, the integrated value of the accelerator score is calculated, and this is divided by the accelerator operation time to calculate the average value. For example, when driving as shown in FIG. 8 is being performed, the average value of the accelerator score at time t5 is calculated by (S2 + S5) / ((t2-t1) + (t5-t4)). The same calculation is performed for the brake operation and the idling operation, and the average brake score and the average idle score are calculated.
- the average idle score may be calculated including the predetermined time described with reference to FIG. 7 (for example, in the example of FIG. 8, the average idle score at time t1 is calculated by S1 / t1).
- the average idle score at time t1 is calculated by S1 / (t1-predetermined time)).
- These individual average scores are also stored in the RAM 14B together with the overall score.
- the calculation of the average score can be performed in the background of operations for engine control at relatively long time intervals, for example, one minute intervals. This is to reduce the load on the ECU.
- FIG. 9 is an example of a flow of an overall score calculation process executed by the control unit 40.
- the process up to integration (S12) is performed at a predetermined time interval (for example, 100 milliseconds).
- step S1 If the ignition switch is on in step S1, this process is performed. In step S2, it is detected that the vehicle is in any one of an accelerator operation, a brake operation, and an idling operation.
- the map of FIG. 3 is selected (S3), and the length of the bar is determined by referring to the map based on the detected engine rotational speed NE and the detected throttle opening TH. (S4).
- the accelerator score is obtained with reference to the map of FIG. 6 (S5).
- step S2 When the brake operation is detected in step S2, the map of FIG. 5 is selected (S6), and the map is referred to based on the detected vehicle speed VP and the detected acceleration DR to determine the bar length. (S7). Next, a brake score is obtained with reference to the map of FIG. 6 (S8).
- step S2 it is determined whether or not a predetermined time has elapsed from the start of the current idling operation (S9). If it has not elapsed, in step S10, the value of the idling score at the end of the previous idling operation state is maintained as it is. If it has elapsed, in step S11, the idling score is decremented (subtracted) by a predetermined value. An initial value is set to the idling score at the start of the driving cycle.
- step S12 the accelerator score, the brake score or the idling score calculated this time is added to the previous integrated value to calculate the current integrated value.
- step S13 a total score is calculated by dividing the current integrated value by the elapsed time from the start of the driving cycle.
- the overall score is calculated and displayed at predetermined time intervals over the period of the driving cycle.
- the average score calculated at the end of the driving cycle is stored in the RAM 14B as a total score, and a lifetime score is calculated based on the total score.
- the time interval of calculation of the accelerator score and the like and the time interval of calculation of the total score may be the same, and the latter may be longer than the former, for example, the former may be 100 milliseconds and the latter may be 5 minutes.
- the calculated total score of the lifetime score represents the average fuel consumption state during the driving cycle.
- the lifetime score is an integrated value of the integrated score over a plurality of driving cycles and represents the technical level of driving operation regarding fuel consumption.
- the lifetime score calculation unit 49 of FIG. 2 converts the total score of the current driving cycle into a total score converted value with reference to the map of FIG. 7B each time each driving cycle is finished. This map is stored in advance in the ROM 14C of the control device 40.
- the total score of 50 points or more is converted into a total score conversion value having a positive value because the driving operation regarding fuel consumption is good.
- the overall score lower than 50 points is converted into an overall score equivalent value having a negative value, since the driving operation regarding fuel efficiency is not yet good.
- the map has a small change in the corresponding integrated score conversion value in the vicinity of zero, 50 points, and 100 points of the integrated score. By doing this, it is possible to convert the total score into a total score conversion value that more accurately reflects the technical level of the driving operation regarding fuel consumption.
- the total score conversion value may be changed linearly with the change of the total score.
- the absolute value of the maximum value (in this example, +5) and the absolute value of the minimum value (in this example, -5) of the integrated score conversion value are the same, but both are set to different sizes.
- the absolute value of the minimum value can be made larger than the absolute value of the maximum value (for example, -10 and +5), and the degree of deduction of the lifetime score is made larger than the degree of addition, to make a severe evaluation score Can.
- the integrated score conversion value is represented by an integer. Therefore, when the integrated score conversion value corresponding to the integrated score is obtained with the decimal point, it is rounded to an integer, for example, by rounding off.
- the total score is in units of 10 points, a total score conversion value of integer values corresponding to the total score of 0, 10, 20,... 100 points may be defined in the table.
- the lifetime score calculation unit 49 calculates the correction value by multiplying the total score conversion value thus obtained by the travel distance of the current driving cycle. The longer the driving distance, the more the amount of experience in driving. By multiplying the travel distance, the correction value can be made a value reflecting experience.
- the correction value based on the integrated score converted value of the current driving cycle is calculated by multiplying the integrated score converted value obtained in the map of FIG. 7B by the travel distance (km) of the current operating cycle.
- an upper limit value to the correction value based on the total score conversion value calculated for each driving cycle.
- 200 points are set as the upper limit value of the correction value based on the total score conversion value in the travel distance.
- the lifetime score calculation unit 49 calculates the current value of the lifetime score by adding the correction value calculated in the current driving cycle to the previous value of the lifetime score.
- the initial value of the lifetime score is zero, and the lifetime score is updated for each driving cycle. As the driving skill level regarding fuel consumption improves, the value of the lifetime score increases.
- the calculated lifetime score is stored in the non-volatile memory 14D.
- the control device 40 calculates the fuel consumption (this is called an instantaneous fuel consumption) at the same timing as calculating the total score. Since the comprehensive score is calculated at predetermined time intervals, the instantaneous fuel consumption represents the fuel consumption per time interval. On the other hand, the control device 40 calculates the average fuel consumption of the drive cycle by dividing the integrated value of the instantaneous fuel consumption from the start of the current drive cycle to the current time by the time length from the start to the current time. The average fuel consumption is stored in the RAM 14B of the controller 40 in pairs with the average score.
- control device 40 calculates an average value of the above four scores and the fuel consumption in units of 5 minutes.
- the accelerator score, the brake score or the idle score is integrated at time intervals of 5 minutes, and the integrated value is divided by the time length of 5 minutes, Calculate the score average value in units of 5 minutes.
- the instantaneous fuel consumption is integrated at time intervals of 5 minutes, and the integrated value is divided by the time length of 5 minutes to calculate a fuel efficiency average value in units of 5 minutes.
- “5 minutes” is an example and may be another time interval.
- the driving state detection unit 41 detects the vehicle speed at a predetermined time interval (which may be the same as the timing for calculating the accelerator score or the like described above).
- the vehicle speed can be detected using the vehicle speed sensor 11A as the various sensors 65 (FIG. 2).
- the vehicle speed state determination unit 54 determines the state of the vehicle speed based on the ratio of the traveling time in which the vehicle speed is within the predetermined range.
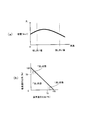
- a too high vehicle speed may reduce the fuel efficiency, and a too low vehicle speed also reduces the fuel efficiency as compared to a medium vehicle speed.
- the fuel consumption according to the accelerator operation decreases if the accelerator pedal depression amount is constant but the vehicle speed is too high, and also decreases if the accelerator pedal depression amount rapidly increases and rapid acceleration is performed. It is preferable to notify the driver when traveling at a too high vehicle speed is performed. Also, as shown in FIG. 10 (a), driving at a too low speed tends to reduce fuel consumption, so to further improve fuel consumption, the driver should be warned of such driving as well. Is preferred.
- the traveling time at the vehicle speed lower than the low threshold and the traveling time at the vehicle speed higher than the high threshold are long, and such traveling is suppressed according to the detection.
- Advise the driver the driver can recognize that there is a possibility that the fuel efficiency may be reduced due to the vehicle speed.
- the vehicle speed state determination unit 54 determines whether the detected vehicle speed is equal to or lower than the low threshold or equal to or higher than the high threshold each time the vehicle speed is detected. to decide. In order to check the ratio (proportion) of the traveling time at the too low vehicle speed and the traveling time at the too high vehicle speed to the elapsed time from the start of one driving cycle, the vehicle speed state determination unit 54 The frequency at which the vehicle speed lower than the threshold is detected and the frequency at which the vehicle speed higher than the high threshold is detected are counted.
- the ratio (expressed as a percentage) of the frequency at which the vehicle speed lower than the low threshold is detected with respect to the vehicle speed detection frequency from the start of the driving cycle to the current time, and the vehicle speed higher than the high threshold Calculate the rate (expressed as a percentage) of the frequency at which was detected. This calculation can be performed at the same timing as the calculation of the total score described above.
- the former is called a low vehicle speed ratio
- the latter is called a high vehicle speed ratio.
- the values of these ratios are stored in the RAM 14B in association with the total score, and stored in the non-volatile memory 14D when the driving cycle is completed.
- the vehicle speed state determination unit 54 determines the vehicle speed state by referring to the map shown in FIG. 10B based on the calculated low vehicle speed ratio and high vehicle speed ratio. This map is stored in the ROM 14C of the control device 40. If 70% of the elapsed time from the start of one driving cycle to the current time is high speed traveling at a high threshold value or more, it is determined that the vehicle speed state is the "high" state.
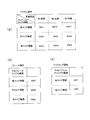
- FIG. 11 shows the configuration of the message table 55 stored in the ROM 14C of the control device 40.
- the message table 55 stores an advice message corresponding to the value of the individual driving operation score for each driving operation.
- the advice message is a message for notifying the driver of advice from the viewpoint of fuel consumption for the driving operation.
- an advice message is stored according to the state of the vehicle speed and the value of the average accelerator score.
- three ranges are set for the average accelerator score value, and a low score range of zero to 29 points, a middle score range of 30 to 69 points, and a high score range of 70 to 100 points Is set.
- For each range there are three vehicle speed states, "good", "low” and "high” states as described above. Therefore, there are nine types of messages represented by MA1 to MA9 as advice messages stored in advance.
- the advice message is stored according to the value of the average brake score, and the low score range, the middle score range and the high score range are set for the value of the average brake score. It is done. Therefore, there are at least three types of messages represented by MB1 to MB3 as advice messages stored in advance.
- an advice message is stored according to the value of the average idle score, and in this example, a low score range of zero to 49 points and 50 to 100 Two ranges of high score range of points are set. Therefore, there are two types of pre-stored advice messages, as represented by MI1 and MI2.
- the 3rd display control part 53 displays the advice (advice) with respect to information, such as said score and driving operation, on the display apparatus 17 of a navigation apparatus with respect to the vehicle provided with a navigation apparatus.
- the other data control device 40 performs calculations for the following items, in addition to the data described above, and stores them in the non-volatile memory 14D at the end of the operation cycle.
- the non-volatile memory 14D stores the various data described above and the data of the following 1) and 2) for the latest five operation cycles. That is, the non-volatile memory 14D stores these data in a first-in-first-out (FIFO) manner, and when it exceeds five operation cycles, the old data is pushed out and deleted.
- FIFO first-in-first-out
- Fuel consumption when traveling on a freeway and distance traveled This is the amount of fuel consumed (cc) and traveling distance (m) when traveling at speeds exceeding 72 km / h. It is calculated by the same calculation as the calculation of the fuel consumption amount and the travel distance of 1).
- the sequentially calculated values are stored in the RAM 14B, and the values at the end of the driving cycle are stored in the non-volatile memory 14D. Note that 72 km / h is a threshold set for the sake of convenience to distinguish between high-speed travel and medium-low speed travel.
- ECON switch 15A for selecting the eco-drive mode provided in the driver's seat and the time traveled in the eco mode by pressing the ECON switch are stored in the non-volatile memory 14D for one driving cycle Overwrite and update at the end of each cycle. Thus, only the latest data is provided to the diagnostic device.
- the idle stop time is extended, the air conditioner is controlled to save energy, the output and rotation of the engine are suppressed, and control of the vehicle is performed with priority given to fuel consumption.
- the service representative brings the tablet terminal to the vehicle, connects the data link connector (DLC) to the ECU 14 of the vehicle, and stores it in the non-volatile memory 14D.
- the stored data is read into the memory of the tablet terminal device, and the data is supplied to the connected personal computer 16B.
- the data read in order to evaluate the driving operation by the user is the data of Table 1 and Table 2 described above.
- the HDS also has a function of diagnosing a failure of the vehicle, and when there is a failure in the vehicle, data necessary for diagnosing the failure of the vehicle is also read to perform normal failure diagnosis.
- the personal computer 16B of the service shop 16 can communicate with the user's personal computer through the Internet connection, and can be configured to be able to view the evaluation result of the driving operation on the user's personal computer.
- a computer program is installed which edits data relating to driving operation for display, displays it on a display device 16D such as an LCD, or outputs it to the printer 16E.
- 12 and 13 show an example of a chart displayed on the screen of the display device 16D edited by the editing program.
- Division 241 of the chart of FIG. 12 indicates the fuel consumption (km / l), the travel distance and the average speed, in which the average fuel consumption of n (n is an integer of 5 or less) driving cycle is the travel distance per liter of fuel.
- Section 243 is the average fuel consumption (km / l) and the distance traveled (km) when traveling at a speed of 72 km / h or less in n driving cycles, and the average fuel consumption and traveling when traveling at a speed exceeding 72 km / h Display distance and.
- the section 245 displays the average value of the total score, the accelerator score, the brake score, and the idle score in n driving cycles. The score is indicated by the number of leaves.
- the section 246 next to the section 245 displays the message of the most frequently appearing improvement points in the evaluation of n operation cycles.
- a message of the message ID with the highest appearance frequency is displayed in n operation cycles (n is an integer of 5 or less).
- n is an integer of 5 or less.
- "bad message” is displayed preferentially in the order of accelerator, idling, and brake.
- the message "The state of being easy to idle stop by turning on ECON" is displayed.
- a message with a high appearance frequency is displayed first in priority, and in the case of the same ratio, an operation point having a large impact on fuel consumption. Is set so that a low score message will be displayed at the same operation point, and it will not be an advice display such as "Pick the corner of the heavy box" for a driver who has good driving operation. There is.
- the lifetime score is divided into three stages according to the score, and the stage of improvement in driving technology regarding fuel saving is displayed by an illustration of a leaf.
- the division 248 next to the division 247 shows in a pie chart how much the eco mode which can be switched by pressing the ECON switch 15A is used.
- a section 249 shows, in a line graph, how the fuel efficiency changes with each driving cycle over n driving cycles.
- the strike distance for each driving cycle is indicated by a solid color (hatched in the figure).
- the left vertical axis indicates fuel consumption, and the right vertical axis indicates travel distance.
- Section 251 graphically illustrates the data on speed and fuel consumption shown in section 243 in more detail.
- the lightly hatched bar graph indicates the fuel consumption when traveling at medium and low speeds for each driving cycle.
- the dark hatched bar graph indicates the fuel consumption when traveling at high speed for each driving cycle.
- a section 253 displays the total travel time in n driving cycles, the total idling time and the total idling fuel consumption.
- a section 255 is a bar graph showing the rate at which idle stop is used for a vehicle with an auto idle stop function.
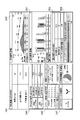
- FIG. 13 is a chart showing details of the data of FIG. 12 with specific numerical values.
- the chart of FIG. 16 is displayed by selecting it on the user's personal computer.
- the section 257 displays the data of the section 249 of FIG. 12 numerically.
- the section 259 displays the data of the section 251 of FIG. 12 as specific numerical values.
- the section 261 breaks down and displays the data of the sections 245 and 253 of FIG. 12 in detail in order to make it easy to compare side by side for each operation cycle.
- the user arranges and presents the display of the relationship between the driving operation and the fuel consumption in the driving cycle for each of the latest past several times (up to 5 times) of his own. By doing this, it is possible to recognize driving habits and trends that you did not notice as data, and to recognize how to achieve better fuel efficiency.
- the service shop not only confirms and verifies that there is no malfunction in the vehicle for customers who have visited for diagnosis regarding fuel consumption, but the serviceman arranges data of the driving condition of each time of the customer regarding driving operation and It is possible to give persuasive advice and improvement instruction to the driving habits and tendency of driving operation while presenting to
- the evaluation of the driving operation is displayed or printed as data, and the growth can be perceived as a data record every time the diagnosis is received several times, so the motivation for aiming for a driving operation that is fuel-efficient as a game is To be done.
Abstract
Description
載されている電子制御装置(ECU)とこの発明の診断装置との全体的な関係を示すブロック図である。電子制御装置14は、車両の燃料噴射、空燃比などを制御するコンピュータであり、CPU14A、CPUに作業領域を提供しプログラムおよびデータを一時記憶するRAM14B、コンピュータ・プログラムを保存する読み取り専用メモリであるROM14C、車両の電源がオフにされた後も記憶を維持する書き換え可能の不揮発性メモリ14D、入力インターフェイス14F、および出力インターフェイス14Gを備える。 Next, embodiments of the present invention will be described with reference to the drawings. FIG. 1 is a block diagram showing an overall relationship between an electronic control unit (ECU) mounted on a vehicle and a diagnostic device of the present invention. The


アクセル採点部43は、アクセル操作に応じて検出された運転状態に基づいて、燃費の観点から該アクセル操作を評価することにより、該アクセル操作に対する採点(スコア)を算出する。 Accelerator scoring data The
次に、図2のブレーキ採点部44について説明する。ブレーキ採点部44は、ブレーキ操作に応じて検出された運転状態に基づいて、燃費の観点から該ブレーキ操作を評価することにより、該ブレーキ操作に対する採点(スコア)を算出する。 Brake Scoring Next, the
図2に戻り、運転状態検出部41は、車両のアイドリング運転状態を検出する。1運転サイクルにおいてアイドリング運転が最初に開始されたとき、アイドル運転採点部45は、アイドルスコアに初期値を設定する。また、アイドル運転採点部45は、アイドリング運転が検出されるたびに、該アイドリング運転の経過時間を計測するためのタイマ(図示せず)を始動させ、アイドリング運転が開始されてから所定時間が経過した後、アイドルスコアを、所定の時間間隔で所定値だけ減点していく。 Returns to the idle scoring Figure 2, the operating
図2に戻り、積算部47は、上述のようにして算出されたアクセルスコア、ブレーキスコア、アイドルスコアを、所定の時間間隔で積算していく。積算は、この例では、車両のエンジンの始動から停止(すなわち、イグニションのオンからオフ)までの1運転サイクルごとに行われる。 Calculation of Average Score Referring back to FIG. 2, the
図9は、制御部40により実行される、総合スコア算出プロセスのフローの一例である。積算(S12)までのプロセスは、所定の時間間隔(たとえば、100ミリ秒)で実行される。 Overall Score Calculation Flow FIG. 9 is an example of a flow of an overall score calculation process executed by the
総合スコアは、運転サイクル中の平均の燃費状態を表す。生涯スコアは、複数の運転サイクルにわたる総合スコアの積算値であり、燃費に関する運転操作の技術レベルを表している。 The calculated total score of the lifetime score represents the average fuel consumption state during the driving cycle. The lifetime score is an integrated value of the integrated score over a plurality of driving cycles and represents the technical level of driving operation regarding fuel consumption.
図2に戻り、第3表示制御部53によるアドバイスメッセージの生成について説明する。この例では、制御装置40は、総合スコアを算出するのと同じタイミングで燃費(これを、瞬間燃費と呼ぶ)を計算する。総合スコアは、所定の時間間隔で算出されるので、瞬間燃費は、該時間間隔あたりの燃費を表す。他方、制御装置40は、今回の運転サイクルの開始から現時刻までの瞬間燃費の積算値を、該開始から現時刻までの時間長で除算することにより、該運転サイクルの平均燃費を計算する。平均燃費は、平均スコアと対になって、制御装置40のRAM14Bに記憶される。 Advice Message Referring back to FIG. 2, generation of the advice message by the third
制御装置40は、以上に説明したデータのほかに、次の項目について計算を行い、運転サイクルの終了時に不揮発性メモリ14Dに保存する。不揮発性メモリ14Dは、以上に説明した諸々のデータおよび次の1)および2)のデータを最新の5つの運転サイクルについて保存する。すなわち、不揮発性メモリ14Dは、これらのデータをFIFO(first-in-first-out)方式で記憶し、5運転サイクルを超えると、古いデータは押し出されて削除される。 The other
72km/h以下で走行した時間における燃料消費量(cc)および走行距離(m)である。車速センサ11Aが72km/hを示すとき、ECU14がインジェクタ(燃料噴射装置)を作動させる時間の合計から燃料噴射量を算出する。同時に車速72km/h以下で走行した距離の合計を算出する。逐次算出される値は、RAM14Bに記憶され、運転サイクルの終了時における値が不揮発性メモリ14Dに保存される。 1) Fuel consumption when traveling in urban areas and fuel consumption (cc) and traveling distance (m) during traveling with a distance of 72 km / h or less. When the
72km/hを超える速度で走行した時間における燃料消費量(cc)および走行距離(m)である。1)の燃料消費量および走行距離の算出と同様の演算により算出される。逐次算出される値は、RAM14Bに記憶され、運転サイクルの終了時における値が不揮発性メモリ14Dに保存される。なお、72km/hは、高速走行と中低速走行を区別するために便宜上設定した閾値である。 2) Fuel consumption when traveling on a freeway and distance traveled This is the amount of fuel consumed (cc) and traveling distance (m) when traveling at speeds exceeding 72 km / h. It is calculated by the same calculation as the calculation of the fuel consumption amount and the travel distance of 1). The sequentially calculated values are stored in the
運転席に設けられる、エコドライブ・モードを選択するECONスイッチ15Aの使用頻度およびECONスイッチを押したエコモードで走行した時間を1運転サイクル分だけ不揮発性メモリ14Dに保存し、運転サイクルの終了ごとに上書きして更新する。したがって、診断装置には、最新のデータだけが提供される。 3) ECON switch The frequency of use of the ECON switch 15A for selecting the eco-drive mode provided in the driver's seat and the time traveled in the eco mode by pressing the ECON switch are stored in the
上述の生涯スコアが不揮発性メモリ14Dに保存される。 4) Lifetime Score of Vehicle The above-mentioned lifetime score is stored in the
生涯スコアのステージを車両のエコクラスとする。 5) Eco-class of vehicle Set the stage of lifetime score as eco-class of vehicle.
Claims (6)
- 車両の運転サイクルごとにユーザの運転操作に応じた該車両の燃費状態を示す運転データを保存する不揮発性メモリを備えた車両の電子制御装置から、複数の運転サイクルにわたる前記運転データを読み出す手段と、
読み出された前記運転データに基づいて前記運転サイクルごとにユーザによる運転操作ごとの燃費状態を示すチャートを作成する手段と、
前記チャートを前記運転サイクルごとの比較結果として可視的に出力する手段と、
を備える、車両外部に設けられた、運転操作の診断装置。 And a means for reading the driving data over a plurality of driving cycles from the electronic control unit of the vehicle provided with a non-volatile memory for storing driving data indicating the fuel consumption state of the vehicle according to the user's driving operation every driving cycle of the vehicle ,
A means for creating a chart showing fuel consumption states for each driving operation by the user for each driving cycle based on the read operation data;
Means for visually outputting the chart as a comparison result for each driving cycle;
A diagnosis apparatus for driving operation, provided outside the vehicle, comprising: - 前記運転サイクルは、前記車両のイグニションをオンにしたときからオフにするまでの運転期間であり、前記電子制御装置は、走行速度および走行距離の少なくとも一方が所定値に達しない場合、またはエンジン始動後所定時間継続してエンジンが回転していないときは、この運転サイクルの運転データの前記不揮発性メモリへの記録を禁止するよう構成されている、請求項1に記載の診断装置。 The driving cycle is a driving period from when the ignition of the vehicle is turned on to when it is turned off, and the electronic control unit determines that at least one of the traveling speed and the traveling distance does not reach a predetermined value or The diagnostic device according to claim 1, wherein recording of operation data of the operation cycle to the non-volatile memory is prohibited when the engine is not rotating continuously for a predetermined time afterward.
- 前記運転データは、前記車両の燃費の状態について燃費に影響する運転操作項目ごとに前記電子制御装置が算出する評価スコア、および燃費状態に関してユーザに提示するためのアドバイスメッセージを含み、
前記診断装置は、前記電子制御装置から読み出した複数の前記アドバイスメッセージのうち、前記評価スコアが低い運転操作項目に対応するアドバイスメッセージを選択して可視的に出力するよう構成されている、請求項2に記載の診断装置。 The driving data includes an evaluation score calculated by the electronic control unit for each driving operation item affecting the fuel consumption of the state of the fuel consumption of the vehicle, and an advice message for presenting to the user regarding the fuel consumption state.
The diagnostic device is configured to select and visually output an advice message corresponding to a driving operation item having a low evaluation score among the plurality of advice messages read from the electronic control device. The diagnostic device according to 2. - 車両の運転サイクルごとにユーザの運転操作に応じた該車両の燃費状態を示す運転データを保存する不揮発性メモリを備えた電子制御装置から、複数の運転サイクルにわたる前記運転データを車両外部に読み出し、
読み出された前記運転データに基づいて前記運転サイクルごとにユーザによる運転操作ごとの燃費状態を示すチャートを作成し、
前記チャートを前記運転サイクルごとの比較結果として車両外部で可視的に出力することを含む、運転操作の診断方法。 The driving data over a plurality of driving cycles are read out of the vehicle from an electronic control unit provided with a non-volatile memory for storing driving data indicating the fuel consumption state of the vehicle according to the driving operation of the user every driving cycle of the vehicle.
Based on the read operation data, a chart showing fuel consumption state for each driving operation by the user is created for each driving cycle,
A method of diagnosing a driving operation, comprising visually outputting the chart outside the vehicle as a comparison result for each driving cycle. - 前記運転サイクルは、前記車両のイグニションをオンにしたときからオフにするまでの運転期間であり、前記電子制御装置は、走行速度および走行距離の少なくとも一方が所定値に達しない場合、またはエンジン始動後所定時間継続してエンジンが回転していないときは、この運転サイクルの運転データの前記不揮発性メモリへの記録を禁止する、請求項4に記載の診断方法。 The driving cycle is a driving period from when the ignition of the vehicle is turned on to when it is turned off, and the electronic control unit determines that at least one of the traveling speed and the traveling distance does not reach a predetermined value or 5. The diagnostic method according to claim 4, wherein the recording of the operation data of this operation cycle to the non-volatile memory is prohibited when the engine is not rotating continuously for a predetermined time after the completion of the operation.
- 前記運転データは、前記車両の燃費の状態について燃費に影響する運転操作項目ごとに前記電子制御装置が算出する評価スコア、および燃費状態に関してユーザに提示するためのアドバイスメッセージを含み、
前記電子制御装置から車両外部に読み出した複数の前記アドバイスメッセージのうち、前記評価スコアが低い運転操作項目に対応するアドバイスメッセージを選択して可視的に出力する、請求項5に記載の診断方法。 The driving data includes an evaluation score calculated by the electronic control unit for each driving operation item affecting the fuel consumption of the state of the fuel consumption of the vehicle, and an advice message for presenting to the user regarding the fuel consumption state.
The diagnostic method according to claim 5, wherein an advice message corresponding to a driving operation item having a low evaluation score among the plurality of advice messages read out of the vehicle from the electronic control unit is selected and visibly output.
Priority Applications (2)
| Application Number | Priority Date | Filing Date | Title |
|---|---|---|---|
| US13/256,238 US8660785B2 (en) | 2009-03-19 | 2010-03-09 | Method and apparatus for diagnosing driving operation |
| CN201080011893XA CN102348968A (en) | 2009-03-19 | 2010-03-09 | Method and device for diagnosing driving operation |
Applications Claiming Priority (2)
| Application Number | Priority Date | Filing Date | Title |
|---|---|---|---|
| JP2009068294A JP5410125B2 (en) | 2009-03-19 | 2009-03-19 | Method and apparatus for diagnosing driving maneuvers |
| JP2009-068294 | 2009-03-19 |
Publications (1)
| Publication Number | Publication Date |
|---|---|
| WO2010106760A1 true WO2010106760A1 (en) | 2010-09-23 |
Family
ID=42739428
Family Applications (1)
| Application Number | Title | Priority Date | Filing Date |
|---|---|---|---|
| PCT/JP2010/001671 WO2010106760A1 (en) | 2009-03-19 | 2010-03-09 | Method and device for diagnosing driving operation |
Country Status (4)
| Country | Link |
|---|---|
| US (1) | US8660785B2 (en) |
| JP (1) | JP5410125B2 (en) |
| CN (1) | CN102348968A (en) |
| WO (1) | WO2010106760A1 (en) |
Cited By (2)
| Publication number | Priority date | Publication date | Assignee | Title |
|---|---|---|---|---|
| CN103890558A (en) * | 2011-10-24 | 2014-06-25 | 本田技研工业株式会社 | Vehicle diagnostic method, and external diagnostic device |
| CN113010118A (en) * | 2021-03-25 | 2021-06-22 | 四川百纳科技有限责任公司 | Method for processing mileage and hour meter data stored in automobile |
Families Citing this family (27)
| Publication number | Priority date | Publication date | Assignee | Title |
|---|---|---|---|---|
| JP4955625B2 (en) * | 2008-08-01 | 2012-06-20 | 株式会社デンソー | Driving advice providing device, driving diagnosis device |
| MX357760B (en) * | 2011-02-25 | 2018-07-24 | Vnomics Corp | System and method for in-vehicle operator training. |
| JP5872229B2 (en) * | 2011-09-29 | 2016-03-01 | クラリオン株式会社 | Information terminal |
| US20130173136A1 (en) * | 2012-01-04 | 2013-07-04 | Samsung Electronics Co., Ltd. | Apparatus and method for displaying vehicle-driving information in mobile terminal |
| CN102620772B (en) * | 2012-03-31 | 2015-04-22 | 北京经纬恒润科技有限公司 | Monitoring method, device and system for driving action of tester in test car yard |
| US9911249B2 (en) * | 2012-09-20 | 2018-03-06 | GM Global Technology Operations LLC | Fail operational power system diagnostics |
| JP5738832B2 (en) * | 2012-12-13 | 2015-06-24 | 富士重工業株式会社 | Vehicle display device |
| JP6073169B2 (en) * | 2013-03-27 | 2017-02-01 | 住友建機株式会社 | Excavator |
| BR112015027242A2 (en) * | 2013-05-03 | 2017-07-25 | Clever Devices | method for providing a vehicle component failure score, apparatus for providing a vehicle component failure score, and article of manufacture for providing a vehicle component failure score |
| US11279357B2 (en) * | 2013-12-25 | 2022-03-22 | Denso Corporation | Vehicle diagnosis system and method |
| KR101551028B1 (en) * | 2013-12-26 | 2015-09-07 | 현대자동차주식회사 | Control system for reducing enery consumption of air conditioner |
| CN103700160B (en) * | 2013-12-31 | 2016-07-13 | 江苏中寰卫星导航通信有限公司 | Carried on vehicle terminal and driving behavior determination methods based on microsensor |
| JP6317702B2 (en) * | 2014-05-19 | 2018-04-25 | 株式会社堀場製作所 | Road test equipment |
| JP2016089716A (en) * | 2014-11-05 | 2016-05-23 | ヤマハ発動機株式会社 | Saddle-riding type vehicle |
| US20160140780A1 (en) * | 2014-11-18 | 2016-05-19 | Hyundai Motor Company | System and method of calculating distance to empty of eco-friendly vehicle |
| JP6508565B2 (en) * | 2014-12-26 | 2019-05-08 | スズキ株式会社 | Vehicle display device |
| JP6342858B2 (en) * | 2015-08-06 | 2018-06-13 | 矢崎エナジーシステム株式会社 | Driving evaluation device |
| JP6193417B2 (en) * | 2016-02-10 | 2017-09-06 | 本田技研工業株式会社 | Idling stop device |
| JP6605381B2 (en) * | 2016-03-30 | 2019-11-13 | 株式会社日立製作所 | Driving diagnosis device, driving diagnosis system, terminal device |
| US10449916B2 (en) * | 2017-06-05 | 2019-10-22 | Paccar Inc. | Method for improving fuel economy by influencing driver behavior |
| WO2019043862A1 (en) * | 2017-08-31 | 2019-03-07 | 本田技研工業株式会社 | Vehicle control device |
| CN111465739A (en) * | 2017-12-11 | 2020-07-28 | 住友建机株式会社 | Excavator |
| US20200043259A1 (en) * | 2018-08-06 | 2020-02-06 | GM Global Technology Operations LLC | System and method for enhancing vehicle user experience |
| CN111497854B (en) * | 2019-01-29 | 2022-01-14 | 长城汽车股份有限公司 | Method and device for evaluating driving condition of driver and machine-readable storage medium |
| CN110308715A (en) * | 2019-06-25 | 2019-10-08 | 重庆长安汽车股份有限公司 | Reading data shows that equipment, automatic Pilot critical data read display system and method |
| CN113815624B (en) * | 2020-06-19 | 2023-01-06 | 比亚迪股份有限公司 | Driving behavior evaluation method, driving behavior evaluation device, vehicle, and storage medium |
| CN114526930B (en) * | 2022-03-09 | 2024-03-26 | 河南职业技术学院 | Intelligent network-connected automobile fault detection method and system |
Citations (8)
| Publication number | Priority date | Publication date | Assignee | Title |
|---|---|---|---|---|
| JP2000247162A (en) * | 1999-02-26 | 2000-09-12 | Mitsubishi Motors Corp | Operating state evaluating device for vehicle |
| JP2003328845A (en) * | 2002-05-10 | 2003-11-19 | Isuzu Motors Ltd | Device and method for evaluating fuel saving operation |
| JP2003331380A (en) * | 2002-05-16 | 2003-11-21 | Miyama Kk | Vehicle operation information management evaluation system |
| JP2006243856A (en) * | 2005-03-01 | 2006-09-14 | Hitachi Ltd | Operation diagnosis method and its device |
| JP2006344001A (en) * | 2005-06-09 | 2006-12-21 | Omron Corp | Operation management system |
| JP2007023830A (en) * | 2005-07-13 | 2007-02-01 | Hino Motors Ltd | Fuel consumption evaluation device |
| JP2007106195A (en) * | 2005-10-12 | 2007-04-26 | Toyota Motor Corp | Drive advice system |
| JP2007122239A (en) * | 2005-10-26 | 2007-05-17 | Toyota Motor Corp | Vehicle driving information display device |
Family Cites Families (10)
| Publication number | Priority date | Publication date | Assignee | Title |
|---|---|---|---|---|
| JP3642745B2 (en) * | 2001-06-05 | 2005-04-27 | ミヤマ株式会社 | Vehicle operating state evaluation system |
| JP2003042000A (en) | 2001-07-27 | 2003-02-13 | Hanshin Electric Co Ltd | Fuel economy display device |
| JP3747015B2 (en) * | 2002-07-11 | 2006-02-22 | 本田技研工業株式会社 | Fuel consumption meter for vehicles |
| JP2005241599A (en) * | 2004-02-27 | 2005-09-08 | Fuji Heavy Ind Ltd | Data recorder, and data recording method |
| JP4353475B2 (en) | 2004-08-18 | 2009-10-28 | 日産ディーゼル工業株式会社 | Fuel consumption evaluation system |
| JP2007213324A (en) * | 2006-02-09 | 2007-08-23 | Nissan Motor Co Ltd | Driving evaluation support system and method for calculating driving evaluation data |
| JP5217103B2 (en) | 2006-03-24 | 2013-06-19 | トヨタ自動車株式会社 | Fuel consumption display device |
| US20080319605A1 (en) * | 2007-06-25 | 2008-12-25 | James Keith Davis | Fuel monitoring device, system, and method |
| JP2009015789A (en) * | 2007-07-09 | 2009-01-22 | Denso Corp | Drive recorder and drive recorder system |
| US8224561B2 (en) * | 2007-12-13 | 2012-07-17 | Hyundai Motor Company | System for assisting fuel-efficient driving |
-
2009
- 2009-03-19 JP JP2009068294A patent/JP5410125B2/en active Active
-
2010
- 2010-03-09 WO PCT/JP2010/001671 patent/WO2010106760A1/en active Application Filing
- 2010-03-09 CN CN201080011893XA patent/CN102348968A/en active Pending
- 2010-03-09 US US13/256,238 patent/US8660785B2/en not_active Expired - Fee Related
Patent Citations (8)
| Publication number | Priority date | Publication date | Assignee | Title |
|---|---|---|---|---|
| JP2000247162A (en) * | 1999-02-26 | 2000-09-12 | Mitsubishi Motors Corp | Operating state evaluating device for vehicle |
| JP2003328845A (en) * | 2002-05-10 | 2003-11-19 | Isuzu Motors Ltd | Device and method for evaluating fuel saving operation |
| JP2003331380A (en) * | 2002-05-16 | 2003-11-21 | Miyama Kk | Vehicle operation information management evaluation system |
| JP2006243856A (en) * | 2005-03-01 | 2006-09-14 | Hitachi Ltd | Operation diagnosis method and its device |
| JP2006344001A (en) * | 2005-06-09 | 2006-12-21 | Omron Corp | Operation management system |
| JP2007023830A (en) * | 2005-07-13 | 2007-02-01 | Hino Motors Ltd | Fuel consumption evaluation device |
| JP2007106195A (en) * | 2005-10-12 | 2007-04-26 | Toyota Motor Corp | Drive advice system |
| JP2007122239A (en) * | 2005-10-26 | 2007-05-17 | Toyota Motor Corp | Vehicle driving information display device |
Cited By (3)
| Publication number | Priority date | Publication date | Assignee | Title |
|---|---|---|---|---|
| CN103890558A (en) * | 2011-10-24 | 2014-06-25 | 本田技研工业株式会社 | Vehicle diagnostic method, and external diagnostic device |
| CN113010118A (en) * | 2021-03-25 | 2021-06-22 | 四川百纳科技有限责任公司 | Method for processing mileage and hour meter data stored in automobile |
| CN113010118B (en) * | 2021-03-25 | 2022-09-16 | 四川百纳科技有限责任公司 | Method for processing mileage and hour meter data stored in automobile |
Also Published As
| Publication number | Publication date |
|---|---|
| JP2010223607A (en) | 2010-10-07 |
| US8660785B2 (en) | 2014-02-25 |
| JP5410125B2 (en) | 2014-02-05 |
| US20120065874A1 (en) | 2012-03-15 |
| CN102348968A (en) | 2012-02-08 |
Similar Documents
| Publication | Publication Date | Title |
|---|---|---|
| WO2010106760A1 (en) | Method and device for diagnosing driving operation | |
| JP4954173B2 (en) | Device for instructing the driver on driving operation to improve fuel efficiency | |
| CN102112724B (en) | Device for diagnosing fuel saving operation, system for diagnosing fuel saving operation, controller of prime mover, device for scoring fuel saving operation and method for diagnosing fuel saving operation | |
| US10055908B2 (en) | Real-time driver reward display system and method | |
| US8207838B2 (en) | Eco-drive assist apparatus and method | |
| EP2320052A1 (en) | Fuel saving driving diagnostic equipment, in-vehicle system, drive control apparatus, and fuel saving driving diagnostic program | |
| US20080306636A1 (en) | Enhanced display for presenting tachometer information | |
| US8249767B2 (en) | Eco-drive assist apparatus and method | |
| EP2036777A1 (en) | Method and system of providing driving data to a driver of a vehicle | |
| EP2359032B1 (en) | Gear feedback system | |
| JP2009289080A (en) | Driving evaluation device and driving evaluation method | |
| JP4424315B2 (en) | Hybrid vehicle driving operation evaluation system | |
| EP2369159B1 (en) | Fuel-saving driving evaluation system | |
| CN104144836A (en) | Method and device for providing driver feedback | |
| EP2785572B1 (en) | Systems and methods for determining speed control management settings | |
| US8494754B2 (en) | Condition evaluation system for engine-driven traveling vehicle | |
| CN106353485A (en) | Method and system for monitoring freshness of fuel in vehicles | |
| US20180345885A1 (en) | Method for improving fuel economy by influencing driver behavior | |
| JP5253891B2 (en) | Driving evaluation device, driving evaluation method, and driving evaluation program | |
| JP5104069B2 (en) | Fuel consumption display device | |
| JP2009156132A (en) | Eco drive assist device | |
| JP4836095B2 (en) | Fuel saving driving diagnosis device, in-vehicle system and fuel saving driving diagnosis program | |
| WO2014037427A1 (en) | System and method for providing driver feedback relating to a plurality of vehicle operating parameters, corresponding computer readable medium and vehicle with such a system | |
| JP2010102699A (en) | Vehicle operation management system | |
| JP5406736B2 (en) | Vehicle driving evaluation system |
Legal Events
| Date | Code | Title | Description |
|---|---|---|---|
| WWE | Wipo information: entry into national phase |
Ref document number: 201080011893.X Country of ref document: CN |
|
| 121 | Ep: the epo has been informed by wipo that ep was designated in this application |
Ref document number: 10753257 Country of ref document: EP Kind code of ref document: A1 |
|
| NENP | Non-entry into the national phase |
Ref country code: DE |
|
| WWE | Wipo information: entry into national phase |
Ref document number: 13256238 Country of ref document: US |
|
| 122 | Ep: pct application non-entry in european phase |
Ref document number: 10753257 Country of ref document: EP Kind code of ref document: A1 |