CN102348968A - Method and device for diagnosing driving operation - Google Patents
Method and device for diagnosing driving operation Download PDFInfo
- Publication number
- CN102348968A CN102348968A CN201080011893XA CN201080011893A CN102348968A CN 102348968 A CN102348968 A CN 102348968A CN 201080011893X A CN201080011893X A CN 201080011893XA CN 201080011893 A CN201080011893 A CN 201080011893A CN 102348968 A CN102348968 A CN 102348968A
- Authority
- CN
- China
- Prior art keywords
- driving
- vehicle
- mark
- fuel efficiency
- driver behavior
- Prior art date
- Legal status (The legal status is an assumption and is not a legal conclusion. Google has not performed a legal analysis and makes no representation as to the accuracy of the status listed.)
- Pending
Links
- 238000000034 method Methods 0.000 title description 27
- 239000000446 fuel Substances 0.000 claims abstract description 140
- 238000011156 evaluation Methods 0.000 claims abstract description 20
- 230000006399 behavior Effects 0.000 claims description 61
- 238000009434 installation Methods 0.000 claims description 30
- 238000002405 diagnostic procedure Methods 0.000 claims description 8
- 230000000052 comparative effect Effects 0.000 claims description 5
- 238000003745 diagnosis Methods 0.000 abstract description 15
- 238000012423 maintenance Methods 0.000 abstract description 4
- 230000003319 supportive effect Effects 0.000 abstract 1
- 238000013507 mapping Methods 0.000 description 27
- 230000001133 acceleration Effects 0.000 description 21
- 230000008569 process Effects 0.000 description 11
- 230000006870 function Effects 0.000 description 7
- 238000010586 diagram Methods 0.000 description 5
- 238000004364 calculation method Methods 0.000 description 4
- 230000003247 decreasing effect Effects 0.000 description 4
- 238000002347 injection Methods 0.000 description 3
- 239000007924 injection Substances 0.000 description 3
- 238000004590 computer program Methods 0.000 description 2
- 230000001186 cumulative effect Effects 0.000 description 2
- 238000005516 engineering process Methods 0.000 description 2
- 230000006872 improvement Effects 0.000 description 2
- 238000003032 molecular docking Methods 0.000 description 2
- 230000009471 action Effects 0.000 description 1
- 238000004378 air conditioning Methods 0.000 description 1
- 230000004075 alteration Effects 0.000 description 1
- 230000008859 change Effects 0.000 description 1
- 238000004891 communication Methods 0.000 description 1
- 238000013500 data storage Methods 0.000 description 1
- 238000012217 deletion Methods 0.000 description 1
- 230000037430 deletion Effects 0.000 description 1
- 238000013461 design Methods 0.000 description 1
- 238000001514 detection method Methods 0.000 description 1
- 230000006866 deterioration Effects 0.000 description 1
- 238000002474 experimental method Methods 0.000 description 1
- 239000012467 final product Substances 0.000 description 1
- 230000002045 lasting effect Effects 0.000 description 1
- 230000007257 malfunction Effects 0.000 description 1
- 238000012986 modification Methods 0.000 description 1
- 230000004048 modification Effects 0.000 description 1
- 230000008450 motivation Effects 0.000 description 1
- 230000006855 networking Effects 0.000 description 1
- 238000012545 processing Methods 0.000 description 1
- 230000009467 reduction Effects 0.000 description 1
- 230000035807 sensation Effects 0.000 description 1
- 230000003068 static effect Effects 0.000 description 1
Images


Classifications
-
- G—PHYSICS
- G07—CHECKING-DEVICES
- G07C—TIME OR ATTENDANCE REGISTERS; REGISTERING OR INDICATING THE WORKING OF MACHINES; GENERATING RANDOM NUMBERS; VOTING OR LOTTERY APPARATUS; ARRANGEMENTS, SYSTEMS OR APPARATUS FOR CHECKING NOT PROVIDED FOR ELSEWHERE
- G07C5/00—Registering or indicating the working of vehicles
- G07C5/08—Registering or indicating performance data other than driving, working, idle, or waiting time, with or without registering driving, working, idle or waiting time
- G07C5/0816—Indicating performance data, e.g. occurrence of a malfunction
- G07C5/0825—Indicating performance data, e.g. occurrence of a malfunction using optical means
-
- B60K35/28—
-
- B—PERFORMING OPERATIONS; TRANSPORTING
- B60—VEHICLES IN GENERAL
- B60R—VEHICLES, VEHICLE FITTINGS, OR VEHICLE PARTS, NOT OTHERWISE PROVIDED FOR
- B60R16/00—Electric or fluid circuits specially adapted for vehicles and not otherwise provided for; Arrangement of elements of electric or fluid circuits specially adapted for vehicles and not otherwise provided for
- B60R16/02—Electric or fluid circuits specially adapted for vehicles and not otherwise provided for; Arrangement of elements of electric or fluid circuits specially adapted for vehicles and not otherwise provided for electric constitutive elements
- B60R16/023—Electric or fluid circuits specially adapted for vehicles and not otherwise provided for; Arrangement of elements of electric or fluid circuits specially adapted for vehicles and not otherwise provided for electric constitutive elements for transmission of signals between vehicle parts or subsystems
- B60R16/0231—Circuits relating to the driving or the functioning of the vehicle
- B60R16/0236—Circuits relating to the driving or the functioning of the vehicle for economical driving
-
- G—PHYSICS
- G07—CHECKING-DEVICES
- G07C—TIME OR ATTENDANCE REGISTERS; REGISTERING OR INDICATING THE WORKING OF MACHINES; GENERATING RANDOM NUMBERS; VOTING OR LOTTERY APPARATUS; ARRANGEMENTS, SYSTEMS OR APPARATUS FOR CHECKING NOT PROVIDED FOR ELSEWHERE
- G07C5/00—Registering or indicating the working of vehicles
- G07C5/004—Indicating the operating range of the engine
-
- B60K2360/174—
-
- Y—GENERAL TAGGING OF NEW TECHNOLOGICAL DEVELOPMENTS; GENERAL TAGGING OF CROSS-SECTIONAL TECHNOLOGIES SPANNING OVER SEVERAL SECTIONS OF THE IPC; TECHNICAL SUBJECTS COVERED BY FORMER USPC CROSS-REFERENCE ART COLLECTIONS [XRACs] AND DIGESTS
- Y02—TECHNOLOGIES OR APPLICATIONS FOR MITIGATION OR ADAPTATION AGAINST CLIMATE CHANGE
- Y02T—CLIMATE CHANGE MITIGATION TECHNOLOGIES RELATED TO TRANSPORTATION
- Y02T10/00—Road transport of goods or passengers
- Y02T10/80—Technologies aiming to reduce greenhouse gasses emissions common to all road transportation technologies
- Y02T10/84—Data processing systems or methods, management, administration
Abstract
A complaint or dissatisfaction to fuel consumption is diagnosed in a maintenance factory or the like just as normal vehicle fault diagnosis, and the result of the diagnosis is presented to a user together with the evaluation of a driving operation and the supportive data so that a driving operation suitable for the user is recognized. A diagnostic device is provided with a means for reading driving data over a plurality of driving cycles from a vehicle equipped with a storage device for storing the driving data indicating the fuel consumption state of the vehicle in accordance with the driving operation for each of the driving cycles of the vehicle, a means for creating a chart representing a fuel consumption state per driving operation for each of the driving cycles on the basis of the read driving data, and a means for outputting the charts onto a display device or to a printer as the result of the comparison of each of the driving cycles.
Description
Technical field
The present invention relates to likewise realize that to seeking the vehicle driving operation that fuel efficiency improves carries out method of diagnosing in 0vehicle marketing shop and maintenance factory etc. with common car fault diagnosis.
Background technology
Recently, the user improves about the consciousness of fuel efficiency, pursues more that the driving of low fuel consumption becomes trend, " fuel efficiency is lower than expected value, has broken down? ", the user who has bought vehicle sends such complaint, the discontented trend that increase is also arranged.
Fuel efficiency is represented with the vehicle ' distance of per unit Fuel Consumption.A kind of like this method is disclosed in the patent documentation 1: current fuel efficiency and predefined target fuel efficiency are compared, thereby judge whether current fuel efficiency is good, and logical the giving of this result of determination known the occupant.
In addition, disclose a kind of like this method in the patent documentation 2: the state of based on fuel efficient changes the brightness of demonstration fuel efficiency and at least one side in the tone.For example, when fuel efficiency reduces predetermined value, change brightness or tone.
And, put down in writing a kind of like this method in the patent documentation 3: receive the service data of vehicle from vehicle navigation apparatus, judge the attribute that travels of vehicle, and acceleration profile is carried out statistical treatment, thereby carry out security diagnostics according to this service data.Obtain Fuel Consumption according to service data, and fuel consumption saving driving is diagnosed.Through this method, owing to adopt vehicle navigation apparatus that the service data of vehicle is sent to the driving diagnosis server, therefore not only increased the burden of vehicle navigation apparatus, and in order to adopt this method also need carry out design alteration to vehicle navigation apparatus itself,
The prior art document
Patent documentation
Patent documentation 1: TOHKEMY 2003-42000 communique
Patent documentation 2: TOHKEMY 2007-256158 communique
Patent documentation 3: TOHKEMY 2006-243856 communique
Summary of the invention
The problem that invention will solve
Method in the past is whether the driver fuel efficiency is good, or adopts brightness or tone driver fuel efficiency to reduce still and improved.Whether " notice " so only is to notify fuel efficiency good to operation or situation at any time in driving, and for having what kind of driving habits or what kind of driver behavior to make fuel efficiency reduce and how improve driver behavior information is not provided.
Therefore; Expect a kind of like this method: reach discontented for complaint to fuel efficiency; Can likewise diagnose with common car fault diagnosis in maintenance factory etc.; And this diagnostic result and the evaluation of supporting driver behavior and the data of suggestion offered the user in the lump, and can how carry out driver behavior and can improve the fuel efficiency this respect more and provide suggestion to the driver.
Solve the means of problem
Diagnostic device of the present invention has like lower unit: the unit of reading the driving data in a plurality of driving cycle from electronic-controlled installation; Said electronic-controlled installation had according to each vehicle drive cycle preserves the nonvolatile memory of said driving data, the fuel efficiency state of corresponding this vehicle of said driving data representation and driver behavior; According to the unit of the said driving data creating chart of being read, this chart illustrates the fuel efficiency state of each driver behavior of driver according to each said driving cycle; And output to said chart on the display device as the comparative result in each said driving cycle or the unit of printer.
According to the present invention; The complaint that is directed to fuel efficiency reaches discontented; With common car fault diagnosis likewise; Can diagnose in maintenance factory etc.; And this diagnostic result and the evaluation of supporting driver behavior and the data of suggestion offered the user in the lump, thereby what kind of driver behavior the user is recognized will obtain better fuel efficiency to carry out.
In a mode of the present invention; The driving cycle is that vehicle begins when point catches fire during the flame-out driving; Electronic-controlled installation constitutes like this: at least one Fang Wei reaches under the situation of predetermined value in travel speed and operating range, or when continuing after engine start that the schedule time, engine did not rotate, electronic-controlled installation is forbidden the record of driving data in said nonvolatile memory in this driving cycle.
In another mode of the present invention; The driving data comprise: for the fuel efficiency state of vehicle; Electronic-controlled installation influence evaluation score that driver behavior project of fuel efficiency calculates to each and about the advice message of fuel efficiency state to user prompt, diagnostic device select from a plurality of said advice message that electronic-controlled installation is read, visually export corresponding to the advice message of the low driver behavior project of said evaluation score.
Description of drawings
Fig. 1 is the block diagram that onboard system is shown and is arranged at the relation between the diagnostic device in service station.
Fig. 2 is the functional block diagram of the control part 40 of onboard system.
Fig. 3 is used to illustrate the figure that obtains with the method for the corresponding throttle mark of throttle operation.
Fig. 4 is used to illustrate the figure that obtains with the method for the corresponding throttle mark of throttle operation.
Fig. 5 is used to illustrate obtain the figure that brakes the method for mark with brake operating accordingly.
Fig. 6 is used to illustrate obtain the figure that brakes the method for mark with brake operating accordingly.
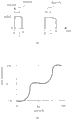
(A) of Fig. 7 is used to illustrate obtain the figure that drives the method for corresponding mark with idling; (B) show an example that comprehensive mark is scaled the mapping graph of the value that is used to calculate lifelong mark.
Fig. 8 is the figure that illustrates with an example of the accumulative total of corresponding each mark of driver behavior.
Fig. 9 is the process flow diagram that the process of calculating comprehensive mark is shown.
Figure 10 is the figure that the relation of the speed of a motor vehicle and fuel efficiency is shown.
Figure 11 is the figure that an example of advice message is shown.
Figure 12 is the figure of an example that the picture of the driving diagnostic result that diagnostic device shows is shown.
Figure 13 is the figure of another example that the picture of the driving diagnostic result that diagnostic device shows is shown.
Embodiment
With reference to the accompanying drawings embodiment of the present invention is described.Fig. 1 illustrates the electronic-controlled installation (ECU) that carries in the vehicle and the block diagram of the overall relation between the diagnostic device of the present invention.Electronic-controlled installation 14 is computing machines of fuel injections, air-fuel ratio etc. of control vehicle, and it has CPU 14A, the operating area is provided and rewritable nonvolatile memory 14D, input interface 14F and the output interface 14G of storage are still kept in RAM 14B, the conduct of temporarily program and data being stored after being used to preserve the ROM14C of the ROM (read-only memory) of computer program, dump at vehicle to CPU.
ECU 14 receives the output signal through In-vehicle networking 11 from the sensor that is arranged at each one of vehicle.In sensor; Be useful on the vehicle speed sensor 11A that detects the speed of a motor vehicle, be used to detect the depression amount of gas pedal accelerator open degree sensor 11B, be used to detect the depression amount of detent braking sensor 11C, be used to detect the open angle of air throttle engine load sensor 11E, be used to detect the crankshaft angle sensor 11F of crank shaft angle etc., this crank shaft angle becomes the basis of the timing of various controls.
Service shop 16 provides the agency of the services of vehicle, and it has diagnostic system (HDS) 16A, and this HDS16A reads into the record data in the driving of preserving among the ECU in the vehicle outside the car and diagnoses.In service shop 16; With common fault diagnosis likewise; Via data link connector (Data Link Connector; Be called " DLC " below) the flat end device of HDS 16A is connected to the ECU 14 that sends the vehicle of accepting the fuel efficiency Diagnosis Service here, and the data of preserving among the nonvolatile memory 14D are read.The flat end device of HDS 16A is to be the flat portable terminal device of diagnostic system exploitation specially, and it is connected and the data of reading and saving in ECU with the ECU of vehicle through DLC.The flat end device of HDS 16A is through combining to be connected to the communication network in service shop 16 with docking station (docking station); And be connected to and become one with HDS and constitute on the PC 16B in service shop of diagnostic device, thereby will offer PC 16B from the data that ECU 14 reads.
The flat end device of HDS 16A becomes the xml file with the data-switching that reads.PC 16B utilizes read routine that the data that receive from HDS 16A are carried out editing and processing, and on the display device 16D of LCD monitor, CRT etc., shows, perhaps prints output to printer 16E.
Moreover; About PC 16B; Can use the computer of notebook type and constitute the diagnostic device of pocket; And; Also PC 16B can be set dependently; And flat end device, personal computer function and monitor function (display device) are constituted one-piece type, thereby become the plate diagnostic device that has monitor function.
Moreover HDS 16A can carry out common fault diagnosis functions and fuel efficiency diagnostic function of the present invention by the same hardware of dual-purpose.
Data when the data of the relevant fuel efficiency that is stored in the nonvolatile memory 140 of ECU 14 and reads through the flat end device of HDS 16A comprise resume data and the nearest driving end cycle in nearest five driving cycles (D/C).Five data items examples of driving the resume data in cycle have been shown in the table 1.When driving end cycle, in the resume data, append the storage data in nearest driving cycle, and the data (data before 5 times) in deletion ordering driving cycle the earliest, thereby preserve past five data of driving the cycle that comprise latest data.
In addition, example whenever nearest data of preserving when driving end cycle has been shown in the table 2.The driving cycle as the object of in nonvolatile memory, preserving is to travel more than 200 meters after the speed of a motor vehicle reaches more than the 8km/h, and begins to continue the driving cycle of the lasting rotation of engine more than 3 minutes from engine start.This is because from estimating the angle of fuel efficiency, the driving cycle of not satisfying these conditions can't obtain sufficient data, is not suitable for the evaluation object as driver behavior.Therefore; In travel speed and operating range at least one Fang Wei reach under the situation of predetermined value, or when continuing after engine start that the schedule time, engine did not rotate; For this driving cycle, the driving data recording that electronic-controlled installation of the present invention is forbidden being put down in writing in the table 1,2 is in said nonvolatile memory.Thus, only selection and the relevant driving data of evaluation, successively 5 times data storage in nonvolatile memory.
[table 1]
| Project | Unit | Explanation |
| The throttle scoring | Divide | Each drives the scoring of the throttle operation in cycle |
| The braking scoring | Divide | Each drives the scoring of the brake operating in cycle |
| The idling scoring | Divide | Each drives the scoring of the idling in cycle |
| The D/C comprehensive grading | Divide | Each drives the comprehensive grading of three operations in cycle |
| Average velocity (1D/C) | km/h | Each drives the average velocity of the vehicle in cycle |
| Running time (D/C) | Second | Each drives the running time of the vehicle in cycle |
| Throttle message | HEX | Drive the advice message of the throttle operation in cycle to each |
| Braking message | HEX | Drive the advice message of the brake operating in cycle to each |
| Idling message | HEX | Drive the advice message of the idling in cycle to each |
| The idling Fuel Consumption | cc | Each drives the Fuel Consumption of the idling in cycle |
| Dead time | Second | Do not comprise the idling stand-by time |
| The idling stand-by time | Second | The idling stand-by time |
| Fuel Consumption (city) | cc | Fuel Consumption when travelling below the 72km/h |
| Fuel Consumption (expressway) | cc | Fuel Consumption when travelling more than the 72km/h |
| Operating range (city) | m | The operating range that travels below the 72km/h |
| Operating range (expressway) | m | The operating range that travels more than the 72km/h |
[table 2]

Below, the content of each data of record describes in the his-and- hers watches 1,2.
Fig. 2 is the block diagram that is equipped in the vehicle and carries out driving accordingly with user's driver behavior the control device 40 of data generation.Control device 40 is made up of the electronic-controlled installation (ECU) 14 with reference to Fig. 1 explanation.
Whether driving state detecting portion 41 detects has carried out the throttle operation of vehicle and whether has carried out the vehicle braked operation.Be equipped with various sensors 65 in the vehicle.The example of sensor is shown in Figure 1.Driving state detecting portion 41 detects driver behavior according to the output of sensor 65.
Driving state detecting portion 41 has been carried out throttle operation as detecting, and then judges and the corresponding vehicle driving state of this throttle operation according to the aperture of engine speed and air throttle.Engine speed can be calculated according to the crankshaft angle sensor 11F that is arranged in the vehicle.Air throttle is arranged in the intake channel that leads to engine of vehicle, can detect its aperture through engine load sensor 11E.
Driving state detecting portion 41 as detect and carried out brake operating then utilizes the speed of a motor vehicle and negative acceleration pair to judge with the corresponding vehicle driving state of this brake operating.The speed of a motor vehicle and acceleration can detect through the vehicle speed sensor 11A that is arranged in the vehicle.Also acceleration transducer can be set, detect the acceleration of vehicle through this acceleration transducer.
The throttle score data
An example of the mapping graph among the ROM 14C that is stored in control device 40 in advance has been shown among Fig. 3 (a).The transverse axis of this mapping graph is represented engine speed (rpm), and the longitudinal axis is represented throttle opening (degree).The line 111 represented driving conditions that use heavy line to represent are for realizing being known as " clean specific fuel consumption " BSFC (Brake specific Fuel Consumption; Brake Specific Fuel Consumption; Unit is [g/kWh]) predetermined optimum value, the driving condition of the value promptly set as the best fuel efficiency, this line 111 is predetermined by the rotating speed and the throttle opening of engine according to the characteristic of the engine of vehicle.For example, when engine speed is 3000rpm, shown in the point of label 112, if the expression throttle opening is about 40 degree then can realizes best clean fuel consumption.
In Fig. 3, be lower than the regional not shown of about 800rpm for engine speed, this is the zone that engine is in the idling driving condition, the back describes the control when being in the idling driving condition.
In Fig. 3, when rotating speed was identical, the high more then fuel efficiency of throttle opening was low more.Therefore, in this example, set by kilter, not kilter and good and good between three fuel efficiency states constituting of state, thereby drive regional three zones that on y direction, are divided into.Specifically, be divided near following zone, zone, this zone line 111 of BSFC and should above zone, zone, these zones are divided by line 113 and 115.Line is the first area below 113, and the zone of line 113 to line 115 is a second area, and line is the 3rd zone more than 115.The first area is set as the good zone of fuel efficiency, and the 3rd zone is set as the not good zone of fuel efficiency, does not arrive not good zone between second area is set as wherein.
The 3rd zone is equivalent to bring the anxious throttle operation that quickens or carries out the driving zone of the too high throttle operation of the speed of a motor vehicle.Second area is equivalent to bring the driving zone of the throttle operation of steady acceleration, the zone of such throttle operation of travelling that is equivalent to cruise, first area.
On the other hand, Fig. 3 (b) shows throttle zone Ar, and the position of the X direction of throttle zone Ar is shown with respect to reference position R.The state of the throttle operation that nonshaded area domain representation fuel efficiency is good, shadow region are represented the state of the throttle operation that fuel efficiency is not good.
In Fig. 3 (b); R is to the scope of the primary importance PA1 first area corresponding to the mapping graph of Fig. 3 (a) from the reference position; Scope from primary importance PA1 to second place PA2 is corresponding to second area, from the scope of second place PA2 to the three position PA3 corresponding to the 3rd zone.Scope from reference position to the first to the 3rd position PA1 to PA3 is represented with LA1, LA2 and LA3 respectively.Therefore; When rotational speed N E is 2000rpm; Throttle opening is dispensed in the scope from position R to position PA1 from zero scope to TH1; The scope of throttle opening from TH1 to TH2 is dispensed in the scope from position PA1 to position PA2, and the scope of throttle opening from TH2 to TH3 is dispensed in the scope from position PA2 to position PA3.
In this example, mark is represented with integer.Therefore, when radix point being arranged, round through for example rounding up with the corresponding mark of the length of bar post 39.
Like this, in throttle operation, according to preset time at interval, calculate the mark of throttle operation being estimated from the angle of fuel efficiency through throttle scoring portion 43.This mark is called " throttle mark (throttle scoring) ".In the driving cycle of vehicle, be stored among the RAM 14B by preset time interval calculation of throttle mark successively and with it, this throttle mark is used to calculate comprehensive mark and throttle mark mean value.
The braking scoring
Next, the braking scoring portion 44 among Fig. 2 is described.Braking scoring portion 44 is according to corresponding to the throttle brake operating and detected driving condition is estimated this brake operating from the angle of fuel efficiency, thereby calculates the scoring (mark) to this brake operating.
With reference to Fig. 5, an example of the mapping graph in the storer that is stored in control device 40 in advance has been shown in (a).The transverse axis of this mapping graph is represented the speed of a motor vehicle (km/h), and the longitudinal axis is represented acceleration (m/sec
2), owing to be to slow down, therefore have negative value.The value of the acceleration the when line of representing with heavy line 131 is the anxious brake operating that is illustrated in when travelling usually that (in this example, the speed of a motor vehicle is about 15km/h when above) be scheduled to, this is predetermined through emulation etc.In this example, be set to-6m m/sec
2, but this is an example, is not limited to this value.
In Fig. 5, when the speed of a motor vehicle was identical, the absolute value of acceleration more greatly then fuel efficiency was low more.Therefore, in the present embodiment, with the situation of throttle operation likewise, set by kilter, not kilter and good and good between three fuel efficiency states constituting of state, thereby drive regional three zones that on y direction, are divided into.Specifically, the zone that the efficient that acts as a fuel is not good, the 3rd zone that comprises line 13 1 is set online below 133, and the 3rd zone is equivalent to bring the driving zone of the anxious brake operating that slows down.In addition, the zone that the efficient that acts as a fuel is good, first area are set online more than 135, and this is equivalent to carry out intensity is to have enough spacings just can make the driving zone of the brake operating that vehicle stops.The efficiency ratio that acts as a fuel is more well and not to not good zone, second area be set online 133 and line 135 between.First area and second area also are configured to be such driving zone: if carry out brake operating in these zones, then can avoid more reliably skidding on low μ road (road surface that coefficient of static friction μ is low).Like this, first area and second area are not carry out anxious driving zone of slowing down, and can think safe driving zone.Be used to divide the line 133 in first to the 3rd zone and 135 definite in advance through emulation etc.
With reference to having preestablished three zones and be stored in the mapping graph in the storer, braking scoring portion 44 is according to corresponding to brake operating and the detected speed of a motor vehicle (VP) and detected acceleration (DR) are confirmed the length of aforesaid post 39.
If detected speed V P is 70km/h.The line 137 of the speed of a motor vehicle of expression 70km/h is shown along y direction.If with the corresponding acceleration of intersection point D3 of line 137 and line 131 is DR3, the corresponding acceleration of establishing with line 137 and line 133 of intersection point D2 is DR2, and the corresponding acceleration of establishing with line 137 and line 135 of intersection point D1 is DR1.
Among Fig. 5 (b) brake area has been shown, has represented the position of the X direction of brake area with respect to reference position R.The state of the brake operating that nonshaded area domain representation fuel efficiency is good, shadow region are represented the state of the brake operating that fuel efficiency is not good.At the corresponding set positions primary importance PB1 of Fig. 5 end DR1 (a) and the first area.At the corresponding set positions second place PB2 of Fig. 5 end DR2 (a) and second area, be the 3rd position PB3 with the set positions of the left end of shadow region.Represent from reference position to the first to the distance of the 3rd position PB1~PB3 with LB1, LB2 and LB3 respectively.
For example; When detected speed V P is 70km/h; Acceleration is dispensed on the scope from position R to position PB1 from zero scope to DR1; The scope of acceleration from DR1 to DR2 is dispensed on the scope from position PB1 to position PB2, and the scope of acceleration from DR2 to DR3 is dispensed on the scope from position PB2 to position PB3.
Which zone that 44 pairs of driving conditions of being represented by detected speed V P and detected acceleration DR of braking scoring portion are present in mapping graph is judged.If be present in the first area, then passing ratio calculate LB1 * | DR|/| DR1| calculates the length of bar post 39.At this, || the expression absolute value.In addition; If acceleration DR is present in second area; Then through LB1+ (LB2-LB1) * (| DR|-|DR1|)/(| DR2|-|DR1|) calculate the length of bar post 39; If acceleration DR is present in the 3rd zone, then through LB2+ (LB3-LB2) * (| DR|-|DR2|)/(| DR3|-|DR2|) calculate the length of bar post 39.
Braking scoring portion 44 obtains the scoring (mark) to this brake operating also according to the length of the bar post 39 of being calculated with reference to the mapping Figure 141 among Fig. 6.This mapping graph is stored among the ROM 14C of control device 40 in advance.In this example, the desirable scope of mark is zero to 100 minutes, and zero was the position of LB3 corresponding to the length apart from reference position R corresponding to reference position R in 100 minutes.In the example of Fig. 6, with the corresponding mark of the length of bar post 39 be 70 minutes.As shown in Figure 6, carry out the good brake operating of fuel efficiency more, can obtain high mark more.
In this example, mark is represented with integer.Therefore, when radix point being arranged, round through for example rounding up with the corresponding mark of the length of bar post 39.
Like this, in brake operating, calculate the mark of brake operating being estimated from the angle of fuel efficiency through braking scoring portion 44.This mark is called " braking mark (braking scoring) ".In the driving cycle of vehicle, be stored among the RAM 14B by preset time interval calculating braking mark successively and with it, this braking mark is used to calculate comprehensive mark and braking mark mean value.
The idling scoring
Return Fig. 2, the idling driving condition of 41 pairs of vehicles of driving state detecting portion detects.In a driving cycle, when the idling driving had just begun, idling was driven 45 pairs of idling marks of scoring portion and is set initial value.In addition; When detecting the idling driving, idling is driven scoring portion 45 starting timers (not shown) at every turn, and this timer is used for the elapsed time that this idling of instrumentation is driven; After idling is driven beginning through the schedule time after, from the idling mark, deduct the mark of predetermined value at interval by preset time.
At this, the separating method that subtracts of idling mark is described with reference to Fig. 7 (A).Begin the driving cycle at moment t0, and the beginning idling is driven.The idling mark is set initial value (being 100 minutes in the present embodiment).Drive from idling that the moment t1 through the schedule time (for example 1 minute) begins to drive the moment t2 that finishes to idling after the beginning, make the idling mark predetermined value of successively decreasing at interval by preset time.At this, preferably the schedule time set for temporarily stop with vehicle or required idling is driven during waiting signal lamp etc. duration corresponding, this can set according to emulation or empirical value etc.Like this, for having that vehicle temporarily stops or the idling of common duration during waiting signal lamp etc. is driven, can the idling mark not subtracted branch.The idling of the duration that the schedule time is above is driven and for example can be thought the parking etc. because of what, so the value of the duration longer then idling mark of idling driving reduces more.
Idling fractional value during moment t2 that idling drive to finish for example is stored in the storer of control device 40 and is able to keep.When idling is driven once more when the moment, t3 began; At the moment t4 that has begun to pass through the above-mentioned schedule time from this; Read the idling fractional value that remains in the storer (promptly; The idling fractional value of moment t2); By this idling mark of preset time chien shih predetermined value of successively decreasing, drive the moment t5 that finishes up to idling.Like this, in a driving cycle, the duration that the idling mark is driven according to idling reduces.
Like this, when carrying out idling, calculate the idling mark of this idling operation being estimated from the angle of fuel efficiency through idling operation scoring portion 45 at every turn.In the steering vehicle process (in the driving cycle), at interval calculate the idling mark successively and it is stored among the RAM 14B by preset time, this idling mark is used to calculate comprehensive mark and idling mark mean value.
The calculating of average mark
Return Fig. 2, the throttle mark that accumulative total portion 47 calculates above-mentioned that kind by preset time at interval, braking mark and idling mark add up.In this example, begin to add up to engine start to each the driving cycle that stops (that is, catching fire to flame-out) from point from vehicle.
Average mark calculating part 48 will be through accumulative total portion 47 accumulative total above-mentioned three marks mark aggregate-value separately respectively divided by elapsed time of respective operations, thereby calculate three marks mean value separately successively.Meanwhile, likewise to these three marks with add up, and divided by the elapsed time, thereby calculate comprehensive mark successively.The mean value of three indivedual marks of calculating successively along with the process of time in this wise and comprehensive mark are stored among the RAM 14B.When driving end cycle along with stopping working, the mean value and the comprehensive mark that are stored in three indivedual marks among the RAM 14B are saved among the nonvolatile memory 14D as the throttle mark of representing this driving cycle, braking mark, idling mark and comprehensive mark.
At this, with reference to Fig. 8, at moment t0, along with point catches fire and the driving cycle begins.Beginning idling driving simultaneously beginning with the cycle of driving.The idling mark is set initial value (for example 100 minutes).As illustrated with reference to Fig. 7 (A), through after the schedule time, the idling mark successively decreased along with the process of time after idling was driven and begun.At moment t1, idling is driven and is finished, and the speed of a motor vehicle rises when stepping on the throttle pedal.Carry out throttle operation during, if the throttle mark is calculated on above-mentioned such ground on schedule at interval.At moment t2, throttle operation finishes, and begins to step on brake pedal.Carry out brake operating during, calculate at interval the braking mark on schedule.At moment t3, brake operating finishes, and the speed of a motor vehicle is zero, and vehicle stops, and idling is driven and begun once more.After the process schedule time, the idling mark begins to successively decrease from fractional value last time.At moment t4, begin throttle operation once more.
At the t0 zero hour in the cycle of driving, aggregate-value is zero.Till from moment t0 to the moment t11 that drives end cycle, calculate throttle mark, braking mark and idling mark constantly, when calculating these marks, this mark is added aggregate-value last time at every turn, thereby calculate this aggregate-value at each.About the aggregate-value among the figure, utilize this accumulative total of graphical representation to handle, at moment t0~t1, the idling mark is added up, S1 representes through area.At moment t1~t2, the throttle mark is added up, S2 representes through area.The cumulative point of t2 is S1+S2 constantly.At moment t2~t3, the braking mark is added up, S3 representes through area.The cumulative point of t3 is S1+S2+S3 constantly.
When adding up to handle, through divided by the elapsed time of the moment t0 that begins from the driving cycle till the current time, thereby calculate comprehensive mark at every turn.For example, the comprehensive mark of t2 (T2-T0) is calculated through (S1+S2) constantly.
Comprehensive mark when driving end cycle about one is through calculating the duration Tdc of the comprehensive mark of accumulative total in this driving cycle divided by the cycle of driving.In the example of Fig. 8, calculate through (S1+S2+.....+S11)/TDc.Comprehensive fraction representation when driving end cycle average fuel efficient state that should the driving cycle.Comprehensive mark when driving end cycle is stored among the nonvolatile memory 14D of control device 40.
Average mark calculating part 48 is calculated average mark according to the timing identical with the calculating of comprehensive mark respectively to three indivedual marks.That is, calculate aggregate-value, and make this aggregate-value calculate mean value divided by the throttle operation time about the throttle mark.For example, under the situation of carrying out the driving as Fig. 8, the mean value of the throttle mark of t5 is calculated through (S2+S5) ((T2-T1)+(T5-T4)) constantly.Also carry out same calculating for brake operating and idling driving, thereby calculate average braking mark and average idling mark respectively.About average idling mark; Both can comprise with reference to the illustrated schedule time of Fig. 7 and (for example having calculated; In the example of Fig. 8; The average idling mark of t1 is calculated through S1/T1 constantly); Also can (for example calculate with the mode that does not comprise this schedule time; In the example of Fig. 8, the average idling mark of t1 is calculated through S1 (the t1-schedule time) constantly).These indivedual average marks also are stored among the RAM 14B with comprehensive mark in the lump.
The calculating of average mark also can be according to the long time interval (interval), and for example carry out on the backstage of the computing that is used for engine control at 1 minute interval.This is in order to alleviate the load of ECU.
Comprehensive mark calculation process
Fig. 9 is flow process one example through the comprehensive mark computation process of control part 40 execution.By preset time at interval (for example 100 milliseconds) implement the process till the accumulative total (S12).
In step S1,, then carry out this process if ignition switch is opened.In step S2, the arbitrary state that is in throttle operation, brake operating or the idling driving is detected.
When detecting throttle operation, select the mapping graph (S3) among Fig. 3, according to detected engine speed NE and detected throttle opening TH, confirm the length (S4) of bar post with reference to this mapping graph.Next, obtain throttle mark (S5) with reference to the mapping graph among Fig. 6.
In step S2, when detecting brake operating, select the mapping graph (S6) among Fig. 5, according to detected speed V P and detected acceleration DR, confirm the length (S7) of bar post with reference to this mapping graph.Next, obtain braking mark (S8) with reference to the mapping graph among Fig. 6.
In step S2,, judge then whether drive beginning from this idling has passed through the schedule time (S9) if detected the idling driving.If do not pass through the schedule time, the idling fractional value when then former state keeps idling driving condition end last time in step S10.If passed through the schedule time, then in step S11 to idling mark (deducting) predetermined value of successively decreasing.Idling mark when beginning for the driving cycle is set initial value.
In step S12, this throttle mark of calculating, braking mark or idling mark are added aggregate-value last time, thereby calculate this aggregate-value.In step S13, with this this aggregate-value divided by the elapsed time that begins from the driving cycle, thereby calculate comprehensive mark.
Like this, drive the cycle during in, calculate comprehensive mark at interval and show by preset time.The average mark of calculating at last in the cycle of driving is stored among the RAM 14B as comprehensive mark, figure out lifelong mark according to this total score.
The time interval of calculation of throttle mark etc. can be identical with the time interval of calculating comprehensive mark, also can make the latter longer than the former, and for example, the former is 100 milliseconds, and the latter also can be 5 minutes.
The calculating of mark throughout one's life
Average fuel efficient state in the comprehensive fraction representation driving cycle.Mark is the aggregate-value of the comprehensive mark in a plurality of driving cycles throughout one's life, the driver behavior technical merit that its expression is relevant with fuel efficiency.
When each end was respectively driven the cycle, the lifelong fractional computation portion 49 among Fig. 2 was converted into comprehensive mark scaled value with reference to the mapping graph among Fig. 7 (B) with this comprehensive mark of driving the cycle.This mapping graph is stored among the ROM 14C of control device 40 in advance.Because the driver behavior that comprehensive fraction representation more than 50 minutes is relevant with fuel efficiency is good, thus this comprehensive mark be scaled have on the occasion of comprehensive mark scaled value.Because the comprehensive fraction representation driver behavior relevant with fuel efficiency that is lower than 50 fens is not really well, therefore this comprehensive mark is scaled the comprehensive mark scaled value with negative value.
In this example, this mapping graph diminishes near near near the pairing comprehensive mark scaled value comprehensive mark zero, 50 minutes and 100 minutes.Through like this, comprehensive mark can be converted into the comprehensive mark scaled value of the driver behavior technical merit that reflection is relevant with fuel efficiency more accurately.Also can make the linear variation of comprehensive mark scaled value with respect to the variation of comprehensive mark.
In this example, the absolute value of the maximal value of comprehensive mark scaled value (be in this example+5) is identical with the absolute value of minimum value (being-5 in this example), but also the two can be set for different sizes.For example, the absolute value that can make minimum value is than peaked absolute value big (for example ,-10 and+5), thereby the branch amplitude that subtracts that makes lifelong mark is bigger and become strict evaluation score than bonus point amplitude.
In this example, comprehensive mark scaled value is represented with integer.Therefore, when the comprehensive mark scaled value of obtaining with radix point corresponding to comprehensive mark, can round through for example rounding up.When comprehensive mark is divided into unit with 10, in table regulation corresponding to 0,10,20 ... The comprehensive mark scaled value of the round values of 100 fens comprehensive marks gets final product.
Corrected value is calculated through operating range that the comprehensive mark scaled value that above-mentioned that kind is obtained multiply by this driving cycle by fractional computation portion 49 throughout one's life.The experience amount that the longer just expression of operating range is driven is many more.Through multiply by operating range, can make corrected value become the value of reflection experience.Multiply by the comprehensive mark scaled value that the mapping graph that utilizes among Fig. 7 (B) obtains through operating range (km) of this being driven the cycle and calculate the corrected value of driving the comprehensive mark scaled value in cycle based on this.
Preferably the corrected value based on the comprehensive mark scaled value of calculating in the cycle of driving each time is provided with higher limit.In this example, according to operating range with the higher limit that was set at based on the corrected value of comprehensive mark scaled value in 200 minutes.
This sub-value of lifelong mark is calculated through the previous value that the above-mentioned corrected value of calculating in the driving cycle with this adds lifelong mark by fractional computation portion 49 throughout one's life.Throughout one's life the initial value of mark is zero, lifelong mark is upgraded according to each driving cycle.Along with the driver behavior technical merit relevant with fuel efficiency improves, the value of mark increases throughout one's life.The lifelong mark of being calculated is saved among the nonvolatile memory 14D.
Advice message
Return Fig. 2, describe generating advice message through the 3rd display control unit 53.In this example, control device 40 calculates fuel efficiency (being referred to as " moment fuel efficiency ") according to the timing identical with the calculating of comprehensive mark.Because comprehensive mark is calculated by preset time at interval, thus moment fuel efficiency represent the fuel efficiency that each should the time interval.On the other hand, control device 40 through this is driven the cycle from begin to current time moment fuel efficiency aggregate-value calculate the average fuel efficient in this driving cycle divided by beginning to the duration of current time from this.Average fuel efficient and average mark store among the RAM 14B of control device 40 in couples.
In addition, control device 40 is 5 minutes to be the mean value that above-mentioned four marks and fuel efficiency are calculated by unit.Specifically, with 5 minutes the time interval, as illustrated with reference to Fig. 9, throttle mark, braking mark or idling mark being added up, with the duration of this aggregate-value divided by 5 minutes, is the mark mean value of unit thereby calculate with 5 minutes.Likewise, with 5 minutes the time interval, to moment fuel efficiency add up, the duration of this aggregate-value, be the fuel efficiency mean value of unit thereby calculate with 5 minutes divided by 5 minutes.At this, " 5 minutes " are examples, also can be other the time intervals.These are 5 minutes being that the mean value of unit for example is stored among the RAM14B.
For the also angle from the speed of a motor vehicle is advised to the driver,, the state of the speed of a motor vehicle is judged so that improve fuel efficiency.In this example, driving state detecting portion 41 in each driving cycle by preset time at interval (can be identical) with the timing of aforesaid calculation of throttle mark etc. the speed of a motor vehicle is detected.As various sensors 65 (Fig. 2), can use vehicle speed sensor 11A to detect the speed of a motor vehicle.Speed of a motor vehicle condition judgement portion 54 comes the state of the speed of a motor vehicle is judged according to the running time ratio that the speed of a motor vehicle is in the preset range.
At this,, wherein show the fuel efficiency that obtains through emulation or experiment corresponding to the speed of a motor vehicle with reference to Figure 10 (a).The too high speed of a motor vehicle might make fuel efficiency reduce, and the low excessively speed of a motor vehicle is compared with the speed of a motor vehicle of moderate degree and also can be made the fuel efficiency reduction.It is long more that the running time of such excessively high speed is perhaps crossed the running time that hangs down the speed of a motor vehicle, and then the fuel efficiency state is got over deterioration, makes average throttle mark variation.
Even the depression amount of gas pedal is fixed, if the speed of a motor vehicle is too high, also can reduce with the corresponding fuel efficiency of throttle operation, under the rapid situation that increases and carry out suddenly quickening of the depression amount of gas pedal, also can reduce with the corresponding fuel efficiency of throttle operation.Carrying out preferably this situation being informed the driver under the situation that excessively high speed travels.In addition, shown in Figure 10 (a),,, also preferably arouse driver's attention for such travelling therefore in order to improve fuel efficiency more owing to cross the trend that travelling of the low speed of a motor vehicle reduced fuel efficiency.
At this, in this example, the situation long to the running time under the running time under the speed of a motor vehicle below the low threshold value and the speed of a motor vehicle more than the high threshold detects, and avoids such travelling according to this detection suggestion driver.Thus, the driver can recognize and might reduce because of the speed of a motor vehicle makes fuel efficiency.
For carrying out the suggestion of above-mentioned that kind, at first, speed of a motor vehicle condition judgement portion 54 each be to judge below the low threshold value or more than the high threshold when detecting the speed of a motor vehicle to the detected speed of a motor vehicle.For running time and the running time under the excessively high speed crossed under the low speed of a motor vehicle were checked from the ratio (ratio) in the elapsed time of the zero hour with respect to a driving cycle, 54 pairs in speed of a motor vehicle condition judgement portion detects the frequency of the speed of a motor vehicle that is lower than threshold value and detects the speed of a motor vehicle that is higher than high threshold in this driving cycle frequency is counted respectively.And; With respect to from this driving cycle begin play the frequency that the speed of a motor vehicle of current time detects, calculate shared ratio (recently representing) of the frequency that detects the speed of a motor vehicle that is lower than threshold value and the shared ratio (recently representing) of frequency that detects the speed of a motor vehicle that is higher than high threshold with percentage with percentage.This calculating can be according to carrying out with the same timing of aforesaid comprehensive fractional computation.At this, the former is called " low speed of a motor vehicle ratio ", the latter is called " high speed of a motor vehicle ratio ".
The value of these ratios associated with comprehensive mark store among the RAM 14B, when driving end cycle, it is saved among the nonvolatile memory 14D.
Speed of a motor vehicle condition judgement portion 54, is judged speed of a motor vehicle state with reference to mapping graph such among Figure 10 (b) according to the low speed of a motor vehicle ratio and the high speed of a motor vehicle ratio of calculating.This mapping graph is stored among the ROM 14C of control device 40.One drive the cycle from beginning under 7 situation of running at high speed that become more than the high threshold, to judge that speed of a motor vehicle state is a " high " state to the elapsed time of current time.
Drive becoming under the situation of the low speed driving below the low threshold value of cycle at one, judge that speed of a motor vehicle state is a " low " state from beginning to the elapsed time of current time 7.
The structure of the message table 55 among the ROM 14C that is stored in control device 40 has been shown among Figure 11.Message table 55 is to each a driver behavior storage and a corresponding advice message of other driver behavior fractional value.Advice message is to be used to inform that the driver is from the angle of the fuel efficiency message to the suggestion of driver behavior.
About throttle operation,, correspondingly storing advice message with the state and the average throttle fractional value of the speed of a motor vehicle if (a).In this embodiment, the value of average throttle mark has been set three scopes, set low mark scope, assigned to 69 minutes mid-score scope and from the 70 balloon score scopes of assigning to 100 fens from 30 from zero to 29 minute.About each scope, there are three kinds of speed of a motor vehicle states of aforesaid " very ", " low " and " high " state.Therefore, the advice message as storing in advance has 9 kinds of message representing with MA1~MA9 at least.
About brake operating, shown in Figure 11 (b), correspondingly store advice message with average braking fractional value, be set with low mark scope, mid-score scope and balloon score scope about the value of average braking mark.Therefore, the advice message as storing in advance has 3 kinds of message representing with MB1~MB3 at least.
Drive about idling, shown in Figure 11 (c), correspondingly storing advice message, in this example, set two scopes: from the low mark scope of zero to 49 minute, from the 50 balloon score scopes of assigning to 100 fens with average idling fractional value.Therefore, as the advice message of storing in advance, that kind has 2 kinds of message shown in MI1 and MI2 at least.
In addition, for the vehicle with guider, the 3rd display control unit 53 is shown on the display device 17 of guider with the information of above-mentioned mark etc. and to the suggestion of driver behavior.
Other data
Fuel Consumption when 1) travelling and operating range in downtown streets
Be Fuel Consumption (cc) and the operating range (m) when travelling with the speed of a motor vehicle below the 72km/h.When vehicle speed sensor 11A illustrated 72km/h, ECU 14 calculated fuel injection amount according to the total of the time that makes thrower (fuel injection device) action.Simultaneously, calculate the total of the distance of travelling with the speed of a motor vehicle below the 72km/h.The value of calculating is successively stored among the RAM 14B, and the value will drive end cycle the time is stored among the nonvolatile memory 14D.
Fuel Consumption when 2) travel in the expressway and operating range
Be Fuel Consumption (cc) and the operating range (m) when travelling with the speed of a motor vehicle that surpasses 72km/h.Through with 1) Fuel Consumption and the same computing of calculating of operating range calculate.The value of calculating is successively stored among the RAM14B, and the value will drive end cycle the time is stored among the nonvolatile memory 14D.Moreover 72km/h runs at high speed and middle low speed driving and preset threshold for ease of difference.
3) economic (ECON) switch
Preserve the usage frequency of an ECON switch 15A who drives the cycle among the nonvolatile memory 14D and press the time that the economic model of ECON switch is travelled; When driving end cycle, cover and upgrade; This ECON switch 15A is arranged at driver's seat, and this switch is used to select economic driving model.Therefore, only up-to-date data are provided to diagnostic device.
Under economic driving model, the idling stand-by time prolongs, and can carry out Energy Saving Control to air-conditioning equipment, and suppresses the output and the rotation of engine, thereby with the preferential mode of fuel efficiency vehicle is controlled.
4) the lifelong mark of vehicle
Above-mentioned lifelong mark is stored among the nonvolatile memory 14D.
5) the economic grade of vehicle
With the histogram of lifelong mark economic grade as vehicle.
Below, be back to Fig. 1, the situation of using above-mentioned such driving data of preserving to diagnose is described.When the diagnosis object vehicle is sent to service shop 16; The attendant takes vehicle nearby with flat end device; Data link connector (DLC) is connected with the ECU 14 of vehicle; Thereby the data that will be stored among the nonvolatile memory 14D are read in the storer of flat end device, and data are offered the PC 16B that is connected.For the data that user's driver behavior evaluation is read in are the data in aforesaid table 1 and the table 2.
HDS also has the function to the diagnosing malfunction of vehicle, and when vehicle condition was bad, HDS also read in the required data of diagnosis vehicle condition, thereby carries out common fault diagnosis.
The PC that the PC 16B in service shop 16 also can constitute via internet and user communicates, thereby can utilize user's PC that the evaluation result of driver behavior is read.
Such computer program is installed among the PC 16B: the data edition of relevant driver behavior is become to be used for to show, and with this data presentation in display device 16D such as LCD, or output to printer 16E.Figure 12 and Figure 13 show through chart one example on the screen this edit routine editor, that be shown in display device 16D.
In this example, show in throttle message id, braking message id and idling message id by ECU output, the message of n (integers of the n≤5) message id that occurrence frequency is the highest in the individual driving cycle.When occurrence frequency is identical, " message of difference " preferentially is shown by the order of throttle, idling, braking.About message, such message has been shown in the example of Figure 11 " becomes the state that idling stops that being easy to through opening ECON ".
Message through hanging down mark in this wise preferentially illustrates, and the suggestion to unfavorable driver behavior can be shown thus, thereby the driver is realized bad driving habits and improvement to some extent.
But; In the present embodiment; Not the message that for example shows low mark once; But at first preferentially show the message that occurrence frequency is high; Under the identical situation of occurrence frequency; The preferential operating position that shows that influence is big shows the message of low mark when the same operation position, avoid the good driver of driver behavior is shown the suggestion that " finding fault " is such thereby set for.
In subregion 247, as economy class, lifelong mark is divided into three ranks by score, and the rank of saving relevant driving technology progress degree with fuel consumption is shown with the figure of blade.Utilizing pie chart to show with subregion 247 adjacent subregions 248 can be through pressing the degree that economic model that ECON switch 15A switches is used.
Figure 13 utilizes concrete numerical value that the chart of the particular content of the data among Figure 12 is shown.Can be through selecting to show the mapping chart among Figure 16 on user's PC.Subregion 257 usefulness numerical value show the data of the subregion 249 among Figure 12.The numerical value that subregion 259 usefulness are concrete shows the data of the subregion 251 among Figure 12.Subregion 261 is arranged the data of subregion among Figure 12 245 and subregion 253 by each driving cycle, and its mode that compares is at length illustrated it after splitting being easy to.
Figure 12 that illustrates on the picture through diagnosis and the chart of Figure 13; The driver behavior in the driving cycle of past (maximum five times) driving several times that arrangement prompting user oneself is nearest and the demonstration of the relation between the fuel efficiency; Thereby the user can recognize driving habit and the tendency of not recognized through data, and can recognize to realizing that better fuel efficiency answers how do i.
In addition; In the service shop; To the client who comes to diagnose about fuel efficiency; Not only there is non-fault to confirm diagnosis to vehicle; About the driver behavior aspect; The attendant also can come out to be prompted to client with the data ordering of each time driving condition of client, and can propose convictive suggestion to client and improve and instruct for the driving habit of driver behavior and tendency.
In addition; Since the evaluation of driver behavior as data presentation or print; When accepting diagnosis several times; Therefore can both recognize the progress of driver behavior each time as data recording, can produce a kind of like this motivation: the driver behavior that will realize high fuel efficiency with the sensation of recreation is as target.
As stated, specific embodiment of the present invention is illustrated, but the invention is not restricted to these embodiments.
Claims (according to the modification of the 19th of treaty)
1. (revise afterwards) a kind of diagnostic device of driver behavior, wherein,
The diagnostic device of this driver behavior is arranged at outside vehicle, and the diagnostic device of this driver behavior has like lower unit:
Read the unit of the driving data in a plurality of driving cycle from the electronic-controlled installation of vehicle; The electronic-controlled installation of said vehicle had according to each driving cycle of vehicle preserves the nonvolatile memory of said driving data, and said driving data illustrate the fuel efficiency state with user's corresponding this vehicle of driver behavior;
According to the unit of the said driving data creating chart of being read, this chart is according to each said driving cycle, the fuel efficiency state of each driver behavior of user is arranged by the time sequence and shown with the mode that can compare; And
The unit of said chart visually being exported as the comparative result in each said driving cycle.
2. diagnostic device according to claim 1, wherein,
The said driving cycle is when said vehicle point catches fire, to play during the flame-out driving; Said electronic-controlled installation constitutes: at least one Fang Wei reaches under the situation of predetermined value, or when continuing after engine start that the schedule time, engine did not rotate, forbids that driving data recording with this driving cycle is in said nonvolatile memory in travel speed and operating range.
3. diagnostic device according to claim 2, wherein,
Said driving data comprise: for the state of the fuel efficiency of said vehicle; Said electronic-controlled installation influences evaluation score that driver behavior project of fuel efficiency calculates and the advice message that is used for being prompted to relatively with the fuel efficiency state user to each
Said diagnostic device constitutes: from a plurality of said advice message that said electronic-controlled installation is read, select the visually output with the low driver behavior corresponding items advice message of said evaluation score.
4. (revise afterwards) a kind of diagnostic method of driver behavior, wherein,
The diagnostic method of this driver behavior may further comprise the steps:
From electronic-controlled installation the driving data in a plurality of driving cycle are read into outside vehicle; Said electronic-controlled installation had according to each driving cycle of vehicle preserves the nonvolatile memory of said driving data; Said driving data illustrate the fuel efficiency state with corresponding this vehicle of user's driver behavior
According to the said driving data creating chart of being read, this chart is according to each said driving cycle, the fuel efficiency state of each driver behavior of user is arranged by the time sequence and shown with the mode that can compare; And
As the comparative result in each said driving cycle, said chart is visually exported at outside vehicle.
5. diagnostic method according to claim 4, wherein,
The said driving cycle is when said vehicle point catches fire, to play during the flame-out driving; In travel speed and operating range at least one Fang Wei reach under the situation of predetermined value, or when continuing after engine start that the schedule time, engine did not rotate, said electronic-controlled installation forbids that driving data recording with this driving cycle is in said nonvolatile memory.
6. diagnostic method according to claim 5, wherein,
Said driving data comprise: for the state of the fuel efficiency of said vehicle; Said electronic-controlled installation influences evaluation score that driver behavior project of fuel efficiency calculates and the advice message that is used for being prompted to relatively with the fuel efficiency state user to each
Reading into from said electronic-controlled installation a plurality of said advice message of outside vehicle, selecting visually output with the low driver behavior corresponding items advice message of said evaluation score.
Claims (6)
1. the diagnostic device of a driver behavior, wherein,
The diagnostic device of this driver behavior is arranged at outside vehicle, and the diagnostic device of this driver behavior has like lower unit:
Read the unit of the driving data in a plurality of driving cycle from the electronic-controlled installation of vehicle; The electronic-controlled installation of said vehicle has each the driving cycle that is used for according to vehicle and preserves the nonvolatile memory of said driving data, and said driving data illustrate the fuel efficiency state with user's corresponding this vehicle of driver behavior;
According to the unit of the said driving data creating chart of being read, this chart illustrates the fuel efficiency state of each driver behavior of user according to each said driving cycle; And
As the comparative result in each said driving cycle and visually export the unit of said chart.
2. diagnostic device according to claim 1, wherein,
The said driving cycle is when said vehicle point catches fire, to play during the flame-out driving; Said electronic-controlled installation constitutes: at least one Fang Wei reaches under the situation of predetermined value, or when continuing after engine start that the schedule time, engine did not rotate, forbids that driving data recording with this driving cycle is in said nonvolatile memory in travel speed and operating range.
3. diagnostic device according to claim 2, wherein,
Said driving data comprise: for the state of the fuel efficiency of said vehicle; Said electronic-controlled installation influences evaluation score that driver behavior project of fuel efficiency calculates and the advice message that is used for being prompted to relatively with the fuel efficiency state user to each
Said diagnostic device constitutes: from a plurality of said advice message that said electronic-controlled installation is read, select the visually output with the low driver behavior corresponding items advice message of said evaluation score.
4. the diagnostic method of a driver behavior, wherein,
The diagnostic method of this driver behavior may further comprise the steps:
From electronic-controlled installation the driving data in a plurality of driving cycle are read into outside vehicle; Said electronic-controlled installation had according to each driving cycle of vehicle preserves the nonvolatile memory of said driving data; Said driving data illustrate the fuel efficiency state with corresponding this vehicle of user's driver behavior
According to the said driving data creating chart of being read, this chart illustrates the fuel efficiency state of each driver behavior of user according to each said driving cycle,
As the comparative result in each said driving cycle, said chart is visually exported at outside vehicle.
5. diagnostic method according to claim 4, wherein,
The said driving cycle is when said vehicle point catches fire, to play during the flame-out driving; In travel speed and operating range at least one Fang Wei reach under the situation of predetermined value, or when continuing after engine start that the schedule time, engine did not rotate, said electronic-controlled installation forbids that driving data recording with this driving cycle is in said nonvolatile memory.
6. diagnostic method according to claim 5, wherein,
Said driving data comprise: for the state of the fuel efficiency of said vehicle; Said electronic-controlled installation influences evaluation score that driver behavior project of fuel efficiency calculates and the advice message that is used for being prompted to relatively with the fuel efficiency state user to each
Reading into from said electronic-controlled installation a plurality of said advice message of outside vehicle, selecting visually output with the low driver behavior corresponding items advice message of said evaluation score.
Applications Claiming Priority (3)
| Application Number | Priority Date | Filing Date | Title |
|---|---|---|---|
| JP2009068294A JP5410125B2 (en) | 2009-03-19 | 2009-03-19 | Method and apparatus for diagnosing driving maneuvers |
| JP2009-068294 | 2009-03-19 | ||
| PCT/JP2010/001671 WO2010106760A1 (en) | 2009-03-19 | 2010-03-09 | Method and device for diagnosing driving operation |
Publications (1)
| Publication Number | Publication Date |
|---|---|
| CN102348968A true CN102348968A (en) | 2012-02-08 |
Family
ID=42739428
Family Applications (1)
| Application Number | Title | Priority Date | Filing Date |
|---|---|---|---|
| CN201080011893XA Pending CN102348968A (en) | 2009-03-19 | 2010-03-09 | Method and device for diagnosing driving operation |
Country Status (4)
| Country | Link |
|---|---|
| US (1) | US8660785B2 (en) |
| JP (1) | JP5410125B2 (en) |
| CN (1) | CN102348968A (en) |
| WO (1) | WO2010106760A1 (en) |
Cited By (11)
| Publication number | Priority date | Publication date | Assignee | Title |
|---|---|---|---|---|
| CN102620772A (en) * | 2012-03-31 | 2012-08-01 | 北京经纬恒润科技有限公司 | Monitoring method, device and system for driving action of tester in test car yard |
| CN103661166A (en) * | 2012-09-20 | 2014-03-26 | 通用汽车环球科技运作有限责任公司 | Fail operational power system diagnostics |
| CN103700160A (en) * | 2013-12-31 | 2014-04-02 | 江苏中寰卫星导航通信有限公司 | Motor vehicle onboard terminal based on microsensor and driving behavior judgment method |
| CN105569853A (en) * | 2014-11-05 | 2016-05-11 | 雅马哈发动机株式会社 | Straddle-type vehicle |
| CN107061033A (en) * | 2016-02-10 | 2017-08-18 | 本田技研工业株式会社 | Idle stop device |
| CN107851377A (en) * | 2015-08-06 | 2018-03-27 | 矢崎能源系统公司 | Drive apparatus for evaluating |
| CN110803115A (en) * | 2018-08-06 | 2020-02-18 | 通用汽车环球科技运作有限责任公司 | System and method for enhancing vehicle user experience |
| CN111032462A (en) * | 2017-08-31 | 2020-04-17 | 本田技研工业株式会社 | Vehicle control device |
| CN111497854A (en) * | 2019-01-29 | 2020-08-07 | 长城汽车股份有限公司 | Method and device for evaluating driving condition of driver and machine-readable storage medium |
| CN113815624A (en) * | 2020-06-19 | 2021-12-21 | 比亚迪股份有限公司 | Driving behavior evaluation method, driving behavior evaluation device, vehicle, and storage medium |
| CN114526930A (en) * | 2022-03-09 | 2022-05-24 | 河南职业技术学院 | Intelligent network connection automobile fault detection method and system |
Families Citing this family (18)
| Publication number | Priority date | Publication date | Assignee | Title |
|---|---|---|---|---|
| JP4955625B2 (en) * | 2008-08-01 | 2012-06-20 | 株式会社デンソー | Driving advice providing device, driving diagnosis device |
| US10037711B2 (en) | 2011-02-25 | 2018-07-31 | Vnomics Corp. | System and method for in-vehicle operator training |
| JP5872229B2 (en) * | 2011-09-29 | 2016-03-01 | クラリオン株式会社 | Information terminal |
| JP5536736B2 (en) | 2011-10-24 | 2014-07-02 | 本田技研工業株式会社 | Vehicle diagnostic method and external diagnostic device |
| US20130173136A1 (en) * | 2012-01-04 | 2013-07-04 | Samsung Electronics Co., Ltd. | Apparatus and method for displaying vehicle-driving information in mobile terminal |
| JP5738832B2 (en) * | 2012-12-13 | 2015-06-24 | 富士重工業株式会社 | Vehicle display device |
| JP6073169B2 (en) * | 2013-03-27 | 2017-02-01 | 住友建機株式会社 | Excavator |
| CA2910590C (en) * | 2013-05-03 | 2018-01-02 | Clever Devices | Method and apparatus for providing vehicle component fault scoring |
| US11279357B2 (en) * | 2013-12-25 | 2022-03-22 | Denso Corporation | Vehicle diagnosis system and method |
| KR101551028B1 (en) * | 2013-12-26 | 2015-09-07 | 현대자동차주식회사 | Control system for reducing enery consumption of air conditioner |
| JP6317702B2 (en) * | 2014-05-19 | 2018-04-25 | 株式会社堀場製作所 | Road test equipment |
| US20160140780A1 (en) * | 2014-11-18 | 2016-05-19 | Hyundai Motor Company | System and method of calculating distance to empty of eco-friendly vehicle |
| JP6508565B2 (en) * | 2014-12-26 | 2019-05-08 | スズキ株式会社 | Vehicle display device |
| JP6605381B2 (en) * | 2016-03-30 | 2019-11-13 | 株式会社日立製作所 | Driving diagnosis device, driving diagnosis system, terminal device |
| US10449916B2 (en) * | 2017-06-05 | 2019-10-22 | Paccar Inc. | Method for improving fuel economy by influencing driver behavior |
| JP7344800B2 (en) * | 2017-12-11 | 2023-09-14 | 住友建機株式会社 | Excavators and shovel management systems |
| CN110308715A (en) * | 2019-06-25 | 2019-10-08 | 重庆长安汽车股份有限公司 | Reading data shows that equipment, automatic Pilot critical data read display system and method |
| CN113010118B (en) * | 2021-03-25 | 2022-09-16 | 四川百纳科技有限责任公司 | Method for processing mileage and hour meter data stored in automobile |
Citations (6)
| Publication number | Priority date | Publication date | Assignee | Title |
|---|---|---|---|---|
| JP2000247162A (en) * | 1999-02-26 | 2000-09-12 | Mitsubishi Motors Corp | Operating state evaluating device for vehicle |
| CN1653255A (en) * | 2002-05-10 | 2005-08-10 | 五十铃自动车株式会社 | System and method for evaluating fuel saving operation |
| CN1661349A (en) * | 2004-02-27 | 2005-08-31 | 富士重工业株式会社 | Data recording apparatus and data recording method |
| JP2006344001A (en) * | 2005-06-09 | 2006-12-21 | Omron Corp | Operation management system |
| JP2007023830A (en) * | 2005-07-13 | 2007-02-01 | Hino Motors Ltd | Fuel consumption evaluation device |
| CN101002012A (en) * | 2004-08-18 | 2007-07-18 | 日产柴油机车工业株式会社 | Fuel consumption evaluation system |
Family Cites Families (12)
| Publication number | Priority date | Publication date | Assignee | Title |
|---|---|---|---|---|
| JP3642745B2 (en) * | 2001-06-05 | 2005-04-27 | ミヤマ株式会社 | Vehicle operating state evaluation system |
| JP2003042000A (en) | 2001-07-27 | 2003-02-13 | Hanshin Electric Co Ltd | Fuel economy display device |
| JP2003331380A (en) * | 2002-05-16 | 2003-11-21 | Miyama Kk | Vehicle operation information management evaluation system |
| JP3747015B2 (en) | 2002-07-11 | 2006-02-22 | 本田技研工業株式会社 | Fuel consumption meter for vehicles |
| JP4469297B2 (en) * | 2005-03-01 | 2010-05-26 | 日立オートモティブシステムズ株式会社 | Driving diagnosis method and apparatus |
| JP4779558B2 (en) * | 2005-10-12 | 2011-09-28 | トヨタ自動車株式会社 | Driving advice system |
| JP2007122239A (en) * | 2005-10-26 | 2007-05-17 | Toyota Motor Corp | Vehicle driving information display device |
| JP2007213324A (en) * | 2006-02-09 | 2007-08-23 | Nissan Motor Co Ltd | Driving evaluation support system and method for calculating driving evaluation data |
| JP5217103B2 (en) | 2006-03-24 | 2013-06-19 | トヨタ自動車株式会社 | Fuel consumption display device |
| US20080319605A1 (en) * | 2007-06-25 | 2008-12-25 | James Keith Davis | Fuel monitoring device, system, and method |
| JP2009015789A (en) * | 2007-07-09 | 2009-01-22 | Denso Corp | Drive recorder and drive recorder system |
| US8224561B2 (en) * | 2007-12-13 | 2012-07-17 | Hyundai Motor Company | System for assisting fuel-efficient driving |
-
2009
- 2009-03-19 JP JP2009068294A patent/JP5410125B2/en active Active
-
2010
- 2010-03-09 WO PCT/JP2010/001671 patent/WO2010106760A1/en active Application Filing
- 2010-03-09 US US13/256,238 patent/US8660785B2/en not_active Expired - Fee Related
- 2010-03-09 CN CN201080011893XA patent/CN102348968A/en active Pending
Patent Citations (6)
| Publication number | Priority date | Publication date | Assignee | Title |
|---|---|---|---|---|
| JP2000247162A (en) * | 1999-02-26 | 2000-09-12 | Mitsubishi Motors Corp | Operating state evaluating device for vehicle |
| CN1653255A (en) * | 2002-05-10 | 2005-08-10 | 五十铃自动车株式会社 | System and method for evaluating fuel saving operation |
| CN1661349A (en) * | 2004-02-27 | 2005-08-31 | 富士重工业株式会社 | Data recording apparatus and data recording method |
| CN101002012A (en) * | 2004-08-18 | 2007-07-18 | 日产柴油机车工业株式会社 | Fuel consumption evaluation system |
| JP2006344001A (en) * | 2005-06-09 | 2006-12-21 | Omron Corp | Operation management system |
| JP2007023830A (en) * | 2005-07-13 | 2007-02-01 | Hino Motors Ltd | Fuel consumption evaluation device |
Cited By (20)
| Publication number | Priority date | Publication date | Assignee | Title |
|---|---|---|---|---|
| CN102620772B (en) * | 2012-03-31 | 2015-04-22 | 北京经纬恒润科技有限公司 | Monitoring method, device and system for driving action of tester in test car yard |
| CN102620772A (en) * | 2012-03-31 | 2012-08-01 | 北京经纬恒润科技有限公司 | Monitoring method, device and system for driving action of tester in test car yard |
| CN103661166B (en) * | 2012-09-20 | 2016-08-17 | 通用汽车环球科技运作有限责任公司 | For handling method and the vehicle diagnosing system of vehicle diagnosing system |
| CN103661166A (en) * | 2012-09-20 | 2014-03-26 | 通用汽车环球科技运作有限责任公司 | Fail operational power system diagnostics |
| CN103700160A (en) * | 2013-12-31 | 2014-04-02 | 江苏中寰卫星导航通信有限公司 | Motor vehicle onboard terminal based on microsensor and driving behavior judgment method |
| CN103700160B (en) * | 2013-12-31 | 2016-07-13 | 江苏中寰卫星导航通信有限公司 | Carried on vehicle terminal and driving behavior determination methods based on microsensor |
| CN105569853A (en) * | 2014-11-05 | 2016-05-11 | 雅马哈发动机株式会社 | Straddle-type vehicle |
| CN105569853B (en) * | 2014-11-05 | 2019-06-07 | 雅马哈发动机株式会社 | Straddle-type vehicle |
| CN107851377B (en) * | 2015-08-06 | 2021-05-25 | 矢崎能源系统公司 | Driving evaluation device |
| CN107851377A (en) * | 2015-08-06 | 2018-03-27 | 矢崎能源系统公司 | Drive apparatus for evaluating |
| CN107061033A (en) * | 2016-02-10 | 2017-08-18 | 本田技研工业株式会社 | Idle stop device |
| CN107061033B (en) * | 2016-02-10 | 2020-05-08 | 本田技研工业株式会社 | Idling stop device |
| CN111032462A (en) * | 2017-08-31 | 2020-04-17 | 本田技研工业株式会社 | Vehicle control device |
| CN111032462B (en) * | 2017-08-31 | 2022-03-04 | 本田技研工业株式会社 | Vehicle control device |
| CN110803115A (en) * | 2018-08-06 | 2020-02-18 | 通用汽车环球科技运作有限责任公司 | System and method for enhancing vehicle user experience |
| CN111497854A (en) * | 2019-01-29 | 2020-08-07 | 长城汽车股份有限公司 | Method and device for evaluating driving condition of driver and machine-readable storage medium |
| CN113815624A (en) * | 2020-06-19 | 2021-12-21 | 比亚迪股份有限公司 | Driving behavior evaluation method, driving behavior evaluation device, vehicle, and storage medium |
| CN113815624B (en) * | 2020-06-19 | 2023-01-06 | 比亚迪股份有限公司 | Driving behavior evaluation method, driving behavior evaluation device, vehicle, and storage medium |
| CN114526930A (en) * | 2022-03-09 | 2022-05-24 | 河南职业技术学院 | Intelligent network connection automobile fault detection method and system |
| CN114526930B (en) * | 2022-03-09 | 2024-03-26 | 河南职业技术学院 | Intelligent network-connected automobile fault detection method and system |
Also Published As
| Publication number | Publication date |
|---|---|
| WO2010106760A1 (en) | 2010-09-23 |
| JP2010223607A (en) | 2010-10-07 |
| US8660785B2 (en) | 2014-02-25 |
| JP5410125B2 (en) | 2014-02-05 |
| US20120065874A1 (en) | 2012-03-15 |
Similar Documents
| Publication | Publication Date | Title |
|---|---|---|
| CN102348968A (en) | Method and device for diagnosing driving operation | |
| JP4954173B2 (en) | Device for instructing the driver on driving operation to improve fuel efficiency | |
| CN102164770B (en) | Be used to guide chaufeur to improve the device of the driver behavior of fuel efficiency | |
| CN102105324B (en) | Low fuel consumption driving diagnostic device, low fuel consumption driving diagnostic system, controller for electrical drive device, low fuel consumption driving scoring device, and low fuel consumption driving diagnostic method | |
| CN102164779B (en) | Device for promoting improvement in drive operation skill for improving fuel efficiency | |
| CN102112724B (en) | Device for diagnosing fuel saving operation, system for diagnosing fuel saving operation, controller of prime mover, device for scoring fuel saving operation and method for diagnosing fuel saving operation | |
| US8207838B2 (en) | Eco-drive assist apparatus and method | |
| CN103863119B (en) | Display apparatus | |
| US8633812B2 (en) | Fuel-saving driving diagnostic device, fuel-saving driving diagnostic system, travel control device, fuel-saving driving rating device, and fuel-saving driving diagnostic method | |
| US8249767B2 (en) | Eco-drive assist apparatus and method | |
| CN103089463A (en) | Eco drive support apparatus and eco drive state displaying device | |
| JP2009289080A (en) | Driving evaluation device and driving evaluation method | |
| US20110137512A1 (en) | Fuel-saving driving diagnostic device, fuel-saving driving diagnostic system, travel control device, fuel-saving driving rating device, and fuel-saving driving diagnostic method | |
| JP2007210487A (en) | Driving operation evaluation device for hybrid vehicle | |
| CN106353485A (en) | Method and system for monitoring freshness of fuel in vehicles | |
| JP2008164389A (en) | Deceleration travel evaluation device | |
| JP2010144701A (en) | Fuel saving drive evaluation device and fuel saving drive evaluation method | |
| JP5296449B2 (en) | Eco driving support device | |
| JP2010095252A (en) | Device for evaluating running condition of hybrid vehicle | |
| JP5387152B2 (en) | Vehicle travel control device | |
| JP5130101B2 (en) | Shift speed determination device, shift speed determination method, and shift speed determination program | |
| CN115427271A (en) | Method for outputting a recommendation of an energy efficient operation of a vehicle by an auxiliary system comprised by the vehicle | |
| JP4456630B2 (en) | Eco operation status display device | |
| JP4456631B2 (en) | Eco driving support device | |
| JP5614009B2 (en) | Vehicle driving evaluation system and vehicle driving evaluation method |
Legal Events
| Date | Code | Title | Description |
|---|---|---|---|
| C06 | Publication | ||
| PB01 | Publication | ||
| C10 | Entry into substantive examination | ||
| SE01 | Entry into force of request for substantive examination | ||
| C12 | Rejection of a patent application after its publication | ||
| RJ01 | Rejection of invention patent application after publication |
Application publication date: 20120208 |