US7803629B2 - Method for employing SEC-FTIR data to predict mechanical properties of polyethylene - Google Patents
Method for employing SEC-FTIR data to predict mechanical properties of polyethylene Download PDFInfo
- Publication number
- US7803629B2 US7803629B2 US11/476,339 US47633906A US7803629B2 US 7803629 B2 US7803629 B2 US 7803629B2 US 47633906 A US47633906 A US 47633906A US 7803629 B2 US7803629 B2 US 7803629B2
- Authority
- US
- United States
- Prior art keywords
- polymer
- physical
- chemical property
- test sample
- molecular weight
- Prior art date
- Legal status (The legal status is an assumption and is not a legal conclusion. Google has not performed a legal analysis and makes no representation as to the accuracy of the status listed.)
- Expired - Fee Related, expires
Links
- 238000000034 method Methods 0.000 title claims abstract description 123
- 238000005033 Fourier transform infrared spectroscopy Methods 0.000 title claims description 18
- -1 polyethylene Polymers 0.000 title description 43
- 239000004698 Polyethylene Substances 0.000 title description 42
- 229920000573 polyethylene Polymers 0.000 title description 42
- 229920000642 polymer Polymers 0.000 claims abstract description 309
- 238000012549 training Methods 0.000 claims abstract description 167
- 238000012360 testing method Methods 0.000 claims abstract description 160
- 239000000126 substance Substances 0.000 claims abstract description 119
- 239000000026 Pentaerythritol tetranitrate Substances 0.000 claims description 62
- 239000002131 composite material Substances 0.000 claims description 42
- 238000004458 analytical method Methods 0.000 claims description 37
- 239000003054 catalyst Substances 0.000 claims description 32
- 230000015572 biosynthetic process Effects 0.000 claims description 16
- 125000004432 carbon atom Chemical group C* 0.000 claims description 16
- 238000002844 melting Methods 0.000 claims description 15
- 230000008018 melting Effects 0.000 claims description 15
- 125000004429 atom Chemical group 0.000 claims description 6
- 238000012937 correction Methods 0.000 claims description 5
- GNFTZDOKVXKIBK-UHFFFAOYSA-N 3-(2-methoxyethoxy)benzohydrazide Chemical compound COCCOC1=CC=CC(C(=O)NN)=C1 GNFTZDOKVXKIBK-UHFFFAOYSA-N 0.000 claims description 4
- 230000006353 environmental stress Effects 0.000 claims description 4
- FGUUSXIOTUKUDN-IBGZPJMESA-N C1(=CC=CC=C1)N1C2=C(NC([C@H](C1)NC=1OC(=NN=1)C1=CC=CC=C1)=O)C=CC=C2 Chemical compound C1(=CC=CC=C1)N1C2=C(NC([C@H](C1)NC=1OC(=NN=1)C1=CC=CC=C1)=O)C=CC=C2 FGUUSXIOTUKUDN-IBGZPJMESA-N 0.000 claims description 3
- 101001062098 Homo sapiens RNA-binding protein 14 Proteins 0.000 claims 1
- 102100029250 RNA-binding protein 14 Human genes 0.000 claims 1
- 230000002596 correlated effect Effects 0.000 abstract description 3
- 230000002902 bimodal effect Effects 0.000 description 26
- 229920001577 copolymer Polymers 0.000 description 16
- 229920000098 polyolefin Polymers 0.000 description 11
- VYZAMTAEIAYCRO-UHFFFAOYSA-N Chromium Chemical compound [Cr] VYZAMTAEIAYCRO-UHFFFAOYSA-N 0.000 description 10
- 229910052804 chromium Inorganic materials 0.000 description 10
- 239000011651 chromium Substances 0.000 description 10
- 230000009286 beneficial effect Effects 0.000 description 6
- 238000012569 chemometric method Methods 0.000 description 6
- 229920001519 homopolymer Polymers 0.000 description 6
- 241000446313 Lamella Species 0.000 description 4
- 229920005989 resin Polymers 0.000 description 4
- 239000011347 resin Substances 0.000 description 4
- 238000005481 NMR spectroscopy Methods 0.000 description 3
- 239000000805 composite resin Substances 0.000 description 3
- 230000007423 decrease Effects 0.000 description 3
- 238000005227 gel permeation chromatography Methods 0.000 description 3
- 238000004519 manufacturing process Methods 0.000 description 3
- 230000000704 physical effect Effects 0.000 description 3
- 239000002952 polymeric resin Substances 0.000 description 3
- 229920005672 polyolefin resin Polymers 0.000 description 3
- 229920006126 semicrystalline polymer Polymers 0.000 description 3
- 239000002002 slurry Substances 0.000 description 3
- 229920003002 synthetic resin Polymers 0.000 description 3
- 229920001903 high density polyethylene Polymers 0.000 description 2
- 239000004700 high-density polyethylene Substances 0.000 description 2
- 239000012968 metallocene catalyst Substances 0.000 description 2
- 230000035882 stress Effects 0.000 description 2
- 238000012356 Product development Methods 0.000 description 1
- 238000000071 blow moulding Methods 0.000 description 1
- 238000004364 calculation method Methods 0.000 description 1
- 238000011088 calibration curve Methods 0.000 description 1
- 230000001419 dependent effect Effects 0.000 description 1
- 238000013461 design Methods 0.000 description 1
- 230000009977 dual effect Effects 0.000 description 1
- 238000010828 elution Methods 0.000 description 1
- 238000005194 fractionation Methods 0.000 description 1
- 239000000463 material Substances 0.000 description 1
- 239000011159 matrix material Substances 0.000 description 1
- 238000000691 measurement method Methods 0.000 description 1
- 238000012986 modification Methods 0.000 description 1
- 230000004048 modification Effects 0.000 description 1
- 229920005638 polyethylene monopolymer Polymers 0.000 description 1
- 238000011160 research Methods 0.000 description 1
- 230000000630 rising effect Effects 0.000 description 1
- 238000001542 size-exclusion chromatography Methods 0.000 description 1
- 239000001476 sodium potassium tartrate Substances 0.000 description 1
- 238000002798 spectrophotometry method Methods 0.000 description 1
- 230000003068 static effect Effects 0.000 description 1
Images


Classifications
-
- C—CHEMISTRY; METALLURGY
- C08—ORGANIC MACROMOLECULAR COMPOUNDS; THEIR PREPARATION OR CHEMICAL WORKING-UP; COMPOSITIONS BASED THEREON
- C08F—MACROMOLECULAR COMPOUNDS OBTAINED BY REACTIONS ONLY INVOLVING CARBON-TO-CARBON UNSATURATED BONDS
- C08F10/00—Homopolymers and copolymers of unsaturated aliphatic hydrocarbons having only one carbon-to-carbon double bond
-
- C—CHEMISTRY; METALLURGY
- C08—ORGANIC MACROMOLECULAR COMPOUNDS; THEIR PREPARATION OR CHEMICAL WORKING-UP; COMPOSITIONS BASED THEREON
- C08L—COMPOSITIONS OF MACROMOLECULAR COMPOUNDS
- C08L23/00—Compositions of homopolymers or copolymers of unsaturated aliphatic hydrocarbons having only one carbon-to-carbon double bond; Compositions of derivatives of such polymers
- C08L23/02—Compositions of homopolymers or copolymers of unsaturated aliphatic hydrocarbons having only one carbon-to-carbon double bond; Compositions of derivatives of such polymers not modified by chemical after-treatment
- C08L23/04—Homopolymers or copolymers of ethene
-
- G—PHYSICS
- G01—MEASURING; TESTING
- G01N—INVESTIGATING OR ANALYSING MATERIALS BY DETERMINING THEIR CHEMICAL OR PHYSICAL PROPERTIES
- G01N21/00—Investigating or analysing materials by the use of optical means, i.e. using sub-millimetre waves, infrared, visible or ultraviolet light
- G01N21/17—Systems in which incident light is modified in accordance with the properties of the material investigated
- G01N21/25—Colour; Spectral properties, i.e. comparison of effect of material on the light at two or more different wavelengths or wavelength bands
- G01N21/31—Investigating relative effect of material at wavelengths characteristic of specific elements or molecules, e.g. atomic absorption spectrometry
- G01N21/35—Investigating relative effect of material at wavelengths characteristic of specific elements or molecules, e.g. atomic absorption spectrometry using infrared light
- G01N21/3563—Investigating relative effect of material at wavelengths characteristic of specific elements or molecules, e.g. atomic absorption spectrometry using infrared light for analysing solids; Preparation of samples therefor
-
- G—PHYSICS
- G01—MEASURING; TESTING
- G01N—INVESTIGATING OR ANALYSING MATERIALS BY DETERMINING THEIR CHEMICAL OR PHYSICAL PROPERTIES
- G01N33/00—Investigating or analysing materials by specific methods not covered by groups G01N1/00 - G01N31/00
- G01N33/44—Resins; Plastics; Rubber; Leather
- G01N33/442—Resins; Plastics
-
- C—CHEMISTRY; METALLURGY
- C08—ORGANIC MACROMOLECULAR COMPOUNDS; THEIR PREPARATION OR CHEMICAL WORKING-UP; COMPOSITIONS BASED THEREON
- C08F—MACROMOLECULAR COMPOUNDS OBTAINED BY REACTIONS ONLY INVOLVING CARBON-TO-CARBON UNSATURATED BONDS
- C08F2400/00—Characteristics for processes of polymerization
- C08F2400/02—Control or adjustment of polymerization parameters
-
- G—PHYSICS
- G01—MEASURING; TESTING
- G01N—INVESTIGATING OR ANALYSING MATERIALS BY DETERMINING THEIR CHEMICAL OR PHYSICAL PROPERTIES
- G01N21/00—Investigating or analysing materials by the use of optical means, i.e. using sub-millimetre waves, infrared, visible or ultraviolet light
- G01N21/17—Systems in which incident light is modified in accordance with the properties of the material investigated
- G01N21/25—Colour; Spectral properties, i.e. comparison of effect of material on the light at two or more different wavelengths or wavelength bands
- G01N21/31—Investigating relative effect of material at wavelengths characteristic of specific elements or molecules, e.g. atomic absorption spectrometry
- G01N21/35—Investigating relative effect of material at wavelengths characteristic of specific elements or molecules, e.g. atomic absorption spectrometry using infrared light
- G01N2021/3595—Investigating relative effect of material at wavelengths characteristic of specific elements or molecules, e.g. atomic absorption spectrometry using infrared light using FTIR
-
- G—PHYSICS
- G01—MEASURING; TESTING
- G01N—INVESTIGATING OR ANALYSING MATERIALS BY DETERMINING THEIR CHEMICAL OR PHYSICAL PROPERTIES
- G01N30/00—Investigating or analysing materials by separation into components using adsorption, absorption or similar phenomena or using ion-exchange, e.g. chromatography or field flow fractionation
- G01N30/02—Column chromatography
-
- Y—GENERAL TAGGING OF NEW TECHNOLOGICAL DEVELOPMENTS; GENERAL TAGGING OF CROSS-SECTIONAL TECHNOLOGIES SPANNING OVER SEVERAL SECTIONS OF THE IPC; TECHNICAL SUBJECTS COVERED BY FORMER USPC CROSS-REFERENCE ART COLLECTIONS [XRACs] AND DIGESTS
- Y10—TECHNICAL SUBJECTS COVERED BY FORMER USPC
- Y10T—TECHNICAL SUBJECTS COVERED BY FORMER US CLASSIFICATION
- Y10T436/00—Chemistry: analytical and immunological testing
- Y10T436/25—Chemistry: analytical and immunological testing including sample preparation
Definitions
- the present invention is directed to methods of determining values of physical or chemical properties of polymers.
- Traditionally in order to determine a value of a specific physical or chemical property, a certain quantity of the particular polymer resin was needed to fabricate an article or a test specimen, and then the resulting article or test specimen was subsequently tested via the prescribed analytical test procedure to determine the value of the physical or chemical property. This procedure is cumbersome not only due to the time required for fabricating the article or test specimen, but also the time required to perform the respective analytical test procedure. Further, the traditional method, depending upon the particular test, could require large amounts of polymer, often more than could be produced in small-scale research laboratory or pilot plant apparatus.
- this method should provide for the value of the physical or chemical property of the test sample to be determined without fabricating an article or a test specimen. Still further, this method should allow determination of the value of the physical or chemical property of the test sample without performing the analytical test for the physical or chemical property.
- the present invention discloses a method of determining values of physical or chemical properties of polymers.
- the present invention provides a method of determining a value of a physical or chemical property of at least one polymer test sample.
- the at least one polymer test sample has a molecular weight distribution (MWD) profile and a short chain branching distribution (SCBD).
- MWD molecular weight distribution
- SCBD short chain branching distribution
- the method of determining a value of a physical or chemical property of the at least one polymer test sample comprises:
- each training sample having a MWD profile, a SCBD, and a known value of the respective physical or chemical property
- step d correlating the respective areas for each of the at least two polymer training samples in step d) with the known value of the respective physical or chemical property
- step f) applying the correlation of step e) to the respective area of the at least one polymer test sample to determine the value of the physical or chemical property of the at least one polymer test sample.
- the method is directed to a single-point determination. That is, the weighted cross term is determined at a single molecular weight.
- the present invention provides a method of determining a value of a physical or chemical property of at least one polymer test sample.
- the at least one polymer test sample has a molecular weight, a weight fraction at the respective molecular weight, and a number of short chain branches per 1000 carton atoms at the respective molecular weight. This method comprises:
- each training sample having a molecular weight, a weight fraction at the respective molecular weight, a number of short chain branches per 1000 carton atoms at the respective molecular weight, and a known value of the respective physical or chemical property;
- each weighted cross term being determined as the multiplication product of:
- step b) correlating the respective weighted cross terms for each of the at least two polymer training samples in step b) with the known value of the respective physical or chemical property;
- step d) applying the correlation of step c) to the weighted cross term of the at least one polymer test sample to determine the value of the physical or chemical property of the at least one polymer test sample.
- a chemometric method can be used to determine a value of a physical or chemical property of at least one polymer test sample.
- the at least one polymer test sample has a MWD profile and a SCBD. This method comprises:
- each training sample having a MWD profile, a SCBD, and a known value of the respective physical or chemical property
- step d) applying the mathematical relationship of step c) to the respective weighted cross terms of step b) for the at least one polymer test sample to determine the value of the physical or chemical property of the at the least one polymer test sample.
- the present invention provides a method of determining a value of a physical or chemical property of at least one polymer test sample using tie molecule probabilities.
- the at least one polymer test sample has a composite density, a MWD profile, and a SCBD.
- the method of determining a value of a physical or chemical property of the at least one polymer test sample comprises:
- each training sample having a composite density, a MWD profile, a SCBD, and a known value of the respective physical or chemical property
- step b) determining a respective melting temperature from each density term in step b);
- step c) determining a respective probability for tie molecule formation from each melting temperature in step c);
- each weighted tie molecule probability being determined as the multiplication product of:
- step g correlating the respective areas for each of the at least two polymer training samples in step g) with the known value of the respective physical or chemical property;
- step h) applying the correlation of step h) to the respective area of the at least one polymer test sample to determine the value of the physical or chemical property of the at least one polymer test sample.
- a further aspect of the present invention is a single-point method which utilizes tie molecule probabilities. That is, the weighted tie molecule probability is determined at a single molecular weight.
- the present invention provides a method of determining a value of a physical or chemical property of at least one polymer test sample.
- the at least one polymer test sample has a composite density, a molecular weight, and a weight fraction at the respective molecular weight. This method comprises:
- each training sample having a composite density, a molecular weight, a weight fraction at the respective molecular weight, and a known value of the respective physical or chemical property
- step b determining a respective probability for tie molecule formation at the respective molecular weight from each 2L c +L a of step b);
- each weighted tie molecule probability being determined as the multiplication product of:
- step d correlating the respective weighted tie molecule probability for each of the at least two polymer training samples in step d) with the known value of the respective physical or chemical property;
- step f) applying the correlation of step e) to the weighted tie molecule probability of the at least one polymer test sample to determine the value of the physical or chemical property of the at least one polymer test sample.
- PSP2 Primary structure parameter 2; calculated by multiplying the area under the curve of the plot of the weighted tie molecule probability versus molecular weight by 100.
- SCBD Short chain branching distribution. SCB's Number of short chain branches per 1000 carbon atoms. SEC Size Exclusion Chromatography; also referred to as Gel Permeation Chromatography (GPC). SP-NCTL Single Point Notched Constant Tensile Load, ASTM D5397, 30% yield. Weighted Multiplication product of a molecular weight, the weight cross fraction at the respective molecular weight, and the number of short chain term branches per 1000 carbon atoms at the respective molecular weight; also shown as M * dW/d(Log M) * SCB.
- Weighted Multiplication product of the weight fraction at tie molecule a molecular weight and the probability for tie molecule formation at the probability respective molecular weight also shown as dW/d(Log M) * P TM . 2L c + L a Minimum molecule length for a tie molecule; L c is the crystalline lamella thickness and L a is the amorphous layer thickness.
- FIG. 1 presents a plot of the molecular weight distribution (MWD) profile and the short chain branching distribution (SCBD) for an exemplary polyolefin copolymer.
- FIG. 2 presents a plot of the weighted cross term versus the logarithm of the molecular weight for an exemplary polyolefin copolymer.
- FIG. 3 presents a plot of Log PENT (in hours) at 2.4 MPa versus primary structure parameter 1 (PSP1) for two exemplary series of polyolefin polymers.
- FIG. 4 presents a plot illustrating an empirical correlation of composite density versus the logarithm of weight-averaged molecular weight for an exemplary homopolymer.
- FIG. 5 presents a plot of the MWD profile and the respective homopolymer and copolymer density terms across the MWD profile for an exemplary polyolefin copolymer.
- FIG. 6 presents a plot illustrating an empirical correlation of melting temperature versus density for polyethylene polymers.
- FIG. 7 presents a plot of 2L c +L a (measured in nm) as a function of density for one aspect of a method of the present invention compared with reported literature values.
- FIG. 8 presents a plot of the weighted tie molecule probability versus the logarithm of the molecular weight for two exemplary polyolefin copolymers.
- FIG. 9 presents a plot of the molecular weight distribution (MWD) profile and the short chain branching distribution (SCBD) for bimodal polyethylene polymer BM-1.
- FIG. 10 presents a plot of the molecular weight distribution (MWD) profile and the short chain branching distribution (SCBD) for bimodal polyethylene polymer BM-2.
- FIG. 11 presents a plot of the molecular weight distribution (MWD) profile and the short chain branching distribution (SCBD) for bimodal polyethylene polymer BM-3.
- FIG. 12 presents a plot of the molecular weight distribution (MWD) profile and the short chain branching distribution (SCBD) for bimodal polyethylene polymer BM-4.
- FIG. 13 presents a plot of the molecular weight distribution (MWD) profile and the short chain branching distribution (SCBD) for bimodal polyethylene polymer BM-5.
- FIG. 14 presents a plot of the molecular weight distribution (MWD) profile and the short chain branching distribution (SCBD) for bimodal polyethylene polymer BM-6.
- FIG. 15 presents a plot of the molecular weight distribution (MWD) profile and the short chain branching distribution (SCBD) for bimodal polyethylene polymer BM-7.
- FIG. 16 presents a plot of the weighted cross term versus the logarithm of the molecular weight for bimodal polyethylene polymer training samples BM-1 to BM-7.
- FIG. 17 presents a plot of Log PENT (in hours) at 2.4 MPa versus PSP1 for bimodal polyethylene polymer training samples BM-2 to BM-7.
- FIG. 18 presents a plot of the weighted cross term versus the logarithm of the molecular weight for polyethylene polymer training samples produced using a chromium-based catalyst.
- FIG. 19 presents a plot of Log PENT (in hours) at 2.4 MPa versus PSP1 for polyethylene copolymer training samples produced using a chromium-based catalyst.
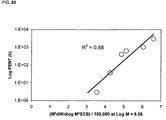
- FIG. 20 presents a plot of Log PENT (in hours) at 2.4 MPa versus weighted cross terms divided by 100,000 for bimodal polyethylene polymer training samples.
- FIG. 21 presents a plot of predicted PENT (in hours) at 2.4 MPa using chemometric analysis versus measured PENT for various polyethylene polymer training samples.
- FIG. 22 presents a plot of predicted PENT (in hours) at 2.4 MPa using chemometric analysis versus measured PENT for various polyethylene polymer training samples.
- FIG. 23 presents a plot of Log PENT (in hours) at 2.4 MPa versus PSP2 for polyethylene polymer training samples produced using different catalyst systems.
- FIG. 24 presents a plot of Log SP-NCTL (in hours) versus PSP2 for polyethylene polymer training samples produced using different catalyst systems.
- FIG. 25 presents a plot of NDR versus PSP2 for polyethylene polymer training samples produced using different catalyst systems.
- FIG. 26 presents a plot of Log PENT (in hours) at 2.4 MPa versus weighted tie molecule probability for bimodal polyethylene polymer training samples.
- the present invention is directed to a method of determining values of physical or chemical properties of polymers.
- Exemplary physical or chemical properties of interest in the present invention include, but are not limited to, PENT, ESCR, SP-NCTL, NPT, FNCT, NDR, izod impact, dart impact, Charpy impact, puncture resistance, or Elmendorf tear strength.
- the PENT value can be determined at different conditions, such as, for example, 2.4 MPa, 3.0 MPa, or 3.8 MPa.
- the method of the present invention is applicable to all classes of polymers, although the method is particularly well suited for semi-crystalline polymers.
- the invention will be described in connection with polyolefins, particularly polyethylene homopolymers and copolymers. It is understood that the present invention is not limited to the aspects and examples outlined herein, and that the present invention includes all alternatives, modifications, and equivalents as may be included within the spirit and the scope of the specification and claims that follow.
- the method described herein can determine the values of physical or chemical properties of test samples using knowledge of the respective test samples MWD profile and SCBD.
- a method in accordance with this invention further requires a composite resin density of the polymer test sample.
- the MWD profile of a polymer can be provided by any means known to one or ordinary skill in the art.
- a non-limiting example of an analytical technique to determine the MWD profile of a polymer is SEC or GPC.
- the MWD profile of a polymer can provide, among other data, the MWD data and associated weight fraction at each MW, including common terms useful in the art such as M w and M n .
- the SCBD of a polymer can be provided by any means known to one of skill in the art. Techniques could include, but are not limited to, temperature rising elution fractionation (TREF), nuclear magnetic resonance (NMR), and SEC-FTIR. Inherently, as used in this disclosure, the SCBD of a polymer can provide the number of short chain branches per 1000 carbon atoms (SCB's) at each MW across the MWD profile.
- TEZ temperature rising elution fractionation
- NMR nuclear magnetic resonance
- SEC-FTIR SEC-FTIR
- SEC-FTIR SEC-FTIR using chemometric analysis, described in U.S. Pat. No. 6,632,680 and U.S. patent application Ser. No. 10/463,849, the disclosures of which are incorporated in their entirety by this reference.
- An advantage of SEC-FTIR as it relates to the methods of the present invention is the small quantity of the polymer training samples and of the polymer test samples that are required for analysis to determine the MWD profile and the SCBD. In one aspect of the present invention, less than about 5 grams each of the respective test or training samples is provided for determination of the MWD profile and the SCBD. In another aspect, less than about 1 gram is provided for analysis.
- another advantage of the present invention is the quick determination of a physical or chemical property of a test sample as compared to conventional testing and measurement methods.
- the value of a physical or chemical property can be determined in less than three hours.
- the value of a physical or chemical property can be determined in less than two hours.
- the value of a physical or chemical property can be determined in less than one hour.
- Composite resin density likewise can be determined by any means known to one of ordinary skill in the art. Analytical techniques include, but are not limited to, refractive index or molded density per ASTM D 1238.
- the composite resin density is the density of the polymer as a whole, across all molecular weights.
- PSP1 Primary Structure Parameter 1
- One aspect of the present invention provides a method of determining a value of a physical or chemical property of at least one polymer test sample, the at least one polymer test sample having a molecular weight distribution (MWD) profile and a short chain branching distribution (SCBD).
- MWD profile and SCBD can be determined via any analytical technique known to one of ordinary skill in the art, such as SEC-FTIR.
- the polymer test sample can also be referred to as an experimental sample or an unknown sample.
- the method of determining a value of a physical or chemical property of the at least one polymer test sample comprises:
- each training sample having a MWD profile, a SCBD, and a known value of the respective physical or chemical property
- step d correlating the respective areas for each of the at least two polymer training samples in step d) with the known value of the respective physical or chemical property
- step f) applying the correlation of step e) to the respective area of the at least one polymer test sample to determine the value of the physical or chemical property of the at least one polymer test sample.
- At least two different polymer training samples are provided in accordance with the methods of the present invention.
- Training samples can also be referred to as control samples.
- Each polymer training sample has a known MWD profile and a known SCBD.
- the MWD profile and the SCBD can be determined using a technique such as SEC-FTIR, as mentioned above.
- FIG. 1 illustrates the MWD profile and the SCBD of the copolymer.
- the x-axis is the logarithm of the molecular weight
- the left hand side y-axis is the weight fraction at each molecular weight
- the right hand side y-axis is the number of short chain branches per 1000 carbon atoms (SCB's).
- Graphical data as illustrated in FIG. 1 can be provided for both the at least two polymer training samples and the at least one polymer test sample.
- each polymer training sample has a known value of the respective physical or chemical property that is of interest.
- at least two polymer training samples can be provided that each have a known value of PENT at 2.4 MPa, the PENT value having been determined previously using the respective analytical test for PENT.
- At least two polymer training samples are used in the methods of the present invention. Alternatively, however, at least three training samples, at least four training samples, at least five training samples, at least ten training samples, at least fifteen training samples, or at least twenty training samples, can be used. There is no specific upper limit on the number of different training samples that can be used with the present invention. It is beneficial that the training samples resemble the polymer test sample, and that the range covered by the training samples encompass the polymer test sample, but this is not required. Further, the training samples can include duplicate or redundant samples to include the impact of experimental error in the tests for MWD profile and SCBD, and of the respective physical or chemical property of interest.
- weighted cross terms can be determined using the respective data for each sample as exemplified in FIG. 1 .
- a weighted cross term is the multiplication product of a molecular weight, the weight fraction at the respective molecular weight, and the number of short chain branches per 1000 carbon atoms at the respective molecular weight (i.e., M*dW/d(Log M)*SCB's). While not intending to be bound by this theory, Applicants submit that one factor related to polymers with improved toughness (e.g., tear, impact, puncture, or stress crack resistance) is the presence of more short chain branching at higher molecular weights.
- the presence of high levels of branching at lower molecular weights does not contribute significantly to improved toughness (e.g., in properties such as PENT, SP-NCTL, dart impact, and the like). Rather, high short chain branch content present on the high molecular weight end of the MWD profile can contribute significantly to improved toughness of polymers.
- the weighted cross term, as defined above captures the impact of having a higher branching content on the higher molecular weight fraction of the polymer.
- At least two weighted cross terms at respective molecular weights along the MWD profile and the SCBD are required.
- Each weighted cross term is plotted versus the logarithm of the respective molecular weight, for each of the at least two polymer training samples and the at least one polymer test sample. This is illustrated in FIG. 2 for an exemplary polyolefin copolymer.
- FIG. 2 for an exemplary polyolefin copolymer.
- At least five weighted cross terms at least ten weighted cross terms, at least twenty-five weighted cross terms, at least fifty weighted cross terms, or at least one hundred weighted cross terms, can be used.
- the area under the respective curve for each sample is determined. For example, the area under the curve in FIG. 2 for the exemplary copolymer is determined.
- the respective areas under the curve for each of the at least two polymer training samples are then correlated with the respective value of the physical or chemical property or properties of interest.
- the area under each curve is divided by 100,000 to calculate primary structure parameter 1 (PSP1).
- FIG. 3 illustrates a correlation of a specific physical or chemical property (in this case, Log PENT at 2.4 MPa) versus PSP1 for two exemplary series of polyolefin polymers. The results indicate that there is a linear relationship between the logarithm of the property of interest and the PSP1 value, which is impacted by the branch content of the high molecular weight fraction of the copolymer.
- the value of the physical or chemical property of interest for the at least one polymer test sample can be determined. This method is further illustrated in Examples 1-2 that follow.
- Another aspect of the present invention provides a method of determining a value of a physical or chemical property of at least one polymer test sample, the at least one polymer test sample having a molecular weight, a weight fraction at the respective molecular weight, and a number of short chain branches per 1000 carton atoms at the respective molecular weight.
- These parameters can be determined from a MWD profile and a SCBD via any analytical technique known to one of ordinary skill in the art, such as SEC-FTIR.
- This method of determining a value of a physical or chemical property of the at least one polymer test sample comprises:
- each training sample having a molecular weight, a weight fraction at the respective molecular weight, a number of short chain branches per 1000 carton atoms at the respective molecular weight, and a known value of the respective physical or chemical property;
- each weighted cross term being determined as the multiplication product of:
- step b) correlating the respective weighted cross terms for each of the at least two polymer training samples in step b) with the known value of the respective physical or chemical property;
- step d) applying the correlation of step c) to the weighted cross term of the at least one polymer test sample to determine the value of the physical or chemical property of the at least one polymer test sample.
- the above method is a single-point determination of the method illustrated in FIGS. 1-3 .
- a single weighted cross term at a single molecular weight is determined for each of the at least two polymer training samples and the at least one polymer test sample. This method is further illustrated by Example 3 that follows.
- each family of polyolefin resins produced with different catalyst systems such as chromium, Ziegler-Natta, metallocene, and the like, or combinations thereof
- different production processes such as slurry, solution, gas phase, and the like, or combinations thereof
- a chemometric method can be used to determine a value of a physical or chemical property of at least one polymer test sample, the at least one polymer test sample having a MWD profile and a SCBD. This method comprises:
- each training sample having a MWD profile, a SCBD, and a known value of the respective physical or chemical property
- step d) applying the mathematical relationship of step c) to the respective weighted cross terms of step b) for the at least one polymer test sample to determine the value of the physical or chemical property of the at the least one polymer test sample.
- This chemometric method can be used when the at least two polymer training samples and the at least one polymer test sample are prepared using catalyst systems that are the same or are different.
- this method can be used for different families of polyolefin resins produced with different catalyst systems (such as chromium, Ziegler-Natta, metallocene, and the like, or combinations thereof) or with different production processes (such as slurry, solution, gas phase, and the like, or combinations thereof).
- chemometric analysis was described also in U.S. Pat. No. 6,632,680 and U.S. patent application Ser. No. 10/463,849.
- chemometric analysis can be used to define a mathematical relationship between the values of the respective physical or chemical properties and the weighted cross terms for each of the at least two polymer training samples.
- At least two polymer training samples are used in this aspect of the present invention.
- at least three training samples, at least four training samples, at least five training samples, at least ten training samples, at least fifteen training samples, or at least twenty training samples can be used. There is no specific upper limit on the number of different training samples that can be used in this aspect of the present invention.
- This chemometric method is further illustrated by Examples 4-5 that follow.
- PSP2 Primary Structure Parameter 2
- the present invention provides a method of determining a value of a physical or chemical property of at least one polymer test sample, the at least one polymer test sample having a composite density, a MWD profile, and a SCBD.
- the composite density can be determined via any analytical technique known to one of ordinary skill in the art, as mentioned above.
- the method of determining a value of a physical or chemical property of the at least one polymer test sample comprises:
- each training sample having a composite density, a MWD profile, a SCBD, and a known value of the respective physical or chemical property
- step b) determining a respective melting temperature from each density term in step b);
- step c) determining a respective probability for tie molecule formation from each melting temperature in step c);
- each weighted tie molecule probability being determined as the multiplication product of:
- step g correlating the respective areas for each of the at least two polymer training samples in step g) with the known value of the respective physical or chemical property;
- step h) applying the correlation of step h) to the respective area of the at least one polymer test sample to determine the value of the physical or chemical property of the at least one polymer test sample.
- tie molecules can contribute significantly to improved toughness properties (e.g., tear, impact, puncture, or stress crack resistance) of polymers.
- the above method is directed toward determining the value of a physical or chemical property of a polymer test sample using tie molecule probabilities.
- This method of the present invention employs at least two different polymer training samples.
- Each polymer training sample has a known composite density, a known MWD profile, and a known SCBD.
- the composite density can be determined via ASTM D 1238, while the MWD profile and the SCBD can be determined using SEC-FTIR, for example.
- FIG. 1 illustrates the MWD profile and the SCBD of the copolymer. Graphical data as illustrated in FIG. 1 can be provided for both the at least two polymer training samples and the at least one polymer test sample.
- each polymer training sample has a known value of the respective physical or chemical property that is of interest. For instance, at least two polymer training samples can be provided that each have a known value of PENT at 2.4 MPa, the PENT value having been determined previously using the respective analytical test for PENT.
- At least two polymer training samples are used in the methods of the present invention. Alternatively, however, at least three training samples, at least four training samples, at least five training samples, at least ten training samples, at least fifteen training samples, or at least twenty training samples, can be used. There is no specific upper limit on the number of different training samples that can be used with the present invention. It is beneficial that the training samples resemble the polymer test sample, and that the range covered by the training samples encompass the polymer test sample, but this is not required. Further, the training samples can include duplicate or redundant samples to include the impact of experimental error in the tests for composite density, MWD profile, and SCBD, and of the respective physical or chemical property of interest.
- At least two density terms at respective molecular weights along the MWD profile and the SCBD are determined using the composite density, the MWD profile, and the SCBD.
- a relationship between density and molecular weight is utilized.
- the composite density of a polymer can depend on, among other things, the MWD profile and the SCBD of the polymer.
- each density term is determined using an empirical correlation between composite density and molecular weight.
- the composite density decreases as the molecular weight increases.
- a set of narrow MWD homopolymers polydispersity index of about 2.3 as disclosed in Jordens et al. in POLYMER, 41 (2000), 7175
- an empirical correlation between composite density and molecular weight can be determined.
- FIG. 4 illustrates a plot of composite density versus the logarithm of the weight-average molecular weight for an exemplary homopolymer, high density polyethylene.
- a correction can be applied to the correlation of FIG. 4 .
- the density terms derived from FIG. 4 are added based on their respective weight fraction to estimate a calculated density assuming no short chain branches. For example, assuming a copolymer with a composite density of about 0.951 g/mL, the calculated density assuming no short chain branches can be about 0.957 g/mL, a difference of about 0.006 g/mL.
- a correction factor based on this change in the composite density divided by the average number of SCB's in the SCBD can then be applied to determine each density term for a copolymer
- the average number of SCB's can be determined using analytical techniques such as NMR or SEC-FTIR.
- the average number of SCB's across the whole polymer is about 1.5.
- the density term at each molecular weight for this exemplary copolymer decreases about 0.004 g/mL (0.006 divided by 1.5) for each short chain branch per 1000 carbon atoms.
- each short chain branch suppresses density equally at all levels of SCB's and at all molecular weights across the MWD profile.
- This process is illustrated in FIG. 5 for the MWD profile of FIG. 1 .
- the top line overlaying the MWD profile in FIG. 5 uses the density correlation of FIG. 4 , and assumes homopolymer, i.e., no short chain branches.
- the lower line uses the correction factor based on the change in composite density divided by the average number of SCB's in the SCBD to determine density terms across the MWD profile for the copolymer. From FIG. 5 , a copolymer density term at each respective MW can be determined.
- At least two density terms at respective molecular weights along the MWD profile and the SCBD are required. Although at least density two terms are required, it is beneficial to have many more density terms across the range of molecular weights to form the curves and correlations illustrated in FIG. 5 .
- at least five density terms, at least ten density terms, at least twenty-five density terms, at least fifty density terms, or at least one hundred density terms can be used. There is no specific upper limit on the number of density terms that can be used with the present invention. More density terms can provide a more accurate correction factor and a more accurate copolymer density curve as illustrated in FIG. 5 .
- a respective melting temperature can then be determined from each density term.
- One such method is the use of an empirical correlation between melting temperature and density, such as that illustrated in FIG. 6 for a polyethylene polymer. The data in this plot is from Patel et al. in J. APPL. POLY. SCI, 60 (1996), 749; Mirabella et al. in J. POLY. SCI., PART B: POLYMER PHYSICS, 40 (2002), 1637; and Huang et al. in J. POLY. SCI., PART B: POLYMER PHYSICS, 28 (1990), 2007.
- a point at a density of 1.01 g/mL was assigned by the Applicants.
- a respective melting temperature can be determined from each density term at a respective molecular weight across the MWD profile of FIG. 5 .
- a respective probability for tie molecule formation from each melting temperature is determined a respective probability for tie molecule formation.
- One technique involves determining, at each respective MW, the crystalline lamella thickness (L c ) and the amorphous layer thickness (L a ) using the melting temperature in FIG. 6 and the Gibbs-Thompson equation, which is readily known to one or ordinary skill in the art. The objective is not solely to determine L c and L a , rather to determine 2L c +L a at each respective MW. 2L c +L a is generally understood to be the minimum molecule length for a tie molecule, wherein the tie molecule spans the amorphous layer and spans two crystalline lamella.
- P TM the probability for tie molecule formation
- P TM is the probability that a molecule will span a distance greater than 2L c +L a at that respective MW.
- M w molecular weight
- Spreadsheet and/or computer based methods can be used to determine the value of P or P TM at each respective MW from the respective melting temperature. Calculated values of P TM using the present method compare well with values reported in the literature, such as by Patel et al. Some limitations of this method for determining P TM can include that P TM alone does not reflect the actual tie-molecule concentration in semi-crystalline polymers (i.e. loops from entanglements may serve as junction points as well). Moreover, only static tie molecule levels are accounted for in these calculations and do not include new tie chains (dynamic) that can form due to lamellar sliding as a result of deformation.
- weighted tie molecule probabilities can be determined using the respective data for each sample.
- a weighted tie molecule probability is the multiplication product of a weight fraction at a respective molecular weight and P TM , the probability for tie molecule formation, at the respective molecular weight (i.e., dW/d(Log M)*P TM ).
- At least two weighted tie molecule probabilities at respective molecular weights along the MWD profile and the SCBD are required.
- Each weighted tie molecule probability is plotted versus the logarithm of the respective molecular weight, for each of the at least two polymer training samples and the at least one polymer test sample. This is illustrated in FIG. 8 for two exemplary polyolefin copolymers.
- at least two weighted tie molecule probabilities are required, it is beneficial to have many more probability terms across the range of molecular weights to form the curve illustrated in FIG. 8 .
- At least five weighted tie molecule probabilities can be used.
- At least ten weighted tie molecule probabilities can be used with the present invention.
- More weighted tie molecule probabilities provide a smoother curve as illustrated in FIG. 8 .
- the area under the respective curve for each sample is determined. For example, the areas under the curves in FIG. 8 for the exemplary copolymers are determined. The respective areas under the curve for each of the at least two polymer training samples are then correlated with the respective value of the physical or chemical property or properties of interest. In one aspect of the present invention, the area under each curve is multiplied by 100 to calculate primary structure parameter 2 (PSP2).
- PSP2 primary structure parameter 2
- the polymer sample with the higher peak has a PSP2 value of 10.9
- the polymer sample with the smaller peak has a PSP2 value of 9.8. Correlations with a specific physical or chemical property using the at least two polymer training samples also can made with the PSP2 value.
- the value of the physical or chemical property of interest for the at least one polymer test sample can be determined. This method is further illustrated in Examples 6-8 that follow.
- This method involving tie molecules can be used when the at least two polymer training samples and the at least one polymer test sample are prepared using catalyst systems that are the same or are different.
- this method can be used for different families of polyolefin resins produced with different catalyst systems (such as chromium, Ziegler-Natta, metallocene, and the like, or combinations thereof) or with different production processes (such as slurry, solution, gas phase, and the like, or combinations thereof).
- Another aspect of the present invention provides a method of determining a value of a physical or chemical property of at least one polymer test sample, the at least one polymer test sample having a composite density, a molecular weight, and a weight fraction at the respective molecular weight. These parameters can be determined via various analytical techniques known to one of ordinary skill in the art, as discussed previously.
- This method of determining a value of a physical or chemical property of the at least one polymer test sample comprises:
- each training sample having a composite density, a molecular weight, a weight fraction at the respective molecular weight, and a known value of the respective physical or chemical property
- step b determining a respective probability for tie molecule formation at the respective molecular weight from each 2L c +L a of step b);
- each weighted tie molecule probability being determined as the multiplication product of:
- step d correlating the respective weighted tie molecule probability for each of the at least two polymer training samples in step d) with the known value of the respective physical or chemical property;
- step f) applying the correlation of step e) to the weighted tie molecule probability of the at least one polymer test sample to determine the value of the physical or chemical property of the at least one polymer test sample.
- the above method is a single-point determination of the method illustrated in FIGS. 4-8 .
- a single weighted tie molecule probability is determined at a single molecular weight for each of the at least two polymer training samples and the at least one polymer test sample.
- the composite density reflects the impact of short chain branching and molecular weight across the whole polymer.
- respective 2L c +L a values can be determined from the respective composite density of the polymer sample. This method is further illustrated in Example 9 that follows.
- Table I lists the Mw, composite density, and measured PENT (hours) at 2.4 MPa for seven (7) bimodal polyethylene polymers produced using Ziegler-Natta catalysts.
- FIGS. 9-15 are the MWD profile and SCBD of these seven polymer training samples. These figures illustrate the measured data and the fitted SCBD using an SEC-FTIR technique, as described in U.S. Pat. No. 6,632,680 and U.S. patent application Ser. No. 10/463,849. Due to the low weight fraction at very high molecular weights, it is often difficult to accurately measure the SCB's at these respective molecular weights. Application of the methodology discussed earlier relative to the weighted cross terms of these seven training samples resulted in the curves illustrated in FIG. 16 .
- FIG. 17 illustrates that a strong linear correlation exists between the Log PENT value and PSP1 for these polymers. Since an exact PENT value was not established for the BM-1 polymer, it was not plotted on FIG. 17 . Thus, the PENT value of a test sample (an unknown or an experimental sample) from the same bimodal polymer family could be determined by applying the correlation in FIG. 17 to the PSP1 value of the test sample.
- Example 3 uses the same bimodal polyethylene polymers discussed in Example 1.
- Table III lists the predicted PENT value at 2.4 MPa using chemometric analysis versus the measured PENT value for a series of polyethylene polymers made using chromium-based, Ziegler-Natta, and dual catalyst systems. This data is illustrated graphically in FIG. 21 .
- the MWD profile and SCBD of these polymer training samples were provided via SEC-FTIR. Although the MWD profile and SCBD data are not shown, this information is exemplified in FIGS. 9-15 related to Example 1. Respective weighted cross terms along the MWD profile and the SCBD were determined for each of the polymer training samples. Chemometric methods were used to generate a mathematical relationship, or correlation, between PENT values and the weighted cross terms, and subsequently to PSP1.
- the mathematical relationship illustrated in FIG. 21 was independent of the catalyst system and process used to produce the polymer training samples. Thus, the PENT value of a test sample could be determined by applying the chemometric analysis to the PSP1 value of the test sample.
- Table IV lists the predicted PENT value at 2.4 MPa using chemometric analysis versus the measured PENT value for a series of polyethylene polymers made using different catalyst systems. This data is illustrated graphically in FIG. 22 .
- the MWD profile and SCBD of these polymer training samples were provided via SEC-FTIR. Although the MWD profile and SCBD data are not shown, this information is exemplified in FIGS. 9-15 related to Example 1. Respective weighted cross terms along the MWD profile and the SCBD were determined for each of the polymer training samples. Chemometric methods were used to generate a mathematical relationship, or correlation, between PENT values and the weighted cross terms, and subsequently to PSP1. The mathematical relationship illustrated in FIG. 22 was independent of the catalyst system and process used to produce the polymer training samples. Thus, the PENT value of a test sample could be determined by applying the chemometric analysis to the PSP1 value of the test sample.
- FIG. 23 illustrates that a strong linear correlation exists between the Log PENT value and PSP2 for these polymers, irrespective of the catalyst system used to produce the polymer training samples.
- the PENT value of a polymer test sample produced using similar or different catalyst systems could be determined by applying the correlation in FIG. 23 to the PSP2 value of the test sample.
- FIG. 24 illustrates that a strong linear correlation exists between the Log SP-NCTL value and PSP2 for these copolymers, irrespective of the catalyst system used to produce the polymer training sample. Further, these polymers spanned a large composite density range. Thus, the SP-NCTL value of a polymer test sample produced using similar or different catalyst systems could be determined by applying the correlation in FIG. 24 to the PSP2 value of the test sample.
- Composite densities were provided and ranged from about 0.91 to about 0.96 g/mL for the thirty-eight (38) polymer training samples.
- Application of the methodology discussed earlier relative to the weighted tie molecule probabilities of these thirty-eight training samples resulted in curves similar to those exemplified in FIG. 8 .
- the respective areas under the curves were determined and multiplied by 100 to calculate the respective PSP2 value for each training sample.
- FIG. 25 illustrates that a strong linear correlation exists between the NDR value and PSP2 for these polymers, irrespective of the catalyst system used to produce the polymer training samples. Further, these polymers spanned a large composite density range and are used in a wide variety of end-use applications.
- the NDR value of a polymer test sample produced using similar or different catalyst systems could be determined by applying the correlation in FIG. 25 to the PSP2 value of the test sample.
- Example 1 uses the same bimodal polyethylene polymers discussed in Example 1.
- Table V lists a specific molecular weight, the weight fraction at that molecular weight, the composite density and the measured PENT (hours) at 2.4 MPa for six (6) bimodal polyethylene polymers.
- 2L c +L a values were determined and weighted tie molecule probabilities were calculated for each of these six training samples.
- the Log PENT value was plotted against the weighted tie molecule probabilities, as shown in FIG. 26 .
- FIG. 26 illustrates that a strong linear correlation exists between the Log PENT value and the weighted tie molecule probability.
- the PENT value of a test sample from the same bimodal polymer family could be determined by applying the correlation in FIG. 26 to a single weighted tie molecule probability of the test sample.
Landscapes
- Chemical & Material Sciences (AREA)
- Health & Medical Sciences (AREA)
- Physics & Mathematics (AREA)
- Medicinal Chemistry (AREA)
- Life Sciences & Earth Sciences (AREA)
- Pathology (AREA)
- Spectroscopy & Molecular Physics (AREA)
- General Health & Medical Sciences (AREA)
- General Physics & Mathematics (AREA)
- Immunology (AREA)
- Analytical Chemistry (AREA)
- Chemical Kinetics & Catalysis (AREA)
- Biochemistry (AREA)
- Polymers & Plastics (AREA)
- Organic Chemistry (AREA)
- Engineering & Computer Science (AREA)
- Food Science & Technology (AREA)
- Addition Polymer Or Copolymer, Post-Treatments, Or Chemical Modifications (AREA)
- Compositions Of Macromolecular Compounds (AREA)
- Investigating Strength Of Materials By Application Of Mechanical Stress (AREA)
- Manufacture Of Macromolecular Shaped Articles (AREA)
Priority Applications (13)
| Application Number | Priority Date | Filing Date | Title |
|---|---|---|---|
| US11/476,339 US7803629B2 (en) | 2006-06-27 | 2006-06-27 | Method for employing SEC-FTIR data to predict mechanical properties of polyethylene |
| ES07812367.6T ES2536766T3 (es) | 2006-06-27 | 2007-06-27 | Un método de empleo de datos SEC-FTIR para predecir las propiedades mecánicas del polietileno |
| ES12156922.2T ES2661580T3 (es) | 2006-06-27 | 2007-06-27 | Método para emplear datos de SEC-FTIR para predecir propiedades mecánicas del polietileno |
| CN2007800319104A CN101512335B (zh) | 2006-06-27 | 2007-06-27 | 使用sec-ftir数据预测聚乙烯机械性能的方法 |
| MX2009000176A MX2009000176A (es) | 2006-06-27 | 2007-06-27 | Metodos para emplear datos sec-ftir para predecir propiedades mecanicas del polietileno. |
| AU2007265111A AU2007265111A1 (en) | 2006-06-27 | 2007-06-27 | Method for employing SEC-FTIR data to predict mechanical properties of polyethylene |
| BRPI0712982-3A BRPI0712982A2 (pt) | 2006-06-27 | 2007-06-27 | método para empregar dados de sec-ftir para prognosticar propriedades mecánicas do polietileno |
| EP12156922.2A EP2469277B1 (en) | 2006-06-27 | 2007-06-27 | Methods for employing sec-ftir data to predict properties of polymers |
| CA002655850A CA2655850A1 (en) | 2006-06-27 | 2007-06-27 | Method for employing sec-ftir data to predict mechanical properties of polyethylene |
| EP20070812367 EP2038649B1 (en) | 2006-06-27 | 2007-06-27 | Method for employing sec-ftir data to predict mechanical properties of polyethylene |
| RU2009102541/15A RU2009102541A (ru) | 2006-06-27 | 2007-06-27 | Способ использования данных эх-фурье-икс для предсказания механических свойств полиэтилена |
| PCT/US2007/072219 WO2008002969A2 (en) | 2006-06-27 | 2007-06-27 | Method for employing sec-ftir data to predict mechanical properties of polyethylene |
| US12/868,552 US8048679B2 (en) | 2006-06-27 | 2010-08-25 | Method for employing SEC-FTIR data to predict mechanical properties of polyethylene |
Applications Claiming Priority (1)
| Application Number | Priority Date | Filing Date | Title |
|---|---|---|---|
| US11/476,339 US7803629B2 (en) | 2006-06-27 | 2006-06-27 | Method for employing SEC-FTIR data to predict mechanical properties of polyethylene |
Related Child Applications (1)
| Application Number | Title | Priority Date | Filing Date |
|---|---|---|---|
| US12/868,552 Division US8048679B2 (en) | 2006-06-27 | 2010-08-25 | Method for employing SEC-FTIR data to predict mechanical properties of polyethylene |
Publications (2)
| Publication Number | Publication Date |
|---|---|
| US20070298508A1 US20070298508A1 (en) | 2007-12-27 |
| US7803629B2 true US7803629B2 (en) | 2010-09-28 |
Family
ID=38819964
Family Applications (2)
| Application Number | Title | Priority Date | Filing Date |
|---|---|---|---|
| US11/476,339 Expired - Fee Related US7803629B2 (en) | 2006-06-27 | 2006-06-27 | Method for employing SEC-FTIR data to predict mechanical properties of polyethylene |
| US12/868,552 Expired - Fee Related US8048679B2 (en) | 2006-06-27 | 2010-08-25 | Method for employing SEC-FTIR data to predict mechanical properties of polyethylene |
Family Applications After (1)
| Application Number | Title | Priority Date | Filing Date |
|---|---|---|---|
| US12/868,552 Expired - Fee Related US8048679B2 (en) | 2006-06-27 | 2010-08-25 | Method for employing SEC-FTIR data to predict mechanical properties of polyethylene |
Country Status (10)
| Country | Link |
|---|---|
| US (2) | US7803629B2 (zh) |
| EP (2) | EP2038649B1 (zh) |
| CN (1) | CN101512335B (zh) |
| AU (1) | AU2007265111A1 (zh) |
| BR (1) | BRPI0712982A2 (zh) |
| CA (1) | CA2655850A1 (zh) |
| ES (2) | ES2536766T3 (zh) |
| MX (1) | MX2009000176A (zh) |
| RU (1) | RU2009102541A (zh) |
| WO (1) | WO2008002969A2 (zh) |
Cited By (7)
| Publication number | Priority date | Publication date | Assignee | Title |
|---|---|---|---|---|
| US8815357B1 (en) * | 2013-02-27 | 2014-08-26 | Chevron Phillips Chemical Company Lp | Polymer resins with improved processability and melt fracture characteristics |
| US8932975B2 (en) | 2010-09-07 | 2015-01-13 | Chevron Phillips Chemical Company Lp | Catalyst systems and methods of making and using same |
| WO2017098359A1 (en) | 2015-12-08 | 2017-06-15 | Nova Chemicals (International) S.A. | High density rotomolding resin |
| EP3041873B1 (en) | 2013-09-05 | 2018-11-07 | Chevron Phillips Chemical Company LP | Higher density polyolefins with improved stress crack resistance |
| WO2020176989A1 (en) * | 2019-03-05 | 2020-09-10 | Arc Medical Devices Inc. | Method for predicting a molecular weight distribution of a biopolymer blend |
| WO2021084416A1 (en) | 2019-11-01 | 2021-05-06 | Nova Chemicals (International) S.A. | Linear high-density polyethylene with high toughness and high escr |
| WO2021250520A1 (en) | 2020-06-11 | 2021-12-16 | Nova Chemicals (International) S.A. | Linear high-density ethylene interpolymer compositions |
Families Citing this family (21)
| Publication number | Priority date | Publication date | Assignee | Title |
|---|---|---|---|---|
| CA2588352A1 (en) * | 2007-05-11 | 2008-11-11 | Nova Chemicals Corporation | Method to estimate pent values |
| US20110035193A1 (en) | 2009-08-07 | 2011-02-10 | Chevron Phillips Chemical Company Lp | System and method for estimating density of a polymer |
| US8492498B2 (en) * | 2011-02-21 | 2013-07-23 | Chevron Phillips Chemical Company Lp | Polymer compositions for rotational molding applications |
| US20130319131A1 (en) | 2012-05-31 | 2013-12-05 | Chevron Phillips Chemical Company Lp | Controlling Melt Fracture in Bimodal Resin Pipe |
| US8937139B2 (en) | 2012-10-25 | 2015-01-20 | Chevron Phillips Chemical Company Lp | Catalyst compositions and methods of making and using same |
| US8895679B2 (en) | 2012-10-25 | 2014-11-25 | Chevron Phillips Chemical Company Lp | Catalyst compositions and methods of making and using same |
| US8877672B2 (en) | 2013-01-29 | 2014-11-04 | Chevron Phillips Chemical Company Lp | Catalyst compositions and methods of making and using same |
| US9034991B2 (en) | 2013-01-29 | 2015-05-19 | Chevron Phillips Chemical Company Lp | Polymer compositions and methods of making and using same |
| DE202013007588U1 (de) | 2013-08-24 | 2013-09-27 | Cetecom Gmbh | Vorrichtung zur Ortung einer elektromagnetischen Störstrahlung |
| CA2834068C (en) | 2013-11-18 | 2020-07-28 | Nova Chemicals Corporation | Enhanced escr bimodal rotomolding resin |
| US9828451B2 (en) | 2014-10-24 | 2017-11-28 | Chevron Phillips Chemical Company Lp | Polymers with improved processability for pipe applications |
| CN106645662B (zh) * | 2015-10-28 | 2019-04-19 | 中国石油化工股份有限公司 | 一种评价聚乙烯树脂的耐环境应力性能的体系及其应用 |
| KR102095523B1 (ko) * | 2016-11-24 | 2020-03-31 | 주식회사 엘지화학 | 고분자의 물성을 예측하는 방법 |
| KR102068795B1 (ko) * | 2016-11-24 | 2020-01-21 | 주식회사 엘지화학 | 고분자의 물성을 예측하는 방법 |
| KR102097132B1 (ko) * | 2016-11-24 | 2020-04-03 | 주식회사 엘지화학 | 폴리에틸렌 수지의 물성 평가 방법 |
| US11098139B2 (en) | 2018-02-28 | 2021-08-24 | Chevron Phillips Chemical Company Lp | Advanced quality control tools for manufacturing bimodal and multimodal polyethylene resins |
| US11642368B2 (en) | 2018-07-27 | 2023-05-09 | ARC Medical Inc. | Highly purified and/or modified fucan compositions for the treatment of fibrous adhesions |
| US11453733B2 (en) | 2019-04-17 | 2022-09-27 | Chevron Phillips Chemical Company Lp | Polyolefin process monitoring and control |
| US11674023B2 (en) * | 2020-10-15 | 2023-06-13 | Chevron Phillips Chemical Company Lp | Polymer composition and methods of making and using same |
| US11802865B2 (en) | 2021-12-27 | 2023-10-31 | Chevron Phillips Chemical Company Lp | Utilizing aTREF data with chemometric analysis for determining the types of polyethylene present in polymer blends and multilayer films |
| EP4332150A1 (en) * | 2022-09-05 | 2024-03-06 | Borealis AG | Method of blending polyethylene based blends |
Citations (13)
| Publication number | Priority date | Publication date | Assignee | Title |
|---|---|---|---|---|
| US4460750A (en) | 1981-06-22 | 1984-07-17 | Bp Chimie S.A. | Process for the treatment of linear low density polyethylene by organic peroxides which generate free radicals |
| EP0341091A2 (en) | 1988-05-06 | 1989-11-08 | The Dow Chemical Company | Linear low density polyethylene of ultra low density |
| US5039614A (en) | 1988-06-16 | 1991-08-13 | Armenag Dekmezian | Method and apparatus for collecting samples for analysis of chemical composition |
| US5071913A (en) | 1987-12-11 | 1991-12-10 | Exxon Chemical Patents Inc. | Rubbery isoolefin polymers exhibiting improved processability |
| US5151474A (en) | 1990-02-16 | 1992-09-29 | The Dow Chemical Company | Process control method for manufacturing polyolefin |
| WO1996035750A1 (en) | 1995-05-09 | 1996-11-14 | The Dow Chemical Company | Medium modulus molded material comprising substantially linear polyethylene and fabrication method |
| US5675253A (en) | 1991-11-20 | 1997-10-07 | Auburn International, Inc. | Partial least square regression techniques in obtaining measurements of one or more polymer properties with an on-line nmr system |
| US5700895A (en) | 1993-08-23 | 1997-12-23 | Sumitomo Chemical Company, Limited | Ethylene-α-olefin copolymer and molded article thereof |
| WO1998059000A1 (en) | 1997-06-20 | 1998-12-30 | The Dow Chemical Company | Ethylene polymer compositions and article fabricated from the same |
| US6072576A (en) | 1996-12-31 | 2000-06-06 | Exxon Chemical Patents Inc. | On-line control of a chemical process plant |
| US20010039320A1 (en) | 1994-11-17 | 2001-11-08 | Grant B. Jacobsen | Ethylene copolymer compositions |
| US6632680B1 (en) | 2000-09-22 | 2003-10-14 | Deslauriers Paul J. | Measurement of short chain branching in olefin copolymers using chemometric analysis |
| US20050244974A1 (en) | 2004-04-13 | 2005-11-03 | Garcia-Franco Cesar A | High throughput property testing of olefin copolymers using rheological determinations |
Family Cites Families (2)
| Publication number | Priority date | Publication date | Assignee | Title |
|---|---|---|---|---|
| US515474A (en) * | 1894-02-27 | Pump foe inflating pneumatic tiees | ||
| WO2001098700A1 (fr) * | 2000-06-22 | 2001-12-27 | Idemitsu Petrochemical Co., Ltd. | Tuyau realise en polymere ethylenique |
-
2006
- 2006-06-27 US US11/476,339 patent/US7803629B2/en not_active Expired - Fee Related
-
2007
- 2007-06-27 BR BRPI0712982-3A patent/BRPI0712982A2/pt not_active IP Right Cessation
- 2007-06-27 CA CA002655850A patent/CA2655850A1/en not_active Abandoned
- 2007-06-27 ES ES07812367.6T patent/ES2536766T3/es active Active
- 2007-06-27 ES ES12156922.2T patent/ES2661580T3/es active Active
- 2007-06-27 RU RU2009102541/15A patent/RU2009102541A/ru not_active Application Discontinuation
- 2007-06-27 MX MX2009000176A patent/MX2009000176A/es not_active Application Discontinuation
- 2007-06-27 AU AU2007265111A patent/AU2007265111A1/en not_active Abandoned
- 2007-06-27 CN CN2007800319104A patent/CN101512335B/zh not_active Expired - Fee Related
- 2007-06-27 WO PCT/US2007/072219 patent/WO2008002969A2/en active Application Filing
- 2007-06-27 EP EP20070812367 patent/EP2038649B1/en not_active Not-in-force
- 2007-06-27 EP EP12156922.2A patent/EP2469277B1/en not_active Not-in-force
-
2010
- 2010-08-25 US US12/868,552 patent/US8048679B2/en not_active Expired - Fee Related
Patent Citations (14)
| Publication number | Priority date | Publication date | Assignee | Title |
|---|---|---|---|---|
| US4460750A (en) | 1981-06-22 | 1984-07-17 | Bp Chimie S.A. | Process for the treatment of linear low density polyethylene by organic peroxides which generate free radicals |
| US5071913A (en) | 1987-12-11 | 1991-12-10 | Exxon Chemical Patents Inc. | Rubbery isoolefin polymers exhibiting improved processability |
| EP0341091A2 (en) | 1988-05-06 | 1989-11-08 | The Dow Chemical Company | Linear low density polyethylene of ultra low density |
| US5039614A (en) | 1988-06-16 | 1991-08-13 | Armenag Dekmezian | Method and apparatus for collecting samples for analysis of chemical composition |
| US5151474A (en) | 1990-02-16 | 1992-09-29 | The Dow Chemical Company | Process control method for manufacturing polyolefin |
| US5675253A (en) | 1991-11-20 | 1997-10-07 | Auburn International, Inc. | Partial least square regression techniques in obtaining measurements of one or more polymer properties with an on-line nmr system |
| US5700895A (en) | 1993-08-23 | 1997-12-23 | Sumitomo Chemical Company, Limited | Ethylene-α-olefin copolymer and molded article thereof |
| US20010039320A1 (en) | 1994-11-17 | 2001-11-08 | Grant B. Jacobsen | Ethylene copolymer compositions |
| WO1996035750A1 (en) | 1995-05-09 | 1996-11-14 | The Dow Chemical Company | Medium modulus molded material comprising substantially linear polyethylene and fabrication method |
| US6072576A (en) | 1996-12-31 | 2000-06-06 | Exxon Chemical Patents Inc. | On-line control of a chemical process plant |
| WO1998059000A1 (en) | 1997-06-20 | 1998-12-30 | The Dow Chemical Company | Ethylene polymer compositions and article fabricated from the same |
| US6632680B1 (en) | 2000-09-22 | 2003-10-14 | Deslauriers Paul J. | Measurement of short chain branching in olefin copolymers using chemometric analysis |
| US7056744B2 (en) | 2000-09-22 | 2006-06-06 | Phillips Petroleum Company | Measurement of short chain branching in olefin copolymers using chemometric analysis |
| US20050244974A1 (en) | 2004-04-13 | 2005-11-03 | Garcia-Franco Cesar A | High throughput property testing of olefin copolymers using rheological determinations |
Non-Patent Citations (23)
| Title |
|---|
| Baum et al, "Tests on Fully Synthetic Hydrocarbon Waxes", Chem. Spec. Mfr Ass'n: Producers Mid-Year Meeting, vol. 57, pp. 160-164, 1971. |
| Blitz, et al, "The Characterization of Short Chain Branching in Polyethylene Using Fourier Transform Infrared Spectroscopy", J. Appl. Polym. Soc., vol. 51, pp. 13-20, 1994. |
| Deslaurier, et al, "Modeling Tie Molecules in Polyethylene". |
| Deslauriers, et al, "Quantifying the Effects of Polymer Microstructure on Slow Crack Growth Reisistance in Polyethylene", 2006 International Polyolefins Conference-Feb. 28-Mar. 1, 2006, Houston Texas. |
| Deslauriers, P.J. et al, "Quantifying Short Chain Branching Microstructures in Ethylene 1-Olefin Copolymers . . . " Polymer, vol. 43, pp. 159-170, 2002. |
| Hanson, Charles M., "On Predicting Environmental Stress Cracking in Polymers," Polymer Degradation and Stability, vol. 77, No. 1 (2002), pp. 43-53. |
| http://pep.sric.sri.com/Public/Reports/Phase95/RP019F/RP019F.html, "Process Economics Program Report 19". |
| http://wwwchem.scustan.edu/Tutorials/INFRARED.HTL, "Interpretation of Infrared Spectra". |
| Huang, Y.L. et al, "Dependence of Slow Crack Growth in Polyethylene on Butyl Branch Density: Morphology and Theory", Journal of Polymer Science, Part B: Polymer Physics, vol. 29, pp. 129-137, 1991. |
| Huang, Y.L. et al, "The Dependence of Butyl Branch Density on Slow Crack Growth in Polyethylene: Kinetics", Journal of Polymer Science, Part B: Polymer Physics, vol. 28, pp. 2007-2021, 1990. |
| Huang, Y.L. et al, "The Effect of Molecular Weight on Slow Crack Growth in Linear Polyehtylene Homopolymers", Journal of Materials Science, vol. 23, pp. 3648-3655, 1988. |
| Jordens, K. et al, "The Influence of Molecular Weight and Thermal History on the Thermal, Rheological . . . ", Polymer, vol. 41, pp. 7175-7192, 2000. |
| Mirabella, F.M. et al, "Determination of the Crystallinity of Polyethylene/a-Olefin Copolymerts by Thermal Analysis . . . ", Journal of Polymer Science, Part B: Polymer Physics, vol. 40, pp. 1637-1643, 2002. |
| Nielsen, Tenna B., et al., "Surface Wetting and the Prediction of Environmental Stress Cracking (ESC) in Polymers," Polymer Degradation and Stability, vol. 89, No. 3 (2005), pp. 513-516. |
| Parker, et al., "Vibrational Absorption Intensities in Chemical Analysis, 9. The Near-Infrared Spectra of Methyl Branched Alkanes", J. Phys. Chem. A, vol. 101:50, pp. 9618-9631, 1997. |
| Patel, R.M. et al, "Theoretical Prediction of Tie-Chain Concentration and Its Characterization Using Postyield Response", J. Appl. Poly. Sci., vol. 60, pp. 749-758, 1996. |
| PCT International Search Report, mailed Jan. 2, 2008, pp. 4. |
| Pedraza, J.J., "Probability of Formation of a Tie Molecule in Polydisperse Polyethylenes", Anales De Quimica, vol. 95, pp. 321-326, 1995. |
| Seguela, R., "Critical Review of the Molecular Topology of Semicrystalline Polymers . . . " Journal of Polymer Science, Part B: Polymer Physics, vol. 43, pp. 1729-1748, 2005. |
| Stark, "Near-Infrared Spectroscopy: The New FT Frontier-Spectroscopic and Chemometric Considerations", Proc. SPIE-Ing. Soc. Opt. Eng (1992, International Conference Fourier Transform Spectro. 8th (1991) pp. 70-86. |
| Tso, C.C. et al, "Comparison of Methods for Characterizing Comonomer Compositin in Ethylene 1-Olefin Copolymers: 3D-TREF vs. SEC-FTIR", Polymer, vol. 45, pp. 2657-2663, 2004. |
| Yeh, T et al, "Fatigue Crack Propagation in High-Density Polyethylene", Journal of Polymer Science, Part B: Polymer Physics, vol. 29, pp. 371-388, 1991. |
| Zhou, Z et al, "The Effect of Blending High-Density and Linear Low-Density Polyehtylenes on Slow Crack Growth", Polymer, vol. 34, pp. 2520-2523, 1993. |
Cited By (10)
| Publication number | Priority date | Publication date | Assignee | Title |
|---|---|---|---|---|
| US8932975B2 (en) | 2010-09-07 | 2015-01-13 | Chevron Phillips Chemical Company Lp | Catalyst systems and methods of making and using same |
| US8815357B1 (en) * | 2013-02-27 | 2014-08-26 | Chevron Phillips Chemical Company Lp | Polymer resins with improved processability and melt fracture characteristics |
| EP3041873B1 (en) | 2013-09-05 | 2018-11-07 | Chevron Phillips Chemical Company LP | Higher density polyolefins with improved stress crack resistance |
| WO2017098359A1 (en) | 2015-12-08 | 2017-06-15 | Nova Chemicals (International) S.A. | High density rotomolding resin |
| US9982077B2 (en) | 2015-12-08 | 2018-05-29 | Nova Chemicals (International) S.A. | High density rotomolding resin |
| US10189924B2 (en) | 2015-12-08 | 2019-01-29 | Nova Chemicals (International) S.A. | High density rotomolding resin |
| EP3489266A1 (en) | 2015-12-08 | 2019-05-29 | Nova Chemicals (International) S.A. | High density rotomolding resin |
| WO2020176989A1 (en) * | 2019-03-05 | 2020-09-10 | Arc Medical Devices Inc. | Method for predicting a molecular weight distribution of a biopolymer blend |
| WO2021084416A1 (en) | 2019-11-01 | 2021-05-06 | Nova Chemicals (International) S.A. | Linear high-density polyethylene with high toughness and high escr |
| WO2021250520A1 (en) | 2020-06-11 | 2021-12-16 | Nova Chemicals (International) S.A. | Linear high-density ethylene interpolymer compositions |
Also Published As
| Publication number | Publication date |
|---|---|
| EP2469277B1 (en) | 2017-12-27 |
| EP2038649B1 (en) | 2015-05-06 |
| US8048679B2 (en) | 2011-11-01 |
| AU2007265111A1 (en) | 2008-01-03 |
| CA2655850A1 (en) | 2008-01-03 |
| US20100319440A1 (en) | 2010-12-23 |
| CN101512335A (zh) | 2009-08-19 |
| WO2008002969A2 (en) | 2008-01-03 |
| ES2536766T3 (es) | 2015-05-28 |
| WO2008002969A3 (en) | 2008-02-21 |
| CN101512335B (zh) | 2013-07-24 |
| EP2469277A1 (en) | 2012-06-27 |
| MX2009000176A (es) | 2009-01-26 |
| EP2038649A2 (en) | 2009-03-25 |
| BRPI0712982A2 (pt) | 2012-04-10 |
| ES2661580T3 (es) | 2018-04-02 |
| RU2009102541A (ru) | 2010-08-10 |
| US20070298508A1 (en) | 2007-12-27 |
Similar Documents
| Publication | Publication Date | Title |
|---|---|---|
| US7803629B2 (en) | Method for employing SEC-FTIR data to predict mechanical properties of polyethylene | |
| US20110035193A1 (en) | System and method for estimating density of a polymer | |
| Liu et al. | The effect of the length of the short chain branch on the impact properties of linear low density polyethylene | |
| Nezbedová et al. | The applicability of the Pennsylvania Notch Test for a new generation of PE pipe grades | |
| Gong et al. | Degradation of sunlight exposure on the high-density polyethylene (HDPE) pipes for transportation of natural gases | |
| García et al. | Effects of the structural components on slow crack growth process in polyethylene blends. Composition intervals prediction for pipe applications | |
| DesLauriers et al. | Estimating slow crack growth performance of polyethylene resins from primary structures such as molecular weight and short chain branching | |
| Fodor et al. | Correlating polyethylene microstructure to stress cracking: Development of primary structure parameters | |
| Wild et al. | Structural evaluation of branched polyethylene by combined use of GPC and gradient‐elution fractionation | |
| Qin et al. | Environmental stress cracking of polyethylene pipe: Changes in physical structures leading to failure | |
| CN110907296A (zh) | 一种沥青混合料动态蠕变试验流动次数识别方法 | |
| CN108490009B (zh) | 双相不锈钢厚板焊接残余应力的中子衍射测试方法 | |
| Alvarez-Valencia et al. | Structural performance of wood plastic composite sheet piling | |
| Šmida et al. | Prediction of fracture toughness temperature dependence from tensile test parameters | |
| Giroud | Mathematical model of geomembrane stress-strain curves with a yield peak | |
| Jeremic et al. | Rapid characterization of high-impact ethylene–propylene copolymer composition by crystallization extraction separation: comparability to standard separation methods | |
| Sardashti et al. | Operational maps between molecular properties and environmental stress cracking resistance | |
| CN102954980B (zh) | 一种快速检测聚乙烯管材专用料等级的方法 | |
| Vincent | Ductile crack growth in poly (ethylene terephthalate) film | |
| US11360011B2 (en) | Processes for predicting small scale steady state (S4) critical temperatures | |
| Sardashti et al. | Operational maps between molecular properties and environmental stress cracking resistance (ESCR) | |
| Chau et al. | Successive self-nucleation and annealing in the solvated state of ethylene copolymers | |
| Cossar et al. | Determination of the percentage of homopolymer component in Ziegler/Natta catalyst linear low-density polyethylene resins using high-temperature cell Fourier transform infrared and partial least squares quantitative analysis technique | |
| Bicego et al. | A predictive approach to cleavage fracture events in the transition region | |
| ES2575653T3 (es) | Sistema y métodos para determinar una densidad virtual de un polímero |
Legal Events
| Date | Code | Title | Description |
|---|---|---|---|
| AS | Assignment |
Owner name: CHEVRON PHILLIPS CHEMICAL COMPANY, L.P., TEXAS Free format text: ASSIGNMENT OF ASSIGNORS INTEREST;ASSIGNORS:DESLAURIERS, PAUL J.;ROHLFING, DAVID C.;REEL/FRAME:018060/0420;SIGNING DATES FROM 20060721 TO 20060724 Owner name: CHEVRON PHILLIPS CHEMICAL COMPANY, L.P., TEXAS Free format text: ASSIGNMENT OF ASSIGNORS INTEREST;ASSIGNORS:DESLAURIERS, PAUL J.;ROHLFING, DAVID C.;SIGNING DATES FROM 20060721 TO 20060724;REEL/FRAME:018060/0420 |
|
| FEPP | Fee payment procedure |
Free format text: PAYOR NUMBER ASSIGNED (ORIGINAL EVENT CODE: ASPN); ENTITY STATUS OF PATENT OWNER: LARGE ENTITY Free format text: PAYER NUMBER DE-ASSIGNED (ORIGINAL EVENT CODE: RMPN); ENTITY STATUS OF PATENT OWNER: LARGE ENTITY |
|
| STCF | Information on status: patent grant |
Free format text: PATENTED CASE |
|
| FPAY | Fee payment |
Year of fee payment: 4 |
|
| MAFP | Maintenance fee payment |
Free format text: PAYMENT OF MAINTENANCE FEE, 8TH YEAR, LARGE ENTITY (ORIGINAL EVENT CODE: M1552) Year of fee payment: 8 |
|
| FEPP | Fee payment procedure |
Free format text: MAINTENANCE FEE REMINDER MAILED (ORIGINAL EVENT CODE: REM.); ENTITY STATUS OF PATENT OWNER: LARGE ENTITY |
|
| LAPS | Lapse for failure to pay maintenance fees |
Free format text: PATENT EXPIRED FOR FAILURE TO PAY MAINTENANCE FEES (ORIGINAL EVENT CODE: EXP.); ENTITY STATUS OF PATENT OWNER: LARGE ENTITY |
|
| STCH | Information on status: patent discontinuation |
Free format text: PATENT EXPIRED DUE TO NONPAYMENT OF MAINTENANCE FEES UNDER 37 CFR 1.362 |
|
| FP | Lapsed due to failure to pay maintenance fee |
Effective date: 20220928 |