US10425790B2 - Sensor device, sensor network system, and data compressing method - Google Patents
Sensor device, sensor network system, and data compressing method Download PDFInfo
- Publication number
- US10425790B2 US10425790B2 US15/395,066 US201615395066A US10425790B2 US 10425790 B2 US10425790 B2 US 10425790B2 US 201615395066 A US201615395066 A US 201615395066A US 10425790 B2 US10425790 B2 US 10425790B2
- Authority
- US
- United States
- Prior art keywords
- time
- series data
- significant
- significant sections
- sections
- Prior art date
- Legal status (The legal status is an assumption and is not a legal conclusion. Google has not performed a legal analysis and makes no representation as to the accuracy of the status listed.)
- Expired - Fee Related, expires
Links
- 238000000034 method Methods 0.000 title claims description 21
- 238000012545 processing Methods 0.000 claims abstract description 76
- 238000004891 communication Methods 0.000 claims abstract description 68
- 238000001914 filtration Methods 0.000 claims abstract description 10
- 238000001228 spectrum Methods 0.000 claims description 23
- 238000010586 diagram Methods 0.000 description 36
- 230000008961 swelling Effects 0.000 description 18
- 238000012544 monitoring process Methods 0.000 description 9
- 230000004048 modification Effects 0.000 description 7
- 238000012986 modification Methods 0.000 description 7
- 230000005540 biological transmission Effects 0.000 description 6
- 238000013144 data compression Methods 0.000 description 5
- 230000006870 function Effects 0.000 description 5
- 238000007781 pre-processing Methods 0.000 description 5
- 238000005070 sampling Methods 0.000 description 4
- 230000002159 abnormal effect Effects 0.000 description 3
- 230000008859 change Effects 0.000 description 3
- 230000000694 effects Effects 0.000 description 3
- 239000000284 extract Substances 0.000 description 3
- 230000009466 transformation Effects 0.000 description 3
- 230000005856 abnormality Effects 0.000 description 2
- 238000007906 compression Methods 0.000 description 2
- 230000006835 compression Effects 0.000 description 2
- 230000002093 peripheral effect Effects 0.000 description 2
- 230000008569 process Effects 0.000 description 2
- 230000009467 reduction Effects 0.000 description 2
- 230000004044 response Effects 0.000 description 2
- 230000001133 acceleration Effects 0.000 description 1
- 230000008901 benefit Effects 0.000 description 1
- 244000145845 chattering Species 0.000 description 1
- 239000002131 composite material Substances 0.000 description 1
- 230000005684 electric field Effects 0.000 description 1
- 238000005286 illumination Methods 0.000 description 1
- 230000035807 sensation Effects 0.000 description 1
- 230000035945 sensitivity Effects 0.000 description 1
- 238000006467 substitution reaction Methods 0.000 description 1
- 230000002123 temporal effect Effects 0.000 description 1
Images


Classifications
-
- H—ELECTRICITY
- H04—ELECTRIC COMMUNICATION TECHNIQUE
- H04W—WIRELESS COMMUNICATION NETWORKS
- H04W4/00—Services specially adapted for wireless communication networks; Facilities therefor
- H04W4/70—Services for machine-to-machine communication [M2M] or machine type communication [MTC]
-
- H—ELECTRICITY
- H04—ELECTRIC COMMUNICATION TECHNIQUE
- H04L—TRANSMISSION OF DIGITAL INFORMATION, e.g. TELEGRAPHIC COMMUNICATION
- H04L67/00—Network arrangements or protocols for supporting network services or applications
- H04L67/01—Protocols
- H04L67/12—Protocols specially adapted for proprietary or special-purpose networking environments, e.g. medical networks, sensor networks, networks in vehicles or remote metering networks
-
- H—ELECTRICITY
- H04—ELECTRIC COMMUNICATION TECHNIQUE
- H04W—WIRELESS COMMUNICATION NETWORKS
- H04W88/00—Devices specially adapted for wireless communication networks, e.g. terminals, base stations or access point devices
- H04W88/16—Gateway arrangements
Definitions
- the present disclosure relates to a sensor device and a sensor network system for collecting data detected by the sensor device. Further, the present disclosure relates to a data compressing method of compressing data detected by a sensor.
- a wireless sensor network (hereinafter, also referred to simply as a “sensor network”) is a communication network including a wireless terminal (which is referred to as a “sensor node”) having a plurality of sensors and is used to collect information from each sensor node.
- a communication scheme such as ZigBee®, EnOcean®, Wi-SUN®, or Bluetooth® low energy (BLE) is used.
- Data transmitted from each sensor node is relayed by a relay, and then transmitted to a higher calculator such as a server or the like.
- the higher calculator executes various processing based on data received from a plurality of sensor nodes.
- each sensor node can operate without requiring an external power source.
- each sensor node is configured to operate intermittently to consume less power.
- the intermittent operation refers to driving a peripheral device such as a sensor and a communication device only when a task is executed.
- a plurality or sensors are required to operate constantly.
- a problem of securing a communication power in use a problem of securing a radio band to transmit a huge amount of data, and the like may arise.
- a reduction in an amount of data to be transmitted is an essential task.
- a sensor network system which is also capable of securing a communication band of a wireless network, while having a plurality of sensor nodes for measuring data having a high sampling rate.
- a sensor node in the related art calculates a feature quantity from an observation value obtained during a predetermined observation period and determines whether the feature quantity thus calculated exceeds a predetermined threshold value.
- the sensor node transmits the observation value obtained during the predetermined observation period to a server only when the feature quantity exceeds the predetermined threshold value.
- the feature quantity refers to a quantity obtained by digitizing features of the observation value, and also to a quantity that may be used as a standard of judgment.
- Single data or a plurality of data having a data amount smaller than a plurality of observation values are calculated using the plurality of observation values and used as feature quantities in the related art.
- the sensor node includes a 3-axis accelerometer as a vibration sensor for analyzing stress of a structure, and a power value corresponding to a first natural frequency in a power spectrum is used as a feature quantity.
- a 2-square average value of acceleration of the original temporal signal i.e., of the entire frequency domain
- the method is not considered to be appropriate for a case where another feature is more important, for example, in a case where it is intended to focus on a change in the power value over time at a predetermined frequency (a high-order natural frequency or the like).
- a feature quantity it is difficult for a feature quantity to exceed a threshold value due to a short waveform or the like for an observation period, causing a difficulty in detecting a waveform. Since abnormal vibrations or the like have a pulse shape in many cases, a transmission period should be set shorter in order to detect such vibrations. However, there is a possibility of increasing communication frequency and generating communication interference with another sensor and this also makes it difficult to secure an intended radio band. Moreover, when the feature quantity frequently exceeds the threshold value, it is difficult to acquire the effect of reducing a communication amount. As another method to solve this problem, a sensor node that frequently performs a threshold value determination is considered.
- the present disclosure provides some embodiments of a data compressing method of compressing data by recognizing a section including a characteristic signal fluctuation based on data detected by a sensor, and a sensor device and a sensor network system capable of reducing a communication amount by transmitting the compressed data using the data compressing method.
- a sensor device including: a sensor element configured to detect a physical quantity in a time-series manner, a data processing part, and a communication part.
- the data processing part is configured to perform filtering on time-series data detected during a predetermined period by the sensor element to extract time-series data having a component of a predetermined frequency, and compare the extracted time-series data with a predetermined threshold value to determine one or a plurality of significant sections within the predetermined period.
- the extracted time-series data exceeds the threshold value in each of the significant sections.
- the communication part is configured to arrange and wirelessly transmit time-series data of each of the significant sections among the time-series data detected during the predetermined period by the sensor element.
- a sensor device including: a sensor element configured to detect a physical quantity in a time-series manner; a data processing part, and a communication part.
- the data processing part is configured to Fourier-transform time-series data detected during a predetermined period by the sensor element for each set time frame to extract a plurality of feature quantities representing features of an obtained spectrum. Further, the data processing part is configured to determine whether a relationship between the plurality of feature quantities satisfies a predetermined reference to determine one or a plurality of significant sections within the predetermined period. The relationship between the plurality of feature quantities satisfies the reference in each of one or plurality of time frames corresponding to each of the significant sections.
- the communication part is configured to arrange and wirelessly transmit time-series data of each of the significant sections among the time-series data detected during the predetermined period by the sensor element.
- the data processing part may be configured to extend a time width of each of the significant sections by advancing a start point of each of the significant sections and delaying an end point thereof.
- the communication part is configured to wirelessly transmit the time-series data of each of the significant sections using the entirety including a portion increased by extending the time width for each of the significant sections as one significant section.
- the data processing part is configured to arrange the plurality of adjacent significant sections and handle the same as one significant section.
- the communication part is configured to arrange and wirelessly transmit the time-series data of each of the significant sections together with information representing the time corresponding to each of the significant sections.
- a sensor network system including: a plurality of sensor devices as mentioned above; and a gateway device configured to wirelessly communicate with each of the sensor devices.
- a data compressing method including: performing filtering on time-series data detected by a sensor element during a predetermined period using a processor to extract time-series data having a component of a predetermined frequency; and comparing the extracted time-series data with a predetermined threshold value to determine one or a plurality of significant sections within the predetermined period using the processor.
- the extracted time-series data exceeds the threshold value in each of the significant sections.
- the data compressing method further includes extracting only time-series data of each of the significant sections among the time-series data detected by the sensor element during the predetermined period using the processor.
- FIG. 1 is a block diagram illustrating a schematic configuration of a wireless sensor network system.
- FIG. 2 is a block diagram illustrating an example of a hardware configuration of a sensor device of FIG. 1 .
- FIG. 3 is a flowchart illustrating a procedure of data processing by the sensor device of FIG. 2 .
- FIGS. 4A to 4D are diagrams illustrating a specific example of the data processing of FIG. 3 .
- FIGS. 5A to 5E are diagrams illustrating a modification of the data processing illustrated in FIGS. 4A to 4D .
- FIGS. 6A to 6E are diagrams illustrating a modification of the data processing illustrated in FIG. 5A to 5E .
- FIGS. 7A to 7E are diagrams illustrating another specific example of the data processing of FIG. 3 .
- FIGS. 8A to 8E are diagrams illustrating a modification of the data processing illustrated in FIGS. 7A to 7E .
- FIG. 9 is a flowchart illustrating a procedure of data processing by each sensor device in a sensor network of the embodiment of FIG. 2 .
- FIG. 10 is a diagram illustrating an example of a power spectrum.
- FIGS. 11A and 11B are diagrams illustrating a determination of a significant section in a second embodiment.
- FIG. 1 is a block diagram illustrating a schematic configuration of a wireless sensor network system.
- the wireless sensor network system (also referred to as a “sensor network system” herein) 1 includes a plurality of sensor devices 10 and a gateway device 20 .
- the sensor device 10 is also referred to as a sensor node
- the gateway device 20 is also referred to as a control node.
- Each of the sensor devices 10 includes a sensor element for detecting an ambient physical quantity or the like in a time-series manner.
- Each of the sensor devices 10 is configured as a wireless communication terminal for transmitting information based on time-series data detected by the sensor element.
- a communication scheme such as ZigBee®, EnOcean®, Wi-SUN®, or BLE (Bluetooth® Low Energy (BLE) is used for communication between each of the sensor devices 10 and the gateway device 20 .
- the sensor network system features that each of the sensor devices 10 determines a significant section on a time axis based on the time-series data and transmits only time-series data within the significant section, in order to reduce a communication amount. A specific method of determining a significant section will be described later.
- Each of the sensor devices 10 may have a relay routing function to transmit transmission data from another sensor device 10 to the gateway device 20 . Further, each of the sensor devices 10 may have an ad-hoc function to directly communicate with each other. In addition, the plurality of sensor devices 10 that constitute a sensor network may constitute a tree network or a mesh network.
- the gateway device 20 receives data transmitted from each of the plurality of sensor devices 10 and transmits the received data to a higher calculator (a personal computer, a server, a cloud, etc.) 41 via a network 40 such as the Internet. Further, the gateway device 20 receives a control command, setting information, and the like regarding each sensor device 10 from the higher calculator 41 via the network 40 .
- the gateway device 20 may also have a function of storing and/or calculating the received data, as well as simply relaying the data transmitted from each sensor device 10 .
- a wired local area network (LAN), Wi-Fi®, Bluetooth®, or the like is used for communication between the gateway device 20 and the higher network 40 .
- FIG. 2 is a block diagram illustrating an example of a hardware configuration of the sensor device of FIG. 1 .
- the sensor device 10 includes a sensor element 12 , a central processing unit (CPU) 14 , a memory 15 , a communication part 16 , and a power source 17 .
- a micro control unit (MCU) 13 may also be configured to include the CPU 14 , the memory 15 , and other peripheral devices (not shown).
- the sensor element 12 detects a physical quantity of a monitoring target in a time-series manner.
- the type of the sensor element 12 is not particularly limited, and the present disclosure is applicable to any sensor element as long as it detects some physical quantities.
- various sensors such as a magnetic sensor, an electric field sensor, a current sensor, a voltage sensor, a pressure sensor, a flow sensor, a temperature sensor, an illumination sensor, and a humidity sensor, in addition to an accelerometer, a gyro sensor, a sound sensor (microphone, etc.), may be used as the sensor element 12 .
- the present disclosure is appropriately applied to an application in which the sensor element should not be operated intermittently but constantly operated.
- FIG. 2 only one sensor element 12 is illustrated but a plurality of sensor elements may be installed in the sensor device 10 .
- time-series data A physical quantity detected in a time-series manner by the sensor element 12 (hereinafter, referred to as “time-series data”) is temporarily stored in the memory 15 .
- the output signal from the sensor element 12 is filtered, and converted into digital data by an analog-to-digital converter (A/D converter) (not shown), and then stored in the memory 15 .
- A/D converter analog-to-digital converter
- the CPU 14 serves as a data processing part for performing calculation processing using the time-series data detected by the sensor element 12 and stored in the memory 15 . Specifically, the CPU 14 performs filtering (low pass, band pass, high pass filtering or the like) on time-series data detected by the sensor element 12 to extract time-series data having a component of a predetermined frequency, and compare the extracted time-series data with a predetermined threshold value to determine a significant section of the time axis. Here, the extracted time-series data having the component of the predetermined frequency exceeds the threshold value in the determined significant section.
- filtering low pass, band pass, high pass filtering or the like
- the communication part 16 wirelessly transmits only data of the significant section, among the time-series data detected by the sensor element 12 , to the gateway device 20 .
- a communication scheme such as the aforementioned ZigBee® is used.
- the gateway device 20 transmits the data received from the sensor device 10 to the higher calculator 41 via the Internet 40 .
- the higher calculator 41 detects whether the monitoring target is abnormal based on the data received through the gateway device 20 .
- the power source 17 supplies a driving voltage to each of the elements 12 , 14 , 15 , and 16 that constitute the sensor device 10 .
- the sensor device 10 may be configured to operate only with the internal power source 17 , without receiving electric power from outside.
- the power source 17 is configured to include a solar battery and a storage battery. In this case, the storage battery is charged by electric power generated by the solar battery and each of the elements 12 , 14 , 15 , and 16 of the sensor device 10 is driven by an output voltage from the storage battery.
- each sensor device 10 determines a significant section of the time axis based on the detected time-series data, and wirelessly transmits only time-series data of the significant section.
- a data processing procedure of each sensor device 10 will be described and a specific example of the data processing will be then described.
- FIG. 3 is a flowchart illustrating a procedure of the data processing by the sensor device of FIG. 2 .
- a physical quantity of a monitoring target is detected by the sensor element 12 in a time-series manner (step S 100 ).
- An analog signal of the detected physical quantity is filtered by an analog filter (not shown) and subsequently sampled by an A/D converter (not shown) so as to be converted into digital data (step S 110 ).
- the CPU 14 temporarily stores the time-series data of the physical quantity in the memory 15 (step S 120 ).
- Steps S 100 , S 110 , and S 120 described above are repeatedly executed until obtaining of time-series data during a target period of threshold value determination (hereinafter, referred to as a “determination period”) is completed, namely until a predetermined determination period elapses after detecting of time-series data starts (till YES at step S 125 ).
- the CPU 14 performs the following data processing on the time-series data detected during the determination period.
- time-series data of a next determination period is detected by the sensor element 12 and stored in the memory 15 .
- the CPU 14 performs digital filtering on the time-series data within the determination period to extract time-series data having a component of a predetermined frequency (step S 130 ).
- the extracted component of the frequency differs in each feature of a monitoring target (for example, which component of the frequency is to be fluctuated in the event of abnormality).
- a finite impulse response (FIR) filter, an infinite impulse response (IIR) filter or the like, as well as a low pass filter (LPF), a band pass filter (BPF), or a high pass filter (HPF) are used as a digital filter according to the purpose of data processing.
- the CPU 14 determines one or a plurality of significant sections within the determination period by comparing the extracted time-series data having the component of the predetermined frequency with a predetermined threshold value (step S 140 ).
- the extracted time-series data having the component of the predetermined frequency continuously exceeds the threshold value in each significant section.
- the CPU 14 performs processing to extend a time width of each significant section forward and backward, in other words, processing to advance a start point of each significant section and delaying an end point thereof (hereinafter, referred to as “swelling processing”) (step S 150 ).
- swelling processing processing to advance a start point of each significant section and delaying an end point thereof
- the CPU 14 arranges and handles the plurality of adjacent significant sections as a single significant section.
- the CPU 14 extracts only data of each significant section from the time-series data detected during the determination period by the sensor element 12 (the time-series data of the significant section is cut out) (step S 160 ).
- the communication part 16 arranges and transmits only the extracted time-series data of each significant section to the gateway device 20 (step S 170 ).
- information indicating the time corresponding to each significant section for example, information such as a start time, an end time or the like of each significant section
- the aforementioned procedure is repeated in each sensor device 10 .
- the time-series data of each significant section extracted during a plurality of continuous determination periods may be arranged and transmitted to the gateway device 20 . This makes it possible to reduce the number of times of communication.
- the higher calculator 41 is configured to receive output data from each sensor device 10 by communicating with the plurality of sensor devices 10 via the gateway 20 .
- data time-series data of each significant section
- the higher calculator 41 stores the received data in the memory.
- the higher calculator 41 monitors a monitoring target based on the data received from each of the plurality of sensor devices 10 (for example, the higher calculator 41 determines whether the monitoring target is normal).
- FIGS. 4A to 4B are diagrams illustrating specific examples of the data processing of FIG. 3 .
- a case where a fluctuation in signal strength is temporally discrete (in a case where only a noise component is present in other periods of time) is illustrated.
- FIGS. 4A to 4B an example in which swelling processing (step S 150 of FIG. 3 ) is not performed is illustrated. It may be considered that a period of 100 [a.u.] illustrated in FIGS. 4A to 4B corresponds to the determination period mentioned above.
- FIG. 4A is a diagram illustrating a waveform of time-series data detected by the sensor element 12 .
- FIG. 4B is a waveform diagram illustrating a result of performing LPF processing on the time-series data illustrated in FIG. 4A .
- FIG. 4C is a diagram illustrating a waveform (hereinafter, also referred to as a “communication window waveform”) representing a significant section.
- the significant section is obtained by comparing the time-series data after performing the LPF processing illustrated in FIG. 4B with a threshold value.
- a section in which a value of the communication window waveform is “1” represents a significant section
- a section in which a value of the communication window waveform is “0” represents a non-significant section.
- FIG. 4D is a waveform diagram illustrating data reproduced by the higher calculator 41 .
- the time-series data is not output to the outside from the sensor device 10 .
- FIGS. 5A to 5E are diagrams illustrating a modification of the data processing illustrated in FIGS. 4A to 4D .
- FIGS. 5A to 5E an example in which the swelling processing is included in the data processing of FIGS. 4A to 4D .
- FIGS. 5A to 5C are similar to FIGS. 4A to 4C , and thus, descriptions thereof will be not repeated.
- FIG. 5D is a diagram illustrating an example in which swelling processing was performed on a communication window waveform illustrated in FIG. 5C by a predetermined extension width. It can be seen that, a section (significant section) in which a waveform value is “1” extends in the communication window waveform after the swelling processing illustrated in FIG. 5D , compared with the communication window waveform before the swelling processing illustrated in FIG. 5C .
- Data transmitted from the sensor device 10 to the higher calculator 41 is obtained by extracting data of only the significant section having the communication window waveform illustrated in FIG. 5D from the time-series data of FIG. 5A .
- FIG. 5E is a waveform diagram illustrating data reproduced by the higher calculator 41 .
- the generated data of FIG. 5E can be restored in the entire waveform by the swelling processing.
- a data compression rate of the original time-series data of FIG. 5A is 45%.
- FIGS. 6A to 6E are diagrams illustrating a modification of the data processing illustrated in FIGS. 5A to 5E .
- FIGS. 6A to 6E an example of performing BPF processing instead of the LPF processing is illustrated.
- FIG. 6A illustrates a waveform of time-series data detected by the sensor element 12 , which is similar to the case of FIG. 5A .
- FIG. 6B is a waveform diagram illustrating a result of performing the BPF processing on the time-series data of FIG. 6A .
- FIG. 6C is a diagram illustrating a waveform (a communication window waveform) representing a significant section.
- the significant section is obtained by comparing the time-series data after the BPF processing illustrated in FIG. 6B with a threshold value.
- a section in which a value of the communication window waveform is “1” represents a significant section
- a section in which a value of the communication window waveform is “0” represents a non-significant section.
- FIG. 6D is a diagram illustrating an example in which the swelling processing was performed on the communication window waveform illustrated in FIG. 6C by a predetermined extension width.
- the adjacent two communication windows are grouped into one communication window. In this manner, through the swelling processing, it is possible to prevent the number of significant sections from being inadvertently increased and to suppress a reduction in compression rate due to an increase in time information added to each extracted significant section.
- Data transmitted from the sensor device 10 to the higher calculator 41 is obtained by extracting data of only the significant section having the communication window waveform illustrated in FIG. 6D from the time-series data of FIG. 6A .
- FIG. 6E is a waveform diagram illustrating data reproduced by the higher calculator 41 .
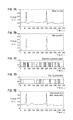
- FIGS. 7A to 7E are diagrams illustrating another specific example of the data processing of FIG. 3 . It may be considered that a period of 500 [a.u.] illustrated in FIGS. 7A to 7E corresponds to the determination period mentioned above.
- FIG. 7A an example of time-series data in a case where signal strength is continuously fluctuated is illustrated. Specifically, in this example, a waveform diagram of heartbeat is illustrated.
- a waveform of heartbeat is a continuously fluctuated waveform including various elements such as a P wave, a Q wave, an R wave, an S wave, a T wave, and a U wave.
- FIG. 7B is a waveform diagram illustrating a result of performing HPF processing on the time-series data of FIG. 7A .
- FIG. 7C is a diagram illustrating a waveform (a communication window waveform) representing a significant section.
- the significant section is obtained by comparing the time-series data after the HPF processing illustrated in FIG. 7B with a threshold value.
- a section in which a value of the communication window waveform is “1” represents a significant section
- a section in which a value of the communication window waveform is “0” represents a non-significant section.
- FIG. 7D is a diagram illustrating an example in which the swelling processing was performed on the communication window waveform illustrated in FIG. 7C by a predetermined extension width.
- FIG. 7D in a case where a plurality of communication windows after the swelling processing overlap, a plurality of adjacent communication windows are grouped into one communication window.
- Data transmitted from the sensor device 10 to the higher calculator 41 is obtained by extracting data of only the significant section having the communication window waveform illustrated in FIG. 7D from the time-series data of FIG. 7A . Data of a non-significant section is not output to the outside from the sensor device 10 .
- FIG. 7E is a waveform diagram illustrating data reproduced by the higher calculator 41 .
- a final data value of an immediately previous significant section is maintained as it is, but interpolation may be performed by linear interpolation or the like.
- the dotted line represents a waveform of the original time-series data of FIG. 7A .
- a data compression rate of the original time-series data illustrated in FIG. 7A is 74%.
- FIGS. 8A to 8E are diagrams illustrating a modification of the data processing illustrated in FIGS. 7A to 7E .
- a threshold value when a significant section is determined is greater than that of the case of FIGS. 7A to 7E .
- FIGS. 8A and 8B are similar to FIGS. 7A and 7B , and thus, descriptions thereof will be not repeated.
- FIG. 8C is a diagram illustrating a waveform (communication window waveform) representing a significant section. Since a threshold value greater than that of FIG. 7C is used, a total number of significant sections and a time width of each significant section are smaller than those of the case of FIG. 7C .
- FIG. 8D is a diagram illustrating an example in which the swelling processing was performed on the communication window waveform illustrated in FIG. 8C by a predetermined extension width.
- FIG. 8D in a case where a plurality of communication windows after the swelling processing overlap, a plurality of adjacent communication windows are grouped into one communication window.
- Data transmitted from the sensor device 10 to the higher calculator 41 is obtained by extracting data of only the significant section having the communication window waveform illustrated in FIG. 8D from the time-series data of FIG. 8A . Data of a non-significant section is not output to the outside from the sensor device 10 .
- FIG. 8E is a waveform diagram illustrating data reproduced by the higher calculator 41 .
- a final data value of an immediately previous significant section is maintained as it is, but interpolation may be performed by linear interpolation or the like.
- the dotted line represents a waveform of the original time-series data of FIG. 8A .
- a data compression rate of the original time-series data illustrated in FIG. 8A is 52%. The data compression rate is smaller (a compression degree is greater) than that of the case of FIG. 7E , and a reproduction situation is degraded, as compared with FIG. 7E , but the sketch of the original time-series data can be reproduced.
- a method of determining a significant section is different from that of the case of the first embodiment.
- a configuration of a sensor network and a hardware configuration of a sensor device are substantially the same as those of the case of the first embodiment, and thus, a description thereof will be not repeated.
- swelling processing may be performed on each determined significant section.
- FIG. 9 is a flowchart illustrating a data processing procedure by each sensor device in a sensor network of the second embodiment.
- the processes at steps S 200 , S 210 , S 220 , S 225 , S 250 , S 260 , and S 270 in FIG. 9 are substantially the same as that the process in the steps S 100 , S 110 , S 120 , S 125 , S 150 , S 160 and S 170 in FIG. 3 , and thus, a description thereof will be not repeated.
- the processing at steps S 230 , S 235 , and S 240 of FIG. 9 corresponds to the filtering at step S 130 of FIG. 3 .
- the original time-series data is Fourier-transformed and a plurality of feature quantities representing features of an obtained spectrum are extracted.
- the processing of step S 245 of FIG. 9 corresponds to that of step S 140 of FIG. 3 , and one or a plurality of significant sections are determined within a determination period by determining whether the relationship between the plurality of feature quantities satisfies a predetermined reference.
- the processing at each of the steps will be described in detail with reference to FIGS. 2 and 9 .
- the CPU 14 performs pre-processing on time-series data detected by the sensor element 12 within a determination period (step S 230 ), and subsequently performs Fourier transformation thereon (step 235 ).
- Fourier transformation fast Fourier transformation (FFT) is used.
- the pre-processing includes window processing.
- the window processing is processing of multiplying the time-series data by a window function in order to cut out N number of time-series data to be subjected to FFT.
- the window function for example, a rectangular window, a hanning window, a hamming window, a Blackman window, or the like is used.
- a target section of FFT cut out by the window processing is generally referred to as a “frame”.
- low pass or band pass by a digital filter and frequency domain emphasis using a pre-emphasis filter may also be performed.
- the CPU 14 sequentially cut out the time-series data within the determination period while shifting a position of a frame little by little, and performs FFT thereon. For example, when a sampling period of the time-series data is Ts[sec.], the CPU 14 performs FFT on N number of time-series data obtained up to a current time at every m ⁇ Ts (where m is an integer satisfying 1 ⁇ m ⁇ N).
- a Fourier spectrum as a result of FFT includes an amplitude spectrum and a phase spectrum. A power spectrum may be counted.
- the CPU 14 obtains a plurality of feature quantities representing features of the spectrum obtained by FFT for each frame (step S 240 ).
- a specific example of the feature quantity will be described.
- FIG. 10 is a view illustrating an example of a power spectrum.
- an amplitude spectrum may also be used instead of the power spectrum.
- a feature of a shape of such a spectrum may be used as a feature quantity.
- a frequency space may be divided at equal intervals or a logarithmic space of a frequency may be divided at equal intervals to generate a plurality of frequency sections, and a statistic amount of each of the generated frequency sections may be used as a feature quantity.
- the frequency space is divided into a plurality of sections FS 1 to FS 5 at equal intervals, and a maximum value Max, a minimum value Min, and a median value Median are extracted as feature quantities of each of the frequency sections. An average may be used instead of the median value.
- an arithmetic average is used as an average value, but in a case where the logarithm is appropriate for expressing an amplitude of a signal, a geometric mean may also be used as the average.
- a frequency sequence corresponding to the maximum value, the minimum value, and the median value of each frequency section may also be used as a feature quantity, and the maximum value, the minimum value, the median value and the frequency corresponding to each of the values may also be used as a feature quantity.
- a calculation value of a multi-band pass filter obtained by dividing a frequency space at equal intervals may also be used as a calculation that can obtain the same result.
- a coefficient sequence based on 1/n octave analysis multi-band pass at equal intervals in a logarithmic space obtained by equally dividing a frequency space may be used.
- MFCC Mel-frequency cepstrum coefficients
- the Mel-filter bank is an array of band pass filters and includes about 20 divided filters on a frequency axis. Frequency widths of the filters are different, and dense like low frequency (narrow in frequency width) or coarse like high frequency (wide in frequency width) according to a psychological scale of auditory property. Spectrum data compressed by multiplication of the Mel-filter bank is logarithmically processed and subsequently discrete-cosine-transformed. A low-order component of cepstrum obtained through the discrete cosine transform is an MFCC.
- a magnitude relationship between each peak value or the coefficient a k and a predetermined threshold value, a magnitude relationship between a standardized peak value or a coefficient (a k /a i , k ⁇ i) and the predetermined threshold value, or their composite condition is used.
- FIGS. 11A and B are diagrams illustrating determination of a significant section in the second embodiment.
- a determination condition of a significant section is that a ratio of a major amplitude a 0 to an amplitude a 2 at a frequency f 2 (the relationship between the frequency f 2 and a frequency f 0 is already known) at which a characteristic peak may be generated is a predetermined threshold value or more.
- a corresponding time frame is determined to be included in a significant section.
- FIG. 11A illustrates a normal waveform of a spectrum when it is determined that the time frame is not included in the significant section
- FIG. 11A illustrates a normal waveform of a spectrum when it is determined that the time frame is not included in the significant section
- FIG. 11B illustrates a waveform of a spectrum when it is determined that the time frame is included in a significant section.
- the magnitude of the amplitude a 2 at a frequency f 2 is increased, as compared with the case of FIG. 11A .
- a significant section is determined based on a relationship between a plurality of feature quantities in the Fourier spectrum of the time-series data detected by the sensor element, for example, it is possible to accurately extract only time-series data of a period required to determine whether a monitoring target is abnormal.
- it is possible to extract an event difficult to apply a simple determination of a threshold value of time-series data (mainly based on the presence and absence of a signal), and for example, it is possible to detect only a change in a vibration situation with high sensitivity, in a vibration target difficult to discriminate through only monitoring of time-series waveform with constant vibrations.
Landscapes
- Engineering & Computer Science (AREA)
- Computer Networks & Wireless Communication (AREA)
- Signal Processing (AREA)
- Health & Medical Sciences (AREA)
- Computing Systems (AREA)
- General Health & Medical Sciences (AREA)
- Medical Informatics (AREA)
- Arrangements For Transmission Of Measured Signals (AREA)
- Measurement Of Mechanical Vibrations Or Ultrasonic Waves (AREA)
Applications Claiming Priority (2)
| Application Number | Priority Date | Filing Date | Title |
|---|---|---|---|
| JP2016-000541 | 2016-01-05 | ||
| JP2016000541A JP6718681B2 (ja) | 2016-01-05 | 2016-01-05 | センサ装置、センサネットワークシステム、およびデータ圧縮方法 |
Publications (2)
| Publication Number | Publication Date |
|---|---|
| US20170195823A1 US20170195823A1 (en) | 2017-07-06 |
| US10425790B2 true US10425790B2 (en) | 2019-09-24 |
Family
ID=59227089
Family Applications (1)
| Application Number | Title | Priority Date | Filing Date |
|---|---|---|---|
| US15/395,066 Expired - Fee Related US10425790B2 (en) | 2016-01-05 | 2016-12-30 | Sensor device, sensor network system, and data compressing method |
Country Status (2)
| Country | Link |
|---|---|
| US (1) | US10425790B2 (ja) |
| JP (1) | JP6718681B2 (ja) |
Cited By (1)
| Publication number | Priority date | Publication date | Assignee | Title |
|---|---|---|---|---|
| US11178026B2 (en) * | 2017-03-24 | 2021-11-16 | Mitsubishi Heavy Industries, Ltd. | Monitoring system, processing device, and monitoring device |
Families Citing this family (14)
| Publication number | Priority date | Publication date | Assignee | Title |
|---|---|---|---|---|
| JP6522454B2 (ja) * | 2015-07-28 | 2019-05-29 | ローム株式会社 | センサ情報無線送信装置 |
| CN108184216A (zh) * | 2017-12-11 | 2018-06-19 | 李长云 | 一种自主传感器及数据自主传输方法 |
| WO2019131486A1 (ja) * | 2017-12-25 | 2019-07-04 | ローム株式会社 | 信号処理装置、ワイヤレスセンサネットワークシステム、および信号処理方法 |
| JP6840096B2 (ja) * | 2018-01-30 | 2021-03-10 | 公益財団法人鉄道総合技術研究所 | 固有振動数特定装置及び固有振動数特定方法 |
| JP7017488B2 (ja) | 2018-09-14 | 2022-02-08 | 株式会社日立製作所 | 音点検システムおよび音点検方法 |
| JP7157643B2 (ja) * | 2018-12-06 | 2022-10-20 | 株式会社日立製作所 | データ抽出方法およびデータ分析システム |
| WO2020180424A1 (en) | 2019-03-04 | 2020-09-10 | Iocurrents, Inc. | Data compression and communication using machine learning |
| JP2020201143A (ja) * | 2019-06-11 | 2020-12-17 | 株式会社日立製作所 | 自動点検システム |
| JP2020201800A (ja) * | 2019-06-12 | 2020-12-17 | 株式会社日立製作所 | 自動点検システム及び無線子機 |
| JP6896797B2 (ja) * | 2019-06-13 | 2021-06-30 | 東芝エレベータ株式会社 | エレベータシステム |
| CN112714454B (zh) * | 2019-10-25 | 2022-08-26 | 中国科学院深圳先进技术研究院 | 一种无线传感器网络的监控方法及相关设备 |
| JP2021139680A (ja) * | 2020-03-03 | 2021-09-16 | 沖電気工業株式会社 | 通信装置、通信プログラム、通信方法、及び、監視システム |
| US11743344B1 (en) * | 2022-03-15 | 2023-08-29 | International Business Machines Corporation | Edge resource processing |
| CN114754860B (zh) * | 2022-04-13 | 2024-05-14 | 哈工大机器人(合肥)国际创新研究院 | 一种无线振动监测方法、电子设备及存储介质 |
Citations (3)
| Publication number | Priority date | Publication date | Assignee | Title |
|---|---|---|---|---|
| US20080071465A1 (en) * | 2006-03-03 | 2008-03-20 | Chapman Craig H | Determining road traffic conditions using data from multiple data sources |
| JP2010049584A (ja) | 2008-08-25 | 2010-03-04 | Hitachi-Ge Nuclear Energy Ltd | センサノード及びセンサネットワークシステム |
| US20150151160A1 (en) * | 2013-12-02 | 2015-06-04 | Nike, Inc. | Flight time |
Family Cites Families (3)
| Publication number | Priority date | Publication date | Assignee | Title |
|---|---|---|---|---|
| JP3046888B2 (ja) * | 1993-03-10 | 2000-05-29 | 三菱重工業株式会社 | 有意信号区間抽出装置 |
| JP3736568B1 (ja) * | 2004-09-07 | 2006-01-18 | オムロン株式会社 | 車輪盗難検知装置、車輪盗難検知方法、車輪盗難検知プログラムおよびその記録媒体 |
| WO2013001385A1 (en) * | 2011-06-28 | 2013-01-03 | International Business Machines Corporation | Vibration monitoring system |
-
2016
- 2016-01-05 JP JP2016000541A patent/JP6718681B2/ja active Active
- 2016-12-30 US US15/395,066 patent/US10425790B2/en not_active Expired - Fee Related
Patent Citations (3)
| Publication number | Priority date | Publication date | Assignee | Title |
|---|---|---|---|---|
| US20080071465A1 (en) * | 2006-03-03 | 2008-03-20 | Chapman Craig H | Determining road traffic conditions using data from multiple data sources |
| JP2010049584A (ja) | 2008-08-25 | 2010-03-04 | Hitachi-Ge Nuclear Energy Ltd | センサノード及びセンサネットワークシステム |
| US20150151160A1 (en) * | 2013-12-02 | 2015-06-04 | Nike, Inc. | Flight time |
Cited By (1)
| Publication number | Priority date | Publication date | Assignee | Title |
|---|---|---|---|---|
| US11178026B2 (en) * | 2017-03-24 | 2021-11-16 | Mitsubishi Heavy Industries, Ltd. | Monitoring system, processing device, and monitoring device |
Also Published As
| Publication number | Publication date |
|---|---|
| JP2017122976A (ja) | 2017-07-13 |
| JP6718681B2 (ja) | 2020-07-08 |
| US20170195823A1 (en) | 2017-07-06 |
Similar Documents
| Publication | Publication Date | Title |
|---|---|---|
| US10425790B2 (en) | Sensor device, sensor network system, and data compressing method | |
| US20170181098A1 (en) | Sensor node, sensor network system, and monitoring method | |
| US10964339B2 (en) | Low-complexity voice activity detection | |
| US9830913B2 (en) | VAD detection apparatus and method of operation the same | |
| KR100930060B1 (ko) | 신호 검출 방법, 장치 및 그 방법을 실행하는 프로그램이기록된 기록매체 | |
| JP4177755B2 (ja) | 発話特徴抽出システム | |
| US11302306B2 (en) | Time-based frequency tuning of analog-to-information feature extraction | |
| WO2014056326A1 (zh) | 语音质量评估的方法和装置 | |
| CN112087701B (zh) | 用于风检测的麦克风的扬声器仿真 | |
| CN108697328B (zh) | 一种鼾声识别方法及止鼾装置 | |
| CN108847253B (zh) | 车辆型号识别方法、装置、计算机设备及存储介质 | |
| US11102569B2 (en) | Methods and apparatus for a microphone system | |
| CN110021305A (zh) | 一种音频滤波方法、音频滤波装置及可穿戴设备 | |
| CN110992967A (zh) | 一种语音信号处理方法、装置、助听器及存储介质 | |
| CN112116927A (zh) | 实时检测音频信号中的语音活动 | |
| TWI594232B (zh) | 處理音訊信號之方法及裝置 | |
| CN105869652B (zh) | 心理声学模型计算方法和装置 | |
| US9295423B2 (en) | System and method for audio kymographic diagnostics | |
| KR100930061B1 (ko) | 신호 검출 방법 및 장치 | |
| WO2011068608A2 (en) | Complex acoustic resonance speech analysis system | |
| Lalos et al. | Energy efficient telemonitoring of wheezes | |
| TW202226225A (zh) | 以零點交越檢測改進語音活動檢測之設備及方法 | |
| CN116206626A (zh) | 体音数据的管理设备 | |
| CN117714960A (zh) | 麦克风模组的检测方法、检测装置、车辆及存储介质 | |
| CN116137148A (zh) | 噪声降低的设备、系统和方法 |
Legal Events
| Date | Code | Title | Description |
|---|---|---|---|
| AS | Assignment |
Owner name: ROHM CO., LTD., JAPAN Free format text: ASSIGNMENT OF ASSIGNORS INTEREST;ASSIGNOR:SHINOHARA, TOSHIKUNI;REEL/FRAME:041226/0912 Effective date: 20161214 |
|
| STPP | Information on status: patent application and granting procedure in general |
Free format text: NON FINAL ACTION MAILED |
|
| STPP | Information on status: patent application and granting procedure in general |
Free format text: NOTICE OF ALLOWANCE MAILED -- APPLICATION RECEIVED IN OFFICE OF PUBLICATIONS |
|
| STPP | Information on status: patent application and granting procedure in general |
Free format text: PUBLICATIONS -- ISSUE FEE PAYMENT VERIFIED |
|
| STCF | Information on status: patent grant |
Free format text: PATENTED CASE |
|
| FEPP | Fee payment procedure |
Free format text: MAINTENANCE FEE REMINDER MAILED (ORIGINAL EVENT CODE: REM.); ENTITY STATUS OF PATENT OWNER: LARGE ENTITY |
|
| LAPS | Lapse for failure to pay maintenance fees |
Free format text: PATENT EXPIRED FOR FAILURE TO PAY MAINTENANCE FEES (ORIGINAL EVENT CODE: EXP.); ENTITY STATUS OF PATENT OWNER: LARGE ENTITY |
|
| STCH | Information on status: patent discontinuation |
Free format text: PATENT EXPIRED DUE TO NONPAYMENT OF MAINTENANCE FEES UNDER 37 CFR 1.362 |
|
| FP | Lapsed due to failure to pay maintenance fee |
Effective date: 20230924 |