US10018561B2 - Diamond ATR artefact correction - Google Patents
Diamond ATR artefact correction Download PDFInfo
- Publication number
- US10018561B2 US10018561B2 US14/420,101 US201314420101A US10018561B2 US 10018561 B2 US10018561 B2 US 10018561B2 US 201314420101 A US201314420101 A US 201314420101A US 10018561 B2 US10018561 B2 US 10018561B2
- Authority
- US
- United States
- Prior art keywords
- spectral data
- atr
- artefact
- spectrum
- diamond
- Prior art date
- Legal status (The legal status is an assumption and is not a legal conclusion. Google has not performed a legal analysis and makes no representation as to the accuracy of the status listed.)
- Active, expires
Links
Images


Classifications
-
- G—PHYSICS
- G01—MEASURING; TESTING
- G01N—INVESTIGATING OR ANALYSING MATERIALS BY DETERMINING THEIR CHEMICAL OR PHYSICAL PROPERTIES
- G01N21/00—Investigating or analysing materials by the use of optical means, i.e. using sub-millimetre waves, infrared, visible or ultraviolet light
- G01N21/62—Systems in which the material investigated is excited whereby it emits light or causes a change in wavelength of the incident light
-
- G—PHYSICS
- G01—MEASURING; TESTING
- G01J—MEASUREMENT OF INTENSITY, VELOCITY, SPECTRAL CONTENT, POLARISATION, PHASE OR PULSE CHARACTERISTICS OF INFRARED, VISIBLE OR ULTRAVIOLET LIGHT; COLORIMETRY; RADIATION PYROMETRY
- G01J3/00—Spectrometry; Spectrophotometry; Monochromators; Measuring colours
- G01J3/28—Investigating the spectrum
-
- G—PHYSICS
- G01—MEASURING; TESTING
- G01N—INVESTIGATING OR ANALYSING MATERIALS BY DETERMINING THEIR CHEMICAL OR PHYSICAL PROPERTIES
- G01N21/00—Investigating or analysing materials by the use of optical means, i.e. using sub-millimetre waves, infrared, visible or ultraviolet light
- G01N21/17—Systems in which incident light is modified in accordance with the properties of the material investigated
- G01N21/25—Colour; Spectral properties, i.e. comparison of effect of material on the light at two or more different wavelengths or wavelength bands
- G01N21/27—Colour; Spectral properties, i.e. comparison of effect of material on the light at two or more different wavelengths or wavelength bands using photo-electric detection ; circuits for computing concentration
- G01N21/274—Calibration, base line adjustment, drift correction
-
- G—PHYSICS
- G01—MEASURING; TESTING
- G01N—INVESTIGATING OR ANALYSING MATERIALS BY DETERMINING THEIR CHEMICAL OR PHYSICAL PROPERTIES
- G01N21/00—Investigating or analysing materials by the use of optical means, i.e. using sub-millimetre waves, infrared, visible or ultraviolet light
- G01N21/17—Systems in which incident light is modified in accordance with the properties of the material investigated
- G01N21/55—Specular reflectivity
- G01N21/552—Attenuated total reflection
-
- G—PHYSICS
- G01—MEASURING; TESTING
- G01N—INVESTIGATING OR ANALYSING MATERIALS BY DETERMINING THEIR CHEMICAL OR PHYSICAL PROPERTIES
- G01N2201/00—Features of devices classified in G01N21/00
- G01N2201/12—Circuits of general importance; Signal processing
- G01N2201/121—Correction signals
- G01N2201/1218—Correction signals for pressure variations
-
- G—PHYSICS
- G01—MEASURING; TESTING
- G01N—INVESTIGATING OR ANALYSING MATERIALS BY DETERMINING THEIR CHEMICAL OR PHYSICAL PROPERTIES
- G01N2201/00—Features of devices classified in G01N21/00
- G01N2201/12—Circuits of general importance; Signal processing
- G01N2201/127—Calibration; base line adjustment; drift compensation
- G01N2201/12746—Calibration values determination
- G01N2201/12784—Base line obtained from computation, histogram
Definitions
- This invention relates to diamond ATR artefact correction of spectral data produced using Attenuated Total Reflectance (ATR) techniques.
- ATR Attenuated Total Reflectance
- ATR light from the spectrometer is totally internally reflected at an angle of incidence just above the critical angle at a facet of high refractive index material having little or no internal absorbance in the spectral range of interest.
- this light creates an “evanescent wave”—an electric field that decays rapidly with distance from the facet.
- the wave can interact with any sample material brought very close to the facet, and should the material have significant optical absorbance, some of the incident light will be absorbed resulting in less light reflected from the internal surface. In this way the absorbance spectrum of the sample can be measured.
- sample thickness is irrelevant but by the same token the sample must be brought into intimate contact with the facet to ensure adequate and consistent penetration depth. Typically this is achieved by applying high pressure to the sample. In turn this means that pressure is applied to the underlying optical substrate (or ATR crystal).
- Diamond is a popular material for use as an ATR crystal. Diamond is a preferred material for use as ATR crystals because it is very hard and therefore easy to clean and has transmittance from UV to the very far infrared. However diamond suffers from some comparatively weak absorptions around 2400 cm ⁇ 1 .
- absorbance features will tend to appear in the resultant spectrum when a sample is inspected.
- techniques exist for correcting this potential error In particular, a transmittance spectrum of the sample may be taken, and also a transmittance spectrum of the background, without a sample in position.
- the background spectrum will include the absorbance features of the diamond. Thus these may be removed from the sample spectrum by dividing the sample spectrum by the background spectrum.
- the artefact could in theory be eliminated by measuring the background spectrum with the same pressure on the diamond as was employed when measuring the sample spectrum. However, this is easier said than done because the pressure applied is applied through the sample. It would require a pressure transmitting medium with no optical absorbance over the measurement range to substitute the sample and even then matching the pressure adequately would be difficult.
- the present invention aims at providing methods and apparatus for allowing correction for pressure dependent absorbance features exhibited by diamond ATR crystals.
- a method of using a spectrometer to produce corrected diamond Attenuated Total Reflectance (ATR) spectral data comprising the steps of:
- This provides a practical way to provide an improved set of spectral data for further analysis by correcting for a pressure dependent error introduced by the diamond ATR crystal without having to attempt to determine the pressure applied to the ATR crystal via the sample.
- the numerically matching step may comprise adjusting the magnitude of the artefact reference spectrum. This allows for differences in the pressure applied to the diamond ATR crystal via the sample, since it has been found that the magnitude of the artefact is dependent on the applied pressure.
- the numerically matching step may comprise adjusting for differences in abscissa scales associated with the reference spectrum and the initial set of spectral data. This can allow for the fact, for example, that the reference spectrum was determined on a different spectrometer than the one being used to produce the spectral data for the sample.
- the step of adjusting the magnitude of the artefact reference spectrum may comprise finding a magnitude that yields a best fit between the pressure dependent diamond artefact reference spectrum and the corresponding pressure dependent diamond artefact in the initial set of ATR spectral data.
- the step of adjusting the magnitude of the artefact reference spectrum may comprise the steps of:
- Steps ii) and iii) above may be iterated suppressing further data points in each iteration, and may be iterated a predetermined number of times and/or until predetermined conditions are met.
- the step of adjusting the magnitude of the artefact reference spectrum may comprise determining a magnitude scale factor.
- the method may comprise the step of acquiring, using the spectrometer, a set of spectrometer specific standard ATR spectral data for a standard sample substance. This is akin to taking a background reading.
- the step of adjusting for differences in abscissa scales may comprise the step of:
- the standard sample substance may be diamond. In practice this means the diamond of the diamond ATR crystal.
- the method may comprise the step of acquiring, using the spectrometer, a set of spectrometer specific standard ATR spectral data for a standard sample substance by taking a background spectrum with the diamond ATR crystal in position but no sample in position.
- the step of adjusting for differences in abscissa scales may comprise the steps of:
- the numerically matching step may comprise pre-processing at least one of the sets of ATR spectral data and/or the pressure dependent diamond artefact reference spectrum to suppress slow baseline variation.
- the pre-processing may comprise filtering the data.
- the pre-processing may comprise determining the first derivative of the data.
- Pre-processing may be used as part of the step of adjusting for differences in abscissa scales and/or as part of the step of adjusting the magnitude of the artefact reference spectrum.
- the step of adjusting for differences in abscissa scales may comprise the steps of:
- the above steps can be described as fitting a shift difference correction spectrum to a target spectrum. This process may be carried out using respective pre-processed spectral data/spectra, again to help reduce baseline effects.
- step of adjusting for differences in abscissa scales may comprise the steps of:
- determining a trial spectrum by adding a scaled amount of the first derivative of the difference spectrum to the first derivative of the original reference set of standard ATR spectral data, the scaled amount being characterised by a shift scale factor;
- step of adjusting for differences in abscissa scales may comprise the steps of:
- the numerically matching step may comprise the step of adjusting the resolution of the diamond artefact reference spectrum to match the resolution of the initial set of ATR spectral data.
- the numerically matching step may comprise the step of adjusting the diamond artefact reference spectrum by interpolating to match the sampling interval of the initial set of ATR spectral data.
- the numerically matching step may comprise applying a convolution filter to the diamond artefact reference spectrum representing a difference in instrument line shape functions between the spectrometer used to determine the reference spectra and the spectrometer used in investigating the sample.
- the step of adjusting the magnitude of the artefact reference spectrum may include the determination of at least one magnitude coefficient.
- the magnitude coefficient may comprise the magnitude scale factor.
- the step of adjusting for differences in abscissa scales may include the determination of at least one shift coefficient.
- the shift coefficient may comprise the shift scale factor.
- the method may comprise the step of checking whether the at least one magnitude coefficient satisfies at least one respective threshold.
- the method may comprise the step of checking whether the at least one shift coefficient satisfies at least one respective threshold.
- the step of numerically subtracting out the numerically matched pressure dependent diamond artefact reference spectrum may comprise determining the spectrum to subtract out by
- the step of numerically subtracting out the numerically matched pressure dependent diamond artefact reference spectrum may comprise dividing in transmittance. This can avoid destroying any negative transmittance values.
- a spectrometer arranged for performing Attenuated Total Reflectance (ATR) measurements comprising:
- processing means for processing the output of the detector to produce sets of ATR spectral data
- the spectrometer has a memory for storing a pressure dependent diamond artefact reference spectrum and is arranged to acquire an initial set of ATR spectral data for a sample pressed into contact with a diamond ATR crystal;
- processing means is arranged to:
- the spectrometer may be arranged to carry out each of the optional steps described above following the first aspect of the invention.
- processing means will be arranged under the control of the software to perform those steps.
- the processing means may be integrated into a main body with the remainder of the spectrometer or may comprise a computer connected to the remainder of the spectrometer.
- ATR Attenuated Total Reflectance
- a pressure dependent diamond artefact reference spectrum for use in producing corrected diamond Attenuated Total Reflectance (ATR) spectral data, the method comprising the steps of:
- the features of the fourth aspect of the invention may be used in the obtaining step of the third aspect of the invention.
- the reference sample may be selected as one which is spectrally featureless in the range of interest. It may be a reflective sample such as aluminium foil or transmissive such as CaF 2 .
- Numerical correlation methods may be used to determine the pressure dependent features such as Principal Components Analysis, or, assuming that the applied pressure may be independently determined, techniques such as Principal Components Regression or Partial Least Squares may be used.
- the at least one region is preferably chosen to be narrow so as to minimise the risk of removing real features from the data when the reference spectrum is used.
- the reference spectrum tends to zero so at to leave no steps in the data when the reference spectrum is used.
- the method may comprise the step of obtaining spectra at a plurality of resolutions.
- the method may comprise the step of also using the reference spectrometer to obtain a reference set of standard ATR spectral data for a standard sample substance.
- a computer program or a computer under control of the computer program may be provided for carrying out the determining and generating steps of the fourth aspect of the invention.
- ATR Attenuated Total Reflectance
- a computer for correcting diamond Attenuated Total Reflectance (ATR) spectral data arranged under the control of software to:
- a seventh aspect of the present invention there is provided a computer program comprising code portions which when loaded and run on a computer cause the computer to carry out the steps of the fifth aspect of the invention.
- FIG. 1 schematically shows a spectrometer arranged for performing ATR measurements
- FIG. 2 is a flow chart showing an overview of a method for correcting ATR spectral data.
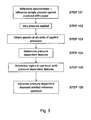
- FIG. 3 is a flow chart showing an overview of more detail of the step of obtaining a pressure dependent diamond artefact reference spectrum as included in the method of FIG. 2 ;
- FIGS. 4A-4C is a flow chart giving an overview of more detail of the step of numerically matching the pressure dependent artefact reference spectrum to initial set of data as part of the overall method shown in FIG. 2 ;
- FIG. 5 is a flow chart showing an overview of more detail of the step of numerically subtracting out the numerically matched pressure dependent artefact spectrum step as included as part of the method of FIG. 2 ;
- FIGS. 6A-6B is a flow chart giving more detail of a particular implementation of the method of correcting diamond ATR spectral data as shown in FIG. 2 ;
- FIG. 7 is a plot showing an uncorrected diamond ATR spectrum for polyethylene exhibiting pressure dependent diamond artefact features.
- FIG. 1 shows, in highly schematic form, a spectrometer 1 arranged for performing Attenuated Total Reflectance (ATR) measurements and more particularly arranged under the control of software for producing corrected diamond ATR spectral data.
- ATR Attenuated Total Reflectance
- the spectrometer 1 comprises a main body 2 on which is mounted a source of radiation 3 , a sample support surface 4 carrying an ATR crystal 5 and a detector 6 . Also provided is a pressure applying means or clamp 7 for pressing a sample 8 into contact with the ATR crystal 5 . Note that all of these components are shown only in highly schematic form in FIG. 1 . The more detailed form of these aspects of ATR spectrometers is well known to those skilled in the art and not of particular relevance to the present invention.
- the spectrometer 1 also comprises a processing unit 9 with an associated output device 10 . In the present embodiment the processing unit 9 and output device 10 are provided outside the main body 2 of the spectrometer 1 but in other embodiments these components may be provided integrally with the main body. Thus the processing unit 9 might be a general purpose computer connected to the remainder of the spectrometer 2 or might be an integral part of the main body of the spectrometer 2 .
- the processing unit 9 is connected to the source of radiation 3 to enable control of the source and connected to the detector 6 such that the output of the detector 6 can be fed to the processing unit 9 for processing.
- radiation is directed to the ATR crystal 5 , internally reflected at a facet of the crystal which is in contact with the sample 8 and progresses on to the detector 6 .
- the radiation as modified by its interaction with the sample during the total internal reflection process is detected and the resulting data is fed to the processing unit 9 to form an appropriate set of ATR spectral data.
- the processing unit 9 is arranged to operate on the spectral data as initially received from the detector 6 .
- processing unit 9 is arranged under the control of software for carrying out various of the steps mentioned in more detail below which form part of the diamond ATR correction methods of the present application.
- FIG. 2 shows, at a general level, a method for correcting sets of diamond ATR spectral data to remove the effect of pressure dependent diamond artefacts.
- the artefacts having been caused by the pressure exerted by the pressure applying means 7 through the sample 8 and onto the ATR crystal 5 during measurement of the diamond ATR spectra of the respective sample 8 .
- the method of FIG. 2 comprises obtaining a pressure dependent diamond artefact reference spectrum, acquiring an initial set of ATR spectral data for a sample, numerically matching the pressure dependent artefact reference spectrum to the corresponding features in the initial set of spectral data due to the diamond artefact and numerically subtracting out the numerically matched pressure dependent artefact spectrum.
- this technique does not require a measurement or assessment of the actual pressure being applied to the ATR crystal via the sample when the initial set of spectral data is acquired. Rather the numerical matching process is used to obviate the need for such a measurement or assessment. Thus this means that the present techniques are much more practical than ones where it would be necessary to attempt to measure or assess that applied pressure.
- step 1 the pressure dependent diamond artefact reference spectrum is obtained using a reference spectrometer. Typically this step will only be performed once by the manufacturer to develop the pressure dependent diamond artefact reference spectrum that then can be used in correcting spectral data for specific samples acquired using individual investigating spectrometers.
- step 2 there is the optional step of obtaining a reference set of standard ATR spectral data for a standard sample substance.
- This is again acquired using the reference spectrometer.
- this is a background measurement which can be useful in subsequent processing.
- this is a step which in general terms will be performed only once and most likely by the manufacturer.
- the pressure dependent diamond artefact spectrum of step 1 and the set of standard ATR spectral data for a standard sample substance of step 2 would then typically be supplied along with each new spectrometer (or indeed to users of existing spectrometers). Specifically this data might be stored in memory which is part of the processing unit 9 or provided separately on some storage media which may be accessed by the processing unit 9 .
- step 3 an investigating spectrometer—i.e. the spectrometer of a user—is optionally used to acquire a spectrometer specific set of standard ATR spectral data for the standard sample substance. This is in effect taking the same background measurement of step 2 but on the user spectrometer whereas step 2 relates to taking that background spectrum on the reference spectrometer.
- step 4 an initial set of ATR spectral data for a sample of interest is acquired using the investigating spectrometer. If the present correction techniques were not to be used then this initial set of spectral data would be the output of the spectrometer. However in the present techniques we then move to step 5 of numerically matching the pressure dependent artefact reference spectrum as obtained in step 1 to the initial set of spectral data as obtained in step 4 .
- step 6 the numerically matched pressure dependent diamond artefact reference spectrum may be subtracted out the initial set of ATR spectral data to yield a modified set of ATR spectral data for the sample which can be output by the output device 10 .
- This may, for example, be a screen to display data to a user, or data output for further processing.
- this ATR data can be used in determining the substance(s) present in the sample.
- the numerical matching step of step 5 may be broken down into two sub steps. First there is substep 5 A which includes adjusting for differences in abscissa scales between the reference spectrometer and the investigating spectrometer and second there is substep 5 B of adjusting the magnitude of the artefact reference spectrum to best fit the features as present in the initial set of ATR spectral data for the sample.
- step 5 A is making an adjustment to shift the pressure dependent artefact reference spectrum in terms of wave number (or wave length, frequency etc) to, for example, allow for any abscissa calibration difference between the reference spectrometer and the investigating spectrometer so that the artefact reference spectrum “lines up” with the appropriate features in the initial set of data.
- step 5 B is useful to take account of the fact that the pressure applied by the pressure applying means 7 to the ATR crystal 5 can be different. It has been found that the pressure dependent artefact reference spectrum has a magnitude which is dependent on the applied pressure. Thus by adjusting the magnitude of the artefact reference spectrum numerically it is possible to find a magnitude which best fits the artefact as present in the initial set of ATR spectral data and thus numerically match the artefact reference spectrum to the initial set of data.
- step 5 is carried out using absorbance spectra as it eases calculations to work in a domain that is additive.
- step 6 in FIG. 2 is carried out in transmittance to avoid losing the effect of any negative transmittance values.
- step 1 of FIG. 2 Whilst the step of obtaining the pressure dependent diamond artefact reference spectrum using a reference spectrometer as shown in step 1 of FIG. 2 needs to be carried out, in principle, only once, it is important that a good clean pressure dependent diamond artefact reference spectrum is available for use in the numerical matching and numerical subtracting out steps.
- FIG. 3 is a flow chart showing an overview of more detail of a process which may be used to obtain the pressure dependent diamond artefact reference spectrum which is the subject of step 1 in FIG. 2 .
- a reference sample is pressed against the diamond ATR crystal. It will be appreciated that in obtaining such a reference spectrum, the same type of setup as shown in FIG. 1 may be used. However the reference sample should be carefully chosen. This should to be spectrally featureless in the range of interest. One possibility is to use a reflective material such as aluminium foil and another possibility would be to use an optically transparent reference sample such as CaF 2 .
- step 102 the pressure applied to the ATR crystal via the sample is varied and in step 103 ATR spectra for the reference sample are obtained at a plurality of applied pressures.
- step 104 pressure dependent features in the obtained spectra are determined. This may be carried out, for example, by a principal component analysis. Alternatively, if, in the reference setup, it is possible to independently determine the applied pressure, other techniques such as partial least squares or principal component regression may be used.
- step 105 at least one region in the spectrum with pressure dependent features is determined. It is useful to limit the range of the pressure dependent artefact reference spectrum for use in the method of FIG. 2 to only that region or those regions where there is significant pressure dependence. This helps avoid a situation where corrections are being made using the reference spectrum which have a tendency to make the resulting data less accurate rather than more accurate. That is to say it reduces the risk of removing real features from the initial set of ATR spectral data.
- step 106 the pressure dependent artefact reference spectrum is generated taking into account the results of step 104 and step 105 .
- the ends of the spectrum tend to zero such that the removal of the spectrum during step 6 of the method shown in FIG. 2 does not lead to steps in the finally determined output data.
- the ends of the spectrum, or the ends of the different regions of spectrum if so determined should be adjusted so as to slope to a zero offset.
- all of the spectra determined in steps 1 and 4 of FIG. 2 may already be available and provided to the processing unit and the invention may reside in providing a corrected set of spectral data making use of these initial spectra.
- the present invention may be embodied in a computer programmed to carry out the numerical matching and numerical subtracting out steps or similarly in a computer program comprising code portions which when executed on a computer, cause the computer to carry out the numerical matching and subtracting out steps to yield a corrected set of ATR spectral data for the sample.
- the invention may be embodied in a spectrometer which can acquire the spectra of step 4 of FIG. 2 and (optionally) that of step 3 and arranged to carry out the numerical matching and numerical subtracting out steps.
- the numerical matching step 5 may be considered to have two substeps—step 5 A and step 5 B—relating to adjusting for differences in abscissa scales and adjusting for differences in magnitude.
- step 5 A of adjusting for differences in abscissa scales may again be broken down into two distinct processes.
- the first is adjusting for differences in abscissa scales using background or standard sample substance data and the second is adjusting for abscissa scale differences using the pressure dependent diamond artefact features.
- both of these types of abscissa scale correction are used. However this is not essential. It would be possible to use one or other of these. However using both of these types of abscissa scale correction is useful.
- the abscissa matching process can then be fine tuned by making reference to the pressure dependent artefact features.
- the process shown in FIG. 4 can be summarised in the following steps. First of all, adjustments for differences in abscissa scales, are made using the background data. After this the artefact reference spectrum is adjusted for resolution and to take into account the difference in abscissa scales. Following this, a further fine tune adjustment for differences in abscissa scales is made by considering the pressure dependent diamond artefact features. After this the magnitude of the adjusted pressure dependent diamond artefact reference spectrum is varied to find a best fit for magnitude. The end of this process yields a shift coefficient relating to the differences in abscissa scales and a magnitude coefficient relating to the size of the pressure dependent diamond artefact in the sample data.
- step 501 an abscissa shifted version of the reference set of standard ATR spectral data is determined. It will be recalled that this reference set of standard ATR spectral data is in effect a background reading taken on the original reference spectrometer used to develop the pressure dependent diamond artefact reference spectrum.
- step 502 a difference spectrum is determined from the abscissa shifted version of the reference set of ATR spectral data as determined in step 501 and the original version of the reference set of standard ATR spectral data.
- step 503 first derivatives are determined of the difference spectrum, the original set of standard ATR spectral data and the set of spectrometer specific standard ATR spectral data.
- one has first derivatives of the difference spectrum, the background spectrum on the reference spectrometer and the background spectrum on the investigating spectrometer.
- a trial spectrum is determined. This consists of a scaled amount of the first derivative of the difference spectrum summed with the first derivative of the original reference set of standard ATR spectral data.
- step 505 the trial spectrum of step 504 is fitted to the first derivative of the set of spectrometer specific standard ATR spectral data by varying the shift scale factor.
- the shift scale factor is determined which is representative of the difference in abscissa calibration between the reference spectrometer and the investigating spectrometer.
- step 506 a process of fitting the pressure dependent diamond artefact reference spectrum is begun.
- the first step as included in step 506 is adjusting the resolution of the pressure dependent artefact reference spectrum to match that of the initial set of ATR spectral data acquired for the sample (as was acquired for example in step 4 of the process shown in FIG. 2 ).
- step 507 the pressure dependent diamond artefact reference spectrum is operated on in dependence on the best fit shift scale factor found in step 505 so that the effect of the differences in abscissa calibration can be taken into account.
- the abscissa position of the adjusted artefact reference spectrum should be close to where the corresponding diamond artefact features should be present in the initial set of ATR spectral data for the sample.
- steps beginning with step 508 a process of more finely adjusting the abscissa position of the reference spectrum is undertaken by fitting the adjusted artefact reference spectrum to the initial set of ATR spectral data for the sample in terms of abscissa position.
- the steps used in this part of the process, namely steps 508 - 512 are to a large degree a repetition of steps 502 - 505 described above but are carried out in respect of the spectra including the pressure dependent diamond artefact features rather than the background spectra.
- step 508 an abscissa shifted version of the adjusted artefact reference spectrum is determined.
- step 509 a difference spectrum is determined from the abscissa shifted version of the adjusted artefact reference spectrum and the original adjusted artefact reference spectrum.
- step 510 first derivatives are determined of the difference spectrum found in step 509 , the original adjusted artefact reference spectrum as found in 507 and the initial set of ATR spectral data for a sample as found for example in step 4 of the process shown in FIG. 2 .
- a trial spectrum is determined. This is made up of a scaled amount of the first derivative of the difference spectrum summed with a first derivative of the original adjusted artefact reference spectrum.
- step 512 the trial spectrum is fitted to the first derivative of the initial set of ATR spectral data for the sample by varying the shift scale factor. The best fit shift scale factor is then noted.
- step 513 a shift coefficient for shifting the adjusted artefact reference spectrum by an amount which should most closely fit the reference artefact spectrum to the corresponding artefact features in the sample data is determined from the best fit shift scale factor. Thus by the completion of step 513 an optimum abscissa position for the artefact reference spectrum has been determined.
- steps 514 - 519 a sub process of fitting the artefact reference spectrum to the sample data in terms of magnitude is carried out.
- step 514 This sub process starts in step 514 by taking the trial spectrum of step 511 whilst using the best fit shift scale factor and varying the magnitude of the trial spectrum. Then in step 515 the shift fitted trial spectrum is fitted to the first derivative of the initial set of ATR spectral data for the sample by varying the magnitude scale factor. The best fit magnitude scale factor is then noted.
- step 516 at least one data point in the initial set of ATR data is identified as an outlier in the magnitude best fit.
- step 517 the at least one data point is suppressed and the fitting step of 515 is repeated with that data point suppressed to yield a modified best fit magnitude scale factor.
- An improved best fit scale factor should thereby be obtained.
- steps 518 , steps 515 - 517 may be repeated until predetermined conditions are satisfied or for predetermined number of iterations with new outlier data points being determined and suppressed in each iteration. This should improve the fit.
- the process may be repeated three times.
- the process might be repeated until the magnitude scale factor stabilises, that is to say, until the variation of magnitude scale factor between one iteration and the next is below some threshold value, for example.
- step 519 a magnitude coefficient is determined from the best fit magnitude scale factor.
- the shift coefficient determined in step 513 and magnitude coefficient determined in step 519 are then available for use in determining the best abscissa position and magnitude for the adjusted artefact reference spectrum to facilitate its removal from the sample data.
- step 601 the reasonableness of the shift coefficient and magnitude coefficient is checked.
- the shift coefficient and magnitude coefficient are checked against respective thresholds.
- a maximum plausible value for the shift coefficient and the magnitude coefficient may be determined based on the biggest shift which could be expected and the largest artefact features which could be expected under the maximum pressure exertable in any typical ATR spectrometer. These maximum values could then be used as upper thresholds for the coefficient.
- step 602 the diamond artefact reference spectrum is scaled in dependence on the magnitude coefficient to generate a scaled diamond artefact reference spectrum.
- a shifted difference spectrum for the diamond artefact reference spectrum is determined in dependence on the shift coefficient. In fact this means determining an abscissa shifted version of the artefact reference spectrum, determining a difference spectrum from the abscissa shifted and original versions of the diamond artefact reference spectrum to yield the shift different spectrum. This shift difference spectrum can then be scaled in dependence on the shift coefficient.
- step 604 the scaled diamond artefact reference spectrum and scaled shift difference spectrum can be summed to generate the spectrum to the subtracted out.
- This spectrum is then converted back to transmittance so that it may be subtracted out of the sample data (also in transmittance) by dividing the spectra. This avoids losing any negative terms.
- FIG. 6 is a flow chart showing in more detail one example of carrying out the whole process indicated in FIG. 2 .
- FIG. 7 An example spectrum for polyethylene before correction is shown in FIG. 7 .
- the region centred on 2000 cm ⁇ 1 should be quite featureless but shows clear evidence of the diamond ATR pressure dependent artefact.
- the series of steps described below start from a position where, from the reference (or calibration) spectrometer, we have available the pressure dependent diamond artefact reference spectrum (or restricted range ATR artefact spectrum/correction spectrum) and the reference set of standard ATR spectral data for a standard sample substance (the reference ATR background). Further we have available the initial set of spectral data for a sample (the uncorrected sample spectrum) and a spectrometer specific set of standard ATR spectral data for the standard sample substance (the target ATR background).
- the reference (or calibration) spectrometer we have available the pressure dependent diamond artefact reference spectrum (or restricted range ATR artefact spectrum/correction spectrum) and the reference set of standard ATR spectral data for a standard sample substance (the reference ATR background).
- step i similarly to step c, compute the centered difference times ramp of the correction spectrum to yield the shift-difference spectrum.
- first derivatives are used for preprocessing/filtering the data
- other preprocessing might be used.
- filters such as second derivatives or other filters may be used, as might baseline subtraction.
- the shift difference spectrums mentioned above might be determined as an approximation by the use of a first derivative times a linear ramp function which is proportional to wave number.
- step 506 the step of adjusting the resolution of the artefact reference spectrum is mentioned.
- a convolution filter may be applied representing the difference in instrument line shapes between the reference spectrometer and investigating spectrometer.
- cubic spline or higher order interpolation may be used.
- step of shifting the artefact spectrum based on comparing the artefact reference spectrum to the position of the corresponding features in the sample data as outlined in steps 508 - 513 of FIG. 4 is optional. In some circumstances it may be determined or decided that it is sufficient to carry out abscissa calibration shift based only on the background/standard sample comparison as explained in steps 501 - 505 of FIG. 4 .
Landscapes
- Physics & Mathematics (AREA)
- Health & Medical Sciences (AREA)
- General Physics & Mathematics (AREA)
- Immunology (AREA)
- General Health & Medical Sciences (AREA)
- Pathology (AREA)
- Life Sciences & Earth Sciences (AREA)
- Chemical & Material Sciences (AREA)
- Analytical Chemistry (AREA)
- Biochemistry (AREA)
- Spectroscopy & Molecular Physics (AREA)
- Mathematical Physics (AREA)
- Engineering & Computer Science (AREA)
- Theoretical Computer Science (AREA)
- Nuclear Medicine, Radiotherapy & Molecular Imaging (AREA)
- Investigating Or Analysing Materials By Optical Means (AREA)
- Spectrometry And Color Measurement (AREA)
Applications Claiming Priority (3)
| Application Number | Priority Date | Filing Date | Title |
|---|---|---|---|
| GB1213997.8A GB2504928A (en) | 2012-08-06 | 2012-08-06 | Diamond attenuated total reflectance spectrum artefact correction |
| GB1213997.8 | 2012-08-06 | ||
| PCT/GB2013/000320 WO2014023924A1 (en) | 2012-08-06 | 2013-07-23 | Diamond atr artefact correction |
Publications (2)
| Publication Number | Publication Date |
|---|---|
| US20150177142A1 US20150177142A1 (en) | 2015-06-25 |
| US10018561B2 true US10018561B2 (en) | 2018-07-10 |
Family
ID=46934948
Family Applications (1)
| Application Number | Title | Priority Date | Filing Date |
|---|---|---|---|
| US14/420,101 Active 2034-12-29 US10018561B2 (en) | 2012-08-06 | 2013-07-23 | Diamond ATR artefact correction |
Country Status (6)
| Country | Link |
|---|---|
| US (1) | US10018561B2 (https=) |
| EP (1) | EP2880422A1 (https=) |
| JP (1) | JP6210462B2 (https=) |
| CA (1) | CA2878884C (https=) |
| GB (1) | GB2504928A (https=) |
| WO (1) | WO2014023924A1 (https=) |
Families Citing this family (2)
| Publication number | Priority date | Publication date | Assignee | Title |
|---|---|---|---|---|
| KR102277902B1 (ko) * | 2014-09-05 | 2021-07-15 | 삼성전자주식회사 | 피검체 접촉압력 측정기와 그 제조 및 측정방법 |
| CN113970531B (zh) * | 2020-07-24 | 2025-02-11 | 中国石油化工股份有限公司 | 一种校正光谱的方法 |
Citations (6)
| Publication number | Priority date | Publication date | Assignee | Title |
|---|---|---|---|---|
| US4529319A (en) * | 1981-11-25 | 1985-07-16 | Carl-Zeiss-Stiftung | Method and apparatus for the detection of thermo-optical signals |
| EP1550854A2 (en) | 2003-12-30 | 2005-07-06 | Rohm And Haas Company | Method for diagnosing and identifying contaminants |
| US20070170362A1 (en) * | 2006-01-25 | 2007-07-26 | The Regents Of The University Of California | Method and apparatus for internal reflection imaging |
| DE102006036808A1 (de) | 2006-08-07 | 2008-02-14 | Bruker Optik Gmbh | Strukturierter ATR-Kristall aus Diamant |
| US20110070602A1 (en) | 2009-09-22 | 2011-03-24 | Bp Corporation North America Inc. | Methods and Apparatuses for Measuring Biological Processes Using Mid-Infrared Spectroscopy |
| EP2395332A1 (en) | 2010-06-10 | 2011-12-14 | Yokogawa Electric Corporation | Spectroscopic analyzer and spectroscopic analysis method |
Family Cites Families (9)
| Publication number | Priority date | Publication date | Assignee | Title |
|---|---|---|---|---|
| US5579462A (en) * | 1994-11-03 | 1996-11-26 | Bio-Rad Laboratories | User interface for spectrometer |
| EP0982584B1 (en) * | 1998-08-28 | 2006-02-08 | Perkin-Elmer Limited | Spectrometer accessory for carrying out attenuated total reflectance measurements |
| JP2001091452A (ja) * | 1999-09-27 | 2001-04-06 | Shimadzu Corp | Atrマッピング測定装置 |
| GB0320925D0 (en) * | 2003-09-06 | 2003-10-08 | Smiths Group Plc | Spectrometer apparatus |
| JP4784755B2 (ja) * | 2006-09-14 | 2011-10-05 | 株式会社島津製作所 | Atr自動密着装置 |
| JP2008209371A (ja) * | 2007-02-28 | 2008-09-11 | Toppan Printing Co Ltd | 赤外分光分析用加圧セル |
| JP2009002703A (ja) * | 2007-06-19 | 2009-01-08 | Shimadzu Corp | ダイヤモンド検査装置 |
| JP5576696B2 (ja) * | 2010-04-14 | 2014-08-20 | 日本分光株式会社 | 紫外線硬化樹脂の物性測定装置 |
| JP6129302B2 (ja) * | 2012-05-23 | 2017-05-17 | グラクソスミスクライン バイオロジカルズ ソシエテ アノニム | 混合物中のポリソルベート種の濃度を決定するための方法 |
-
2012
- 2012-08-06 GB GB1213997.8A patent/GB2504928A/en not_active Withdrawn
-
2013
- 2013-07-23 JP JP2015525931A patent/JP6210462B2/ja not_active Expired - Fee Related
- 2013-07-23 US US14/420,101 patent/US10018561B2/en active Active
- 2013-07-23 WO PCT/GB2013/000320 patent/WO2014023924A1/en not_active Ceased
- 2013-07-23 CA CA2878884A patent/CA2878884C/en active Active
- 2013-07-23 EP EP13742672.2A patent/EP2880422A1/en not_active Withdrawn
Patent Citations (6)
| Publication number | Priority date | Publication date | Assignee | Title |
|---|---|---|---|---|
| US4529319A (en) * | 1981-11-25 | 1985-07-16 | Carl-Zeiss-Stiftung | Method and apparatus for the detection of thermo-optical signals |
| EP1550854A2 (en) | 2003-12-30 | 2005-07-06 | Rohm And Haas Company | Method for diagnosing and identifying contaminants |
| US20070170362A1 (en) * | 2006-01-25 | 2007-07-26 | The Regents Of The University Of California | Method and apparatus for internal reflection imaging |
| DE102006036808A1 (de) | 2006-08-07 | 2008-02-14 | Bruker Optik Gmbh | Strukturierter ATR-Kristall aus Diamant |
| US20110070602A1 (en) | 2009-09-22 | 2011-03-24 | Bp Corporation North America Inc. | Methods and Apparatuses for Measuring Biological Processes Using Mid-Infrared Spectroscopy |
| EP2395332A1 (en) | 2010-06-10 | 2011-12-14 | Yokogawa Electric Corporation | Spectroscopic analyzer and spectroscopic analysis method |
Non-Patent Citations (3)
| Title |
|---|
| International Report on Patentability issued in connection with corresponding International Application No. PCT/GB2013/0000320, dated Feb. 10, 2015. |
| International Search Report for International Application No. PCT/GB2013/0000320, dated Nov. 20, 2013. |
| Kleideiter et al. Pressure dependence of thickness and refractive index of thin PMMA-films investigated by surface plasmon and optical waveguide spectroscopy. Macromol. Chem. Phys. 200, 1028-1033 (1999). * |
Also Published As
| Publication number | Publication date |
|---|---|
| CA2878884C (en) | 2020-09-29 |
| GB2504928A (en) | 2014-02-19 |
| CA2878884A1 (en) | 2014-02-13 |
| JP6210462B2 (ja) | 2017-10-11 |
| WO2014023924A1 (en) | 2014-02-13 |
| EP2880422A1 (en) | 2015-06-10 |
| US20150177142A1 (en) | 2015-06-25 |
| GB201213997D0 (en) | 2012-09-19 |
| JP2015528563A (ja) | 2015-09-28 |
Similar Documents
| Publication | Publication Date | Title |
|---|---|---|
| US10345242B2 (en) | Reverse intensity correction for Raman spectral library search | |
| US6687620B1 (en) | Augmented classical least squares multivariate spectral analysis | |
| JP3245157B2 (ja) | スペクトルデータの測定および補正 | |
| CN102175324A (zh) | 基于面阵探测器的多通道低杂散光光谱仪 | |
| CN111157484A (zh) | 用于水果糖度检测设备的近红外光谱模型传递方法 | |
| RU2571185C2 (ru) | Способ компенсации дрейфа амплитуды в спектрометре и спектрометр, осуществляющий указанный способ | |
| JP2022527850A (ja) | 分光測定装置を構成するための方法 | |
| US10018561B2 (en) | Diamond ATR artefact correction | |
| CN105004707B (zh) | Ccd阵列在线拉曼光谱仪谱图标准化方法 | |
| Boysworth et al. | Aspects of multivariate calibration applied to near-infrared spectroscopy | |
| CN111077128B (zh) | 使用相对积分参数的拉曼信号位置校正 | |
| Mayerhöfer et al. | A simplified, effective ATR correction method for spectral identification | |
| Ptashnik et al. | Intensities and self-broadening coefficients of the strongest water vapour lines in the 2.7 and 6.25 μm absorption bands | |
| Beganović et al. | Handling of uncertainty due to interference fringe in FT-NIR transmittance spectroscopy—Performance comparison of interference elimination techniques using glucose-water system | |
| US20240160688A1 (en) | Stepwise superposition-based fourier transform differential method | |
| CN119534381A (zh) | 一种用于香油品质评价的快速检测方法及系统 | |
| Kalambet | Data acquisition and integration | |
| Blanco et al. | Wavelength calibration transfer between diode array UV-visible spectrophotometers | |
| JP2008532052A (ja) | 改良されたアポダイゼーション関数を用いた分光測定における信号処理方法及び装置 | |
| Xiang et al. | Evaluation of transmission and reflection modalities for measuring content uniformity of pharmaceutical tablets with near-infrared spectroscopy | |
| Al-Mbaideen et al. | Frequency self deconvolution in the quantitative analysis of near infrared spectra | |
| JP4233423B2 (ja) | 定量方法及びスペクトル測定装置 | |
| Weber | Preprocessing of Spectral Data | |
| EP4022283B1 (en) | Method of correcting for an amplitude change in a spectrometer | |
| JP2013228270A (ja) | シラン系シール材の硬化度測定方法 |
Legal Events
| Date | Code | Title | Description |
|---|---|---|---|
| AS | Assignment |
Owner name: PERKINELMER SINGAPORE PTE LTD, SINGAPORE Free format text: ASSIGNMENT OF ASSIGNORS INTEREST;ASSIGNOR:HOULT, ROBERT ALAN;REEL/FRAME:034984/0338 Effective date: 20150106 |
|
| STCF | Information on status: patent grant |
Free format text: PATENTED CASE |
|
| MAFP | Maintenance fee payment |
Free format text: PAYMENT OF MAINTENANCE FEE, 4TH YEAR, LARGE ENTITY (ORIGINAL EVENT CODE: M1551); ENTITY STATUS OF PATENT OWNER: LARGE ENTITY Year of fee payment: 4 |
|
| AS | Assignment |
Owner name: OWL ROCK CAPITAL CORPORATION, NEW YORK Free format text: SECURITY INTEREST;ASSIGNOR:PERKINELMER U.S. LLC;REEL/FRAME:066839/0109 Effective date: 20230313 |
|
| FEPP | Fee payment procedure |
Free format text: MAINTENANCE FEE REMINDER MAILED (ORIGINAL EVENT CODE: REM.); ENTITY STATUS OF PATENT OWNER: LARGE ENTITY |