JP6212786B2 - Health information display device, solution system and method - Google Patents
Health information display device, solution system and method Download PDFInfo
- Publication number
- JP6212786B2 JP6212786B2 JP2016252034A JP2016252034A JP6212786B2 JP 6212786 B2 JP6212786 B2 JP 6212786B2 JP 2016252034 A JP2016252034 A JP 2016252034A JP 2016252034 A JP2016252034 A JP 2016252034A JP 6212786 B2 JP6212786 B2 JP 6212786B2
- Authority
- JP
- Japan
- Prior art keywords
- information
- user
- health
- phr
- future
- Prior art date
- Legal status (The legal status is an assumption and is not a legal conclusion. Google has not performed a legal analysis and makes no representation as to the accuracy of the status listed.)
- Active
Links
Images


Classifications
-
- G—PHYSICS
- G16—INFORMATION AND COMMUNICATION TECHNOLOGY [ICT] SPECIALLY ADAPTED FOR SPECIFIC APPLICATION FIELDS
- G16H—HEALTHCARE INFORMATICS, i.e. INFORMATION AND COMMUNICATION TECHNOLOGY [ICT] SPECIALLY ADAPTED FOR THE HANDLING OR PROCESSING OF MEDICAL OR HEALTHCARE DATA
- G16H10/00—ICT specially adapted for the handling or processing of patient-related medical or healthcare data
- G16H10/60—ICT specially adapted for the handling or processing of patient-related medical or healthcare data for patient-specific data, e.g. for electronic patient records
-
- G—PHYSICS
- G16—INFORMATION AND COMMUNICATION TECHNOLOGY [ICT] SPECIALLY ADAPTED FOR SPECIFIC APPLICATION FIELDS
- G16H—HEALTHCARE INFORMATICS, i.e. INFORMATION AND COMMUNICATION TECHNOLOGY [ICT] SPECIALLY ADAPTED FOR THE HANDLING OR PROCESSING OF MEDICAL OR HEALTHCARE DATA
- G16H50/00—ICT specially adapted for medical diagnosis, medical simulation or medical data mining; ICT specially adapted for detecting, monitoring or modelling epidemics or pandemics
- G16H50/30—ICT specially adapted for medical diagnosis, medical simulation or medical data mining; ICT specially adapted for detecting, monitoring or modelling epidemics or pandemics for calculating health indices; for individual health risk assessment
-
- G—PHYSICS
- G16—INFORMATION AND COMMUNICATION TECHNOLOGY [ICT] SPECIALLY ADAPTED FOR SPECIFIC APPLICATION FIELDS
- G16Z—INFORMATION AND COMMUNICATION TECHNOLOGY [ICT] SPECIALLY ADAPTED FOR SPECIFIC APPLICATION FIELDS, NOT OTHERWISE PROVIDED FOR
- G16Z99/00—Subject matter not provided for in other main groups of this subclass
Landscapes
- Health & Medical Sciences (AREA)
- Engineering & Computer Science (AREA)
- Medical Informatics (AREA)
- Public Health (AREA)
- General Health & Medical Sciences (AREA)
- Primary Health Care (AREA)
- Epidemiology (AREA)
- Biomedical Technology (AREA)
- Data Mining & Analysis (AREA)
- Databases & Information Systems (AREA)
- Pathology (AREA)
- Medical Treatment And Welfare Office Work (AREA)
- Measuring And Recording Apparatus For Diagnosis (AREA)
- Business, Economics & Management (AREA)
- Tourism & Hospitality (AREA)
- Child & Adolescent Psychology (AREA)
- Economics (AREA)
- Human Resources & Organizations (AREA)
- Marketing (AREA)
- Strategic Management (AREA)
- Physics & Mathematics (AREA)
- General Business, Economics & Management (AREA)
- General Physics & Mathematics (AREA)
- Theoretical Computer Science (AREA)
Description
本発明の実施形態は、健康情報表示装置及び方法に関する。 Embodiments described herein relate generally to a health information display apparatus and method.
従来、先制医療や個別化予防の実現に向けて、世の中では様々な取り組みが進められている。ここで、先制医療とは、疾病の発症前に、高い精度で発症の予測若しくは発症前の診断を行い、発症前の適切な時期に治療的介入を実施して、発症を防止若しくは遅らせることをいう。また、個別化予防とは、各個人に適した疾病の予防をいう。 In the past, various efforts have been made in the world to realize preemptive medicine and personalized prevention. Here, preemptive medicine is to prevent or delay the onset by predicting onset or making a diagnosis before onset with high accuracy before the onset of the disease, and implementing therapeutic intervention at an appropriate time before onset. Say. Moreover, individualization prevention means prevention of the disease suitable for each individual.
しかしながら、健康状態の評価や疾病の発症に至る前の未病状態の判別を厳密且つ客観的に行うことは、未だ困難である。例えば、個人のライフログを収集し、本人にフィードバックする取り組みは数多く試みられているが、健康状態の評価や未病状態の判別に必要な基盤データとの連携がないものや、個人の体質に基づいた個別の健康指導には至らないものが大半である。 However, it is still difficult to strictly and objectively evaluate the health condition and discriminate the disease-free condition before the onset of the disease. For example, many attempts have been made to collect personal life logs and provide feedback to the person, but there is no link with basic data necessary for evaluation of health status or discrimination of non-disease status. Most do not lead to individualized health guidance.
本発明は、上記に鑑みてなされたものであって、将来の健康リスクを精度良く推定し、個人の体質に基づいた個別の健康指導を行うことが可能な、健康情報表示装置及び方法を提供することを課題とする。 The present invention has been made in view of the above, and provides a health information display apparatus and method capable of accurately estimating future health risks and performing individual health guidance based on the personal constitution. The task is to do.
実施形態に係る健康情報表示装置は、表示部と、表示制御部とを備える。前記表示制御部は、ユーザの健康情報である、ゲノム情報と、生体情報及び行動情報とに基づいて推定された、当該ユーザの将来の健康リスクを前記表示部に表示し、前記将来の健康リスクとともに、前記ユーザの目標の健康状態及び当該目標の健康状態に到達するための指導情報のうち、少なくとも1つを表示し、操作者から、前記推定に用いる前記ユーザの健康情報の期間の幅を受け付けると、受け付けた期間の幅に応じた将来の健康リスクを表示する。 The health information display device according to the embodiment includes a display unit and a display control unit. The display control unit displays the future health risk of the user estimated on the basis of genome information, biological information, and behavior information, which is the user's health information, on the display unit, and the future health risk In addition, at least one of the target health condition of the user and the guidance information for reaching the target health condition is displayed, and the width of the period of the user's health information used for the estimation is displayed from the operator. When accepted, it displays future health risks according to the width of the accepted period.
将来の健康リスクを精度良く推定し、個人の体質に基づいた個別の健康指導を行うことが可能になるという効果を奏する。 It is possible to accurately estimate future health risks and to perform individual health guidance based on the individual constitution.
以下、図面を参照しながら、実施形態に係る健康情報処理装置、健康情報表示装置及び方法を説明する。なお、以下の実施形態においては、健康情報処理装置や、健康情報表示装置が、複数の機能(例えば、一次利用サービス、二次利用サービス等)を実現する例を説明するが、必ずしも、複数の機能を実現することが必須の構成ではない。健康情報処理装置や、健康情報表示装置は、複数の機能のうちの一部の機能を実現する構成でもよい。 Hereinafter, a health information processing apparatus, a health information display apparatus, and a method according to embodiments will be described with reference to the drawings. In the following embodiment, an example in which the health information processing apparatus and the health information display apparatus realize a plurality of functions (for example, a primary use service, a secondary use service, etc.) will be described. Realizing the function is not an essential configuration. The health information processing apparatus and the health information display apparatus may be configured to realize a part of a plurality of functions.
(本実施形態によって実現されるモチベーション向上社会)
以下に説明する実施形態によれば、生きることへのモチベーションが高まる、モチベーション向上社会が実現される。そこで、実施形態の具体的な構成の説明に入る前に、まずは、我々が提案する、モチベーション向上社会の実現について述べる。
(Motivated society realized by this embodiment)
According to the embodiments described below, a motivation improving society in which motivation to live is increased is realized. Therefore, before describing the specific configuration of the embodiment, first, we will describe the realization of the motivation-improving society we propose.
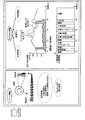
図1は、本実施形態によって実現されるモチベーション向上社会を説明するための図である。今日、誰もが、家族と地域の中で健康快活に、仕事や趣味に生きるのが理想だが、将来の病気への不安、痴呆、うつ、孤独感、離れた家族への心配等が、少子高齢化の進む現代社会において人々を脅かし、安寧な生活を蝕んでいる。そのような状況では、将来像どころか、日々の生きることへのモチベーションすら低下し、強い心持ちにはなれない。もし、さりげなく自分や家族の日常生活や心身の健康状態がわかり、想い描いた自己実現に向けていつでも支援してくれるツールや、家族や自分が健康で且つ活力ある生活を実現するための取り組みに向けて意欲を高めてくれる仕組みが世の中にあれば、誰もが、自己実現の結果、生きることへのモチベーションを高め、現在の暮らしや将来への不安、ストレスから解放され、安心安寧な心持ちで強くなれる。このような理想の自己を獲得し、家族との強い絆に裏打ちされた、不安・ストレスのない強い個々人が、かつての昭和の様な活力と成長力みなぎる経済や社会を取戻す。そこで、以下の実施形態では、半導体・通信・エネルギー・素材・医療技術の輝ける創意を一つに結集して、生きることへのモチベーションを取戻すためのソリューションシステムを開発し、社会実装することを提案した。 FIG. 1 is a diagram for explaining a motivation-improving society realized by this embodiment. Today, it is ideal for everyone to live a healthy life in the family and the community, work and hobbies, but concerns about future illness, dementia, depression, loneliness, concerns about distant families, etc. In today's aging society, people are threatened and eroded. In such a situation, the motivation for daily life is lowered, not the future image, and it does not become strong. If you can casually understand the daily life and mental and physical health of yourself and your family, you will always be able to support the self-realization that you envisioned, and efforts to realize a healthy and energetic life for your family and yourself If there is a mechanism in the world that will increase motivation for the future, everyone will be motivated to live as a result of self-fulfillment, free from anxiety and stress for current living and the future, and have a peace of mind and peace of mind To become stronger. A strong individual without such anxiety and stress, who has acquired such ideal self and is backed by strong bonds with his family, will regain the economy and society where the vitality and growth potential of the Showa era can be seen. Therefore, in the following embodiments, we will develop a solution system that will bring back the motivation to live by bringing together the brilliant ingenuity of semiconductors, communications, energy, materials, and medical technologies, and implementing them in society. Proposed.
図1に示すように、『現代社会』においては、将来の健康や生活に対する不安が蔓延し、家族や社会との絆すら消失しかけている。少子高齢化社会が迫り来るなか、人は、病気にならないか、痴呆やうつにならないか、孤独な生活にならないか、離れた家族は大丈夫か、どうすれば自信を持てるのか等、不安感や孤独感、そして家族の心配に苛まれている。不安、うつ、ストレス、脳疾患、心疾患を抱え、やる気やモチベーションを喪失しかけている。 As shown in FIG. 1, in “modern society”, concerns about future health and life are widespread, and even bonds with families and society are disappearing. Anxiety and loneliness, such as how people can become ill, demented or depressed, do not live lonely, whether their families are safe, how can they be confident, etc. And suffering from family concerns. Has anxiety, depression, stress, brain disease, heart disease and is losing motivation and motivation.
このような『現代社会』において、誰もが、家族と社会の中で健康快活に、仕事や趣味に生きることを理想としている。その実現手段の1つが、図1に示す『日常人間ドック』である。この『日常人間ドック』では、生体情報と行動情報とが紐付けられた真のバイタルデータと、個人のゲノム情報から解析された体質データベースとを統合した革新的なPHR(Personal Health Record)ビッグデータを基盤に、理想のライフスタイルを創造する。 In such a “modern society”, it is ideal for everyone to live healthy and lively in work and hobbies in the family and society. One of the means for realizing this is the “daily human dock” shown in FIG. In this “Daily Ningen Dock”, innovative vital health record (PHR) big data that combines true vital data that links biological information and behavioral information with a constitution database that is analyzed from individual genome information. Create an ideal lifestyle on the foundation.
また、『日常人間ドック』では、この革新的なPHRデータを、非意識(Unconscious Sensing)技術により収集する。なお、センシングデータには、図1に示すように、例えば、心拍数、ストレス、血圧、ホルモン、血中濃度、交感神経、薬剤の服用量等がある。また、センシングデータには、例えば、糖分、塩分、胃酸、農薬、微生物、環境物質等がある。また、図1に示すように、ヘルスケアクラウド10上にはPHR処理装置100が構築される。PHR処理装置100は、各個人の生体情報と行動情報とを関連付けてライフログ情報として収集、蓄積する。そして、PHR処理装置100は、図1に示すように、時系列で収集した膨大なライフログ情報とゲノム情報に基づく体質データベースとを複数ユーザについて統合化したPHRビッグデータを、ヘルスケアクラウド10上で一元管理する。
In addition, “Innovative Human Dock” collects this innovative PHR data using Unconscious Sensing technology. As shown in FIG. 1, the sensing data includes, for example, heart rate, stress, blood pressure, hormone, blood concentration, sympathetic nerve, drug dose, and the like. Sensing data includes, for example, sugar, salt, stomach acid, agricultural chemicals, microorganisms, and environmental substances. Further, as shown in FIG. 1, a
PHR処理装置100は、かかるPHRビッグデータを解析することで、ゲノム情報に基づく将来の疾病発症リスク、食事量、運動量、又は運動負荷に対する体の応答反応等を高度且つ詳細に分析する。ひいては、疾病発症リスクや発作の予兆、自分の体質、ライフスタイルに最適な食事内容、運動、ライフスタイル、薬やサプリメントの選択等、理想像を目指した日々の生活の設計も可能になる。なお、PHR処理装置100は、例えば、ビッグデータマイニング、統合ゲノム解析、シミュレーション、コミュニケーションの可視化定量化技術等を適用する。
The
ところで、本実施形態においては、このように各個人から収集されたPHRデータを、『日常人間ドック』の仕組みで本人にフィードバックする「一次利用」に活用するだけでなく、様々なサービスへの「二次利用」にも活用する。そこで、以下では、PHRデータがどのように活用されるか、本実施形態において、ヘルスケアクラウド上にて実現されるヘルスケアインフォマティクスの概要を、「一次利用」と「二次利用」とに分けて説明する。 By the way, in the present embodiment, the PHR data collected from each individual in this way is not only used for “primary use” that is fed back to the person by the “daily human dock” mechanism, but also “ It is also used for “next use”. Therefore, in the following, how PHR data is used, the outline of healthcare informatics realized on the healthcare cloud in this embodiment is divided into “primary use” and “secondary use”. I will explain.
まず、「一次利用」である、『日常人間ドック』の仕組みを簡単に説明する。例えば、PHR処理装置100は、PHRビッグデータの解析の結果を、対象者が装着する装着型情報端末に表示することで、対象者にフィードバックする。そのフィードバックの一例が、「将来の健康リスクのお知らせ」である。対象者は、装着型情報端末上に提供される「将来の健康リスクのお知らせ」サービスで、自らの将来の健康リスクを把握するとともにその対処法の告知を受け、更に、見える化された目標を持つことができる。また、対象者は、この装着型情報端末上で、医師の指導や家族(若しくは、仮想の家族)等の激励を受けることができる。例えば、図1では、対象者は、主治医の指導(「塩分を控えて!」)を受けている。このように、「将来の健康リスクのお知らせ」は、実在の人物や仮想人物による応答システムとしても機能する。こうして、本実施形態によれば、各個人は、日常、さりげなく精度良く収集した情報に基づいて、装着型情報端末等で、各自の健康状態を得て、主治医や家庭医、健康支援スタッフによる指導、激励を受けることができる。また、自分や家族の心身の状態管理や、行動及び生活を確認することができる。
First, we will briefly explain the mechanism of “daily use dock”, which is “primary use”. For example, the
また、『日常人間ドック』の仕組みの中で、PHR処理装置100は、これらの情報を、対象者にフィードバックするだけでなく医療機関にフィードバックすることもできる。医師は、PHR処理装置100からフィードバックされた解析の結果をもとに、例えば、ハイリスクな疾病発症予備軍を認識し、必要に応じ積極的にこれらの者にアクセスする。なお、対象者から送信されたセンシングデータは、対象者の身体の異常検知にも役立てられる。例えば、PHR処理装置100は、ハイリスクな疾病発症予備軍の対象者について日々送信されるセンシングデータを常時監視し、その中で異常を検知すると、直ちに医療機関等にフィードバックする。
Further, in the “daily human dock” mechanism, the
また、「二次利用」について説明すると、例えば、PHR処理装置100が、PHRビッグデータの解析の結果を医療機関や各種企業等に提供することで、様々なサービスへの二次利用や、新産業創出に貢献することができる。具体例については、後述する。
Further, “secondary use” will be described. For example, the
こうして、図1に示すように、例えば、5〜10年後には、モチベーション向上社会が実現される。図1では、モチベーション向上社会を実現するための技術のキーワードとして、「バーチャルクローン」、「将来の健康リスクのお知らせ」、及び「家族見守りサービス」を挙げている。このうち、「バーチャルクローン」及び「将来の健康リスクのお知らせ」は、「一次利用」の例である。また、「家族見守りサービス」は、「二次利用」の例である。 Thus, as shown in FIG. 1, for example, a society with improved motivation is realized after 5 to 10 years. In FIG. 1, “virtual clone”, “notice of future health risks”, and “family watching service” are listed as technical keywords for realizing a motivated society. Of these, “virtual clone” and “notice of future health risks” are examples of “primary use”. The “family watching service” is an example of “secondary use”.
例えば、PHR処理装置100は、各対象者に「バーチャルクローン」を設定し、「バーチャルクローン」に基づく健康づくりを実現している。例えば、PHR処理装置100は、各対象者に対して、「バーチャルクローン」として、将来の健康状態から予測される特徴的な風貌を自分の顔や容姿に反映させた自己像を提示することで、直感的に、現状生活の及ぼす、X年後の自分の将来像を表示させることができる。なお、「バーチャルクローン」には、理想の自己像を設定することもできる。また、本実施形態において、「バーチャルクローン」は、「将来の健康リスクのお知らせ」の中で提示される。
For example, the
また、例えば、PHR処理装置100は、各対象者に、「将来の健康リスクのお知らせ」を提示する。この「将来の健康リスクのお知らせ」では、仮想的な家族や、上述した仮想的な自己像(バーチャルクローン)が映し出される。また、「将来の健康リスクのお知らせ」では、理想的に設計した自分との乖離度や、今の生活を続けた場合の将来の自分の姿を映し出し、理想に向けた指導もしてくれる。また、「将来の健康リスクのお知らせ」を見る者は、仮想的な人物や家族との対話を図ることで、常時励ましや元気づけ、健康指導を受けることができ、意欲・気力が高揚し、理想の自己実現に向けた取り組み意欲を向上させることができる。即ち、対象者は、この「将来の健康リスクのお知らせ」を通して、医師や家族(若しくは、仮想の家族)、友達(仮想の友達)や恋人(仮想の恋人)の指導や激励を受けて、やる気をアップすることができる。更に、「将来の健康リスクのお知らせ」では、健康度を確認することもできる。
For example, the
また、例えば、本実施形態では、二次利用サービスの一例として「家族見守りサービス」を実現する。この「家族見守りサービス」によれば、離れた家族をいつでも見守ることができる。ユビキタスなライフログ情報は、離れた病気がちの独居高齢者が、きちんと食事や薬を服用し、つつがなく過ごしていることを、その家族が手に取るように分かるための見守り、コミュニケーションを図る絆ツールとしても活用でき、体調が悪い時は知らせてくれる。その結果、身内に遠慮や気遣いをして無理な我慢や気丈な振る舞いをしたがために、周囲が発症に気づかずに見過して手遅れとなるようなことも防げ、家族の心配や不安までをも和らげてくれる。家族や社会との絆が強化されるばかりでなく、活気ある高齢化社会における自身の強化にもつながる。 Further, for example, in the present embodiment, a “family watching service” is realized as an example of the secondary usage service. According to this “family watching service”, a distant family can be watched at any time. The ubiquitous life log information is a bond tool for monitoring and communicating so that the elderly who are living alone who are distantly ill can take their meals and drugs properly and understand that they are spending their lives. It can also be used as a reminder when you are not feeling well. As a result, he / she was reluctant and caring about his relatives, and he was unable to be overlooked without noticing the onset of his surroundings. Will also ease. This not only strengthens ties with families and society, but also strengthens itself in a vibrant aging society.
更に、図1では図示を省略しているが、本実施形態によれば、努力目標への到達度、競い合う友人の将来像との比較機能、それらのSNS(Social Networking Service)等による公開機能、報償としての地域通貨ポイント付与等の機能によって、例えば、ポイント獲得を目標に、更に、皆の意欲を向上させることができる。また、本実施形態によれば、病気持ちの人にとっては、常時病状が見守られ、発作の予兆が検知され、体調が悪い時や緊急時にはすぐに介助者や救護者が駆けつけ、心身のケアをしてくれる。 Further, although not shown in FIG. 1, according to the present embodiment, the degree of achievement of the effort goal, the function of comparing with the future image of competing friends, the public function by their SNS (Social Networking Service), etc. With functions such as giving local currency points as rewards, for example, it is possible to improve everyone's motivation with the goal of earning points. In addition, according to the present embodiment, for a sick person, a medical condition is always observed, a sign of a seizure is detected, and a caregiver or rescuer rushes immediately in case of a bad physical condition or emergency, and care for the mind and body. Willing to.
例えば、上述してきた「日常人間ドック」を誰もが活用できれば、自分や家族の心身の状態や行動、生活の状況を把握し、管理することができ、誰もが、病気の発症を遠ざける先制医療・個別化予防を享受できるようになる。その結果、理想的な自己目標も明確化され、健全な心身の実現に向けて意欲が高揚し、理想自己実現による達成感は、生きることへのモチベーションを高め、一人一人が強くなることができる。また、「家族見守りサービス」によれば、離れた家族の心身の状態や、行動、生活状況を具体的に把握できることで、不安と心配から解放され、自分と家族の絆を常に身近に感じることで、安心安寧な社会を実現することができる。それは現在十分ではない、日々のきめ細やかな健康維持、食事や体調の管理、高齢者や子供の見守りを支援し、家族と社会の強い絆を取り戻し、健全快活で安心安寧な生活が送れる夢の社会像でもある。このようなモチベーション向上社会が実現すれば、現代社会に蔓延していた、不安、うつ、ストレス、脳疾患、心疾患からも解放される。 For example, if anyone can use the “daily human dock” mentioned above, it is possible to grasp and manage the state of mind and behavior of the person and family, and the situation of life, and everyone can preempt medical care that keeps away the onset of illness.・ Enjoy personalization prevention. As a result, ideal self-targets are also clarified, motivation for realizing a healthy mind and body is enhanced, and a sense of achievement through ideal self-realization can increase motivation to live and each person can become stronger. . In addition, according to the “Family Watch Service”, it is possible to be able to grasp the mental and physical conditions, behaviors and living conditions of a distant family, so that you can be freed from anxiety and worries and always feel close to yourself and your family. So we can realize a safe and secure society. It is not enough at present, a dream of being able to live a healthy, cheerful and safe life, supporting daily fine-grained health maintenance, diet and physical condition management, supporting the elderly and children, regaining strong bonds between family and society It is also a social image. If such a motivated society is realized, it will be freed from anxiety, depression, stress, brain disease and heart disease that have prevailed in modern society.
上述したように、「日常人間ドック」を活用することで実現される「バーチャルクローン」、「将来の健康リスクのお知らせ」及び「家族見守りサービス」などが提供されるモチベーション向上社会は、個人の生きることへのモチベーションを高め、一人一人を強くすることができる。さらに、多数の人が「日常人間ドック」を活用して、膨大なPHRビッグデータが蓄積されることで、様々なサービスへの二次利用や新産業の創出を導き、幅広い分野においてイノベーションが連鎖していくことが期待される。本実施形態では、このようなヘルスケアのソリューションシステムの構築が可能となる。 As mentioned above, a motivated society where “virtual clones”, “notice of future health risks” and “family watching services” that are realized by utilizing “daily human docks” are provided by individuals. You can increase your motivation and strengthen each person. In addition, many people use the “daily human dock” to accumulate huge amounts of PHR big data, leading to secondary use for various services and the creation of new industries. It is expected to continue. In the present embodiment, such a health care solution system can be constructed.
図2Aは、本実施形態の一例を説明するための図である。図2Aに示すように、本実施形態におけるソリューションシステムは、DNAチップ・ゲノム配列情報活用基盤に基づく生体情報や、リアルタイムのライフログである行動情報、脳とこころのチェックなどによる健康(セルフ)チェックが実施され、ヘルスケアクラウド10に情報が集約される。例えば、ユーザAについて、病院や診療所から電子カルテの情報などが集約される。また、ユーザAについて、企業や健康保険におけるレセプト情報、勤労情報、健康診断結果などが集約される。また、研究機関や大学からコホートデータやシーケンスデータなどが集約される。そして、ユーザAから非意識で収集されたセンシングデータが集約される(図中PHR入力)。
FIG. 2A is a diagram for explaining an example of the present embodiment. As shown in FIG. 2A, the solution system according to the present embodiment includes biological information based on a DNA chip / genome sequence information utilization platform, behavior information that is a real-time life log, and health (self) check by checking the brain and mind. Is implemented, and information is collected in the
このようなパーソナルヘルスレコード(PHR)は、ユーザ(例えば、ユーザA)ごとに管理され、多数の人のPHRが集約されたPHR群がPHRビッグデータとしてヘルスケアクラウド10で管理される。これらPHRビッグデータは、データ信託銀行(データ信託会社とも呼ぶ)によって運用管理される。例えば、データ信託銀行は、PHRビッグデータを解析(ビッグデータ解析)することで、PHRデータの解析データに基づく、各個人の将来予測や、ライフスタイルの提案を可能にする。一例を挙げると、ライフサポートを行なう健康コンシェルジュであるかかりつけ医がPHRデータの解析データに基づくライフスタイルの提案を行なったり、解析データに基づいて「バーチャルクローン」や、「将来の健康リスクのお知らせ」を提供したりする。すなわち、PHRデータを入力したデータに対して、本人の体質及びライフスタイルを反映した元気予報、ライフスタイル変革、リスク診断などの個別の健康指導をフィードバックすることができる。
Such a personal health record (PHR) is managed for each user (for example, user A), and a PHR group in which PHRs of many people are aggregated is managed as PHR big data in the
ユーザは、PHRデータを入力するインセンティブとして、上記フィードバックを授受することができることから、継続してPHRデータを入力するようになる(PHRデータ入力の常態化)。さらに、ユーザがそれらPHRデータの二次利用を許諾するようになれば、データ信託銀行は、管理するPHRデータ、或いは、解析データを各種メーカーや、販売・流通業者に販売やアクセス権を付与することが可能になる。ここで、PHRデータ及び解析データは、慎重な取り扱いが求められる個人情報であることから、図示するように、必要に応じて匿名化させる。 Since the user can send and receive the feedback as an incentive to input PHR data, the user continues to input PHR data (normalization of PHR data input). Furthermore, if the user permits the secondary use of these PHR data, the data trust bank gives the manufacturers and sales / distributors the right to sell and access the PHR data or analysis data to be managed. It becomes possible. Here, since the PHR data and the analysis data are personal information that requires careful handling, the PHR data and the analysis data are anonymized as necessary as illustrated.
PHRデータや解析データの提供を受ける各種メーカーや、販売・流通業者としては、例えば、「セキュリティ」、「製薬」、「食品」、「化粧品」などが挙げられ、各種メーカーや、販売・流通業者は、提供を受けたPHRデータや解析データなどのヘルスケア情報に基づいて、高付加価値な製品開発や、サービス提供を行なうことが可能となる。ここで、各種メーカーや、販売・流通業者によって行なわれる製品開発や、サービスは、例えば、医薬品の開発や、薬事法上の承認を得るために行われる臨床試験(治験)、或いは、映画や番組の視聴者から身体に現れた生体情報を集めるといった単なるマーケティングなど、非常に幅広い分野に亘る。本実施形態のソリューションシステムは、このような幅広い分野で利用され、各分野において、イノベーションの連鎖を引き起こすことが可能である。 Examples of various manufacturers and distributors that receive PHR data and analysis data include "security", "pharmaceuticals", "food", and "cosmetics". Various manufacturers, distributors and distributors Can develop high-value-added products and provide services based on healthcare information such as PHR data and analysis data provided. Here, product development and services carried out by various manufacturers and distributors / distributors include, for example, drug development, clinical trials (clinical trials) to obtain approval under the Pharmaceutical Affairs Law, movies and programs It covers a very wide range of fields, such as mere marketing that collects biological information that appears in the body from viewers. The solution system of the present embodiment is used in such a wide field, and it is possible to cause a chain of innovation in each field.
また、本実施形態のソリューションシステムは、各個人が「日常人間ドック」を活用することで、その人向けの新規センサを構築して提供したり(例えば、ユーザのゲノム情報やライフスタイルの情報に基づいて、その人に最適なセンサを提供)、PHRデータの解析データから新たなDNAチップの開発を促進させたりすることも可能である。 In addition, the solution system of the present embodiment enables each individual to construct and provide a new sensor for the individual by utilizing the “daily human dock” (for example, based on the user's genome information and lifestyle information). It is also possible to promote the development of a new DNA chip from the analysis data of the PHR data.
(本実施形態の概要)
本実施形態では、まず、ゲノム情報を含むPHRデータをヘルスケアクラウド10上に集約して大規模ゲノム・コホートデータベース114aを形成し、この大規模ゲノム・コホートデータベース114aに蓄積されたPHRビッグデータを基盤データとすることで、将来の健康リスク(例えば、各疾病の発症確率)を精度良く推定する仕組みを構築する。また、個人のPHRデータを、各方面から継続的に収集して一元管理することで、この個人に対して、本人の体質及びライフスタイルを反映した個別の健康指導をフィードバックする仕組み(日常人間ドック)を構築する。更に、ヘルスケアクラウド10上に集約されたPHRビッグデータの二次利用(他人のための利用や商業的利用)の仕組みを構築する。
(Outline of this embodiment)
In this embodiment, first, PHR data including genome information is aggregated on the
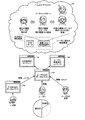
図2Bは、本実施形態の概要を説明するための図である。図2Bに示すように、ヘルスケアクラウド10上にPHR処理装置100(「健康情報処理装置」とも呼ばれる)が構築され、PHR処理装置100が、上述した各種の仕組みを実現する。なお、図2Bに示すように、PHR処理装置100のオペレーションを含むヘルスケアクラウドサービスの運用管理は、データ信託会社11によって行われる。例えば、データ信託会社11は、一次利用サービス(日常人間ドック)の提供を受けるユーザや医療機関13、二次利用サービスの提供を受ける医療機関や各種企業等15に対して、サービス提供のための各種手続きを、オンライン若しくはオフラインで行う(図2Bの点線を参照)。
FIG. 2B is a diagram for explaining the outline of the present embodiment. As shown in FIG. 2B, a PHR processing device 100 (also referred to as a “health information processing device”) is constructed on the
PHR処理装置100は、PHRデータの収集及び蓄積を行うPHR蓄積部110と、PHR蓄積部110に蓄積されたPHRデータの運用管理を行うPHR運用管理部120とを備える。
The
PHR蓄積部110は、個人のみならず、研究機関、医療機関、企業等からも、この個人に関するPHRデータ(図2Bにおいて、PHRデータ12)を収集し、これを個人のPHRデータとして集約、個別に一元管理する。例えば、PHRデータには、個人から継続的に収集されるライフログ情報の他、研究機関から得られる本人のゲノム情報、医療機関から得られる電子カルテ情報、企業や健康保険組合から得られる健康保険組合情報(レセプト情報、勤務情報、検診手帳情報)、母子手帳情報、学校の健康診断の情報等がある。即ち、PHRデータは、個人の健康に関連する情報として、個人のみならず各種機関等から収集されるものであり、その種類に限定はない。また、PHR蓄積部110は、かかるPHRデータを大規模に収集し(例えば、15万人規模)、大規模ゲノム・コホートデータベース114aを形成する。この大規模ゲノム・コホートデータベース114aは、各個人については、新たな情報が日々蓄積されることでその規模を拡大し、また、収集対象者の範囲を拡大することでもその規模を拡大する。なお、以下では、大規模ゲノム・コホートデータベース114aのPHRデータ全体を意味する場合には、これを「PHRビッグデータ」と呼び、個人のPHRデータと区別する。また、PHRデータは、「健康情報」とも呼ばれる。
The
PHR運用管理部120は、PHRビッグデータ解析部121と、一次利用サービス提供部122(「推定部」とも呼ばれる)と、二次利用サービス提供部123(「出力部」とも呼ばれる)とを備える。PHRビッグデータ解析部121は、所定の目的に従って、大規模ゲノム・コホートデータベース114aに蓄積されたPHRビッグデータを解析し、ゲノム情報と、ライフスタイルと、健康リスクとの関連性を導き出す。そして、PHRビッグデータ解析部121は、個人の体質及びライフスタイルの組み合わせとの何らかの関連性が示された解析結果を得る。
The PHR
例えば、PHRビッグデータ解析部121は、PHRビッグデータを対象にコホート分析を行い、ゲノムの型及びライフスタイルの型の組み合わせと、将来発症し得る疾病のリスク(「疾病発症リスク」と呼ばれる)との関連性を導き出す。すると、一次利用サービス提供部122は、PHRビッグデータ解析部121によって導き出されたこの関連性を各個人のPHRデータに適用することで、本人の体質及びライフスタイルに応じた疾病発症リスクを割り出す。そして、一次利用サービス提供部122は、割り出した疾病発症リスクの情報をユーザのポータルサイト14aに登録する等して本人へのフィードバックを行う。このポータルサイト14aは、本人の他、家族及び主治医による閲覧が可能であり、ポータルサイト14aを通じて3者間でコミュニケーションを図ることができる。これが、本実施形態における「日常人間ドック」の概要である。「日常人間ドック」の詳細については、後述する。
For example, the PHR big
また、例えば、PHRビッグデータ解析部121は、PHRビッグデータを対象にコホート分析を行い、二次利用サービス用の解析結果を導き出す。また、二次利用サービス提供部123は、PHRビッグデータ解析部121によって導き出された解析結果を出力し、各種企業等(医療機関、食品・サプリメント販売会社、製薬会社、医療機器メーカー、流通会社、セキュリティ会社等)に提供する。二次利用サービスの具体例については、後述する。
For example, the PHR big
また、図2Bに示すように、ユーザやユーザの家族等の関係者、ユーザの主治医は、PHR表示装置200(「健康情報表示装置」とも呼ばれる)によって、例えば、一次利用サービス提供部122によって提供されるポータルサイト14aを閲覧する。PHR表示装置200は、スマートフォン、PC(Personal Computer)、インターネットテレビ、装着型情報端末等である。また、PHR表示装置200は、表示制御部210と、表示部220とを備え、表示制御部210は、ユーザの将来の健康リスクを表示部220に表示する。
Also, as shown in FIG. 2B, the user, the user's family and other related parties, and the user's attending physician are provided by the PHR display device 200 (also referred to as “health information display device”), for example, by the primary use
(PHRデータ)
次に、図3は、本実施形態におけるPHRデータを説明するための図である。上述したように、PHRデータは、個人の健康に関連する情報として個人のみならず各種機関等から収集されるものであり、その種類に限定はない。したがって、本実施形態では、PHRデータとして何の情報を収集するかという点も個人毎に異なると考える。もっとも、以下に説明するように、本実施形態の「日常人間ドック」では、個人のPHRデータから本人のライフスタイルの型を割り出す。また、このライフスタイルの型は、本実施形態では、10の項目(喫煙、飲酒、睡眠、ストレス、運動、食生活、薬・サプリメント、精神状態、疲れ、免疫)を評価することで割り出される。よって、本実施形態では、この10の項目を評価することが可能なPHRデータが、各個人から収集されることを想定する。なお、図3では、ユーザAのPHRデータのうち、ゲノム情報及びライフログ情報のみを概念的に示す。
(PHR data)
Next, FIG. 3 is a diagram for explaining PHR data in the present embodiment. As described above, the PHR data is collected not only from individuals but also from various institutions as information related to the health of individuals, and the type is not limited. Therefore, in the present embodiment, what information is collected as PHR data is considered to be different for each individual. However, as described below, in the “daily human dock” of this embodiment, the lifestyle type of the person is determined from the personal PHR data. In this embodiment, the lifestyle type is determined by evaluating 10 items (smoking, drinking, sleep, stress, exercise, diet, medicine / supplement, mental state, fatigue, immunity). . Therefore, in this embodiment, it is assumed that PHR data that can evaluate these 10 items is collected from each individual. FIG. 3 conceptually shows only genome information and life log information in the PHR data of user A.
まず、ゲノム情報は、ユーザAの遺伝情報である。図3に示すように、細胞の核の中には染色体が存在し、この染色体を構成するデオキシリボ核酸(Deoxyribonucleic acid)という物質がDNAである。DNAは、その構成単位であるヌクレオチドが鎖状に連なるとともに、2本の鎖による2重螺旋構造となっている。また、遺伝子は、DNA上の区画である。ヌクレオチドは、デオキシリボース糖がリン酸によって連結されたものであり、デオキシリボース糖に、4種類の塩基のうちのいずれかが結合する。2本の鎖の間では、アデニン(A)とチミン(T)との塩基対、グアニン(G)とシトシン(C)との塩基対が結合される。ヒトのゲノム情報は、約30億塩基対から構成される。 First, genome information is genetic information of user A. As shown in FIG. 3, a chromosome exists in the nucleus of the cell, and a substance called deoxyribonucleic acid that constitutes the chromosome is DNA. DNA has a double-helical structure with two strands, as well as a series of nucleotides that are the structural unit. A gene is a compartment on DNA. Nucleotides are those in which deoxyribose sugars are linked by phosphoric acid, and any one of four types of bases binds to deoxyribose sugars. Between the two chains, a base pair of adenine (A) and thymine (T) and a base pair of guanine (G) and cytosine (C) are bound. Human genome information is composed of about 3 billion base pairs.
本実施形態において、ゲノム情報は、この約30億塩基対の配列情報、若しくは、ヒトの個性を決定する約100万塩基対の配列情報である。なお、PHR蓄積部110は、塩基対の配列情報をそのまま蓄積してもよいし、あるいは、標準ゲノム情報(例えば、日本人の標準SNP(Single Nucleotide Polymorphism))との差分の形で蓄積してもよい。例えば、ユーザAが研究機関に自身の血液を提供し、研究機関にてユーザAから抽出されたゲノムの全塩基配列(配列情報)が特定された場合、その配列情報を、ユーザAのゲノム情報として取り扱う。
In the present embodiment, the genome information is about 3 billion base pairs of sequence information or about 1 million base pairs of sequence information that determines human personality. The
なお、ゲノム情報は、上述した配列情報に限られるものではなく、DNAチップ等想定される種々の手法による解析結果も含む。例えば、ユーザAが研究機関に自身の血液を提供し、研究機関にてDNAチップによる解析が行われた場合、その解析結果を、ユーザAのゲノム情報として取り扱う。例えば、DNAチップによるSNP解析、CNV(Copy Number Variation)解析、マイクロサテライト解析、エピゲノム解析、あるいは遺伝子発現量解析等によって、特定の疾病(例えば、高血圧、高脂血症、肥満、糖尿病等)に関する遺伝子の型や、特定の薬剤の代謝、アルコール分解に関する遺伝子の型が判明した場合には、その解析結果が、ユーザAのゲノム情報となる。 The genome information is not limited to the above-described sequence information, and includes analysis results obtained by various methods such as a DNA chip. For example, when user A provides his / her blood to a research institution and analysis is performed using a DNA chip at the research institution, the analysis result is handled as user A's genome information. For example, SNP analysis using a DNA chip, CNV (Copy Number Variation) analysis, microsatellite analysis, epigenome analysis, gene expression level analysis, etc., for specific diseases (eg, hypertension, hyperlipidemia, obesity, diabetes, etc.) When the type of gene, the type of gene related to metabolism of a specific drug, or alcohol degradation is found, the analysis result becomes the genome information of the user A.
次に、ライフログ情報は、ユーザAのライフスタイル(生活様式)を表す情報である。図3に示すように、本実施形態では、生体情報及び行動情報を合わせてライフログ情報と呼び、必要に応じてその両者が関連付けられることで、正確なライフログ情報を得ることができると考える。 Next, the life log information is information representing the lifestyle (lifestyle) of the user A. As shown in FIG. 3, in this embodiment, biological information and action information are collectively referred to as life log information, and it is considered that accurate life log information can be obtained by associating both as necessary. .
ここで、図3を用いて、生体情報である「血圧」と、行動情報である「運動量」及び「行動履歴」とが関連付けられることで、正確なライフログ情報が得られる点を説明する。例えば、ユーザAは、生体センサと、加速度センサとを装着しているものとする。これらのセンサは、後述する装着型情報端末に備えられてもよいし、装着型情報端末とは別に、ユーザAに装着(例えば、貼付)されてもよい。生体センサは、例えば、指、手首、耳等の末梢血管における血流変化を検出し、検出した血流変化に基づいて、血圧、心拍数、脈拍等を得る。一方、加速度センサは、直流成分から、ユーザの姿勢を検知し、交流成分から、ユーザの動作(歩行、走行、自転車で移動中、自動車で移動中、電車で移動中等)を識別する。そして、加速度センサは、ユーザの姿勢とユーザの動作とから、ユーザの運動量を得る。更に、行動履歴は、装着型情報端末、若しくは、スマートフォン、PC等の情報端末に入力されたスケジュール情報から得られる。 Here, with reference to FIG. 3, a description will be given of how accurate life log information can be obtained by associating “blood pressure” as biological information with “exercise amount” and “behavior history” as behavior information. For example, it is assumed that the user A is wearing a biological sensor and an acceleration sensor. These sensors may be provided in a wearable information terminal described later, or may be worn (for example, attached) to the user A separately from the wearable information terminal. The biometric sensor detects blood flow changes in peripheral blood vessels such as fingers, wrists, and ears, and obtains blood pressure, heart rate, pulse, and the like based on the detected blood flow changes. On the other hand, the acceleration sensor detects the user's posture from the DC component, and identifies the user's action (walking, running, moving by bicycle, moving by car, moving by train, etc.) from the AC component. The acceleration sensor obtains the user's momentum from the user's posture and the user's motion. Furthermore, the action history is obtained from schedule information input to a wearable information terminal or an information terminal such as a smartphone or a PC.
そして、本実施形態において、生体センサから得られた生体情報、及び、加速度センサやその他の情報端末から得られた行動情報は、それぞれの情報が有する時間情報によって関連付けられるか、若しくは、それぞれの情報が同じレコードに記録されることで、関連付けられる。改めて図3を参照すると、例えば、生体情報である血圧は、日中に一旦上昇しているが、この生体情報と関連付けられた行動履歴を参照すると、この上昇は、会議を起因とするストレスによるものであることが判明する。また、同じく血圧は、夕方以降に下降しているが、この生体情報と関連付けられた行動履歴を参照すると、この下降は、飲酒によるものであることが判明する。更に、血圧と運動量との関連も、明らかとなる。 In the present embodiment, the biological information obtained from the biological sensor and the behavior information obtained from the acceleration sensor and other information terminals are associated with each other by time information included in each information, or each information Are related by being recorded in the same record. Referring to FIG. 3 again, for example, the blood pressure, which is biometric information, once rises during the day. However, when the action history associated with this biometric information is referred to, this rise is due to stress caused by the meeting. It turns out to be a thing. Similarly, the blood pressure has been lowered after the evening, but when the behavior history associated with this biological information is referred to, it is found that this drop is due to drinking. Furthermore, the relationship between blood pressure and exercise is also clarified.
このように、本実施形態においては、生体情報及び行動情報を、相互に関連付けて取り扱うことを基本としている。なお、本実施形態において、PHR処理装置100は、ライフスタイルの型や現在の健康状態の評価に必要な情報を、収集すべき生体情報及び行動情報として適宜選択することになる。例えば、生体情報は、現在の健康状態を表す各種数値情報や、体内に取り込まれた成分の量、物質の有無を表す情報である。例えば、生体情報は、血圧、心拍数、脈拍、体温、体成分、イオン、pH濃度等である。また、例えば、生体情報は、糖分、塩分等の成分量、胃酸の濃度、農薬、環境物質、食品添加物の有無、アルコールやニコチン、薬剤成分の摂取量等である。また、例えば、行動情報は、運動量や睡眠量、スケジュール情報、GPS(Global Positioning System)等の位置情報である。本実施形態では、かかるライフログ情報の全部若しくは一部を、センサや各種情報端末から収集する。また、例えば、スマートフォン(運動系アプリケーション、スケジュールアプリケーション等)や、SNS、電子レシート等から得られた情報を用いてもよい。
Thus, in this embodiment, it is based on handling biometric information and action information in association with each other. In the present embodiment, the
図4は、本実施形態におけるライフログ情報の収集を説明するための図である。本実施形態においては、一例として、ユーザが、装着型情報端末を装着していることを想定する。装着型情報端末としては、例えば、腕時計型のものや、眼鏡型のもの、指輪型のもの等が考えられる。この装着型情報端末は、センサとしての機能を備えて生体情報を収集することができる。また、この装着型情報端末は、いわゆる情報端末としての機能も備えて、行動情報を収集することもできる。そこで、装着型情報端末は、ライフログ情報のドックとしての役割を果たし、図4に示すように、ユーザから個別に収集された生体情報と行動情報との関連付け(ペアリング)を行い、ペアリング後のライフログ情報を、ヘルスケアクラウド10にアップロードする。個別に収集される生体情報や行動情報は、1日の中で定期的あるいは不定期に収集される一方で、ヘルスケアクラウド10へのアップロードは、例えば1日に1回といった頻度で行われる。また、この装着型情報端末は、装着型情報端末とは別にユーザに装着されたセンサや情報端末から、生体情報や行動情報を受信することもできる。この場合も、装着型情報端末は、ユーザから個別に収集された生体情報と行動情報との関連付け(ペアリング)を行い、ペアリング後のライフログ情報を、ヘルスケアクラウド10にアップロードする。なお、ペアリングは、装着型情報端末の側ではなく、ヘルスケアクラウド10側で行われてもよい。
FIG. 4 is a diagram for explaining the collection of life log information in the present embodiment. In this embodiment, as an example, it is assumed that the user is wearing a wearable information terminal. As the wearable information terminal, for example, a wristwatch type, a glasses type, a ring type, or the like can be considered. This wearable information terminal has a function as a sensor and can collect biological information. The wearable information terminal also has a function as a so-called information terminal, and can collect behavior information. Therefore, the wearable information terminal serves as a dock for life log information, and as shown in FIG. 4, the biometric information and behavior information collected individually from the user are associated (paired), and pairing is performed. Later life log information is uploaded to the
更に、本実施形態において、装着型情報端末は、個人認証を行う。即ち、装着型情報端末は、当該端末を装着している者が確かに本人であるか否かの個人認証を行う。例えば、腕時計型の場合、装着型情報端末は、手首の静脈認証によって個人認証を行う。また、例えば、カメラを備えている場合、装着型情報端末は、顔認証によって個人認証を行う。また、例えば、眼鏡型の場合、装着型情報端末は、網膜認証や虹彩認証によって個人認証を行う。また、例えば、指輪型の場合、装着型情報端末は、指の静脈認証によって個人認証を行う。なお、個人認証の手法は、上述した手法に限られるものではない。なお、本実施形態では、装着型情報端末からライフログ情報をアップロードする手法を説明したが、実施形態はこれに限られるものではない。例えば、携帯型情報端末や、据付型情報端末から、ライフログ情報をアップロードしてもよい。 Furthermore, in this embodiment, the wearable information terminal performs personal authentication. That is, the wearable information terminal performs personal authentication as to whether or not the person wearing the terminal is indeed the person. For example, in the case of a wristwatch type, the wearable information terminal performs personal authentication by wrist vein authentication. For example, when a camera is provided, the wearable information terminal performs personal authentication by face authentication. In addition, for example, in the case of a glasses type, the wearable information terminal performs personal authentication by retina authentication or iris authentication. For example, in the case of a ring type, the wearable information terminal performs personal authentication by finger vein authentication. Note that the method of personal authentication is not limited to the method described above. In addition, although this embodiment demonstrated the method of uploading life log information from a wearable information terminal, embodiment is not restricted to this. For example, life log information may be uploaded from a portable information terminal or a stationary information terminal.
(PHRビッグデータの解析及び解析結果を用いた健康リスクの推定)
続いて、大規模ゲノム・コホートデータベース114aのPHRビッグデータを対象に行われるコホート分析を説明する。ここで、上述したように、本実施形態では、健康状態の評価や健康リスクの推定を精度良く行うために、大規模ゲノム・コホートデータベース114aを形成し、これを基盤データとする。例えば、PHRビッグデータ解析部121は、後述するコホート分析において、生まれてから亡くなるまでの一生涯のPHRデータの中で、疾病発症から転帰、その際の生活や環境に関する情報との紐付けを行う。また、例えば、PHRビッグデータ解析部121は、後述するコホート分析において、特定地域コホートについて長期間の追跡調査を行い、更に他地域コホートとの間で比較解析を行い、地域間の差を検討する。このような解析は、大規模ゲノム・コホートデータベース114aを対象とするからこそ実現可能であり、小規模なものではその実現は困難であり、特定の疾患を対象にしたもの等に限局される。更に、本実施形態において、PHRビッグデータに含まれるライフログ情報は、センシング技術等によって収集されたものであるので、従来の問診による回答とは異なり正確且つ精密な解析が可能となる。なお、大規模ゲノム・コホートデータベース114aが形成されることで、更には、日本人の低頻度アレルの取得、網羅的な日本人のオリジナルの標準SNPデータベースの構築、タイピングアレイの標準化等も可能となる。
(Analysis of PHR big data and estimation of health risk using analysis results)
Next, cohort analysis performed on PHR big data in the large-scale genome /
さて、本実施形態において、PHRビッグデータ解析部121は、大規模ゲノム・コホートデータベース114aに蓄積されたPHRビッグデータを対象にコホート分析を行い、ゲノムの型及びライフスタイルの型の組み合わせと、健康リスク(即ち、疾病発症リスク)との関連性を導き出す。
In the present embodiment, the PHR big
ここで、本実施形態におけるコホート分析とは、特定の要因に曝露された集団(特定のゲノムの型及びライフスタイルの型の組み合わせにあてはまる集団)と曝露されていない集団(その組み合わせにあてはまらない集団)とを一定期間追跡し、所定の疾病の発症確率を比較することで、要因(特定のゲノムの型及びライフスタイルの型の組み合わせ)と、疾病発症との関連性を導き出す手法である。例えば、PHRビッグデータ解析部121は、大規模ゲノム・コホートデータベース114aに蓄積される健常者の標準データ、健常者と未病者との乖離データ、健常者と発症者との乖離データ、ライフログ情報上の異常サイン等を類型化し、ゲノムの型との関連性を明らかにする。なお、PHRビッグデータ解析部121が解析に用いる手法は、上述したコホート分析に限られるものではなく、他の手法でもよい。
Here, the cohort analysis in the present embodiment refers to a group exposed to a specific factor (a group that applies to a combination of a specific genome type and lifestyle type) and a group that is not exposed (a group that does not correspond to that combination). ) For a certain period of time and comparing the onset probability of a predetermined disease to derive a relationship between a factor (a combination of a specific genome type and a lifestyle type) and the onset of the disease. For example, the PHR big
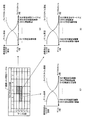
図5は、本実施形態におけるPHRビッグデータの解析を説明するための図である。図5に示すように、大規模ゲノム・コホートデータベース114aは、各個人のPHRデータであるライフログ情報等が日々新たに蓄積されるとともに、新たな個人のPHRデータが新たな運用管理の対象として蓄積されることで、その規模を日々拡大している。なお、この大規模ゲノム・コホートデータベース114aには、例えば、個人の一生涯のPHRデータが蓄積されるので、見方を変えると、健常者、未病者、及び発症者のPHRデータが蓄積されることになる。
FIG. 5 is a diagram for explaining analysis of PHR big data in the present embodiment. As shown in FIG. 5, in the large-scale genome /
図5に示すように、PHRビッグデータ解析部121は、この大規模ゲノム・コホートデータベース114aを対象にコホート分析を行い、ゲノムの型及びライフスタイルの型の組み合わせ毎に健康リスクを推定する、「健康リスク推定テーブルT」を作成する。なお、上述したように、PHR蓄積部110は、PHRデータを新たに蓄積することで、大規模ゲノム・コホートデータベース114aの規模を拡大する。そこで、PHRビッグデータ解析部121は、大規模ゲノム・コホートデータベース114aの日々の拡大に伴い、新たに解析を行い、新たな解析結果である「健康リスク推定テーブルT」を得る。一次利用サービス提供部122は、新たに得られた解析結果を用いて健康リスクを推定する。このため、「健康リスク推定テーブルT」の精度は日々向上し、一次利用サービス提供部122による健康リスクの推定の精度も日々向上する。
As shown in FIG. 5, the PHR big
まず、本実施形態において、PHRビッグデータ解析部121は、30億塩基対のうちの1つの塩基対若しくは複数の塩基対の組み合わせパターン、又は、ヒトの個性を表すとされる100万塩基対のうちの1つの塩基対若しくは複数の塩基対の組み合わせパターンを、ゲノムの型とする。
First, in the present embodiment, the PHR big
また、図6は、本実施形態におけるライフスタイルの型を説明するための図である。図6に示すように、PHRビッグデータ解析部121は、ライフログ情報から得られる10の項目を、「レベルI」から「レベルIII」までの3段階に分類し、それら全ての組み合わせ(例えば、3の10乗分の組み合わせ)のパターンを、ライフスタイルの型とする。なお、本実施形態におけるライフスタイルの型は一例に過ぎず、項目やレベルを任意に変更することができる。また、ライフスタイルの型の導き方自体も、任意に変更することができる。
FIG. 6 is a diagram for explaining a lifestyle type in the present embodiment. As shown in FIG. 6, the PHR big
このようなことから、ゲノムの型及びライフスタイルの型の組み合わせの数は、膨大な数となるが、PHRビッグデータ解析部121によるコホート分析によって疾病発症との関連性が明らかになる型の組み合わせは、当初、その一部に留まると考えられる。大規模ゲノム・コホートデータベース114aの日々の拡大や、その他個別に進む研究の成果等が徐々に反映されることで、疾病発症との関連性が明らかになる型の組み合わせは、徐々に増え、健康リスク推定テーブルT内の空欄も、徐々に結果を反映して埋められていく。
For this reason, the number of combinations of genome types and lifestyle types is enormous, but the combination of types whose relevance to disease onset is revealed by cohort analysis by the PHR big
さて、コホート分析にあたり、PHRビッグデータ解析部121は、ライフログ情報に基づいて10の項目を導き出すためのアルゴリズムを、予め保持している。例えば、PHRビッグデータ解析部121は、生体情報としてセンサから得られた「ニコチンの摂取量」から、ユーザの喫煙の有無や、どの程度喫煙したかといった喫煙のレベルを導き出す。また、例えば、PHRビッグデータ解析部121は、生体情報としてセンサから得られた「アルコールの摂取量」から、ユーザの飲酒の有無や、どの程度飲酒したかといった飲酒のレベルを導き出す。また、例えば、PHRビッグデータ解析部121は、生体情報としてセンサから得られた「心拍数」や、行動情報としてスマートフォンから得られた「アラームの設定を行った時刻」及び「アラームの時刻」、その他、センサから得られた生活音等から、ユーザの睡眠時間や睡眠の質といった睡眠のレベルを導き出す。
Now, in cohort analysis, the PHR big
また、例えば、PHRビッグデータ解析部121は、生体情報としてセンサから得られた「血圧」、「心拍数」や、行動情報としてスマートフォンから得られた「スケジュール情報」等から、ユーザがどの程度ストレスを感じているかといったストレスのレベルを導き出す。また、例えば、PHRビッグデータ解析部121は、生体情報としてセンサから得られた「心拍数」や、行動情報としてセンサから得られたユーザの姿勢や動作、行動情報としてスマートフォンの運動系アプリケーションから得られた「運動情報」等から、ユーザがどの程度の運動を行ったかといった運動のレベルを導き出す。また、例えばセンサで計測した末梢の体温の変動や発汗の度合いから交感神経・副交感神経のバランスを計測することで、精神の緊張や弛緩度合が導き出される。また、例えば、PHRビッグデータ解析部121は、生体情報としてセンサから得られた「糖分」、「塩分」、「胃酸」、「アルコール摂取量」等から、ユーザがどのような食生活を送っていたかといった食生活のレベルを導き出す。また、例えば、PHRビッグデータ解析部121は、生体情報としてセンサから得られた「薬剤成分」等から、ユーザがどのような薬やサプリメントを服用しているかといった薬サプリのレベルを導き出す。なお、上述したアルゴリズムは一例に過ぎない。
Further, for example, the PHR big
このように、PHRビッグデータ解析部121は、ライフログ情報のうち生体情報及び行動情報のいずれか一方のみで、あるいは、両者の組み合わせから、上述した10の項目の値を得て、この値に基づいて各項目のレベルを導き出す。なお、ゲノムの型は、同一の対象者に関しては原則変化しない一方で、ライフスタイルの型は、時間経過とともに変化する可能性がある。
As described above, the PHR big
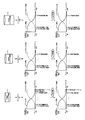
図7は、本実施形態における健康リスク推定テーブルTを説明するための図である。本実施形態では、同一のライフスタイルの型のユーザであっても、ゲノムの型が異なれば、発症リスクの高い疾病の種類や順序は異なると考える。また、同一のゲノムの型のユーザであっても、ライフスタイルの型が異なれば、発症リスクの高い疾病の種類や順序は異なると考える。なお、図7に示す健康リスク推定テーブルTの表現方法は一例に過ぎず、図7に例示される疾病の種類や順序も、説明の便宜上の一例に過ぎない。 FIG. 7 is a diagram for explaining the health risk estimation table T in the present embodiment. In the present embodiment, even if the user has the same lifestyle type, the type and order of diseases having a high onset risk are different if the genome type is different. In addition, even if the users have the same genome type, the types and order of diseases with a high risk of onset differ if lifestyle types are different. Note that the method of expressing the health risk estimation table T illustrated in FIG. 7 is merely an example, and the types and order of diseases illustrated in FIG. 7 are merely examples for convenience of description.
例えば、PHRビッグデータ解析部121は、ゲノムの型及びライフスタイルの型の組み合わせ毎に、疾病発症リスクを示す健康リスクグラフを作成する。各健康リスクグラフの縦軸は、疾病発症リスクにおけるライフスタイル要因及びゲノム要因の割合を表し、横軸には疾病が並ぶ。横軸の右方向へ行くほど、ライフスタイル要因の影響が強い疾病であること、横軸の左方向へ行くほど、ゲノム要因の影響が強い疾病であることを表す。即ち、健康リスクグラフは、ゲノムの型及びライフスタイルの型の組み合わせ毎に、ゲノム要因及びライフスタイル要因のいずれの影響を強く受けるかに応じて順序付けされた、将来発症し得る疾病のリストである。なお、横軸には、疾病の名称として、疾病の正式名称と、国際疾病分類に基づくICD(International Classification of Diseases)コードとが表示される。なお、実施形態はこれに限られるものではなく、例えば、疾病の正式名称か、ICDコードのいずれかのみを表示してもよい。
For example, the PHR big
例えば、図7の(A)と(B)とを比較すると、同一のライフスタイル3型のユーザであっても、ゲノムの型が2型と3型とで異なれば、発症リスクの高い疾病の種類や順序が異なることが分かる。例えば、「アルコール性肝疾患(K70)」がライフスタイル要因の影響が強い疾病であることについては共通する一方で、ゲノム2型のユーザにとって、ライフスタイル要因の影響が強い疾病である「痛風性関節炎(M1009)」が、ゲノム3型のユーザにとっては、むしろゲノム要因の影響が強い疾病に位置付けられている。反対に、ゲノム3型のユーザにとって、ライフスタイル要因の影響が強い疾病である「糖尿病性腎症(E142)」が、ゲノム2型のユーザにとっては、むしろゲノム要因の影響が強い疾病に位置付けられている。
For example, comparing (A) and (B) in FIG. 7, even if the user has the
また、例えば、図7の(B)と(C)とを比較すると、同一のゲノム3型のユーザであっても、ライフスタイルの型が3型と2型とで異なれば、発症リスクの高い疾病の種類や順序が異なることが分かる。例えば、ライフスタイル3型のユーザについては、「アルコール性肝疾患(K70)」、「肝細胞癌(C220)」、「糖尿病性腎症(E142)」等が、ライフスタイル要因の影響が強い疾病として位置付けられている一方で、ライフスタイル2型のユーザについては、「肺胞性肺気腫(J43)」、「肺門部腺癌(C340)」、「急性右室梗塞(I212)」等が、ライフスタイル要因の影響が強い疾病として位置付けられている。例えば、同一のゲノム3型のユーザの中でも、ライフスタイル3型は、飲酒のレベルが高いユーザで、ライフスタイル2型は、喫煙のレベルが高いユーザである場合等が考えられる。なお、同じゲノム3型のユーザでは、ライフスタイルの型に関わらず、「脊髄小脳変性症(G319)」や「痛風性関節炎(M1009)」等がゲノム要因の影響が強い疾病として位置付けられている。
Further, for example, comparing (B) and (C) in FIG. 7, even if the user has the
ここで、PHRビッグデータ解析部121による「健康リスクグラフ」作成処理の一例を説明する。また、具体的な一例として、ゲノム3型及びライフスタイル3型の組み合わせに対する「健康リスクグラフ」を作成する場合を説明する。
Here, an example of a “health risk graph” creation process by the PHR big
例えば、PHRビッグデータ解析部121は、ゲノム情報としてゲノム3型を有するユーザの病歴情報(例えば、電子カルテ情報から得られる)を参照して、ゲノム3型のユーザにとって発症リスクの高い疾病として「疾病A,疾病B,疾病C,疾病D」を特定する。また、PHRビッグデータ解析部121は、ライフログ情報としてライフスタイル3型を有するユーザの病歴情報を参照して、ライフスタイル3型のユーザにとって発症リスクの高い疾病として「疾病D,疾病E,疾病F,疾病G」を特定する。そして、PHRビッグデータ解析部121は、特定した疾病を比較して、ゲノム3型のユーザにとって発症リスクの高い疾病にのみ含まれる「疾病A,疾病B,疾病C」を、「遺伝子要因の影響が強い疾病」に分類する。また、PHRビッグデータ解析部121は、ライフスタイル3型のユーザにとって発症リスクの高い疾病にのみ含まれる「疾病E,疾病F,疾病G」を、「ライフスタイル要因の影響が強い疾病」に分類する。また、PHRビッグデータ解析部121は、その両方に含まれる「疾病D」を、「ライフスタイル要因及び遺伝子要因の影響が強い疾病」に分類する。
For example, the PHR big
続いて、PHRビッグデータ解析部121は、ゲノム3型及びライフスタイル3型の組み合わせのユーザの病歴情報を参照して、ゲノム3型及びライフスタイル3型の組み合わせのユーザにとって発症リスクの高い疾病を特定する。ここで、例えば、PHRビッグデータ解析部121が、ゲノム3型及びライフスタイル3型の組み合わせのユーザにとって発症リスクの高い疾病として「疾病A,疾病C,疾病F,疾病G」を特定したものとする。かかる場合、PHRビッグデータ解析部121は、先に「遺伝子要因の影響が強い疾病」に分類された「疾病A,疾病B,疾病C」と共通する「疾病A」及び「疾病C」を、「遺伝子要因の影響が強い疾病」であると判定し、図7に示す「健康リスクグラフ」において、横軸の左方向へ位置付ける。また、PHRビッグデータ解析部121は、先に「ライフスタイル要因の影響が強い疾病」に分類された「疾病E,疾病F,疾病G」と共通する「疾病F」及び「疾病G」を、「ライフスタイル要因の影響が強い疾病」であると判定し、図7に示す「健康リスクグラフ」において、横軸の右方向へ位置付ける。
Subsequently, the PHR big
ところで、PHRビッグデータ解析部121は、ある基準のもとで、図7に示した健康リスク推定テーブルTを作成する。例えば、PHRビッグデータ解析部121は、「標準の健康状態にある者が、例えば1年間同じライフスタイルの型の生活を継続した場合の10年後の健康リスク(発症確率30%)」という基準のもとで、健康リスク推定テーブルTを作成する。この点、実際のユーザのライフスタイルの型は、一般に、1日、1週間、1ヶ月、1年等、期間の長さに応じて異なると考えられる。例えば、今週は歓送迎会が多かったために特別に飲酒の量が増えたが、1ヶ月で考えたときには、それほど飲酒の量が多いわけではないという場合である。そこで、一次利用サービス提供部122が、この健康リスク推定テーブルTを用いてあるユーザの健康リスクを推定する際には、推定に用いるPHRデータの期間(推定対象期間と呼ぶ)に応じた個別の推定と、現在の健康状態に応じた調整とを行う。なお、PHRビッグデータ解析部121は、上述した基準を、適宜変更することができる。また、PHRビッグデータ解析部121は、上述した基準のうち、推定する将来の「時点」を複数設定することができる(例えば、1日後、1週間後、1ヶ月後、1年後、5年後、10年後、20年後等)。この場合、PHRビッグデータ解析部121は、それぞれの基準に対応する健康リスク推定テーブルTを作成する。なお、異なる「時点」の健康リスク推定テーブルTを比較すると、例えば、1ヶ月後の健康リスク推定テーブルTには、直ぐに発症する疾病が列挙される一方で、10年後の健康リスク推定テーブルTには、長期経過後に発症する疾病が列挙されるといった違いが現れる場合がある。
Incidentally, the PHR big
図8は、本実施形態における健康リスクの推定を説明するための図である。例えば、一次利用サービス提供部122は、ユーザAの健康リスクを推定する際に、ユーザAのPHRデータから、推定対象期間に応じてライフログ情報を抽出する。例えば、一次利用サービス提供部122は、図8に示すように、操作者から指定された推定対象期間に応じて、ユーザAのPHRデータから、例えば、今週のライフログ情報D1、今月のライフログ情報D2、今年のライフログ情報D3をそれぞれ抽出する。
FIG. 8 is a diagram for explaining health risk estimation in the present embodiment. For example, when estimating the health risk of the user A, the primary use
続いて、一次利用サービス提供部122は、推定対象期間毎に、それぞれ10の項目(喫煙、飲酒、睡眠、ストレス、運動、食生活、薬サプリ、精神状態、疲れ、免疫)の値を得て、この値に基づいて、各項目のレベルを導き出す。そして、一次利用サービス提供部122は、推定対象期間毎に、各項目のレベルの組み合わせのパターンの1つであるライフスタイルの型を、ユーザAのライフスタイルの型(今週のライフスタイルの型、今月のライフスタイルの型、今年のライフスタイルの型)として判定する。例えば、一次利用サービス提供部122は、図8に示すように、今週のライフログ情報D1に基づいて、今週のライフスタイルの型「3型」を判定し、今月のライフログ情報D2に基づいて、今月のライフスタイルの型「30型」を判定し、今年のライフログ情報D3に基づいて、今年のライフスタイルの型「30型」を判定する。
Subsequently, the primary use
次に、一次利用サービス提供部122は、判定したライフスタイルの型を用いて健康リスク推定テーブルTを参照し、該当の健康リスクグラフを、推定対象期間毎にそれぞれ特定する。例えば、図8の例では、ライフスタイル3型の健康リスクグラフにおいて、「アルコール性肝疾患(K70)」、「肝細胞癌(C220)」、「糖尿病性腎症(E142)」が、発症リスクの高い疾病として列挙されているのに対し、ライフスタイル30型の健康リスクグラフにおいては、「アルコール性肝疾患(K70)」及び「肝細胞癌(C220)」が、発症リスクの高い疾病から外れ、「糖尿病性腎症(E142)」のみが、発症リスクの高い疾病として列挙されている。これはあくまで説明の便宜上の一例に過ぎないが、このように、推定対象期間によってライフスタイルの型が異なれば、推定対象期間によって、発症リスクの高い疾病の種類や順序も異なってくる。推定対象期間に応じて個別の推定を行い、例えば、今週、今月、今年の間で比較を行うことで、健康リスクの方向性(例えば、良い方向に向かっているのか、あるいは悪い方向に向かっているのか等)を提示することができる。
Next, the primary use
更に、一次利用サービス提供部122は、推定対象期間毎に特定された各健康リスクグラフについて、現在の健康状態に応じた調整を行う。例えば、一次利用サービス提供部122は、ライフログ情報に含まれる生体情報を考慮して、各健康リスクグラフの内容を、個別のユーザの現在の健康状態に応じた内容に変更する。例えば、一次利用サービス提供部122がユーザAの生体情報を解析したところ、ユーザAの肝機能が極めて良好な状態であることが判明したとする。すると、一次利用サービス提供部122は、ゲノム3型及びライフスタイル3型の組み合わせの健康リスクグラフにおいて、「アルコール性肝疾患(K70)」、「肝細胞癌(C220)」、「糖尿病性腎症(E142)」のうち、「肝細胞癌(C220)」の発症リスクは低いと判定して、これを削除する。なお、これはあくまで説明の便宜上の一例に過ぎないが、このように、現在の健康状態によって、発症リスクの高い疾病の種類や順序も異なってくる。
Furthermore, the primary use
本実施形態において一次利用サービス提供部122が健康リスクの推定を行う際には、上述したような推定対象期間に応じた個別の推定と、現在の健康状態に応じた調整とを行う。なお、上述の例では、推定対象期間として、「今週」、「今月」、「今年」の例を挙げたが、実施形態はこれに限られるものではない。「過去1日分」、「過去1週間分」、「過去1ヶ月分」、「過去1年分」等のように、一定の単位で区切られた期間でもよいし、あるいは、ユーザから適宜設定を受け付け、ユーザの要望に応じた任意の期間であってもよい。
In the present embodiment, when the primary use
なお、これまで、PHRビッグデータ解析部121が、ゲノムの型及びライフスタイルの型の組み合わせに応じて、疾病発症リスクにおけるゲノム要因及びライフスタイル要因の割合を示す「健康リスク推定テーブルT」を生成するものとして説明した。これに加えて、PHRビッグデータ解析部121は、「ゲノム要因の影響が強い疾病」について、疾病発症リスクを更に増加させる要因となるライフスタイルを示す情報を生成することも可能である。
Up to now, the PHR big
これまでに、ALDH2遺伝子にSNPを有する場合、喫煙習慣、飲酒習慣がある場合に食道癌の発症リスクが高くなることが知られている。このようなことから、例えば、ある遺伝子にSNPを有するゲノムの型のユーザについて、ライフスタイル別に発症リスクの高い疾病を解析することで、SNPを有することで発症する疾病とライフスタイルとの相関を推定することが可能となる。 It has been known that when an ALDH2 gene has a SNP, the risk of developing esophageal cancer increases when there is a smoking habit or drinking habit. For this reason, for example, for a user of a genomic type having a SNP in a certain gene, by analyzing a disease having a high risk of onset by lifestyle, the correlation between the disease that develops by having the SNP and the lifestyle can be obtained. It is possible to estimate.
かかる場合、例えば、PHRビッグデータ解析部121は、ある遺伝子にSNPを有するゲノムの型のユーザをゲノム情報から検索する。そして、PHRビッグデータ解析部121は、ある遺伝子にSNPを有するゲノムの型のユーザの病歴情報(例えば、電子カルテ情報等から得られる)を参照して、発症リスクの高い疾病を特定する。続いて、PHRビッグデータ解析部121は、ある遺伝子にSNPを有するゲノムの型のユーザのライフログ情報を参照して、特定した疾病の発症リスクを高めるライフスタイルを特定する。
In such a case, for example, the PHR big
また、上述した実施形態では、健康リスクグラフが「標準の健康状態にある者」を想定して作成されると述べたが、実施形態はこれに限られるものではない。例えば、糖尿病には、腎障害、網膜障害、神経障害等の合併症があることが知られている。また、高血圧には、脳卒中、各種心臓病、腎障害等の合併症があることが知られている。また、インフルエンザには、細菌性肺炎、インフルエンザ脳症、心筋炎等の合併症があることが知られている。このように、ある疾病に合併症がある場合、その疾病に罹患した者の健康リスクグラフにおいては、これらの合併症の発症リスクが高まると考えられる。そこで、例えば、PHRビッグデータ解析部121は、合併症を有する疾病に罹患している者を分類した上でコホート分析を行うことで、例えば、「糖尿病に罹患している者」、「高血圧の者」、「インフルエンザに罹患している者」を想定した罹患者専用の健康リスクグラフを作成することができる。また、この場合、一次利用サービス提供部122は、「糖尿病に罹患している者」、「高血圧の者」、「インフルエンザに罹患している者」に対して「日常人間ドック」サービスを提供する場合には、罹患者専用の健康リスクグラフを参照して、発症リスクの高い疾病を特定することができる。
In the above-described embodiment, it is described that the health risk graph is created on the assumption of “a person in a standard health state”, but the embodiment is not limited to this. For example, it is known that diabetes has complications such as renal disorder, retinal disorder, and neuropathy. In addition, high blood pressure is known to have complications such as stroke, various heart diseases, and kidney damage. In addition, it is known that influenza has complications such as bacterial pneumonia, influenza encephalopathy and myocarditis. Thus, when there are complications in a certain disease, it is considered that the risk of developing these complications is increased in the health risk graph of a person suffering from the disease. Therefore, for example, the PHR big
(日常人間ドック−将来の健康リスクのお知らせ)
さて、本実施形態において、一次利用サービス提供部122は、健康リスク推定テーブルTを用いて、PHRデータを提供したユーザ本人に対するフィードバックを行うことで、「日常人間ドック」を一次利用サービスとして提供する。その提供の手法としては様々な手法が考えられるが、以下では、図9を用いて1つの手法を説明する。
(Daily Ningen Dock-Future Health Risk Notice)
In the present embodiment, the primary usage
図9は、本実施形態における元気予報ポータルサイトを説明するための図である。図9に示すように、例えば、一次利用サービス提供部122は、ヘルスケアクラウド10上にユーザA用のポータルサイト14aを立ち上げ、ユーザA及び家族に対してポータルサイト14aへのアクセスを許可する。また、例えば、一次利用サービス提供部122は、ヘルスケアクラウド10上に主治医用のポータルサイト14bを立ち上げ、主治医に対しては、主治医用のポータルサイト14b経由で、ユーザA用のポータルサイト14aへのアクセスを許可する。このように、ユーザA用のポータルサイト14aを介して、ユーザA、家族、主治医のアクセスを受け付けることで、ユーザA本人に対するフィードバックと、3者間の情報共有とを実現する。
FIG. 9 is a diagram for explaining the spirit forecast portal site in the present embodiment. As illustrated in FIG. 9, for example, the primary use
また、図9に示すように、本実施形態において、ポータルサイト14aを通じて閲覧可能な範囲は、主治医とユーザA本人(及び家族)とで異なっている。即ち、主治医であれば、ユーザAのPHRデータ自体、並びに、PHRデータに基づく健康リスクの推定結果の両方を閲覧することができる。一方、ユーザA本人や家族は、ユーザAのPHRデータ自体を閲覧することはできない。例えば、ゲノム情報の本人に対する開示は適宜制限されるべきだからである。なお、このような閲覧範囲の制限は一例に過ぎず、他の制限を設けてもよいが、一般に、本人の閲覧範囲よりも主治医の閲覧範囲が広くなる場合が多いと考えられる。
Also, as shown in FIG. 9, in this embodiment, the range that can be browsed through the
また、主治医の意見に基づいて、ユーザA本人や家族に対する閲覧範囲を調整してもよい。例えば、一次利用サービス提供部122は、健康リスクの推定結果のうち、ユーザA本人に閲覧させた方が望ましい項目、閲覧させない方が望ましい項目の指定を、主治医から受け付ける。そして、一次利用サービス提供部122は、主治医からの指定に従って、ユーザA本人に対して閲覧させる閲覧範囲を調整する。例えば、一次利用サービス提供部122は、主治医用の健康リスクグラフを表示する場合に表示していた疾病の一部を、ユーザ用の健康リスクグラフを表示する場合には非表示とする。本実施形態においては、ユーザのゲノム要因の影響を強く受ける疾病についても、発症リスクの高い疾病として判明する可能性がある。しかしながら、このようなゲノム要因の影響を強く受ける疾病は、ライフスタイルの変更によっても避けられないこと、且つ、例えば治療法が確立しない難病の場合には、本人への告知が意味をなさない(若しくは、かえって悪影響を与える)事態が想定される。そこで、一次利用サービス提供部122は、ユーザ用の健康リスクグラフを表示する場合には、疾病の一部を非表示とすることができる。例えば、一次利用サービス提供部122は、主治医から、非表示とすべき疾病の指定を受け付け、健康リスクグラフの表示にあたり、この指定を反映して、非表示とする。また、このような難病に限られず、例えば、主治医が、本人の性格を考慮して、本人への告知が望ましくないと考える場合も想定される。このような場合も、例えば、一次利用サービス提供部122は、主治医から、非表示とすべき疾病の指定を受け付け、健康リスクグラフの表示にあたり、この指定を反映して、非表示とする。
Further, the viewing range for the user A himself or her family may be adjusted based on the opinion of the attending physician. For example, the primary use
このように、主治医と、ユーザA本人や家族とでは閲覧範囲が異なること、また、そもそも、主治医と、ユーザA本人や家族とでは閲覧の目的も異なることから、本実施形態においては、図9に示すように、主治医用のコンテンツ14cと、ユーザA本人や家族用のコンテンツ14dとが、別々に準備される。この点については、以下で画面遷移を説明する際に詳しく述べる。
As described above, the viewing range is different between the attending doctor and the user A himself / her and the family, and the viewing purpose is also different between the attending physician and the user A himself / her and the family. As shown in FIG. 4, the
また、本実施形態において、一次利用サービス提供部122は、健康リスクの推定結果を、「健康リスクグラフ」、「バーチャルクローン」、「健康ステータス」、「健康リスクを視覚的に表現したマーク」、「文字情報」のうちの1つ若しくは複数で提示する。
In the present embodiment, the primary use
例えば、一次利用サービス提供部122は、健康リスクの推定結果を、ユーザA本人のPHRデータと紐付いた、「バーチャルクローン」によって提示する。例えば、「バーチャルクローン」は、過去から未来までの各時点に対応付けて設定されており、各時点における健康状態を、部位毎に点数化された健康ステータスの形で保持する。例えば、一次利用サービス提供部122は、健康リスクグラフからライフスタイル要因の影響が強い疾病を適宜抽出し、疾病の種類に応じた重み付けを行い、部位毎に点数を算出する。なお、ある部位の疾病が他の部位にも影響を及ぼす場合には、一次利用サービス提供部122は、その点を加味して点数を算出する。また、例えば、「バーチャルクローン」は、健康ステータスに応じた表情の画像を保持する。こうして、病気への距離感の見える化が実現される。
For example, the primary use
例えば、過去の「バーチャルクローン」は、過去のPHRデータから判明する過去の健康状態やライフスタイルの型に応じた健康ステータス、及び、既往症の情報を保持する。現在の「バーチャルクローン」は、現在のPHRデータから判明する現在の健康状態やライフスタイルの型に応じた健康ステータス、及び、現在罹患中の疾病の情報を保持する。未来の「バーチャルクローン」は、現在のPHRデータから判明する現在の健康状態に、現在のライフスタイルの型を加味した未来の健康ステータス、及び、未来において発症リスクの高い疾病の情報を保持する。更に、本実施形態においては、ユーザA本人にとって理想の「バーチャルクローン」も設定、提示される。 For example, a past “virtual clone” retains information on past health status and past illness determined from past PHR data and health status according to lifestyle type. The current “virtual clone” holds information on the current health status and lifestyle type determined from the current PHR data, and on the disease currently being affected. The future “virtual clone” holds information on the future health status in which the current lifestyle type is added to the current health state determined from the current PHR data, and information on diseases with a high risk of onset in the future. Further, in the present embodiment, an ideal “virtual clone” for the user A himself / herself is set and presented.
例えば、ユーザAや主治医は、ユーザA用のポータルサイト14aにアクセスしてユーザAの「バーチャルクローン」を閲覧することで、ユーザA本人の健康状態を過去から未来に亘るまで把握することができる。例えば、ユーザAや主治医は、「バーチャルクローン」の時間を過去に移動させることで、本人の病歴やその重症度を把握することができる。また、例えば、ユーザAや主治医は、「バーチャルクローン」の時間を未来に移動させることで、本人の現在のライフスタイルを前提とした未来の健康リスクを表示させることができる。
For example, the user A or the attending physician can grasp the health status of the user A himself from the past to the future by accessing the
また、例えば、一次利用サービス提供部122は、健康リスクの推定結果を、「健康リスクを視覚的に表現したマーク」で提示する。このマークは、例えば、健康ステータスに応じたマークとなっており、健康ステータスが悪ければ「悪魔」、健康ステータスが良ければ「天使」のように、ユーザにとって認識し易いものが望ましい。また、例えば、一次利用サービス提供部122は、健康リスクの推定結果を、「文字情報」で提示する。例えば、一次利用サービス提供部122は、健康リスクグラフからライフスタイル要因の影響が強い疾病を適宜抽出し、抽出した疾病の名称を並べて提示する。あるいは、先に述べた「バーチャルクローン」において、将来の健康状態から予測される特徴的な風貌を自分の顔や容姿に反映させた自己像を提示することで、直感的に現状生活の及ぼす、X年後の自分の将来像を表示させることでもよい。
Further, for example, the primary use
図10は、本実施形態における「日常人間ドック」の処理手順を示す図である。図10に示すように、ユーザAは、PHR処理装置100に対して、予めゲノム情報を登録しているものとする(ステップS101)。なお、このステップS101の処理は、原則として少なくとも1回行われればよい処理であり、ステップS102以降の処理が、繰り返し行われる処理である。 FIG. 10 is a diagram illustrating a processing procedure of “daily human dock” in the present embodiment. As shown in FIG. 10, it is assumed that the user A has previously registered genome information in the PHR processing apparatus 100 (step S101). In addition, the process of step S101 is a process which should be performed at least once in principle, and the process after step S102 is a process performed repeatedly.
また、図10に示すように、ユーザAは、PHR処理装置100に対して、センサやその他の情報端末によって収集されたライフログ情報を、装着型情報端末から、日々送信する(ステップS102)。PHR処理装置100のPHR蓄積部110は、受信したライフログ情報を、ユーザAのPHRデータとして日々蓄積し、一元管理する。
Further, as shown in FIG. 10, the user A transmits life log information collected by the sensor and other information terminals to the
一次利用サービス提供部122は、例えば、1週間に1回の頻度で、ステップS103以降の処理を行う。まず、一次利用サービス提供部122は、健康リスクの推定対象期間毎に、ユーザAのライフスタイルの型を判定する(ステップS103)。例えば、一次利用サービス提供部122は、ユーザAのPHRデータから、今週のライフログ情報D1、今月のライフログ情報D2、今年のライフログ情報D3をそれぞれ抽出し、推定対象期間毎に、ユーザAのライフスタイルの型を判定する。
For example, the primary use
続いて、一次利用サービス提供部122は、予め判明しているユーザAのゲノムの型と、ステップS103で判定したライフスタイルの型とを用いて、健康リスクの推定対象期間毎に、健康リスク推定テーブルTを参照する(ステップS104)。例えば、一次利用サービス提供部122は、健康リスク推定テーブルTを参照し、ユーザAのゲノムの型が3型で、今週のライフスタイルの型が3型である場合、図7の(B)の健康リスクグラフを特定する。このように、一次利用サービス提供部122は、推定対象期間毎に、健康リスクグラフを特定する。
Subsequently, the primary use
次に、一次利用サービス提供部122は、ユーザAの現在の健康状態に応じて、ステップS104で得られた健康リスクグラフを、推定対象期間毎に調整する(ステップS105)。例えば、一次利用サービス提供部122は、ユーザAの生体情報から、ユーザAの肝機能が極めて良好な状態であると判明した場合、「肝細胞癌(C220)」の発症リスクは低いと判定して、今週の健康リスクグラフからこれを削除する。
Next, the primary use
そして、一次利用サービス提供部122は、現在から未来までの健康ステータスを推定対象期間毎に算出し(ステップS106)、推定対象期間毎に準備された、現在から未来までの「バーチャルクローン」に登録する(ステップS107)。例えば、一次利用サービス提供部122は、前の週に算出された現在の健康ステータスと今週の生体情報とに基づいて、ユーザAの現在の健康ステータスを算出し、これを、ユーザAの現在の「バーチャルクローン」に対応付けて登録する。また、一次利用サービス提供部122は、現在の健康ステータスを基準に、加齢に伴う減点や、ステップS105で判明した未来の健康リスクに伴う減点等を組み合わせて未来の健康ステータスを算出し、これを、ユーザAの未来の「バーチャルクローン」に対応付けて登録する。なお、一次利用サービス提供部122は、未来のある時点について健康ステータスを算出すると、現在からその時点までの間の中間の時点や、その時点以降の更に未来の時点の健康ステータスを、適宜補間により(複数の時点の健康リスク推定テーブルTが準備されている場合は、それを用いて)算出する。例えば、一次利用サービス提供部122は、1日後、1週間後、1ヶ月後から、1年後、5年後、10年後、あるいは20年後まで、各時点の健康ステータスを算出する。また、一次利用サービス提供部122は、このような健康ステータスの算出を、推定対象期間毎に行う。
Then, the primary use
また、一次利用サービス提供部122は、ユーザAの主治医が保持する健康リスクランキングリストを更新する(ステップS107)。例えば、一次利用サービス提供部122は、主治医が担当する複数のユーザに関して、例えば、推定対象期間を「今年」とした場合の10年後の健康ステータスに基づいて、疾病の発症リスクが高い者から順に並べた、健康リスクランキングリストを作成している。そこで、一次利用サービス提供部122は、ステップS106で算出された「今年」の健康ステータスに基づいて、この健康リスクランキングリストを更新する。
Further, the primary use
そして、一次利用サービス提供部122は、上述した処理の結果を、主治医用のコンテンツ、ユーザA用のコンテンツにそれぞれ反映する(ステップS108)。例えば、一次利用サービス提供部122は、主治医用のコンテンツにおいては、更新された健康リスクランキングを反映する。また、一次利用サービス提供部122は、ユーザA用のコンテンツにおいては、推定対象期間毎のライフスタイルの型、推定対象期間毎の健康リスクグラフ、推定対象期間毎の健康ステータスを反映する。
Then, the primary use
そして、一次利用サービス提供部122は、主治医に対して登録を通知する(ステップS109)。主治医は、まず、主治医用のポータルサイトにおいて健康リスクランキングを閲覧する。そして、例えば、健康リスクランキングでユーザAが上位に位置付けられていた場合には、主治医は、更に、ユーザA用のポータルサイトを閲覧し、自身のコメントを録画して、ユーザA用のポータルサイトにアップロードする(ステップS110)。なお、コメントは、動画データに限られるものではなく、テキストデータによるコメント等でもよい。
Then, the primary use
続いて、一次利用サービス提供部122は、ユーザA本人に登録を通知し(ステップS111)、ユーザAが、ユーザA用のポータルサイトを閲覧する(ステップS112)。ステップS110において既に主治医のコメントが録画されている場合、ユーザAは、主治医のコメントとしてこの動画を再生することもできる。
Subsequently, the primary use
なお、図10に示した処理手順は一例に過ぎない。例えば、図10では、主治医によるコメント付与を待って、ユーザA本人による閲覧を可能とする処理手順としたが、実施形態はこれに限られるものではない。例えば、一次利用サービス提供部122は、ユーザ、家族、主治医の3者に対して同時に、ポータルサイトの登録を通知してもよい。また、図10に示した処理手順は、主治医の介在を前提とせずに行われてもよい。その他、推定対象期間の設定や健康ステータスの算出等は、サービスの提供形態に応じて、任意に変更することや、省略することが可能である。
Note that the processing procedure shown in FIG. 10 is merely an example. For example, in FIG. 10, the processing procedure that allows the user A himself / herself to browse after waiting for the comment by the attending physician is described, but the embodiment is not limited thereto. For example, the primary use
次に、主治医用のポータルサイトやユーザA用のポータルサイトにおいて、どのようなコンテンツを閲覧することができるか、その一例を画面遷移によって説明する。図11は、本実施形態における主治医用ポータルサイトの画面遷移を示す図であり、図12は、本実施形態におけるユーザ用ポータルサイトの画面遷移を示す図である。なお、図11や図12に示す画面遷移はあくまで一例に過ぎず、その画面遷移の順序や、画面の構成等は、任意に変更することが可能である。 Next, an example of what content can be browsed on the portal site for the attending physician or the portal site for the user A will be described by screen transition. FIG. 11 is a diagram showing screen transition of the attending physician portal site in the present embodiment, and FIG. 12 is a diagram showing screen transition of the user portal site in the present embodiment. Note that the screen transitions shown in FIGS. 11 and 12 are merely examples, and the order of the screen transitions, the configuration of the screens, and the like can be arbitrarily changed.
ここで、以下に例示する画面遷移は、主治医のPHR表示装置200、又は、ユーザA本人のPHR表示装置200において表示されるものである。これは、一次利用サービス提供部122による制御により実現されるものであると同時に、PHR表示装置200側の表示制御部210による表示制御により実現されるものである。
Here, the screen transition exemplified below is displayed on the
まず、主治医側の画面遷移を説明する。主治医は、PHR表示装置200によって主治医用のポータルサイトにアクセスする。すると、図11の画面P1に示すように、健康リスクランキングリストの更新があったことが通知されている。そこで、主治医は、『Enter』ボタンを押下して、健康リスクランキングリストを閲覧する。
First, the screen transition of the attending physician will be described. The attending physician accesses the portal site for the attending physician through the
すると、画面P2に示すように、一次利用サービス提供部122は、主治医のPHR表示装置200に、健康リスクランキングを表示する。健康リスクランキングには、健康リスクスコアが低い順に、ユーザの氏名と、健康リスクスコアと、発症リスクが高い疾病の名称とが表示される。例えば、この健康リスクランキングの上位に、ユーザAの氏名が含まれていたとする。
Then, as shown in the screen P2, the primary use
この場合、主治医は、健康リスクランキング上でユーザAの名前を選択し、ユーザA用のポータルサイトにアクセスする。すると、画面P3に示すように、一次利用サービス提供部122は、主治医のPHR表示装置200に、ユーザA用のポータルサイトを表示する。例えば、一次利用サービス提供部122は、ユーザAの現在の「バーチャルクローン」を表示する。なお、画面P3に示すように、画面上には、推定対象期間を選択するためのタブ(「今週」、「今月」、「今年」のタブ)が設定されている。ここでは、主治医が、推定対象期間として「今週」を選択したものとして説明する。また、「バーチャルクローン」の下には、確認したい時点を受け付けるためのツールとして、バーが表示されている。例えば、主治医は、このバーの位置を10年後の「2023年」に合わせ、『健康リスクグラフを確認』のボタンを押下する。
In this case, the attending physician selects the name of the user A on the health risk ranking and accesses the portal site for the user A. Then, as shown in the screen P3, the primary use
すると、画面P4に示すように、一次利用サービス提供部122は、主治医のPHR表示装置200に、ユーザAのゲノムの型と今週のライフスタイルの型とを表示するとともに、該当する健康リスクグラフを表示する。また、図示を省略するが、一次利用サービス提供部122は、必要に応じて、ライフスタイルの型の各項目の内容を具体的に表示してもよい。そして、例えば、主治医は、健康リスクグラフを確認後、『PHR確認』のボタンを押下する。
Then, as shown in the screen P4, the primary use
すると、画面P5に示すように、一次利用サービス提供部122は、ユーザAのPHRデータを表示する。なお、画面P5においては、ライフログ情報をグラフ形式で表示する例を示すが、実施形態はこれに限られるものではない。一次利用サービス提供部122は、主治医によって指定されたPHRデータを主治医が望む形式(例えば、表形式)に加工して表示することができる。例えば、主治医は、推定対象期間毎の健康リスクグラフやPHRデータをひと通り確認すると、『コメント』のボタンを押下する。
Then, as shown in the screen P5, the primary use
そして、画面P6に示すように、主治医は、例えば、PHR表示装置200の録画機能を用いてコメント動画を録画し、『送信』ボタンを押下することで、コメント動画をアップロードする。
Then, as shown in the screen P6, the attending physician records the comment video using the recording function of the
上述してきた画面遷移について、PHR表示装置200の表示制御部210による表示制御の観点から説明すると、以下の通りである。例えば、主治医のPHR表示装置200は、ユーザのPHRデータに基づいて推定されたユーザの将来の健康リスクを表示部220に表示する表示制御部210を備える。表示制御部210は、複数のユーザ間の比較に基づく健康リスクランキングリストを表示し、健康リスクランキングリストに対して所定のユーザが指定された場合に、指定されたユーザの将来の健康リスク及びPHRデータを表示する。将来の健康リスクは、例えば、バーチャルクローンや、健康リスクグラフ、その他の文字情報等で表示される。また、PHRデータは、グラフ形式や、表形式、その他の文字情報等で表示される。また、表示制御部210は、ユーザのPHRデータとして、ゲノムの型、及び、ライフスタイルの型を表示する。なお、図11においては図示を省略するが、表示制御部210は、疾病の名称を表示する場合に、正式名称やICDコードで表示する。
The screen transition described above will be described from the viewpoint of display control by the
次に、ユーザA側の画面遷移を説明する。ユーザAは、PHR表示装置200によって、ユーザA用のポータルサイトにアクセスする。すると、図12の画面P7に示す画面が表示されるので、ユーザAは、『Enter』ボタンを押下して、閲覧を開始する。
Next, screen transition on the user A side will be described. User A uses the
すると、画面P8に示すように、一次利用サービス提供部122は、ユーザAの現在の「バーチャルクローン」を表示する。なお、画面P8に示すように、画面上には、推定対象期間を選択するためのタブ(「今週」、「今月」、「今年」のタブ)が設定されている。ここでは、ユーザAが、推定対象期間として「今週」を選択したものとして説明する。また、「バーチャルクローン」の下には、確認したい時点を受け付けるためのツールとして、バーが表示されている。例えば、ユーザAは、このバーの位置を10年後の「2023年」に合わせ、『詳細』のボタンを押下する。
Then, as shown in the screen P8, the primary use
すると、画面P9に示すように、一次利用サービス提供部122は、ユーザAによって指定された時点の「バーチャルクローン」と、その時点の健康ステータスとを表示する。また、一次利用サービス提供部122は、健康リスクの推定結果「10年後(2023年)に、「アルコール性肝疾患」、「糖尿病」を発症するリスクが高まっています」を表示する。また、一次利用サービス提供部122は、健康リスクを視覚的に表現したマークを表示する。画面P9の例では、重い疾病を発症するリスクが高まっていることを視覚的に表現する意味で、「悪魔」のマークが表示されている。ここで、例えば、ユーザは、『シミュレーション』のボタンを押下する。
Then, as shown in the screen P9, the primary use
すると、画面P10に示すように、一次利用サービス提供部122は、ライフスタイルの変更を受け付けて健康リスクをシミュレーションするシミュレーション画面を表示する。図13は、本実施形態における健康リスクのシミュレーションを説明するための図である。例えば、一次利用サービス提供部122は、図13に示すように、ライフログ情報から得られる10の項目について、「レベルI」から「レベルIII」までの3段階を選択可能なGUI(Graphical User Interface)を表示する。図13に示すGUIにおいて、各項目の各レベルは、ユーザの押下によって選択可能なボタンとなっている。一次利用サービス提供部122は、初めは、図13の左側に示すように、ユーザAの現在のライフスタイルの型を選択状態にして表示するが、図13の右側に示すように、ユーザAからの押下を受け付けて、そのライフスタイルの型を変更する。ここでは、例えば、ユーザAが、項目「飲酒」のレベルを「レベルIII」から「レベルII」に引き下げ、項目「疲れ」のレベルを「レベルII」から「レベルI」に引き下げた例を示す。なお、ユーザAによる選択の結果、ライフスタイルの型が30型に変更されたことも表示されている。また、シミュレーションのためのGUIは、図13の例に限られるものではない。例えば、プルダウンメニュー等で変更するものでもよい。
Then, as shown on the screen P10, the primary use
こうして、シミュレーションしたいライフスタイルの型を選択すると、ユーザAは、図12の画面P10において、『実行』のボタンを押下する。すると、一次利用サービス提供部122は、シミュレーションされたライフスタイルの型に対応する健康リスクグラフを特定するとともに、ユーザAの現在の健康状態に応じて、この健康リスクグラフを調整し、画面P11に示すように、シミュレーション後の健康リスクグラフを表示する。
Thus, when the lifestyle type to be simulated is selected, the user A presses the “execute” button on the screen P10 in FIG. Then, the primary use
ここで、一次利用サービス提供部122は、主治医等の医師に対して健康リスクグラフを表示する場合と、ユーザに対して健康リスクグラフを表示する場合とで、その表示形態を変更する。図14は、本実施形態において主治医及びユーザに表示される健康リスクグラフを説明するための図である。表示形態を変更するポイントは、主に次の2点である。
Here, the primary use
まず1点目は、疾病の名称の表示形態である。図14に示すように、一次利用サービス提供部122は、主治医用の健康リスクグラフを表示する場合には、疾病の正式名称と、ICDコードとを表示する。一方で、一次利用サービス提供部122は、ユーザ用の健康リスクグラフを表示する場合には、疾病の通称を表示する。例えば、一次利用サービス提供部122は、主治医用の健康リスクグラフにおいて、「肝細胞癌(C220)」と表示していた疾病を、ユーザ用の健康リスクグラフにおいては、「肝臓癌」と表示する。また、例えば、一次利用サービス提供部122は、主治医用の健康リスクグラフにおいて、「糖尿病性腎症(E142)」と表示していた疾病を、ユーザ用の健康リスクグラフにおいては、単に「糖尿病」と表示する。なお、一次利用サービス提供部122は、正式名称及びICDコードと、通称との対応付けを予め保持し、健康リスクグラフの表示にあたり、この対応付けを参照して、適宜置き換えを行う。
First, the first point is a display form of a disease name. As shown in FIG. 14, the primary use
次に2点目は、疾病の非表示である。図14に示すように、一次利用サービス提供部122は、主治医用の健康リスクグラフを表示する場合に表示していた疾病の一部を、ユーザ用の健康リスクグラフを表示する場合には非表示とする。即ち、上述したように、本実施形態においては、ユーザのゲノム要因の影響を強く受ける疾病についても、発症リスクの高い疾病として判明する可能性がある。しかしながら、このようなゲノム要因の影響を強く受ける疾病は、ライフスタイルの変更によっても避けられないこと、且つ、例えば治療法が確立しない難病の場合には、本人への告知が意味をなさない(若しくは、かえって悪影響を与える)事態が想定される。そこで、一次利用サービス提供部122は、ユーザ用の健康リスクグラフを表示する場合には、疾病の一部を非表示とすることができる。例えば、一次利用サービス提供部122は、主治医用の健康リスクグラフを表示する場合に表示していた疾病「脊髄小脳変性症(G319)」を、ユーザ用の健康リスクグラフを表示する場合には非表示とする。なお、例えば、一次利用サービス提供部122は、ゲノム要因の影響が強い難病のリストを予め保持し、健康リスクグラフの表示にあたり、このリストを参照して、適宜非表示とする。あるいは、例えば、一次利用サービス提供部122は、主治医から、非表示とすべき疾病の指定を受け付け、健康リスクグラフの表示にあたり、この指定を反映して、非表示とする。
Next, the second point is that the disease is not displayed. As shown in FIG. 14, the primary use
例えば、ユーザAは、シミュレーション後の健康リスクグラフを確認すると、『健康ステータス』のボタンを押下する。すると、画面P12に示すように、一次利用サービス提供部122は、シミュレーション後の「バーチャルクローン」と、健康ステータスとを表示する。例えば、ユーザAは、シミュレーション後の「バーチャルクローン」の表情や、健康ステータスを確認することで、シミュレーションの内容を実行することにより、健康リスクや健康ステータスが改善することを認識することができる。例えば、ユーザAは、飲酒をやや控え、十分に休養をとる生活に切り換えることで、「アルコール性肝疾患」や「肝臓癌」の発症を回避できることを認識することができる。また、一次利用サービス提供部122は、重い疾病を発症するリスクが低まったことを視覚的に表現したマークとして、「天使」のマークを表示する。なお、例えば、主治医からのコメントがアップロードされていた場合、一次利用サービス提供部122は、画面P12上に、『主治医からのコメント』のボタンを表示する。ユーザAは、この『主治医からのコメント』のボタンを押下することで、主治医のコメントを確認することもできる。
For example, when the user A confirms the health risk graph after the simulation, the user A presses the “health status” button. Then, as shown in the screen P12, the primary use
上述してきた画面遷移について、PHR表示装置200の表示制御部210による表示制御の観点から説明すると、以下の通りである。例えば、ユーザA本人のPHR表示装置200は、ユーザのPHRデータに基づいて推定されたユーザの将来の健康リスクを表示部220に表示する表示制御部210を備える。表示制御部210は、将来の健康リスクとともに、ユーザAの目標の健康状態及び当該目標の健康状態に到達するための指導情報のうち、少なくとも1つを表示する。将来の健康リスクは、例えば、「バーチャルクローン」や、健康ステータス、健康リスクグラフ、その他の文字情報等で表示される。また、目標の健康状態は、理想の「バーチャルクローン」や、理想の健康ステータス、シミュレーション後の健康リスクグラフ、その他の文字情報等で表示される。また、指導情報は、主治医からのコメントや、予め準備された文字情報等で表示される。
The screen transition described above will be described from the viewpoint of display control by the
また、表示制御部210は、操作者から推定の時点の指定を受け付けると、受け付けた時点に応じた将来の健康リスクを表示する。また、表示制御部210は、操作者から、推定に用いるユーザのPHRデータの期間の幅を受け付けると、受け付けた期間の幅に応じた将来の健康リスクを表示する。受け付けた期間の幅に応じた将来の健康リスクは、予め期間毎に準備されるものでもよいし、ユーザの指定を受け付けてから準備されるものでもよい。また、表示制御部210は、操作者からライフスタイルの変更指示を受け付けると、受け付けた変更指示に応じてシミュレーションされた将来の健康リスクを更に表示する。また、表示制御部210は、将来の健康リスクとして、ユーザAが将来発症し得る疾病の名称を、通称で表示する。また、表示制御部210は、ユーザA若しくはユーザAの家族に対して疾病の名称を表示する場合には、必要に応じて、一部の疾病の名称を非表示とする。
Moreover, if the
また、図12の例においては、ユーザA自身がライフスタイルを変更するシミュレーションを行って、シミュレーション後の健康リスクグラフや健康ステータスを確認する例を説明したが、実施形態はこれに限られるものではない。例えば、一次利用サービス提供部122は、理想の「バーチャルクローン」をユーザAに提案するライフスタイルとともに提示し、ユーザAに対して、ライフスタイルの改善を自動的に提案することもできる。
Moreover, in the example of FIG. 12, although the user A himself performed the simulation which changes a lifestyle and demonstrated the health risk graph and health status after simulation, embodiment was not restricted to this. Absent. For example, the primary use
このように、「将来の健康リスクのお知らせ」によれば、家族や主治医は、「バーチャルクローン」を通じて、ユーザ本人の体や心の健康をモニターすることができる。そして、適切な励ましや理想に向けた指導をすることもできる。ユーザ本人にとっては、健康作りのための手法や進捗状況を具体的に把握することができ、モチベーションを更に高めることができる。なお、上述した実施形態では、「バーチャルクローン」との対話や応答を想定していないが、例えば、シミュレーション技術を併せて活用することで、「バーチャルクローン」との対話や応答も実現することが可能である。この場合、ユーザ本人の「バーチャルクローン」のみならず、家族の「バーチャルクローン」や、主治医の「バーチャルクローン」を設定してもよい。これらの「バーチャルクローン」には、想定される会話や指導内容を、予め設定しておく。すると、実際に家族や主治医からコメントが付与されていない状況でも、ユーザは、コメントを得ることができる。更に、ユーザは、自分自身の「バーチャルクローン」と対話してもよい。 Thus, according to “Notice of Future Health Risk”, the family and the attending physician can monitor the physical health of the user himself / herself through the “virtual clone”. They can also give appropriate encouragement and guidance towards the ideal. For the user himself / herself, the method and progress for making health can be grasped specifically, and motivation can be further enhanced. In the above-described embodiment, dialogue and response with the “virtual clone” are not assumed. However, for example, by using simulation technology together, it is possible to realize dialogue and response with the “virtual clone”. Is possible. In this case, not only the “virtual clone” of the user but also the “virtual clone” of the family and the “virtual clone” of the attending physician may be set. In these “virtual clones”, assumed conversations and instruction contents are set in advance. Then, even in a situation where a comment is not actually given from the family or the attending physician, the user can obtain a comment. In addition, the user may interact with his own “virtual clone”.
上述してきたように、本実施形態によれば、ゲノム情報を含むPHRデータを活用し、各個人のライフスタイルとそのライフスタイルを続けることによる将来の健康リスクとを精度良く提示することができる。また、本実施形態によれば、最適な食事、運動、ライフスタイルの変革、個人に有効な医薬やサプリメントの推定をすることで、より健康で理想的な自己に近付く環境をもたらすことができる。また、理想の自己への到達度チェックは、目標が見えづらい努力の成果を具体化し、意欲や喜びに変える。なお、本実施形態は、災害等で孤立し、避難地で体調が悪化した際に、所在、生存状況、体調を遠隔で把握し管理する災害レジリエント対応も可能である。 As described above, according to the present embodiment, PHR data including genomic information can be utilized to accurately present each individual's lifestyle and future health risks due to continuing the lifestyle. In addition, according to the present embodiment, an optimal diet, exercise, lifestyle change, and estimation of medicines and supplements that are effective for individuals can provide a healthier and more ideal environment close to self. In addition, the achievement check for the ideal self embodies the results of efforts where it is difficult to see the goal, and changes it into motivation and joy. In addition, this embodiment is also capable of dealing with disaster resilience by remotely grasping and managing the location, survival status, and physical condition when the patient is isolated due to a disaster or the like and the physical condition deteriorates in the evacuation area.
(「健康リスク推定テーブルT」のその他の利用)
また、上述した実施形態では、具体例として、ユーザのゲノムの型及びライフスタイルの型を用いて「健康リスク推定テーブルT」を参照し、ライフスタイル要因の影響が強い疾病の情報を、健康リスクの推定結果としてフィードバックする例を説明した。しかしながら、「健康リスク推定テーブルT」から得られる情報の利用形態はこれに限られるものではない。
(Other uses of “Health Risk Estimation Table T”)
Further, in the above-described embodiment, as a specific example, the “health risk estimation table T” is referred to by using the user's genome type and lifestyle type, and information on diseases whose lifestyle factors have a strong influence is obtained. An example of feedback as an estimation result has been described. However, the use form of the information obtained from the “health risk estimation table T” is not limited to this.
例えば、ユーザにとって発症リスクの高い疾病が判明したのであるから、例えば、ユーザから収集するライフログ情報の項目を発症リスクの高い疾病に関する項目に絞り込み、集中的に収集するようにしてもよい。例えば、ユーザ側で利用するセンサの種類や項目を、ユーザのゲノムの型及びライフスタイルの型に合わせて変更することができる。 For example, since a disease with a high risk of onset for the user has been found, for example, the items of life log information collected from the user may be narrowed down to items related to the disease with a high risk of onset and collected intensively. For example, the types and items of sensors used on the user side can be changed in accordance with the user's genome type and lifestyle type.
また、例えば、ユーザのゲノムの型及びライフスタイルの型を用いて「健康リスク推定テーブルT」を参照することにより、ゲノム要因の影響が強い疾病の情報、即ち、ユーザによって遺伝的にハイリスクな疾病を推定することも可能である。 In addition, for example, by referring to the “health risk estimation table T” using the type of the user's genome and the type of lifestyle, information on diseases that are strongly influenced by genomic factors, that is, genetically high risk by the user. It is also possible to estimate the disease.
また、例えば、一次利用サービス提供部122は、ユーザにとって発症リスクの高い疾病の予兆を、日々ユーザから送信されるPHRデータから、いち早く補足する仕組みを設けてもよい。例えば、一次利用サービス提供部122は、特定の疾病に合わせた閾値を設け、ユーザから送信されるPHRデータを、逐次その閾値で確認する。
In addition, for example, the primary use
例えば、ハイリスクな疾病が判明したユーザに対しては、例えば、脳や心疾患等、重篤な疾患での予兆の補足を全センサが集中することで、サインを捉えて本人に警告して休憩を促し、早期受診を手配することで発作を抑え、発作が生じても、軽度のうちに迅速な対応や治療が可能となる等、新たな予防・先制医療革命をもたらす波及効果がある。あるいは、心突然死の発症リスクが高いユーザをゲノム情報で選別し、センサで常時自動監視し、発作を未然に防ぐためのライフスタイルの指示や、不整脈の発作時のみ補助的にペースメーカーを作動させたり、抗不整脈薬や抗血栓剤を充填した電子ピルをONにしたり、体調が悪化した際には即座に近隣医療機関や救急要請連絡、心停止の際には近隣のAED(Automated External Defibrillator)の所在場所の指示や救護対応支援等の緊急対応システムが構築可能となる。その結果、突然死や発作後の重症化に伴う長期に亘る後遺症、リハビリテーション、二次障害による寝たきりや痴呆症を予防低減することができ、高齢化社会でも誰もが健康に不安なく趣味や仕事、家事に取り組み、快活で安寧な人生を送ることができる。 For example, for users who have found a high-risk disease, for example, all sensors concentrate on supplementing signs of serious illness such as brain and heart disease, and the user is alerted by signing There is a ripple effect that will bring about a new preventive and preemptive medical revolution, such as prompting breaks and arranging early visits to control seizures, and even if seizures occur, quick response and treatment are possible. Alternatively, users with a high risk of sudden cardiac death are selected based on genome information and automatically monitored by a sensor at all times, lifestyle instructions to prevent seizures in advance, and a pacemaker is activated only during an arrhythmia attack. Or turn on an electronic pill filled with antiarrhythmic drugs or antithrombotic agents, immediately contact with a nearby medical institution or emergency request when physical condition deteriorates, or an AED (Automated External Defibrillator) nearby when cardiac arrest It is possible to construct an emergency response system such as instructions on the location of a person and rescue support. As a result, it is possible to prevent and reduce long-term sequelae, rehabilitation, bedriddenness and dementia due to secondary disabilities associated with sudden death or severe seizures. , Engage in housework and lead a lively and safe life.
また、ストレス時の不整脈に伴う脳梗塞発症サイン等、遺伝的にハイリスクな発症予備軍に対して、日常のデータ監視を強化するなかから、これらを見逃すことなく異常ログを捕捉することで、精度良く早期警戒情報や発症予防措置を各個人や医療機関へフィードバックすることが可能となる。これは、予め登録した離れた家族の情報も同様にフィードバック可能である。その結果、個人にとって最適なエビデンスに基づく個別化のための健康指導法や食、運動のより相応しい選択や生活様式の選択までをも通じて、具体的且つ、無理なく楽しく理想自己の実現が可能となるとともに、家族の見守りをまるで傍らにいるかのように常時行い、安寧な生活を実現できる。 In addition, by strengthening daily data monitoring for genetically high-risk oncology reserves such as cerebral infarction signs associated with arrhythmia during stress, by capturing abnormal logs without missing these, It is possible to accurately feed back early warning information and onset prevention measures to individuals and medical institutions. This is also possible to feed back information on a remote family registered in advance. As a result, it is possible to realize the ideal self in a concrete, effortless and fun way through the health guidance method for personalization based on the evidence that is optimal for the individual, the choice of food and exercise, and the choice of lifestyle. At the same time, it is possible to realize a peaceful life by always watching over the family as if they were beside them.
(二次利用サービス)
さて、これまで、PHRデータの一次利用サービスの一例として、「日常人間ドック」や、「将来の健康リスクのお知らせ」を説明してきたが、上述したように、本実施形態において、PHR処理装置100は、PHRデータの二次利用サービスの提供も想定している。例えば、PHR処理装置100は、ゲノムの型及びライフスタイルの型の組み合わせとある特定の目的との関連性を導き出すべく大規模ゲノム・コホートデータベース114aを解析し、ある一定の関連性を示す解析結果を得て、これを医療機関や各種企業等に提供する。
(Secondary use service)
So far, as an example of the primary use service of PHR data, “daily health checkup” and “notice of future health risk” have been described. As described above, in this embodiment, the
なお、大規模ゲノム・コホートデータベース114aに蓄積されたPHRビッグデータは、元々は各個人から収集されたPHRデータであり、即ち、個人情報である。このため、PHRデータの利用に関しては、「PHRデータの一次利用は許諾できるが二次利用は許諾できない」、「PHRデータの一次利用、二次利用のいずれも許諾できる」といったように、各個人の意思が異なる場合がある。そこで、本実施形態において、PHR処理装置100は、PHRデータを提供する各個人との間で予め、どの利用までを許諾するかを示す利用許諾を受け付け、利用許諾の情報をPHRデータに付帯させて管理している。利用許諾は、PHRデータ全体、あるいは、PHRデータ内の細分化項目の単位で受け付けられる。以下では、この利用許諾が得られていることを前提に、二次利用サービスの具体例を説明する。なお、以下に説明する具体例は一例に過ぎず、二次利用サービスは以下の具体例に限られるものではない。
The PHR big data accumulated in the large-scale
まず、第1の例として、ゲノムの型及びライフスタイルの型の組み合わせと、「薬効」との関連性を導き出し、これを医薬品の処方に活用する例を説明する。 First, as a first example, an example will be described in which a relationship between a combination of a genome type and a lifestyle type and a “medicinal effect” is derived and used for prescription of a medicine.
図15及び図16は、本実施形態における二次利用サービスの一例(第1の例)を説明するための図である。上述したように、大規模ゲノム・コホートデータベース114aは、各個人のPHRデータであるライフログ情報等が日々新たに蓄積されるとともに、新たな個人のPHRデータが新たな運用管理の対象として蓄積されることで、その規模を日々拡大している。
15 and 16 are diagrams for explaining an example (first example) of the secondary use service in the present embodiment. As described above, in the large-scale
PHRビッグデータ解析部121は、特定の医薬品の薬効という解析の目的の入力を受け付け、大規模ゲノム・コホートデータベース114aに蓄積されたPHRビッグデータを対象にコホート分析を行い、ゲノムの型及びライフスタイルの型の組み合わせと、特定の医薬品の薬効との関連性を導き出す。例えば、PHRデータには、電子カルテ情報が含まれており、電子カルテ情報には、当該個人に処方された医薬品の情報や、その後の経過を表す情報が含まれている。また、PHRデータには、ライフログ情報が含まれており、ライフログ情報には、医薬品が処方された後の当該個人の体調変化を表す情報や、当該個人の生活状況を表す情報が含まれている。
The PHR big
そこで、PHRビッグデータ解析部121は、これらの情報を含むPHRビッグデータを対象にコホート分析を行うことで、ゲノムの型及びライフスタイルの型の組み合わせと、薬効及び副作用との関連性を導き出す。そして、PHRビッグデータ解析部121は、図15に示すように、ゲノムの型及びライフスタイルの型の組み合わせを、薬効及び副作用の有無によって分類する。
Therefore, the PHR big
例えば、PHRビッグデータ解析部121は、特定の要因に曝露された集団(特定のゲノムの型及びライフスタイルの型の組み合わせにあてはまる集団)と曝露されていない集団(その組み合わせにあてはまらない集団)とを一定期間追跡し、薬効及び副作用の有無を比較することで、要因(特定のゲノムの型及びライフスタイルの型の組み合わせ)と、薬効及び副作用との関連性を導き出す。そして、PHRビッグデータ解析部121は、導き出した関連性に基づいて、ゲノムの型及びライフスタイルの型の組み合わせを、「薬効(−)、副作用(+)」、「薬効(−)、副作用(−)」、「薬効(+)、副作用(+)」、及び「薬効(+)、副作用(−)」の各グループに分類する。
For example, the PHR big
ここで、「薬効(−)、副作用(+)」及び「薬効(−)、副作用(−)」のグループに分類された型の組み合わせを有する者に対しては、その医薬品を処方することは不可である。また、「薬効(+)、副作用(+)」のグループに分類された型の組み合わせを有する者に対しては、その医薬品を処方することができるが、副作用を考慮する必要がある。また、「薬効(+)、副作用(−)」のグループに分類された型の組み合わせを有する者に対しては、その医薬品を処方することができる。この情報を医師に提供することで、医師は、患者に対して医薬品を処方する前に、その患者の型の組み合わせに応じた判断を行うことができる。 Here, for those who have a combination of types classified into the groups of “medicinal efficacy (−), side effect (+)” and “medicine efficacy (−), side effect (−)”, prescribing the medicinal product is It is impossible. In addition, for those who have a combination of types classified into the group of “medicine efficacy (+), side effect (+)”, the drug can be prescribed, but side effects need to be considered. Moreover, the pharmaceutical can be prescribed with respect to the person who has the combination of the type classified into the group of "medicine effect (+), side effect (-)". By providing this information to the doctor, the doctor can make a determination according to the combination of the patient types before prescribing the drug to the patient.
そこで、例えば、二次利用サービス提供部123は、医療機関との間で予め交わされた契約に基づいて、ゲノムの型及びライフスタイルの型の組み合わせと、薬効及び副作用との関連性を活用するための二次利用サービスを、医療機関の医師に対して提供する。その提供の手法としては様々な手法が考えられるが、以下では、図16を用いて1つの手法を説明する。
Therefore, for example, the secondary use
図16に示すように、例えば、二次利用サービス提供部123は、ヘルスケアクラウド10上に二次利用サービス用のポータルサイト14eを立ち上げ、医療機関の医師に対してポータルサイト14eへのアクセスを許可する。また、二次利用サービス提供部123は、医師に対して各個人のPHRデータへのアクセスを許可するとともに、ゲノムの型及びライフスタイルの型の組み合わせの分類結果へのアクセスを許可する。すると、医師は、ポータルサイト14eを介して、例えば、患者BのPHRデータを閲覧し、患者Bのゲノムの型及びライフスタイルの型の組み合わせを確認する。また、医師は、ポータルサイト14eを介して、分類結果を確認する。そして、医師は、患者Bのゲノムの型及びライフスタイルの型と、分類結果とを照合し、この患者Bに、特定の医薬品を処方すべきか否か、あるいは処方にあたり副作用を考慮する必要があるか否かを判断する。そして、医師は、この判断に基づいて、患者Bに対する処方箋を作成する。
As illustrated in FIG. 16, for example, the secondary usage
なお、二次利用サービスの提供の手法は、上述した手法に限られるものではない。二次利用サービス提供部123は、例えば、個人のゲノムの型及びライフスタイルの型の情報を含む実名リストと、特定の医薬品に関する分類結果とを作成し、これらを、医療機関等に送信してもよい。また、実名リストや分類結果は、オフラインで提供されてもよい。
Note that the method of providing the secondary usage service is not limited to the method described above. The secondary use
続いて、第2の例として、ゲノムの型及びライフスタイルの型の組み合わせと、「食品・サプリメントの効果」との関連性を導き出し、これを食品・サプリメントの販売や宣伝等に活用する例を説明する。 Next, as a second example, the relationship between the combination of the genome type and lifestyle type and the “effect of food / supplement” is derived, and this is used in the sales and promotion of food / supplements. explain.
図17は、本実施形態における二次利用サービスの一例(第2の例)を説明するための図である。PHRビッグデータ解析部121は、特定の健康飲料に含まれる成分(若しくは、その類似成分)による効果との関連性を導き出すという解析の目的の入力を受け付け、大規模ゲノム・コホートデータベース114aに蓄積されたPHRビッグデータを対象にコホート分析を行い、ゲノムの型及びライフスタイルの型の組み合わせと、特定の健康飲料との関連性を導き出す。例えば、PHRデータには、ライフログ情報が含まれており、ライフログ情報には、当該個人の体調を表す情報や、食品・サプリメントの摂取状況を表す情報が含まれている。
FIG. 17 is a diagram for explaining an example (second example) of the secondary usage service in the present embodiment. The PHR big
そこで、PHRビッグデータ解析部121は、これらの情報を含むPHRビッグデータを対象にコホート分析を行うことで、ゲノムの型及びライフスタイルの型の組み合わせと、特定の健康飲料との関連性を導き出す。例えば、PHRビッグデータ解析部121は、特定の要因に曝露された集団(特定のゲノムの型及びライフスタイルの型の組み合わせにあてはまる集団)と曝露されていない集団(その組み合わせにあてはまらない集団)とを一定期間追跡し、解析の対象とする特定の健康飲料に含まれる成分(若しくは、その類似成分)による効果の有無を比較することで、要因(特定のゲノムの型及びライフスタイルの型の組み合わせ)と、特定の健康飲料との関連性を導き出す。
Therefore, the PHR big
そして、PHRビッグデータ解析部121は、導き出した関連性に基づいて、ゲノムの型及びライフスタイルの型の組み合わせを、特定の健康飲料に含まれる成分(若しくは、その類似成分)に対する効果を有するグループと、効果を有しないグループとに分類する。更に、PHRビッグデータ解析部121は、効果を有するグループを、摂取中の食品・サプリメントとの食べ合わせに鑑みて、2つのグループに分類する。
And the PHR big
即ち、特定の健康飲料に対して効果を有しないグループに分類された型の組み合わせを有する者に対しては、その健康飲料を販売することは推奨されない。また、特定の健康飲料に対して効果を有するグループのうち、摂取中の食品・サプリメントとの食べ合わせに留意しなければならないグループに分類された型の組み合わせを有する者に対しては、その健康飲料を販売することは可能であるが、摂取にあたって食べ合わせの留意点を伝えることが望ましい。また、残りのグループに分類された型の組み合わせを有する者に対しては、その健康飲料を販売することが推奨される。 That is, it is not recommended to sell the health drink to those who have a combination of types classified into groups that have no effect on a particular health drink. In addition, for those who have a combination of types classified into groups that have to pay attention to eating with foods and supplements that are effective for specific health drinks, the health Although it is possible to sell beverages, it is desirable to convey the points to remember when eating. Moreover, it is recommended to sell the health drink to those who have the combination of the types classified into the remaining groups.
そこで、例えば、二次利用サービス提供部123は、食品・サプリメント販売会社との間で予め交わされた契約に基づいて、ゲノムの型及びライフスタイルの型の組み合わせと、健康飲料との関連性を活用するための二次利用サービスを、食品・サプリメント販売会社15aに対して提供する。その提供の手法としては様々な手法が考えられるが、以下では、図17を用いて1つの手法を説明する。
Therefore, for example, the secondary use
図17に示すように、例えば、二次利用サービス提供部123は、PHRデータの提供者であるユーザ群の中から、特定の健康飲料を販売することが可能、若しくは推奨されるグループに分類された型の組み合わせを有するユーザを抽出する。そして、二次利用サービス提供部123は、これらのユーザについて、留意点を含む実名リストを作成し、この実名リストを食品・サプリメント販売会社15aに送信する。なお、実名リストは、ポータルサイト経由の閲覧で提供されてもよいし、オフラインで提供されてもよい。すると、図17に示すように、食品・サプリメント販売会社15aは、この実名リストを用いて、ダイレクトメール(Direct Mail:DM)等による販売促進活動を行う。また、食品・サプリメント販売会社15aは、販売促進活動において、必要に応じて留意点に言及する。
As shown in FIG. 17, for example, the secondary use
次に、例えば、二次利用サービス提供部123は、特定の健康飲料を販売することが可能、若しくは推奨されるグループに分類された型の組み合わせを有するユーザに対応するPHRデータを一定期間追跡する。そして、二次利用サービス提供部123は、ライフログ情報を用いて、この特定の健康飲料を購入したであろうユーザを割り出し、購入ユーザのPHRデータを、食品・サプリメント販売会社に送信する。なお、購入ユーザのPHRデータは、ポータルサイト経由の閲覧で提供されてもよいし、オフラインで提供されてもよい。
Next, for example, the secondary usage
すると、図17に示すように、食品・サプリメント販売会社15aは、PHRデータを用いて健康飲料の効果を検証する。例えば、食品・サプリメント販売会社15aは、効果を示す定量的な数値を算出する。そして、食品・サプリメント販売会社15aは、特定の健康飲料を販売することが可能、若しくは推奨されるグループに分類された型の組み合わせを有するユーザのうち、非購入ユーザに対して、算出した数値を根拠とする効果のフィードバックを行う。
Then, as shown in FIG. 17, the food /
なお、上述した例では、二次利用サービス提供部123は、PHRデータを用いて特定の健康飲料を購入したであろうユーザを割り出し、購入ユーザのPHRデータ自体を、食品・サプリメント販売会社15aに提供する例を説明したが、実施形態はこれに限られるものではない。
In the above-described example, the secondary usage
例えば、二次利用サービス提供部123は、特定の健康飲料を購入したであろうユーザを割り出すとともに、そのPHRデータを解析して、実際に効果が得られたユーザを絞り込み、絞り込んだユーザの実名リストを、食品・サプリメント販売会社15aに提供することもできる。例えば、食品・サプリメント販売会社15aが、顕著に効果が現れるユーザにターゲットを絞って販売活動を行うことを望む場合には、このような絞り込みが有効である。また、例えば、二次利用サービス提供部123は、実際に効果が得られたユーザのライフスタイルの型を絞り込み、効果に結び付くライフスタイルを特定する。そして、二次利用サービス提供部123は、特定したライフスタイルの情報を、食品・サプリメント販売会社15aに提供することもできる。この場合、食品・サプリメント販売会社15aは、販売時にライフスタイルの提案を併せて行うことができる。
For example, the secondary use
続いて、第3の例として、ユーザから送信されたPHRデータ自体を、遠く離れた家族の家族見守りサービス等に活用する例を説明する。 Subsequently, as a third example, an example will be described in which PHR data itself transmitted from a user is used for a family watching service of a distant family.
図18は、本実施形態における二次利用サービスの一例(第3の例)を説明するための図である。図18に示すように、例えば、二次利用サービス提供部123は、PHRデータを提供する各ユーザとの間で予め、利用許諾を受け付ける。この利用許諾は、例えば、ライフログ情報のうちどの項目について開示を許諾するか(開示項目)、また、その開示相手は誰か(開示先)、という内容である。
FIG. 18 is a diagram for describing an example (third example) of the secondary usage service in the present embodiment. As illustrated in FIG. 18, for example, the secondary use
例えば、二次利用サービス提供部123は、ユーザE用のポータルサイト14f上で、高齢者のユーザEから利用許諾を受け付ける。例えば、図18の例では、ライフログ情報のうち、血圧や心拍数について、家族見守りサービスへの二次利用を許諾すること、そして、情報の開示相手は、娘のユーザAや、息子のユーザDであることが示されている。同様に、ライフログ情報のうち、運動量や睡眠量について、家族見守りサービスへの二次利用を許諾すること、そして、情報の開示相手は、娘のユーザAや、息子のユーザDであることが示されている。一方、ライフログ情報のうち、位置情報については、家族見守りサービスへの二次利用を許諾しないことが示されている。
For example, the secondary usage
二次利用サービス提供部123は、二次利用に関して受け付けたこのような利用許諾の情報を、PHR蓄積部110に伝える。すると、PHR蓄積部110は、ユーザEから送信されたPHRデータに対して、上述した内容が記述された利用許諾の情報を付帯させた上で記憶する。なお、利用許諾情報の付帯のさせ方は、PHRデータ全体に対して付帯させる手法でもよいし、あるいは、各細分化項目のデータそれぞれに対して付帯させる手法でもよい。このPHRデータを利用する側でこの利用許諾情報を確認可能な付帯のさせ方であれば、任意の手法を採用することができる。
The secondary usage
また、二次利用サービス提供部123は、このように提供されたPHRデータを家族見守りサービスに適した形態に加工する等して、家族見守りサービスを提供するセキュリティ会社15bに提供する。例えば、二次利用サービス提供部123は、1週間分の血圧や心拍数、運動量や睡眠量について、1週間の傾向を容易に把握できるように、各値を時系列順にプロットしたグラフ等の形態に加工し、加工後のPHRデータを、セキュリティ会社15bに提供する。なお、提供の手法は、オンライン若しくはオフラインのいずれでもよい。なお、二次利用サービス提供部123は、該当のPHRデータ自体をセキュリティ会社15bに提供してもよい。この場合、上述した加工は、必要に応じて、セキュリティ会社15bが行う。
Further, the secondary usage
例えば、セキュリティ会社15bは、家族見守りサービスを運用している。例えば、家族見守りサービスの加入者は、高齢者ユーザEの娘のユーザAである。ユーザAは、セキュリティ会社15bとの契約の中で、高齢者ユーザEが見守りの対象であること、また、自分の他に、ユーザEの息子であるユーザDも、このサービスを利用したいこと等を決める。なお、この家族見守りサービスの加入者と、PHR処理装置100側で提供するサービスのユーザとは必ずしも一致しなくてもよい。
For example, the
こうして、例えば、セキュリティ会社15bは、高齢者のユーザE用の見守りポータルサイト14gを、自らのサイトに立ち上げる。この見守りポータルサイト14gへのアクセスは、ユーザA及びユーザDに対してのみ許可されている。そして、ユーザAやユーザDは、見守りポータルサイト上で、例えば、この1週間における母親の健康状態や、運動の様子、睡眠の状況等を確認することができる。
In this way, for example, the
上述したように、第3の例において、二次利用サービス提供部123は、ユーザから送信されたPHRデータに対して、開示項目及び開示先に関する利用許諾を受け付ける。そして、二次利用サービス提供部123は、受け付けた利用許諾に従って、ユーザのPHRデータ若しくはこのPHRデータの加工情報を出力する。こうして、遠くに離れた家族のライフログ情報に基づいて、離れていても家族の状況がわかるサービスを提供することができる。また、その際に、特定の相手にだけ、ライフログ情報の中でも指定した情報のみを開示できる仕組みを実現することができる。また、各ライフログ情報には、利用許諾の情報が付帯されており、特定の相手には開示してもよい旨の印をつけることが可能なデータの持ち方になっている。
As described above, in the third example, the secondary usage
以上、PHRビッグデータの二次利用として、第1、第2及び第3の例を説明してきた。このような二次利用が進むことで、PHRデータの提供者に対して単に将来の健康リスク評価結果を返すための支援サービスのみならず、流通や商品販売・サービス提供、ライフスタイル設計、地域通貨として使用できるポイント還元制度等、個人や自治体、社会に種々の経済的なメリットも返ってくる新たなビジネスモデル構築が可能となる。 Heretofore, the first, second, and third examples have been described as secondary usage of PHR big data. As such secondary use progresses, not only support services for returning future health risk assessment results to PHR data providers, but also distribution, product sales and service provision, lifestyle design, local currency It is possible to construct a new business model that returns various economic benefits to individuals, local governments, and society, such as a point reduction system that can be used as
上述してきたように、本実施形態は、参加者や規模が増大するにつれ、検証サイクルやエビデンスの蓄積がなされ、より確実性と信頼性の高いシステムとして性能が向上する。また、多様なデータから構成されるためにその有用性も高い。これらのデータベースを加工し、産業への二次利用を様々な形で推進することで、今まで蓄積される一方で価値を十分に見出せなかったライフログ・ビッグデータやゲノム情報に基づく基礎データに、新しい画期的な価値を持たせることが可能となり、それらを活用した新たな革新的な産業創出が可能となる。 As described above, according to the present embodiment, as the number of participants and the scale increase, the verification cycle and evidence are accumulated, and the performance is improved as a system with higher certainty and reliability. Further, since it is composed of various data, its usefulness is also high. By processing these databases and promoting their secondary use in various forms, it has become a basic data based on lifelog big data and genomic information that have been accumulated up to now but have not been able to find sufficient value. It will be possible to give new and innovative value, and it will be possible to create new and innovative industries using them.
(PHRデータ収集のためのインセンティブ)
さて、これまで、PHRデータの一次利用サービスの一例として、「日常人間ドック」や、「将来の健康リスクのお知らせ」を説明してきた。また、PHRデータの二次利用サービスについても、具体例を挙げて説明してきた。いずれの場合も、一次利用や二次利用に必要なデータ量や種類を満たすPHRデータが、各個人から継続的に送信されることが望ましい。そこで、本実施形態において、PHR処理装置100は、各個人に対してPHRデータを継続的に送信させるためのインセンティブの仕組みも更に構築する。
(Incentive for PHR data collection)
So far, "daily health checkup" and "notice of future health risks" have been described as examples of the primary use service of PHR data. Further, the secondary use service of PHR data has been described with specific examples. In any case, it is desirable that PHR data satisfying the data amount and type necessary for primary use and secondary use is continuously transmitted from each individual. Therefore, in this embodiment, the
仕組みその1は、二次利用サービスとの連携である。各ユーザが送信したPHRデータは、当該ユーザの許諾が得られた場合には、二次利用サービスにも提供される。そこで、PHR処理装置100は、例えば、この二次利用サービスに関連してデータ信託会社11にて得られた収益金に基づいて、ポイント制度(ポイント、マイレージ、分配金等)等、何らかの形で各ユーザにフィードバックする仕組みを構築する。
仕組みその2は、ユーザ間の競争である。各ユーザは、友人や家族等の競争相手との間で勝ち負けを競うことで、健康への意欲を高めることができる。そこで、PHR処理装置100は、例えば、PHRデータのデータ量や種類の数、あるいは、体重や血圧等の生体情報、一日に歩いた距離や歩数等の行動情報に関して、競争相手同士で比較し、勝ち負けを競う仕組みを構築する。なお、この競争相手は、仮想的に設定された、仮想の友人、恋人や家族等でもよい。
仕組みその3は、上述した実施形態で既に説明した、元気予報である。即ち、各ユーザは、PHRデータをPHR処理装置100に提供することで、このPHRデータに基づいて推定された自らの将来の健康リスクを元気予報として受け取ることができる。上述したように、元気予報は、様々な形で将来の健康リスクを提示する。例えば、ユーザは、今週、今月、今年や、過去1日、過去1週間、過去1ヶ月、過去1年等、推定対象期間に応じた推定を行うこともできれば、将来の時点として、1日後、1週間後、1ヶ月後、1年後、5年後、10年後、20年後等、任意の時点を選択して推定することもできる。
それでは、以下では、上述した仕組みその1及び仕組みその2を、詳細に説明する。
In the following,
図19は、本実施形態におけるインセンティブの仕組みその1を説明するための図である。図19に示すように、一次利用サービス提供部122は、インセンティブ処理部122a(「提示部」とも呼ばれる)を備える。インセンティブ処理部122aは、所定のユーザのPHRデータを評価し、評価の結果を当該所定のユーザに提示する。例えば、インセンティブ処理部122aは、二次利用サービス提供部123と連携し、PHRデータの二次利用を許諾した所定のユーザに関して、二次利用サービス提供部123から、二次利用に活用されたPHRデータのデータ量、種類、種類の数、及びこのPHRデータが活用された二次利用サービスの有用性等の活用情報を受け取る。そして、インセンティブ処理部122aは、これらの活用情報に基づいてポイントを算出し、算出したポイントに関する情報(例えば、ポイント自体、ポイントに応じてユーザに還元されるサービス、分配金の金額等)をユーザに提示する。
FIG. 19 is a diagram for explaining an
例えば、インセンティブ処理部122aは、ユーザAのポータルサイト14hに、公募情報を提示する。この公募情報には、例えば、「医薬品の開発にご協力をお願いします。」といった二次利用の目的の概要や、ポイントの値、その目的のために必要とされるPHRデータのデータ量(例えば、送信頻度、送信期間等)及び種類(例えば、生体情報や行動情報の具体的な項目等)が記載される。例えば、ユーザAは、この公募情報を閲覧し、応募(利用許諾)の手続を行う。また、ユーザAは、公募情報に記載のPHRデータの規定に従い、PHRデータを、PHR処理装置100に向けて、日々送信する。
For example, the
こうして、PHR処理装置100に送信され、蓄積されたユーザAのPHRデータは、その利用許諾に従い、やがて上述した目的の二次利用に提供されることになる。そして、上述したように、インセンティブ処理部122aは、二次利用サービス提供部123から活用情報を受け取り、これらの活用情報に基づいてポイントを算出し、算出したポイントに関する情報をユーザに提示する。例えば、インセンティブ処理部122aは、図19に示すように、ポータルサイト14iに、「ユーザAさんの獲得ポイント○○○pts」を表示する。なお、ポイントの算出は、必ずしも二次利用後である必要はなく、二次利用に提供される前に行われてもよい。
In this way, the PHR data of the user A transmitted and accumulated to the
このポイント制度は、データ信託会社11によって運用管理されており、データ信託会社11が、ポイントに基づいた具体的な還元をユーザAに対して行う。例えば、データ信託会社11がこの二次利用サービスに関連して収益金を得ている場合、データ信託会社11は、この収益金をもとに企業や商店と提携しており、ユーザAが、この提携先の企業や商品からポイント還元を受けるようにする。ポイント還元は、例えば、サービスや景品等、どのような形態であってもよい。あるいは、データ信託会社11は、収益金の一部を分配金という形でユーザAに送金してもよい。
This point system is managed and managed by the
ところで、ポイントは、二次利用サービスの有用性にも基づいて算出されると述べた。この点について補足説明を行う。二次利用サービスの目的には、医薬品の開発や、薬事法上の承認を得るために行われる臨床試験(治験)のように、社会的意義の高いものがある一方で、例えば、映画や番組の視聴者から身体に現れた生体情報を集めるといったように、単なるマーケティングの一環として行われるものもある。どのような目的を有用性が高い目的であるとし、またどのような目的を有用性が低い目的であるとするかは、データ信託会社11側で任意に設定可能であるが、例えば、医療目的は有用性が高く、マーケティング目的は有用性が低いといった設定をすることができる。又は、データ信託会社11は、実際に得られた収益金(若しくは、得られるであろう見込みの収益金)の全体の収益金に対する比率に応じて、有用性を設定してもよい。
By the way, it was stated that points are calculated based on the usefulness of secondary usage services. A supplementary explanation will be given on this point. The purpose of secondary use services is highly socially significant, such as the development of pharmaceuticals and clinical trials (clinical trials) for obtaining approval under the Pharmaceutical Affairs Law. Some of them are simply part of marketing, such as collecting biometric information that appears on the body from viewers. The
なお、上述した例においては、ユーザから送信されたPHRデータが二次利用サービスにも提供されることを前提に、この二次利用サービスに関連して、ポイント制度等何らかの形で各ユーザにフィードバックが行われる仕組みを説明したが、実施形態はこれに限られるものではない。インセンティブ処理部122aによるポイント制度は、二次利用サービスとは切り離して、単にユーザから送信されたPHRデータのデータ量、種類、種類の数に基づいて運用されてもよい。この場合、例えば、インセンティブ処理部122aは、各ユーザのPHRデータについて、データ量、種類、及び種類の数のうち、少なくとも1つに基づいてポイントを算出し、算出したポイントに関する情報をユーザに提示する。
In the above-described example, on the assumption that the PHR data transmitted from the user is also provided to the secondary usage service, feedback is provided to each user in some form such as a point system in relation to the secondary usage service. Although a mechanism for performing the above has been described, the embodiment is not limited to this. The point system by the
また、上述した例においては、PHRデータのデータ量、種類、種類の数、及びこのPHRデータが活用された二次利用サービスの有用性等に基づいてポイントを算出する例を説明したが、実施形態はこれに限られるものではない。インセンティブ処理部122aは、PHRデータの送信状況を評価するための何らかの基準に基づいてポイントを算出すればよい。
In the above-described example, the example in which the points are calculated based on the data amount, the type, the number of types of PHR data, the usefulness of the secondary usage service using the PHR data, and the like has been described. The form is not limited to this. The
次に、図20は、本実施形態におけるインセンティブの仕組みその2を説明するための図である。仕組みその2においても、インセンティブ処理部122aは、所定のユーザのPHRデータを評価し、評価の結果を当該所定のユーザに提示する。例えば、図20に示すように、インセンティブ処理部122aは、PHRデータを送信している複数のユーザ間に競争関係を設定し、そのユーザ間で、ライフログ情報に関する比較を行う。そして、インセンティブ処理部122aは、競争関係にあるユーザそれぞれにその結果を提示する。
Next, FIG. 20 is a diagram for explaining the
例えば、インセンティブ処理部122aは、ユーザAから、競争相手としてユーザCを設定する旨の申請を受け付ける。すると、インセンティブ処理部122aは、ユーザAとユーザCとの間で競争を行うためのポータルサイト14jをヘルスケアクラウド10上に設定するとともに、ユーザA及びユーザCのポータルサイトそれぞれにこの競争用のポータルサイト14jへのリンク付けを行う。こうして、ユーザA及びユーザCのそれぞれは、自らのポータルサイトを経由して、2人の競争用のポータルサイト14jを閲覧することができる。
For example, the
また、例えば、インセンティブ処理部122aは、ユーザA及びユーザCからの希望に応じた頻度(例えば、毎日、週に1回、月に1回、年に1回等)で、2人の競争用のポータルサイト14jの更新を行う。例えば、ユーザA及びユーザCからの希望が、週に1回の頻度であったとする。すると、インセンティブ処理部122aは、週に1回、過去1週間分のユーザAのPHRデータから、予め競争対象として指定された競争項目の情報を抽出し、同様に、ユーザCのPHRデータから、予め競争対象として指定された競争項目の情報を抽出する。そして、インセンティブ処理部122aは、それぞれのPHRデータから抽出した競争項目の情報を比較し、勝ち負けを判定する。
In addition, for example, the
図20の例でいうと、例えば、インセンティブ処理部122aは、各ユーザのPHRデータについて、そのデータ量や種類の数を特定するとともに、ライフログ情報から、体重情報や血圧情報、1日の平均歩数等を得る。図20の例では、ユーザAは、1週間のうち、7日間PHRデータの送信を行い、また、20項目について送信を行っている。ユーザAは、0.5kgの減量に成功し、血圧は普通であり、1日の平均歩数は7,500歩と多い。一方、ユーザCは、1週間のうち、5日間PHRデータの送信を行い、また、19項目について送信を行っている。ユーザCは、1.0kgの体重が増えており、血圧は普通であり、1日の平均歩数は5,000歩と少なめである。
In the example of FIG. 20, for example, the
インセンティブ処理部122aは、これらの情報を予め定めた基準で評価し、勝ち負けを判定する。そして、インセンティブ処理部122aは、その判定結果を、例えば、図20に示すように、勝ち負けを視覚的に表現したマークや、文字情報等で表示する。また、図20の例では、インセンティブ処理部122aは、この競争の結果に対してもポイントを付与している。なお、ここで説明した競争項目や競争の基準、競争用のポータルサイト14jのGUI、競争の結果のフィードバック法等は、いずれも任意に変更することが可能である。例えば、インセンティブ処理部122aは、競争の結果をそれぞれのユーザのメールアドレスに送付してもよい。
The
(生体情報解析)
さて、これまで、ゲノム情報と日々収集されるライフログ情報とを用いてユーザの健康リスクを推定する例などについて説明してきた。しかしながら、ゲノム情報とライフログ情報の利用は上記した例に限られるものではなく、種々の解析に用いられる場合であってもよい。例えば、ライフログ情報において行動情報と関連付けられた生体情報に着目して解析する場合であってもよい。上述したように、各ユーザから日々収集される生体情報は、血圧、心拍数、脈拍、体温、体成分、イオン、pH濃度、糖分、塩分等の成分量、胃酸の濃度、農薬、環境物質、食品添加物の有無、アルコールやニコチン、薬剤成分などが挙げられる。また、生体情報として、タンパク質、ペプチド、脂質、糖鎖などのバイオマーカーなども挙げられる。
(Biological information analysis)
So far, an example of estimating a user's health risk using genome information and life log information collected every day has been described. However, the use of genome information and life log information is not limited to the above example, and may be used for various analyses. For example, it may be a case where analysis is performed by paying attention to biological information associated with action information in life log information. As described above, the biological information collected from each user on a daily basis includes blood pressure, heart rate, pulse, body temperature, body components, ions, pH concentration, sugar content, salt content, etc., gastric acid concentrations, agricultural chemicals, environmental substances, Examples include the presence or absence of food additives, alcohol and nicotine, and pharmaceutical ingredients. Biometric information includes biomarkers such as proteins, peptides, lipids, and sugar chains.
ここで、上述したバイオマーカーは、例えば、血清、尿、涙液、唾液、脳脊髄液、膵液、関節液、乳腺吸引液、胆汁などの体液に含まれるタンパク質、ペプチド、脂質、糖鎖などであり、体内の生理状態を反映するものである。従って、例えば、ある疾患に関連するバイオマーカーを利用することで疾患の早期発見に繋がり、早期治療を行うことができる。このようなバイオマーカーの情報は、例えば、生体センサによって収集される場合であってもよく、定期的な検査によって収集される場合であってもよい。 Here, the above-described biomarkers include, for example, proteins, peptides, lipids, sugar chains and the like contained in body fluids such as serum, urine, tears, saliva, cerebrospinal fluid, pancreatic juice, joint fluid, mammary aspirate, bile, etc. Yes, it reflects the physiological state of the body. Therefore, for example, using a biomarker related to a certain disease leads to early detection of the disease, and early treatment can be performed. Such biomarker information may be collected by, for example, a biosensor, or may be collected by periodic inspection.
バイオマーカーの一例としては、例えば、血液検査によって一般的に計測される「総蛋白」、「GOT(グルタミン酸オキサロ酢酸トランスアミナーゼ)」、「GPT(グルタミン酸ピルビン酸トランスアミナーゼ)」、「ALP(アルカリフォスファターゼ)」、「γ‐GTP(γグルタミルトランスペプチダーゼ)」、「LDH(乳酸脱水素酵素)」、「総ビリルビン」、「アミラーゼ」、「総コレステロール」、「中性脂肪」、「HDLコレステロール」及び「ヘモグロビン」などが挙げられる。なお、ここで挙げたバイオマーカーはあくまでも一例であり、生体情報としてのバイオマーカーはこれに限定されるものではない。現在、種々の体液を用いて、疾患に関連するバイオマーカーの探索が盛んに行われ、様々なバイオマーカーが同定されている。そして、今後も多数のバイオマーカーが同定されると考えられる。本実施形態におけるバイオマーカーは、それらすべてのバイオマーカーを利用することができる。 Examples of biomarkers include, for example, “total protein”, “GOT (glutamate oxaloacetate transaminase)”, “GPT (glutamate pyruvate transaminase)”, “ALP (alkaline phosphatase)”, which are generally measured by blood tests. , “Γ-GTP (γ-glutamyl transpeptidase)”, “LDH (lactate dehydrogenase)”, “total bilirubin”, “amylase”, “total cholesterol”, “neutral fat”, “HDL cholesterol” and “hemoglobin” Or the like. Note that the biomarkers listed here are merely examples, and biomarkers as biological information are not limited thereto. Currently, biomarkers related to diseases are actively searched using various body fluids, and various biomarkers have been identified. Many biomarkers will be identified in the future. All the biomarkers can be used as the biomarkers in the present embodiment.
このような種々の生体情報は、ユーザが日常生活を送る中で日々収集され、PHRビッグデータとして蓄積されていく。PHR処理装置100は、各生体情報について各種解析を実行して、結果をユーザなどに提供する。例えば、PHR処理装置100は、生体情報の種類ごとに、収集したデータを比較して比較結果を導出する。一例を挙げると、PHR処理装置100は、日々収集される生体情報のデータ(例えば、血圧など)について、他者のデータ間を比較して解析したり、個人のデータ間を比較して解析したりする。以下、これらの比較解析について説明する。
Such various kinds of biological information are collected every day while the user spends their daily life and accumulated as PHR big data. The
まず、他者のデータ間を比較して解析する場合について説明する。他者のデータ間を比較して解析する場合、PHR処理装置100は、例えば、所定のユーザの生体情報がその他のユーザの生体情報と比較してどのようになっているかを解析する。また、PHR処理装置100は、複数のユーザをグループ分けして、各グループの生体情報が他のグループの生体情報と比較してどのようになっているかを解析する。ここで、PHR処理装置100は、複数のユーザをゲノム情報と属性情報に基づいてグループ分けして比較を行う。
First, the case of comparing and analyzing the data of another person will be described. When comparing and analyzing data of other people, for example, the
例えば、所定のユーザの生体情報が他のユーザの生体情報と比較してどのようになっているかを解析する場合、PHR処理装置100は、ゲノム情報と属性情報に基づいて複数のユーザをグループ分けし、グループ内のユーザ間で生体情報を比較して解析する。また、例えば、各グループの生体情報が他のグループの生体情報と比較してどのようになっているかを解析する場合、PHR処理装置100は、ゲノム情報と属性情報に基づいて複数のユーザをグループ分けし、グループ間で生体情報を比較して解析する。なお、以下の例では、PHRビッグデータ解析部121が、生体情報を比較する比較部としての機能と、比較結果に基づいてどの位置にあるかを解析する解析部としての機能とを含む場合を例に挙げて説明するが、実施形態はこれに限定されるものではなく、PHR処理装置100が、比較部と解析部とをそれぞれ備える場合であってもよい。
For example, when analyzing how the biometric information of a given user is compared with the biometric information of other users, the
具体的には、所定のユーザの生体情報が他のユーザの生体情報と比較してどのようになっているかを解析する場合、PHRビッグデータ解析部121は、PHR蓄積部110に蓄積された情報に基づいて、所定の生体情報について、ゲノム情報と各ユーザの属性情報とを組み合わせて形成されるグループの中で、各ユーザの継続的に収集される生体情報を比較する。そして、PHRビッグデータ解析部121は、比較した結果に基づき、各ユーザの生体情報の値が当該グループの中のどの位置にあるかを示す。また、各グループの生体情報が他のグループの生体情報と比較してどのようになっているかを解析する場合、PHRビッグデータ解析部121は、PHR蓄積部110に蓄積された情報に基づいて、ゲノム情報と各ユーザの属性情報とを組み合わせて形成されるグループごとに、当該グループに属する各ユーザの継続的に収集される生体情報を集約して、グループ間の生体情報を比較する。そして、PHRビッグデータ解析部121は、比較した結果に基づき、各グループの生体情報の値がグループ間でどの位置にあるかを示す。
Specifically, when analyzing how the biometric information of a predetermined user is compared with the biometric information of other users, the PHR big
ここで、PHRビッグデータ解析部121は、位置として、生体情報の値の分布においてどの位置にあるかを示す。すなわち、PHRビッグデータ解析部121は、各ユーザの位置として、グループに属する各ユーザの所定の生体情報の値の分布における各ユーザの値の位置を導き出し、各グループの位置として、各グループの所定の生体情報の値の平均値の分布における各グループの平均値の位置を導き出す。ここで、上記した属性情報には、ユーザの居住地域、年齢、性別、人種、所属する健康保険組合の情報が含まれ、PHRビッグデータ解析部121は、グループとして、各ユーザのゲノム情報と上記した属性情報とを組み合わせたグループを形成させる。また、上記した位置には、順位や、偏差値などが含まれ、PHRビッグデータ解析部121は、グループ内のユーザの順位や偏差値、或いは、各グループの順位や偏差値などを位置として導出する。
Here, the PHR big
図21A及び図21Bは、本実施形態におけるユーザ間の比較解析を説明するための図である。例えば、PHRビッグデータ解析部121は、図21Aに示すように、複数のユーザを「ゲノム情報:ゲノム2型」、「属性情報:年齢」でグループG1〜グループG4に分類する。そして、PHRビッグデータ解析部121は、分類したグループごとに、例えば、血圧を比較して、各ユーザの血圧の値がグループの中でどの位置にあるのかを示す。一例を挙げると、PHRビッグデータ解析部121は、「ゲノム2型、年齢:〜40歳」のグループG1に属するすべてのユーザの血圧(拡張期血圧及び収縮期毛血圧)の情報を集約して、図21Aに示すように、拡張期血圧及び収縮期血圧それぞれについてヒストグラムを生成して、グループG1に属するユーザの血圧がどの位置にあるのかを導出する。
21A and 21B are diagrams for explaining comparison analysis between users in the present embodiment. For example, as shown in FIG. 21A, the PHR big
同様に、PHRビッグデータ解析部121は、図21Aに示すように、「ゲノム2型、年齢:40〜50歳」のグループG2、「ゲノム2型、年齢:50〜60歳」のグループG3、「ゲノム2型、年齢:60歳〜」のグループG4について、それぞれ血圧のヒストグラムを生成して、グループごとに各ユーザの血圧がどの位置にあるのかを導出する。ここで、図21Aにおいては、「ゲノム情報:ゲノム2型」、「属性情報:年齢」で形成されたグループについて示しているが、これはあくまでも一例であり、PHRビッグデータ解析部121は、その他のゲノムの型でも同様に、ゲノムの型と年齢で複数のユーザをグループ分けし、グループごとに生体情報を比較して、各ユーザの生体情報の値がグループの中でどの位置にあるのかを示す。また、属性情報も年齢だけではなく、性別や居住地域などが用いられる。一例を挙げると、PHRビッグデータ解析部121は、「ゲノム情報:ゲノム2型、属性情報:男性」のグループと「ゲノム情報:ゲノム2型、属性情報:女性」のグループなどを形成させる。
Similarly, as shown in FIG. 21A, the PHR big
また、グループ分けに用いられる属性情報は、1つには限られず、2つ以上の属性情報が用いられる場合であってもよい。一例を挙げると、PHR処理装置100は、「所定の居住地域」における「ゲノム2型」の「年齢」別のグループをそれぞれ形成させる。このように、PHRビッグデータ解析部121は、「ゲノム情報」と「属性情報」とを用いてユーザをグループに分け、グループごとにユーザ間の比較解析を行う。これにより、ユーザは、自身と同じゲノムの型を有し、同様の属性情報を有する他のユーザと比較して、自分がどのような位置にあるのかを把握することができる。以下、図21Bを用いて比較解析の一例を説明する。なお、図21Bにおいては、図21Aに示すグループG1での比較解析を一例に挙げる。
The attribute information used for grouping is not limited to one, and two or more attribute information may be used. As an example, the
例えば、PHRビッグデータ解析部121は、図21Bに示すように、グループG1に属するユーザAの血圧の計測値が、グループG1のヒストグラムのどの位置にあるのかを導出する。ここで、グループG1のヒストグラムは、1時点における各ユーザの血圧値を集約したものであってもよく、或いは、所定の期間での平均値を集約したものであってもよい。一例を挙げて説明すると、グループG1に属するすべてのユーザのある日の起床時の血圧値を集約したヒストグラムであってもよく、グループG1に属するすべてのユーザにおいて、1週間分の起床時の血圧値を平均し、各ユーザの平均値を集約したヒストグラムであってもよい。なお、起床時の血圧は、ユーザが装着する生体センサによって計測される心拍数や脈拍に基づいてユーザが起床したか否かが判定され、ユーザが起床したと判定された時点で計測された血圧である。
For example, PHR
例えば、PHRビッグデータ解析部121は、図21Bに示すように、ユーザAの1週間分の血圧値「収縮期血圧:110−125、平均値119」、「拡張期血圧:75−84、平均値81」が、グループG1に属する各ユーザの平均値を集約したヒストグラムのどの位置にあるのかを導出する。すなわち、PHRビッグデータ解析部121は、ユーザAの収縮期血圧の平均値が収縮期血圧のヒストグラムのどの位置にあるのかを導出し、ユーザAの拡張期血圧の平均値が拡張期血圧のヒストグラムのどの位置にあるのかを導出する。ここで、PHRビッグデータ解析部121は、ヒストグラムにおけるユーザAの位置を導出するだけではなく、グループごとに設けられる基準値と、グループに属するユーザの計測値との比較を行う。
For example, as shown in FIG. 21B, the PHR big
各グループのヒストグラムは、それぞれ同じゲノムの型で同様の属性情報を有するユーザの生体情報を集約したものである。従って、ヒストグラムの分布状態は、各ゲノムの型と属性情報とを反映したものであると考えられる。そこで、各グループにおけるヒストグラムの平均値を当該グループの理想値(基準値)として設定し、基準値からの乖離度に基づいてユーザの順位付け、及び、偏差値の付与を行う。例えば、PHRビッグデータ解析部121は、ユーザAの収縮期血圧の「平均値:119」とグループG1の収縮期血圧の平均値(基準値)との差分値を算出する。同様に、PHRビッグデータ解析部121は、ユーザAの拡張期血圧の「平均値:81」とグループG1の拡張期血圧の平均値(基準値)との差分値を算出する。そして、PHRビッグデータ解析部121は、収縮期血圧及び拡張期血圧でそれぞれ算出した差分値に基づいて乖離度を導出する。一例を挙げると、PHRビッグデータ解析部121は、2つの差分値の絶対値の和を乖離度として導出する。
The histogram of each group is a collection of biometric information of users having the same genome type and similar attribute information. Therefore, the distribution state of the histogram is considered to reflect the type and attribute information of each genome. Therefore, the average value of the histogram in each group is set as an ideal value (reference value) of the group, and ranking of users and assignment of deviation values are performed based on the degree of deviation from the reference value. For example, the PHR big
同様に、PHRビッグデータ解析部121は、グループG1に属するすべてのユーザについて乖離度を導出し、導出した乖離度に基づいてグループG1におけるユーザAの順位付けや、偏差値の付与などを行う。例えば、PHRビッグデータ解析部121は、基準値(ヒストグラムの平均値)からの乖離度が小さいユーザほど上位になるように順位付け、及び、偏差値の付与を行う。このように、PHRビッグデータ解析部121が順位付け、及び、偏差値の付与を行うと、一次利用サービス提供部122は、結果を各ユーザに提供する。
Similarly, PHR big
例えば、一次利用サービス提供部122は、図21Bに示すように、ユーザAのPHR表示装置200である携帯端末に対して、血圧の順位及び偏差値の情報を提供する。ここで、PHRビッグデータ解析部121が、1時点(例えば、起床時)における血圧の順位及び偏差値と、1週間分の血圧の平均値の順位及び偏差値を導出すると、一次利用サービス提供部122は、図21Bに示すように、1時点の結果「順位:232/12543位、偏差値:65」と、平均値の結果「順位:301/12543、偏差値:62」とをユーザAの携帯端末に提供する。携帯端末の表示制御部210は、図21Bに示すように表示部220に提供された情報を表示する。なお、ユーザAは、所望の日付の結果を任意に選択することができる。
For example, as illustrated in FIG. 21B, the primary use
また、PHRビッグデータ解析部121は、上述したように、基準値に基づいて順位や偏差値を付与するだけではなく、ユーザの計測値が許容値の範囲内であるか否かを判定することもできる。例えば、PHRビッグデータ解析部121は、図21Bに示す拡張期血圧の許容範囲「a−b」と、収縮期血圧の許容範囲「c−d」とを設定して、ユーザAの計測値がそれぞれ許容範囲内であるか否かを判定する。一次利用サービス提供部122は、判定結果をユーザAの携帯端末に提供する。携帯端末の表示制御部210は、判定結果を表示部220に表示する。
In addition, as described above, the PHR big
ここで、PHRビッグデータ解析部121によって設定される許容範囲は、例えば、種々の学会や、団体、機構などによって設けられた規定値を用いることができる。また、PHRビッグデータ解析部121によって設定される許容範囲は、ヒストグラムに基づいて設定される場合であってもよい。例えば、PHRビッグデータ解析部121は、ヒストグラムの最小値と最大値に基づいて任意の範囲を設定する。一例を挙げると、PHRビッグデータ解析部121は、全ユーザ数のうち、最小値から昇順にカウントして30%の人数に達した値を下限値として設定し、最大値から降順にカウントして30%に達した値を上限値として設定する。
Here, as the allowable range set by the PHR big
上述したように、PHRビッグデータ解析部121は、ゲノム情報と属性情報とを組み合わせたグループを形成させ、グループ内での生体情報を比較して、各ユーザの生体情報の値がグループの中でどの位置にあるのかを解析する。なお、言うまでもなく、上述した血圧の例はあくまでも一例であり、その他の生体情報(例えば、心拍数、脈拍、体温、体成分、イオン、pH濃度、糖分、塩分等の成分量、胃酸の濃度、農薬、環境物質、食品添加物の有無、アルコールやニコチン、薬剤成分、バイオマーカーなど)についても、同様に比較解析が実行される。
As described above, the PHR big
さて、上述した例では、他者のデータ間の比較におけるユーザ間の比較について説明した。次に、他者のデータ間の比較におけるグループ間の比較について説明する。上述したように、PHRビッグデータ解析部121は、複数のユーザをゲノム情報と属性情報とを組み合わせたグループに分ける。本実施形態におけるPHR処理装置100は、所定の生体情報について、これらのグループ間で比較を行う。図22は、本実施形態におけるグループ間の比較解析を説明するための図である。ここで、図22においては、複数のユーザを「属性情報:ゲノム2型」と「属性情報:居住地域」との組み合わせによってグループG1〜グループGnに分け、血圧について比較する場合について示す。
In the above-described example, the comparison between users in the comparison between the data of others has been described. Next, comparison between groups in comparison between data of others will be described. As described above, the PHR big
例えば、PHRビッグデータ解析部121は、図22に示すように、グループG1〜グループGnにおける血圧(拡張期血圧、収縮期血圧)の平均値をそれぞれ算出する。そして、PHRビッグデータ解析部121は、グループごとに算出した拡張期血圧の平均値と収縮期血圧の平均値とを用いてヒストグラムをそれぞれ生成し、各グループの平均値がヒストグラムのどの位置にあるのかを導出する。例えば、PHRビッグデータ解析部121は、ヒストグラムの平均値を基準値として設定し、基準値からの乖離度に基づいてグループの順位付け、及び、偏差値の付与を行う。例えば、PHRビッグデータ解析部121は、グループG1の収縮期血圧の平均値とグループ全体の収縮期血圧の平均値との差分値を算出する。同様に、PHRビッグデータ解析部121は、グループG1の拡張期血圧の平均値とグループ全体の拡張期血圧の平均値との差分値を算出する。そして、PHRビッグデータ解析部121は、収縮期血圧及び拡張期血圧でそれぞれ算出した差分値に基づいて乖離度を導出する。一例を挙げると、PHRビッグデータ解析部121は、2つの差分値の絶対値の和を乖離度として導出する。
For example, as shown in FIG. 22, the PHR big
同様に、PHRビッグデータ解析部121は、グループG2〜グループGnのすべてのグループについて乖離度を導出し、導出した乖離度に基づいてグループの順位付けや、偏差値の付与などを行う。例えば、PHRビッグデータ解析部121は、基準値(ヒストグラムの平均値)からの乖離度が小さいグループほど上位になるように、順位付け及び偏差値の付与を行う。このように、PHRビッグデータ解析部121が順位付け及び偏差値の付与を行うと、一次利用サービス提供部122又は二次利用サービス提供部123は、結果をユーザや、会社、機関などに提供する。
Similarly, the PHR big
例えば、二次利用サービス提供部123は、図22に示すように、結果を所望する会社や機関などの端末に対して、血圧の順位の情報を提供する。情報が提供された端末を参照するユーザは、血圧において「エリアA5」が1位であり、「エリアA21」が最下位であることを把握することができる。これにより、例えば、地域ごとに最良の施策を行うことができる。なお、言うまでもなく、図22に示す例はあくまでも一例であり、ゲノム情報及び属性情報は任意に組み合わせてグループが形成され、任意の生体情報について比較し、各グループが複数のグループの中でどの位置にあるのかが示される。また、グループごとに算出される平均値は、1時点の値の平均値でもよく、或いは、ユーザごとに所定の期間の平均値を算出し、算出した平均値を平均した値であてもよい。
For example, as shown in FIG. 22, the secondary use
さて、上述した例では、他者のデータ間を比較して解析する場合について説明した。次に、個人のデータ間を比較して解析する場合について説明する。個人のデータ間を比較して解析する場合、PHR処理装置100は、所定のユーザの生体情報の計測値がどのように推移しているかを解析する。例えば、PHR処理装置100は、ある時点における生体情報がどのようになっているかを解析するとともに、所定の期間の幅における生体情報の変化の傾向がどのようになっているかを解析する。ここで、PHR処理装置100は、ゲノム情報に基づいて導出される基準値に対して計測値がどのようになっているかを解析する。
In the above-described example, the case where the analysis is performed by comparing the data of another person has been described. Next, the case of comparing and analyzing personal data will be described. When comparing and analyzing personal data, the
具体的には、PHRビッグデータ解析部121は、所定の生体情報について、ゲノム情報に基づいて導出される基準値と、ゲノム情報に対応するユーザから収集された計測値との比較結果を導き出す。より具体的には、PHRビッグデータ解析部121は、所定の時点における基準値と計測値との比較結果、及び、所定の期間の幅でユーザから収集された計測値の変化の傾向と所定の期間の幅に対応する基準値の変化の傾向との比較結果のうち、少なくとも1つを導き出す。
Specifically, the PHR big
以下、所定の時点における基準値と計測値との比較解析について説明する。かかる場合、PHRビッグデータ解析部121は、まず、解析の対象となるユーザのゲノム情報に基づく基準値を設定する。そして、PHRビッグデータ解析部121は、設定した基準値に対して、ユーザの計測値がどのようになっているかを導出する。図23A及び図23Bは、本実施形態における個人の所定の時点の比較解析を説明するための図である。例えば、図23Aに示すように、「ゲノム2型」のユーザAの起床時の血圧について比較解析する場合、PHRビッグデータ解析部121は、まず、ゲノム2型に基づく基準値を設定する。
Hereinafter, a comparative analysis between a reference value and a measured value at a predetermined time will be described. In such a case, the PHR big
上述したように、同じゲノムの型のユーザの計測値を集約した値は、当該ゲノムの型を反映した値であり、基準の値として考えることができる。そこで、例えば、PHRビッグデータ解析部121は、ゲノム2型のその他のユーザの起床時の血圧(拡張期血圧、収縮期血圧)のデータをPHR蓄積部110から取得してヒストグラムを生成し、ヒストグラムの最小値と最大値に基づいて任意の範囲を設定する。一例を挙げると、PHRビッグデータ解析部121は、ゲノム2型のその他のユーザ数のうち、最小値から昇順にカウントして30%の人数に達した値を下限値として設定し、最大値から降順にカウントして30%に達した値を上限値として設定した範囲を基準値として設定する。PHRビッグデータ解析部121は、上記した手法によって、図23Aに示す「拡張期血圧範囲(ゲノム2型)」及び「収縮期血圧範囲(ゲノム2型)」を設定する。
As described above, a value obtained by aggregating measurement values of users of the same genome type is a value reflecting the genome type, and can be considered as a reference value. Therefore, for example, the PHR big
そして、PHRビッグデータ解析部121は、図23Aに示すように、起床時に計測されるユーザAの血圧の値を、設定した範囲と比較する。すなわち、PHRビッグデータ解析部121は、ユーザAの起床時の拡張期血圧が拡張期血圧範囲(ゲノム2型)に収まっているか否かを解析する。同様に、PHRビッグデータ解析部121は、ユーザAの起床時の収縮期血圧が収縮期血圧範囲(ゲノム2型)に収まっているか否かを解析する。PHRビッグデータ解析部121は、毎日計測される起床時の血圧について、上記した解析を行う。なお、基準値の設定は、解析ごとに行われる場合であってもよく、一定の期間が経過するごとに行われる場合であってもよい。
Then, as shown in FIG. 23A, the PHR big
このように、PHRビッグデータ解析部121によって比較解析が実行されると、一次利用サービス提供部122は、結果を各ユーザに提供する。例えば、一次利用サービス提供部122は、図23Aに示すように、日々の血圧の推移と、基準値(範囲)との比較結果をユーザAの携帯端末に提供する。携帯端末の表示制御部210は、表示部220に提供された比較結果を表示する。ここで、計測値が範囲から外れた場合、表示制御部210は、図23Aに示すように、外れた日の計測値を示すプロットに色をつけたり、点滅させたりすることによって強調させる。これにより、ユーザAは、基準値から外れた計測値を一目で確認することができる。
As described above, when the comparative analysis is executed by the PHR big
さらに、基準値から外れた計測値を示すプロットに対してユーザAがタッチ操作などを行うと、携帯端末がPHR処理装置100と通信を行い、一次利用サービス提供部122がユーザAの前日の行動情報「通勤、仕事、飲酒」や、一週間前の行動情報、一か月前の行動情報などを提供する。すなわち、表示制御部210が、図23Aに示すように、情報を表示部220に表示する。これにより、ユーザAは、計測値が基準値から外れた理由を推定することができ、その後、推定した理由について注意しながら生活することもできる。
Furthermore, when the user A performs a touch operation or the like on the plot indicating the measured values that deviate from the reference value, the mobile terminal communicates with the
ここで、ユーザに対して強調して提供する計測値は、基準値(範囲)から外れた値だけではなく、基準値に収まった値でもよい。例えば、表示制御部210は、図23Bに示すように、前日の計測値が基準値を外れており、当日の計測値が基準値に収まった日の計測値を示すプロットに色をつけたり、点滅させたりすることによって強調させる。これにより、ユーザAは、基準値に収まった計測値を一目で確認することができる。さらに、ユーザAがタッチ操作などを行うと、携帯端末がPHR処理装置100と通信を行い、一次利用サービス提供部122は、ユーザAの前日の行動情報「運動」や、一週間前の行動情報、一か月前の行動情報などを提供する。すなわち、表示制御部210が、図23Bに示すように、情報を表示部220に表示する。これにより、ユーザAは、計測値が基準値に収まった理由を推定することができる。
Here, the measurement value to be provided with emphasis to the user is not limited to a value that deviates from the reference value (range) but may be a value that falls within the reference value. For example, as shown in FIG. 23B, the
なお、上述した例では、基準値として範囲を用いる場合を例に挙げて説明したが、基準値として1つの値を用いる場合であってもよい。例えば、PHRビッグデータ解析部121は、ゲノム2型のその他のユーザの起床時の血圧(拡張期血圧、収縮期血圧)の平均値を基準値として用いる場合であってもよい。かかる場合には、表示制御部210は、例えば、計測値が基準値を上回った場合(或いは、基準値を下回った)に計測値を示すプロットを強調して表示する。
In the above-described example, the case where the range is used as the reference value has been described as an example, but a case where one value is used as the reference value may be used. For example, the PHR big
また、上述した例では、1日の1時点の計測値を解析する場合について説明したが、1日に複数回計測され、その時点ごとに解析する場合であってもよい。例えば、1日に複数回の体温が計測される場合に、各計測値についてそれぞれ解析する場合であってもよい。また、結果をユーザに提供するタイミングは、任意に設定することができる。例えば、一次利用サービス提供部122は、上述した「将来の健康リスクのお知らせ」を提供する際に、同時に結果を提供してもよく、或いは、解析が実行されるごとにユーザに提供する場合であってもよい。また、計測値が基準値(範囲)から外れた場合、計測値が基準値を上回った場合、或いは、計測値が基準値を下回った場合に、ユーザに対して結果を提供するようにしてもよい。これにより、例えば、体温が大きく変化した場合に、体温の変化を即座にユーザに通知することができる。
Moreover, although the case where the measured value of one time of the day was analyzed was demonstrated in the example mentioned above, the case where it measures several times a day and analyzes for every time may be sufficient. For example, when the body temperature is measured a plurality of times a day, each measurement value may be analyzed. Moreover, the timing which provides a result to a user can be set arbitrarily. For example, the primary use
次に、所定の期間の幅でユーザから収集された計測値の変化の傾向と所定の期間の幅に対応する基準値の変化の傾向との比較について説明する。かかる場合においても、PHRビッグデータ解析部121は、まず、解析の対象となるユーザのゲノム情報に基づく基準値の変化の傾向を設定する。そして、PHRビッグデータ解析部121は、設定した基準値の変化の傾向に対して、ユーザの計測値の変化の傾向がどのようになっているかを導出する。図24A〜図24Cは、本実施形態における個人の所定の期間の比較解析を説明するための図である。ここで、図24A〜図24Cにおいては、「ゲノム2型」のユーザAの収縮期血圧の変化の傾向を解析する場合について示す。また、図24Aは、所定の期間が1日である場合を示し、図24Bは、所定の期間が1週間である場合を示し、図24Cは、所定の期間が1年である場合を示す。
Next, a description will be given of a comparison between a tendency of change in measurement values collected from a user over a predetermined period and a tendency of change in reference values corresponding to the width of the predetermined period. Even in such a case, the PHR big
例えば、PHRビッグデータ解析部121は、ゲノム2型の複数のユーザから経時的に収集された収縮期血圧の計測値をPHR蓄積部110から取得して、時間ごとに平均値を算出する。そして、PHR処理装置100は、時間ごとの平均値の変化の傾向を基準値の変化の傾向として設定する。一例を挙げると、PHRビッグデータ解析部121は、図24Aに示すように、ゲノム2型の複数のユーザについて、0時〜24時までに経時的に収集された収縮期血圧の平均値の変化の傾向を理想パターンとして設定する。そして、PHRビッグデータ解析部121は、ユーザAの0時〜24時までの計測値の変化の傾向と理想パターンとの比較結果を導出する。
For example, the PHR big
例えば、一次利用サービス提供部122は、PHRビッグデータ解析部121によって導出された比較結果を、図24Aに示すようなグラフとしてユーザAの携帯端末に提供する。携帯端末の表示制御部210は、提供された比較結果を表示部220に表示する。これにより、ユーザAは、図24Aに示す自身の本日の計測値「ユーザA(本日)」と「理想パターン」とを参照して、本日の収縮期血圧が理想パターンよりも終日高めに推移していたことを把握することができ、血圧に注意するように意識することができる。
For example, the primary use
また、PHR処理装置100は、本日の計測値の傾向だけではなく、ユーザAが過去に計測した1日の計測値を時間ごとに平均した平均値の傾向を導出することもできる。かかる場合には、一次利用サービス提供部122は、図24Aに示すように、本日の計測値「ユーザA(本日)」と「理想パターン」に加えて、「ユーザA(平均)」のグラフをユーザAに提供する。これにより、ユーザAは、本日の収縮期血圧の値が通常の値と比較して、どのような状況であったのかを一目で確認することができる。また、ユーザAは、自身の1日の収縮期血圧の傾向は理想パターンと比較してどのような状態にあるのかを一目で確認することができる。例えば、ユーザAは、図24Aに示すグラフを見て、本日の収縮期血圧だけでなく、普段から血圧が高めに推移していることを把握することができ、早めの対策を講じることができる。
Further, the
同様に、例えば、図24B及び図24Cに示すように、PHRビッグデータ解析部121は、ユーザAの1週間の収縮期血圧の傾向及び1年の収縮期血圧の傾向を導出して、一次利用サービス提供部122は、それぞれのグラフをユーザAに提供する。ユーザAは、図24B及び図24Cに示すグラフを参照して、自身の収縮期血圧が各期間でどのように推移しているかを一目で把握することができる。例えば、ユーザAは、図24Bのグラフを参照して、1週間のうちで金曜日の収縮期血圧が高くなる傾向にあるが、理想パターンでも同様に高くなっていることから、不安になることはないと考えることができる。また、ユーザAは、図24Cのグラフを参照して、1年間で冬場に収縮期血圧が高くなる傾向にあり、これは理想パターンとは異なっていることから、冬場の血圧に注意するように意識することができる。なお、言うまでもなく、図23A、図23B、及び図24A〜図24Bに示す例はあくまでも一例であり、任意の生体情報について比較解析が実行される。
Similarly, for example, as shown in FIG. 24B and FIG. 24C, the PHR big
このように、PHRビッグデータ解析部121は、種々の幅の期間における生体情報の変化の傾向と、理想パターン、或いは、過去の計測値の変化の傾向とを比較した比較結果を導出する。ユーザは、比較結果を参照して、種々の生体情報について、各期間における変化の傾向を理想パターンに近づけるように生活することで、体の状態をより理想の状態にすることができる。なお、上述した比較結果を提示するタイミングは、任意に設定することができる。例えば、一次利用サービス提供部122は、上述した「将来の健康リスクのお知らせ」を提供する際に、同時に結果を提供してもよく、或いは、所定の期間が経過するごとにユーザに提供してもよい。
In this way, the PHR big
また、上述した例では、ゲノムの型が同一の複数のユーザの計測値を用いて基準値(範囲や、平均値、理想パターンなど)を設定する場合について説明したが、ユーザの計測値と種々の学会や、団体、機構などによって設けられた規定値とを組み合わせて基準値を設定する場合であってもよい。また、例えば、PHRビッグデータ解析部121は、基準値と計測値との比較結果とともに、ユーザの属性情報に基づいて導出される値と計測値との比較結果を導き出すこともできる。一例を挙げると、PHRビッグデータ解析部121は、図23Aに示す起床時血圧の比較において、ゲノム情報から導出した範囲に加えて、種々の学会、団体、機構などによって設けられた規定値の範囲を設定してもよい。かかる場合には、一次利用サービス提供部122は、ユーザに対して、ゲノム情報から導出した範囲と、規定値の範囲とが示された比較結果を提供する。
In the above-described example, a case has been described in which reference values (range, average value, ideal pattern, etc.) are set using measurement values of a plurality of users having the same genome type. The reference value may be set in combination with a prescribed value provided by an academic society, an organization, a mechanism, or the like. In addition, for example, the PHR big
また、上述した例では、一次利用サービス提供部122が解析結果をユーザに提供する場合について説明したが、実施形態はこれに限定されるものではなく、解析結果を主治医に提供する場合であってもよい。かかる場合には、主治医は、解析結果を参照して、ユーザに対してコメントを送るようにしてもよい。
In the above-described example, the case where the primary use
(PHR処理装置100の詳細な構成)
これまで、本実施形態において提供される「日常人間ドック」サービスやPHRデータの「二次利用サービス」を詳細に説明してきた。また、PHR処理装置100の基本的な構成を説明してきたが、以下では、PHR処理装置100の構成をより詳細に説明する。なお、以下に説明するPHR蓄積部110、PHRビッグデータ解析部121、一次利用サービス提供部122、二次利用サービス提供部123は、いずれも、上述した実施形態において説明した、PHR蓄積部110、PHRビッグデータ解析部121、一次利用サービス提供部122、二次利用サービス提供部123に、それぞれ対応する。また、PHR処理装置100は、必ずしも以下に説明する各部を備えなければならないものではなく、適宜装備を省略することができる。また、PHR処理装置100は、他の部を更に備えることもできる。
(Detailed configuration of PHR processing apparatus 100)
So far, the “daily human dock” service and the “secondary use service” of PHR data provided in this embodiment have been described in detail. The basic configuration of the
図25は、本実施形態に係るPHR処理装置100の機能ブロック図である。PHR処理装置100は、1つ又は複数の汎用コンピュータによって実現されることが可能であり、プロセッサ(processor)、メモリ(memory)、入出力インタフェースを備える。図25に示す各部は、プロセッサ、メモリ、入出力インタフェースに、適宜割り当てられる。
FIG. 25 is a functional block diagram of the
PHR処理装置100は、PHR蓄積部110と、PHR運用管理部120と、システム制御部130とを備える。システム制御部130は、PHR処理装置100の全体制御を行う。例えば、システム制御部130は、データ信託会社11のオペレータの操作を受け付け、PHRデータの管理対象となるユーザや、その家族、主治医のアカウント登録、二次利用サービスの提供を受ける医療機関や各種企業等のアカウント登録を行う。
The
PHR蓄積部110は、セキュリティ機能部111と、データフォーマット変換・正規化部112と、非構造化データ処理部113と、PHRデータ蓄積部114とを備える。
The
セキュリティ機能部111は、PHRデータのセキュリティを確保するための各種処理を行う。PHRデータは、極めてセンシティブな取り扱いが求められる個人情報である。このため、セキュリティ機能部111は、PHRデータの入出力インタフェース(API:Application Programming Interface)として、接続先の認証、及び、アクセス権限の認可を行う。また、セキュリティ機能部111は、個人を特定できない処理を施した上で利活用に提供するために、必要に応じて、PHRデータの匿名化を行う。また、セキュリティ機能部111は、匿名化を行わないPHRデータについては、適切に管理された暗号鍵による暗号化を行う。また、セキュリティ機能部111は、PHRデータをヘルスケアクラウド10外に提供する場合には、不正侵害等に対する耐久性のあるデータ配信を行う。
The
また、セキュリティ機能部111は、システム管理者、PHRビッグデータを解析する研究者、及び、PHRデータを登録し、参照する個人ユーザ等、全てのデータアクセスユーザに対し、適切な個人認証を行う機能を提供する。ヘルスケアクラウド10上では、センシティブな個人の健康情報を扱うため、セキュリティ機能部111は、ID/パスワード認証以上のセキュリティを担保できる多要素認証技術を提供する。また、セキュリティ機能部111は、様々なデバイスやシステムから入力されるデータの所有者を識別・特定するための名寄せの機能を提供する。
The
データフォーマット変換・正規化部112は、PHRデータが、デバイスにより様々なデータフォーマットで送信されることに柔軟に対応するため、データ変更・正規化の機能及び、変換された正規化データを所定のシステムへ配送するサービスバス機能を提供する。また、本実施形態において、PHR蓄積部110は、個人の医療・健康に関わる解析のため、ソーシャルメディア等の画像、つぶやきテキスト情報、また、スマートフォンアプリ等からの音声、画像、テキスト情報等の補完情報を収集する。このため、非構造化データ処理部113は、インタフェース機能を有し、またそれらの非構造化データを処理するための、音声認識、自然言語解析、画像認識、データマイニングといった機能を有する。
The data format conversion /
PHRデータ蓄積部114は、PHRビッグデータが蓄積された大規模ゲノム・コホートデータベース114aである。
The PHR
一方、PHR運用管理部120は、PHRビッグデータ解析部121と、一次利用サービス提供部122と、二次利用サービス提供部123とを備える。また、PHRビッグデータ解析部121は、解析エンジン部121aと、分散処理データベース121bと、イベント処理部121cとを備える。解析エンジン部121aは、PHRデータ蓄積部114に蓄積されたPHRビッグデータを対象に、コホート分析等を行う。解析エンジン部121aによる解析は、分散処理技術を用いて行われる場合がある。この場合には、PHRデータ蓄積部114と、分散処理データベース121bとが連携し、解析エンジン部121aは、分散処理データベース121bに蓄積されたPHRビッグデータを処理の対象とする。また、イベント処理部121cは、解析エンジン部121aによる分散処理に対応してイベント処理を行う。
Meanwhile, the PHR
一次利用サービス提供部122は、一次利用サービスとして、「日常人間ドック」サービスを提供する。また、一次利用サービス提供部122は、インセンティブ処理部122aを備える。個人のユーザがセンサを着用し、自身の健康情報やその補完情報の入力を長期にわたって続けるには、インセンティブが重要となる。インセンティブ処理部122aは、インセンティブとなり得るポイント制度や各種ランキング、ゲーム要素、広告モデルの機能を提供する。二次利用サービス提供部123は、二次利用サービスを提供する。
The primary use
(ハードウェア構成)
図26は、本実施形態におけるPHR処理装置100(又はPHR表示装置200)のハードウェア構成を示す図である。PHR処理装置100(又はPHR表示装置200)は、CPU(Central Processing Unit)310と、ROM(Read Only Memory)320と、RAM(Random Access Memory)330と、表示部340と、入力部350とを備える。また、PHR処理装置100(又はPHR表示装置200)では、CPU310、ROM320、RAM330、表示部340、及び入力部350が、バスライン301を介して接続されている。
(Hardware configuration)
FIG. 26 is a diagram illustrating a hardware configuration of the PHR processing device 100 (or the PHR display device 200) in the present embodiment. The PHR processing device 100 (or PHR display device 200) includes a central processing unit (CPU) 310, a read only memory (ROM) 320, a random access memory (RAM) 330, a
上述した実施形態における各種処理を行うPHR処理プログラム(又はPHR表示プログラム)は、ROM320内に格納されており、バスライン301を介して、RAM330へロードされる。CPU310は、RAM330内にロードされたPHR処理プログラム(又はPHR表示プログラム)を実行する。例えば、PHR処理装置100(又はPHR表示装置200)では、操作者による入力部350からの指示入力に従って、CPU310が、ROM320内からPHR処理プログラム(又はPHR表示プログラム)を読み出してRAM330内のプログラム格納領域に展開し、各種処理を実行する。CPU310は、この各種処理に際して生じる各種データをRAM330内に形成されるデータ格納領域に一時的に記憶させておく。
A PHR processing program (or PHR display program) for performing various processes in the above-described embodiment is stored in the
PHR処理装置100(又はPHR表示装置200)で実行されるPHR処理プログラム(又はPHR表示プログラム)は、PHRビッグデータ解析部121、一次利用サービス提供部122、及び二次利用サービス提供部123(又は、表示制御部210)を含むモジュール構成となっており、これらが主記憶装置上にロードされ、これらが主記憶装置上に生成される。
The PHR processing program (or PHR display program) executed by the PHR processing device 100 (or PHR display device 200) is a PHR big
(その他の実施形態)
実施形態は、上述した実施形態に限られるものではない。
(Other embodiments)
The embodiment is not limited to the above-described embodiment.
(構成)
上述した実施形態では、クラウド上にPHR処理装置100が構築される構成を説明したが、実施形態はこれに限られるものではない。PHR処理装置100は、その機能の全部若しくは一部を、例えば、データ信託会社11内のネットワーク上に構築することもできる。また、PHR処理装置100は、必ずしも1つの拠点に構築されなければならないものではない。複数の拠点に分散配置された機能が連携することで、PHR処理装置100を実現してもよい。
(Constitution)
In the above-described embodiment, the configuration in which the
また、上述した実施形態で例示した物理的な構成は、あくまで一例に過ぎない。上述した実施形態で例示した各部は、運用の形態や負荷に応じて適宜統合若しくは分散される。 In addition, the physical configuration illustrated in the above-described embodiment is merely an example. Each unit illustrated in the above-described embodiment is appropriately integrated or distributed according to the operation mode and load.
本発明のいくつかの実施形態を説明したが、これらの実施形態は、例として提示したものであり、発明の範囲を限定することは意図していない。これら実施形態は、その他の様々な形態で実施されることが可能であり、発明の要旨を逸脱しない範囲で、種々の省略、置き換え、変更を行うことができる。これら実施形態やその変形は、発明の範囲や要旨に含まれると同様に、請求の範囲に記載された発明とその均等の範囲に含まれるものである。 Although several embodiments of the present invention have been described, these embodiments are presented by way of example and are not intended to limit the scope of the invention. These embodiments can be implemented in various other forms, and various omissions, replacements, and changes can be made without departing from the spirit of the invention. These embodiments and modifications thereof are included in the scope of the present invention and the gist thereof, and are also included in the invention described in the claims and the equivalent scope thereof.
100 PHR処理装置
110 PHR蓄積部
120 PHR運用管理部
121 PHRビッグデータ解析部
122 一次利用サービス提供部
123 二次利用サービス提供部
DESCRIPTION OF
Claims (16)
ユーザの健康情報である、ゲノム情報と、生体情報及び行動情報とに基づいて推定された、当該ユーザの将来の健康リスクを前記表示部に表示する表示制御部とを備え、
前記表示制御部は、前記将来の健康リスクとともに、前記ユーザの目標の健康状態及び当該目標の健康状態に到達するための指導情報のうち、少なくとも1つを表示し、操作者から、前記推定に用いる前記ユーザの健康情報の期間の幅を受け付けると、受け付けた期間の幅に応じた将来の健康リスクを表示する健康情報表示装置。 A display unit;
A display control unit that displays the future health risk of the user estimated on the basis of genome information, biological information, and behavior information, which is the user's health information, on the display unit;
The display control unit displays at least one of the target health state of the user and guidance information for reaching the target health state together with the future health risk, and from the operator, the estimation is performed. A health information display device that displays a future health risk corresponding to the received period width when the period of the user's health information to be used is received.
ユーザの健康情報である、ゲノム情報と、生体情報及び行動情報とに基づいて推定された、当該ユーザの将来の健康リスクを前記表示部に表示する表示制御部とを備え、
前記表示制御部は、前記将来の健康リスクとともに、前記ユーザの目標の健康状態及び当該目標の健康状態に到達するための指導情報のうち、少なくとも1つを表示し、操作者からライフスタイルの変更指示を受け付けると、受け付けた変更指示に応じてシミュレーションされた将来の健康リスクを表示する健康情報表示装置。 A display unit;
A display control unit that displays the future health risk of the user estimated on the basis of genome information, biological information, and behavior information, which is the user's health information, on the display unit;
The display control unit displays at least one of the user's target health condition and guidance information for reaching the target health condition together with the future health risk, and changes the lifestyle from the operator. A health information display device that displays a future health risk that is simulated according to the received change instruction when the instruction is received.
ユーザの健康情報である、ゲノム情報と、生体情報及び行動情報とに基づいて推定された、当該ユーザの将来の健康リスクを前記表示部に表示する表示制御部とを備え、
前記表示制御部は、前記将来の健康リスクとともに、前記ユーザの健康情報として、ゲノム情報から導き出されるゲノムの型、及び、生体情報及び行動情報から導き出されるライフスタイルの型を表示する、健康情報表示装置。 A display unit;
A display control unit that displays the future health risk of the user estimated on the basis of genome information, biological information, and behavior information, which is the user's health information, on the display unit;
The display control unit displays a health type display derived from genome information derived from genome information and a lifestyle type derived from biological information and behavior information as health information of the user together with the future health risk apparatus.
Prior Symbol display control unit, wherein with future health risks, to view health information of the user, as a health risk of the future, displays the name of disease the user may develop future, according to claim 1 Health information display device.
複数ユーザ分の健康情報を解析することで、ゲノム情報から導き出されるゲノムの型、及び、生体情報及び行動情報から導き出されるライフスタイルの型の組み合わせと、将来発症し得る疾病との関連性を導き出す解析部と、
前記解析部により解析されたユーザの健康情報である、ゲノム情報と、生体情報及び行動情報とに基づいて推定された、当該ユーザの将来の健康リスクを前記表示部に表示する表示制御部とを備え、
前記表示制御部は、前記将来の健康リスクとともに、前記ユーザの目標の健康状態及び当該目標の健康状態に到達するための指導情報のうち、少なくとも1つを表示する、ソリューションシステム。 A display unit;
By analyzing the health information for multiple users, the relationship between the combination of the type of genome derived from genomic information and the type of lifestyle derived from biological information and behavioral information, and diseases that may develop in the future is derived. An analysis unit;
A display control unit that displays the future health risk of the user estimated on the basis of genome information, biological information, and behavior information, which is the user's health information analyzed by the analysis unit, on the display unit; Prepared,
Wherein the display control unit, said with future health risks, among the guidance information for reaching the health and physical condition of the target goals of the user, for displaying at least one solution system.
ユーザの健康情報である、ゲノム情報と、生体情報及び行動情報とに基づいて推定された、当該ユーザの将来の健康リスクを表示部に表示し、
前記将来の健康リスクとともに、前記ユーザの目標の健康状態及び当該目標の健康状態に到達するための指導情報のうち、少なくとも1つを表示し、操作者から、前記推定に用いる前記ユーザの健康情報の期間の幅を受け付けると、受け付けた期間の幅に応じた将来の健康リスクを表示する、
健康情報表示方法。 Health information display device
Displaying the future health risk of the user estimated on the basis of genome information, biological information and behavior information, which is the user's health information, on the display unit,
Along with the future health risk, at least one of the user's target health condition and guidance information for reaching the target health condition is displayed, and the user's health information used for the estimation from the operator If you accept the width of the period, the future health risk is displayed according to the width of the accepted period.
How to display health information.
ユーザの健康情報である、ゲノム情報と、生体情報及び行動情報とに基づいて推定された、当該ユーザの将来の健康リスクを表示部に表示し、
前記将来の健康リスクとともに、前記ユーザの目標の健康状態及び当該目標の健康状態に到達するための指導情報のうち、少なくとも1つを表示し、操作者からライフスタイルの変更指示を受け付けると、受け付けた変更指示に応じてシミュレーションされた将来の健康リスクを表示する、
健康情報表示方法。 Health information display device
Displaying the future health risk of the user estimated on the basis of genome information, biological information and behavior information, which is the user's health information, on the display unit,
Displaying at least one of the target health condition of the user and the guidance information for reaching the target health condition together with the future health risk, and accepting a lifestyle change instruction from the operator Display future health risks that are simulated according to the change instructions
How to display health information.
ユーザの健康情報である、ゲノム情報と、生体情報及び行動情報とに基づいて推定された、当該ユーザの将来の健康リスクを表示部に表示し、
前記将来の健康リスクとともに、前記ユーザの健康情報として、ゲノム情報から導き出されるゲノムの型、及び、生体情報及び行動情報から導き出されるライフスタイルの型を表示する、
健康情報表示方法。 Health information display device
Displaying the future health risk of the user estimated on the basis of genome information, biological information and behavior information, which is the user's health information, on the display unit,
Along with the future health risk, as the user's health information, a genome type derived from genome information and a lifestyle type derived from biological information and behavior information are displayed.
How to display health information.
請求項9に記載の健康情報表示方法。 With the previous SL future health risks, to view health information of the user, as a health risk of the future, displays the name of disease the user may develop the future,
The health information display method according to claim 9 .
請求項9に記載の健康情報表示方法。 With the previous SL future health risks, to view health information of the user, the display the health risk ranking list of a plurality of users based on comparison with other different users and user, with respect to the health risk ranking list When a predetermined user is designated, the future health risk and health information of the designated user are displayed.
The health information display method according to claim 9 .
複数ユーザ分の健康情報を解析することで、ゲノム情報から導き出されるゲノムの型、及び、生体情報及び行動情報から導き出されるライフスタイルの型の組み合わせと、将来発症し得る疾病との関連性を導き出し、
解析したユーザの健康情報である、ゲノム情報と、生体情報及び行動情報とに基づいて推定された、当該ユーザの将来の健康リスクを表示部に表示し、
前記将来の健康リスクとともに、前記ユーザの目標の健康状態及び当該目標の健康状態に到達するための指導情報のうち、少なくとも1つを表示する、
健康情報表示方法。 Solution system
By analyzing the health information for multiple users, the relationship between the combination of the type of genome derived from genome information and the type of lifestyle derived from biological information and behavioral information, and diseases that may develop in the future is derived. ,
Displaying the future health risk of the user estimated on the basis of genome information, biological information, and behavior information of the analyzed user's health information on the display unit,
Along with the future health risk, at least one of the target health status of the user and guidance information for reaching the target health status is displayed.
How to display health information.
蓄積された複数ユーザ分の健康情報を解析することで、ゲノム情報から導き出されるゲノムの型、及び、生体情報及び行動情報から導き出されるライフスタイルの型の組み合わせと、将来発症し得る疾病との関連性を導き出す解析部と、By analyzing the accumulated health information for multiple users, the relationship between the combination of the type of genome derived from genomic information and the type of lifestyle derived from biological information and behavioral information, and diseases that may develop in the future An analysis unit that derives sex,
前記解析の結果と所定のユーザの健康情報とを用いて、当該所定のユーザの将来の健康リスクを推定する推定部と、An estimation unit that estimates the future health risk of the predetermined user using the analysis result and the health information of the predetermined user;
表示部と、A display unit;
前記推定部により推定された、当該ユーザの将来の健康リスクを前記表示部に表示する表示制御部とを備え、A display control unit that displays the future health risk of the user estimated by the estimation unit on the display unit;
前記表示制御部は、前記将来の健康リスクとともに、前記ユーザの健康情報を表示し、前記将来の健康リスクとして、前記ユーザが将来発症し得る疾病の名称を表示する、ソリューションシステム。The display control unit displays health information of the user together with the future health risk, and displays a name of a disease that the user may develop in the future as the future health risk.
各ユーザの健康情報である、ゲノム情報と生体情報及び行動情報とを、各ユーザから収集し、Genomic information, biological information and behavior information, which are health information of each user, are collected from each user,
前記各ユーザの健康情報を、複数ユーザ分蓄積し、The health information of each user is accumulated for a plurality of users,
蓄積した複数ユーザ分の健康情報を解析することで、ゲノム情報から導き出されるゲノムの型、及び、生体情報及び行動情報から導き出されるライフスタイルの型の組み合わせと、将来発症し得る疾病との関連性を導き出し、By analyzing the accumulated health information for multiple users, the relationship between the combination of the type of genome derived from genomic information and the type of lifestyle derived from biological information and behavioral information, and diseases that may develop in the future Derived,
前記解析の結果と所定のユーザの健康情報とを用いて、当該所定のユーザの将来の健康リスクを推定し、この推定された、当該ユーザの将来の健康リスクを表示部に表示し、Using the result of the analysis and the health information of the predetermined user, the future health risk of the predetermined user is estimated, and the estimated future health risk of the user is displayed on the display unit.
前記将来の健康リスクとともに、前記ユーザの健康情報を表示し、前記将来の健康リスクとして、前記ユーザが将来発症し得る疾病の名称を表示する、The health information of the user is displayed together with the future health risk, and the name of a disease that the user can develop in the future is displayed as the future health risk.
健康情報表示方法。How to display health information.
Applications Claiming Priority (2)
| Application Number | Priority Date | Filing Date | Title |
|---|---|---|---|
| JP2013206834 | 2013-10-01 | ||
| JP2013206834 | 2013-10-01 |
Related Parent Applications (1)
| Application Number | Title | Priority Date | Filing Date |
|---|---|---|---|
| JP2015508354A Division JP6212784B2 (en) | 2013-10-01 | 2014-10-01 | Health information processing apparatus and method |
Publications (2)
| Publication Number | Publication Date |
|---|---|
| JP2017097895A JP2017097895A (en) | 2017-06-01 |
| JP6212786B2 true JP6212786B2 (en) | 2017-10-18 |
Family
ID=52778762
Family Applications (3)
| Application Number | Title | Priority Date | Filing Date |
|---|---|---|---|
| JP2015508354A Active JP6212784B2 (en) | 2013-10-01 | 2014-10-01 | Health information processing apparatus and method |
| JP2016252035A Active JP6212787B2 (en) | 2013-10-01 | 2016-12-26 | Health information processing apparatus and method |
| JP2016252034A Active JP6212786B2 (en) | 2013-10-01 | 2016-12-26 | Health information display device, solution system and method |
Family Applications Before (2)
| Application Number | Title | Priority Date | Filing Date |
|---|---|---|---|
| JP2015508354A Active JP6212784B2 (en) | 2013-10-01 | 2014-10-01 | Health information processing apparatus and method |
| JP2016252035A Active JP6212787B2 (en) | 2013-10-01 | 2016-12-26 | Health information processing apparatus and method |
Country Status (6)
| Country | Link |
|---|---|
| US (1) | US20150193588A1 (en) |
| EP (1) | EP3054412A4 (en) |
| JP (3) | JP6212784B2 (en) |
| CN (1) | CN104704526A (en) |
| SG (1) | SG11201502141RA (en) |
| WO (1) | WO2015050174A1 (en) |
Families Citing this family (80)
| Publication number | Priority date | Publication date | Assignee | Title |
|---|---|---|---|---|
| US20130191157A1 (en) * | 2012-01-17 | 2013-07-25 | Optuminsight, Inc. | Unified healthcare intelligence, analytics, and care management |
| CN104704526A (en) * | 2013-10-01 | 2015-06-10 | 国立大学法人东北大学 | Health information procssing device, health information display device, and method |
| JP2017010486A (en) * | 2015-06-26 | 2017-01-12 | Rizap株式会社 | Information processing system, information processing method, and information processing program |
| EP3779996A1 (en) * | 2015-10-01 | 2021-02-17 | Dnanudge Limited | Method, apparatus and system for securely transferring genetic information |
| US10861594B2 (en) | 2015-10-01 | 2020-12-08 | Dnanudge Limited | Product recommendation system and method |
| US10614502B2 (en) * | 2015-10-16 | 2020-04-07 | International Business Machines Corporation | In-store real-time food item selection recommendations |
| CN105232063B (en) * | 2015-10-22 | 2017-03-22 | 广东小天才科技有限公司 | Detection method for mental health of user and intelligent terminal |
| CN105496136B (en) * | 2015-12-10 | 2018-03-06 | 嘉兴学院 | A kind of information networking method of Intelligent water cup |
| KR102534850B1 (en) | 2016-02-03 | 2023-05-18 | 삼성전자주식회사 | Device and method of monitoring the health state of user, and device of management the health state of user |
| CN105743989A (en) * | 2016-03-31 | 2016-07-06 | 宇龙计算机通信科技(深圳)有限公司 | Motion information push method and push apparatus, and terminal |
| JP6617991B2 (en) * | 2016-05-04 | 2019-12-11 | 理香 大熊 | Future image prediction device |
| JP6854090B2 (en) * | 2016-05-12 | 2021-04-07 | ヤフー株式会社 | Information providing device, information providing method and information providing program |
| WO2017204233A1 (en) * | 2016-05-23 | 2017-11-30 | Necソリューションイノベータ株式会社 | Health condition prediction device, health condition prediction method, and computer-readable recording medium |
| US20180012242A1 (en) * | 2016-07-06 | 2018-01-11 | Samsung Electronics Co., Ltd. | Automatically determining and responding to user satisfaction |
| US11087235B2 (en) * | 2016-08-02 | 2021-08-10 | International Business Machines Corporation | Cohort consensus approach to manufacturing watson Q and A pipeline training cases from historical data |
| EP3552177A1 (en) * | 2016-12-12 | 2019-10-16 | Koninklijke Philips N.V. | System and method for facilitating computational analysis of a health condition |
| JP6907556B2 (en) * | 2017-01-24 | 2021-07-21 | 富士通株式会社 | Information processing equipment, information processing system, program and information processing method |
| JP6974029B2 (en) * | 2017-05-02 | 2021-12-01 | ポーラ化成工業株式会社 | Image display device, skin condition support system, image display program and image display method |
| JP2018195187A (en) * | 2017-05-19 | 2018-12-06 | ヤフー株式会社 | Information providing device, information providing method, and information providing device program |
| JP2018195198A (en) * | 2017-05-19 | 2018-12-06 | ヤフー株式会社 | Providing device, providing method, and providing program |
| JP6552546B2 (en) * | 2017-05-19 | 2019-07-31 | ヤフー株式会社 | Information providing apparatus, information providing method, and information providing apparatus program |
| JP6587660B2 (en) * | 2017-08-17 | 2019-10-09 | ヤフー株式会社 | Estimation apparatus, estimation method, and estimation program |
| CN116049751A (en) | 2017-10-30 | 2023-05-02 | 麦克赛尔株式会社 | Exception data processing system |
| JP6512648B1 (en) * | 2017-11-15 | 2019-05-15 | 前田商事株式会社 | Software, health condition judging device and health condition judging method |
| JP6993857B2 (en) * | 2017-12-05 | 2022-01-14 | 倉敷紡績株式会社 | Physical condition management system |
| JP7131904B2 (en) * | 2017-12-18 | 2022-09-06 | オムロンヘルスケア株式会社 | Lifestyle management device, method and program |
| WO2019139595A1 (en) * | 2018-01-11 | 2019-07-18 | Visa International Service Association | Offline authorization of interactions and controlled tasks |
| JP6342095B1 (en) * | 2018-01-31 | 2018-06-13 | 豊田通商株式会社 | Health management system, health management method, program, and recording medium |
| EP3765849A4 (en) * | 2018-03-13 | 2021-12-08 | Menicon Co., Ltd. | Determination system, computing device, determination method, and program |
| JP7016740B2 (en) * | 2018-03-19 | 2022-02-07 | 日本光電工業株式会社 | The inspection support method, the program that causes the processor to execute the inspection support method, and the inspection device and support device for executing the inspection support method. |
| CN111971756A (en) * | 2018-03-26 | 2020-11-20 | 日本电气方案创新株式会社 | Health assistance system, information providing form output device, method, and program |
| JP2021114005A (en) * | 2018-04-12 | 2021-08-05 | ソニーグループ株式会社 | Information processing device and information processing method |
| KR102049307B1 (en) * | 2018-04-13 | 2019-11-27 | 유한회사 지에스케이테크놀로지 | Educational health condition simulation device |
| CN108597577A (en) * | 2018-04-20 | 2018-09-28 | 深圳市科迈爱康科技有限公司 | Eight-section brocade movement technique, device and computer readable storage medium |
| JP7135511B2 (en) * | 2018-07-04 | 2022-09-13 | オムロンヘルスケア株式会社 | HEALTH CARE SUPPORT DEVICE, METHOD, AND PROGRAM |
| JP7135521B2 (en) * | 2018-07-13 | 2022-09-13 | オムロンヘルスケア株式会社 | Behavior modification support device, terminal and server |
| JP7082809B2 (en) * | 2018-07-13 | 2022-06-09 | BioICT株式会社 | Member health condition management system, member health condition management method, and member health condition management program |
| US10922397B2 (en) | 2018-07-24 | 2021-02-16 | Dnanudge Limited | Method and device for comparing personal biological data of two users |
| KR102069979B1 (en) * | 2018-08-07 | 2020-01-23 | 주식회사 바디프랜드 | Method and system for transaction for user information based on massage device |
| KR102427879B1 (en) * | 2018-08-07 | 2022-08-01 | 주식회사 바디프랜드 | Method and system for transaction for user information based on massage device |
| JP2020027577A (en) * | 2018-08-17 | 2020-02-20 | 株式会社Pontely | Pet purchase support service system |
| JP2019048061A (en) * | 2018-09-26 | 2019-03-28 | 株式会社メディプリーム | Disease prediction network system |
| CN113168918A (en) | 2018-11-02 | 2021-07-23 | 国立研究开发法人理化学研究所 | Method, system and program for creating health localization map and health function, and method for using the same |
| JP2020078373A (en) * | 2018-11-12 | 2020-05-28 | 啓太郎 横山 | Information processing device and computer program |
| JP7247432B2 (en) * | 2018-11-28 | 2023-03-29 | 独立行政法人国立高等専門学校機構 | Action support system and action support method for subjects using disease/disability codes |
| CN109559243A (en) * | 2018-12-13 | 2019-04-02 | 泰康保险集团股份有限公司 | Adjuster method, apparatus, medium and electronic equipment |
| JPWO2020129366A1 (en) | 2018-12-21 | 2021-11-04 | アイ ピース,インコーポレイテッド | Health risk information management device, health risk information management method, and program |
| US10811140B2 (en) | 2019-03-19 | 2020-10-20 | Dnanudge Limited | Secure set-up of genetic related user account |
| JP7263095B2 (en) * | 2019-04-22 | 2023-04-24 | ジェネシスヘルスケア株式会社 | Research support system, research support device, research support method, and research support program |
| WO2020218414A1 (en) * | 2019-04-26 | 2020-10-29 | Necソリューションイノベータ株式会社 | Lifestyle improvement specific measure presenting device, lifestyle improvement specific measure presenting method, recording medium, and lifestyle improvement specific measure presenting system |
| JP2020185382A (en) * | 2019-05-10 | 2020-11-19 | キヤノンメディカルシステムズ株式会社 | Diagnosis support device |
| KR102075152B1 (en) * | 2019-05-14 | 2020-02-07 | 김형운 | Device and method for providing health analysis service |
| KR102072815B1 (en) * | 2019-06-14 | 2020-02-03 | 주식회사 마크로젠 | Classification method for state of health based on microbiome and classification apparatus |
| JP6793267B1 (en) * | 2019-10-31 | 2020-12-02 | 安博 市村 | Health status prediction system, health status prediction method, and programs for health status prediction system |
| JP7420145B2 (en) * | 2019-11-01 | 2024-01-23 | 日本電気株式会社 | Risk prediction device, risk prediction method, and computer program |
| JP7302445B2 (en) * | 2019-11-14 | 2023-07-04 | トヨタ自動車株式会社 | Program, information processing device, information processing system, and information processing method |
| KR102565460B1 (en) * | 2019-12-16 | 2023-08-09 | 주식회사 바디프랜드 | Method and system for transaction for user information based on massage device |
| GB2590802A (en) | 2020-01-03 | 2021-07-07 | Dnanudge Ltd | Method and device for comparing personal biological data of two users |
| JP7038458B2 (en) * | 2020-02-03 | 2022-03-18 | 株式会社Mizkan Holdings | Programs, information processing methods and information processing equipment |
| US11151462B2 (en) | 2020-02-04 | 2021-10-19 | Vignet Incorporated | Systems and methods for using machine learning to improve processes for achieving readiness |
| US11157823B2 (en) | 2020-02-04 | 2021-10-26 | Vignet Incorporated | Predicting outcomes of digital therapeutics and other interventions in clinical research |
| JP7339182B2 (en) * | 2020-02-21 | 2023-09-05 | Kddi株式会社 | Performance reward determination server, performance reward determination method, and computer program |
| US11328796B1 (en) * | 2020-02-25 | 2022-05-10 | Vignet Incorporated | Techniques for selecting cohorts for decentralized clinical trials for pharmaceutical research |
| JP6982148B2 (en) * | 2020-03-02 | 2021-12-17 | 東芝テック株式会社 | Receipt data management device and its program, and receipt data management method |
| US11605038B1 (en) | 2020-05-18 | 2023-03-14 | Vignet Incorporated | Selecting digital health technology to achieve data collection compliance in clinical trials |
| US11461216B1 (en) | 2020-05-18 | 2022-10-04 | Vignet Incorporated | Monitoring and improving data collection using digital health technology |
| JP6887194B1 (en) * | 2020-09-14 | 2021-06-16 | 株式会社Arblet | Information processing systems, servers, information processing methods and programs |
| KR102319095B1 (en) * | 2020-11-26 | 2021-10-28 | 부산대학교병원 | Personalized Healthcare System |
| CN116670704A (en) * | 2021-01-15 | 2023-08-29 | 三菱电机株式会社 | Disease-free diagnosis device, disease-free diagnosis method, and learning model generation device |
| US11789837B1 (en) | 2021-02-03 | 2023-10-17 | Vignet Incorporated | Adaptive data collection in clinical trials to increase the likelihood of on-time completion of a trial |
| US11196656B1 (en) | 2021-02-03 | 2021-12-07 | Vignet Incorporated | Improving diversity in cohorts for health research |
| US11296971B1 (en) | 2021-02-03 | 2022-04-05 | Vignet Incorporated | Managing and adapting monitoring programs |
| US11361846B1 (en) | 2021-02-03 | 2022-06-14 | Vignet Incorporated | Systems and methods for customizing monitoring programs involving remote devices |
| US11316941B1 (en) | 2021-02-03 | 2022-04-26 | Vignet Incorporated | Remotely managing and adapting monitoring programs using machine learning predictions |
| US11521714B1 (en) | 2021-02-03 | 2022-12-06 | Vignet Incorporated | Increasing diversity of participants in health research using adaptive methods |
| WO2023017619A1 (en) * | 2021-08-13 | 2023-02-16 | 株式会社ビキタン | Information processing system, information processing method, computer program, and information processing device |
| TWI764817B (en) * | 2021-08-27 | 2022-05-11 | 長佳智能股份有限公司 | Genome risk reading method |
| JP7122048B1 (en) | 2022-01-31 | 2022-08-19 | 春樹 鳥海 | ME-BYO parameter measurement system |
| WO2023157606A1 (en) * | 2022-02-15 | 2023-08-24 | ソニーグループ株式会社 | Information processing device, information processing method, and program |
| WO2024042613A1 (en) * | 2022-08-23 | 2024-02-29 | 日本電気株式会社 | Terminal, method for controlling terminal, and storage medium |
Family Cites Families (15)
| Publication number | Priority date | Publication date | Assignee | Title |
|---|---|---|---|---|
| US6102856A (en) * | 1997-02-12 | 2000-08-15 | Groff; Clarence P | Wearable vital sign monitoring system |
| JP2000099605A (en) * | 1998-09-24 | 2000-04-07 | Fujitsu Ltd | Health examination information analysis server and network health information system |
| JP4327825B2 (en) | 2000-03-14 | 2009-09-09 | 株式会社東芝 | Body-worn life support device and method |
| JP3846844B2 (en) | 2000-03-14 | 2006-11-15 | 株式会社東芝 | Body-mounted life support device |
| JP4529056B2 (en) * | 2000-03-21 | 2010-08-25 | ソニー株式会社 | Information processing apparatus and method, recording medium, and information processing system |
| JP2002342492A (en) * | 2001-05-21 | 2002-11-29 | Hitachi Ltd | System, method and program for managing medical information and recording medium recording medical information managing program |
| JP4785294B2 (en) * | 2001-08-08 | 2011-10-05 | 勝三 川西 | Health information display device |
| JP2006011494A (en) * | 2004-06-22 | 2006-01-12 | Synergies Jp:Kk | Health control support device, method, program, and system |
| JP2007310632A (en) * | 2006-05-18 | 2007-11-29 | Taito Corp | Other self health/figure forecasting system |
| KR20110074527A (en) * | 2008-09-12 | 2011-06-30 | 네이비제닉스 인크. | Methods and systems for incorporating multiple environmental and genetic risk factors |
| JP2010231308A (en) * | 2009-03-26 | 2010-10-14 | Olympus Corp | Lifestyle disease prevention device and lifestyle disease prevention program |
| JP2011134106A (en) * | 2009-12-24 | 2011-07-07 | Hitachi Ltd | Medical information collection system, medical information collection processing method and display control method for medical information collection screen |
| US20110224505A1 (en) * | 2010-03-12 | 2011-09-15 | Rajendra Padma Sadhu | User wearable portable communicative device |
| CN103020747A (en) * | 2011-09-22 | 2013-04-03 | 生命遗传株式会社 | Personalized health and beauty system |
| CN104704526A (en) * | 2013-10-01 | 2015-06-10 | 国立大学法人东北大学 | Health information procssing device, health information display device, and method |
-
2014
- 2014-10-01 CN CN201480002440.9A patent/CN104704526A/en active Pending
- 2014-10-01 EP EP14843220.6A patent/EP3054412A4/en not_active Withdrawn
- 2014-10-01 WO PCT/JP2014/076332 patent/WO2015050174A1/en active Application Filing
- 2014-10-01 SG SG11201502141RA patent/SG11201502141RA/en unknown
- 2014-10-01 JP JP2015508354A patent/JP6212784B2/en active Active
-
2015
- 2015-03-18 US US14/661,785 patent/US20150193588A1/en not_active Abandoned
-
2016
- 2016-12-26 JP JP2016252035A patent/JP6212787B2/en active Active
- 2016-12-26 JP JP2016252034A patent/JP6212786B2/en active Active
Also Published As
| Publication number | Publication date |
|---|---|
| SG11201502141RA (en) | 2015-05-28 |
| CN104704526A (en) | 2015-06-10 |
| EP3054412A4 (en) | 2017-03-01 |
| EP3054412A1 (en) | 2016-08-10 |
| JP2017097895A (en) | 2017-06-01 |
| JP6212787B2 (en) | 2017-10-18 |
| US20150193588A1 (en) | 2015-07-09 |
| JP2017059261A (en) | 2017-03-23 |
| JP6212784B2 (en) | 2017-10-18 |
| WO2015050174A1 (en) | 2015-04-09 |
| JPWO2015050174A1 (en) | 2017-03-09 |
Similar Documents
| Publication | Publication Date | Title |
|---|---|---|
| JP6212786B2 (en) | Health information display device, solution system and method | |
| AU2021221774B2 (en) | Database management and graphical user interfaces for managing blood glucose levels | |
| JP6248326B2 (en) | Meal-type sensor and sensing method | |
| US20210319887A1 (en) | Method of treating diabetes informed by social determinants of health | |
| JP6360998B2 (en) | Health information processing equipment | |
| Corsonello et al. | Concealed renal insufficiency and adverse drug reactions in elderly hospitalized patients | |
| JP5926517B2 (en) | System for managing personal health and wellness and non-transitory computer-readable storage medium storing a computer program containing instructions thereof | |
| US20170262609A1 (en) | Personalized adaptive risk assessment service | |
| US11621090B2 (en) | Platform for assessing and treating individuals by sourcing information from groups of resources | |
| Budhiraja et al. | The role of big data in the management of sleep-disordered breathing | |
| AU2020398656A1 (en) | Digital therapeutic systems and methods | |
| Murali et al. | Patient engagement | |
| Leeds et al. | Assessing clinical discharge data preferences among practicing surgeons | |
| Karupaiah et al. | Metering self-reported adherence to clinical outcomes in Malaysian patients with hypertension: applying the stages of change model to healthful behaviors in the CORFIS study | |
| Portius | Wish or Truth: Can Digital Interventions Stop the Obesity Crisis? | |
| Nichols | Knowing Quality When You See It |
Legal Events
| Date | Code | Title | Description |
|---|---|---|---|
| A975 | Report on accelerated examination |
Free format text: JAPANESE INTERMEDIATE CODE: A971005 Effective date: 20170404 |
|
| A131 | Notification of reasons for refusal |
Free format text: JAPANESE INTERMEDIATE CODE: A131 Effective date: 20170425 |
|
| A521 | Request for written amendment filed |
Free format text: JAPANESE INTERMEDIATE CODE: A523 Effective date: 20170621 |
|
| TRDD | Decision of grant or rejection written | ||
| A01 | Written decision to grant a patent or to grant a registration (utility model) |
Free format text: JAPANESE INTERMEDIATE CODE: A01 Effective date: 20170801 |
|
| A61 | First payment of annual fees (during grant procedure) |
Free format text: JAPANESE INTERMEDIATE CODE: A61 Effective date: 20170829 |
|
| R150 | Certificate of patent or registration of utility model |
Ref document number: 6212786 Country of ref document: JP Free format text: JAPANESE INTERMEDIATE CODE: R150 |
|
| R250 | Receipt of annual fees |
Free format text: JAPANESE INTERMEDIATE CODE: R250 |
|
| R250 | Receipt of annual fees |
Free format text: JAPANESE INTERMEDIATE CODE: R250 |