JP5526541B2 - Debris flow risk judgment device, debris flow risk judgment method, and debris flow risk judgment program - Google Patents
Debris flow risk judgment device, debris flow risk judgment method, and debris flow risk judgment program Download PDFInfo
- Publication number
- JP5526541B2 JP5526541B2 JP2008332334A JP2008332334A JP5526541B2 JP 5526541 B2 JP5526541 B2 JP 5526541B2 JP 2008332334 A JP2008332334 A JP 2008332334A JP 2008332334 A JP2008332334 A JP 2008332334A JP 5526541 B2 JP5526541 B2 JP 5526541B2
- Authority
- JP
- Japan
- Prior art keywords
- rainfall
- effective
- graph
- point
- maximum
- Prior art date
- Legal status (The legal status is an assumption and is not a legal conclusion. Google has not performed a legal analysis and makes no representation as to the accuracy of the status listed.)
- Expired - Fee Related
Links
Images


Description
本発明は土石流災害の危険判定に関し、より詳細には雨量判定図を基に現在時刻に直近の直近雨量と現在時刻から所定時間前の最大雨量および最小雨量から災害発生の危険度とその確度を予測する土石流危険判定装置、土石流危険判定方法および土石流危険判定プログラムに関するものである。 The present invention relates to risk assessment of debris flow disasters, and more specifically, based on the rainfall judgment chart, the most recent rainfall at the current time, the maximum rainfall and the minimum rainfall before a predetermined time from the current time, and the risk of disaster occurrence and its accuracy. The present invention relates to a debris flow risk determination apparatus, a debris flow risk determination method, and a debris flow risk determination program.
大雨による土石流災害発生の危険度に関しては、国土交通省と都道府県とが土砂災害情報システムにおいて土砂災害警戒情報を発表し、この情報を基に市が避難勧告の発令を判断したり、住民が自主避難を判断している。危険度の予測には、例えば時間雨量と実効雨量の二つの指標雨量をグラフで表した雨量判定図(砂防判定図とも言われる)を用いることが知られている。雨量判定図には過去起こった降雨と土砂災害発生の履歴から地域毎に一定の基準を設け、今後の雨量がこの基準を超えるかどうかで危険度を予測している。 Regarding the risk of debris flow disasters due to heavy rain, the Ministry of Land, Infrastructure, Transport and Tourism and the prefecture have announced landslide disaster warning information in the landslide disaster information system, and based on this information, the city has decided to issue evacuation advisories, Judging voluntary evacuation. It is known to use, for example, a rain determination chart (also referred to as a sabo judgment chart) that represents, for example, two indicator rainfalls, hourly rainfall and effective rainfall, for the risk level prediction. In the rain judgment chart, a certain standard is set for each region based on the history of rainfall and sediment disaster that occurred in the past, and the degree of risk is predicted based on whether or not the future rainfall exceeds this standard.
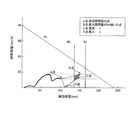
より詳細に上述した雨量判定図について説明する。図7は雨量判定図の例を示したもので、縦軸は1時間に降った雨量である時間雨量(単位:mm/h)、横軸は実効雨量(単位:mm)である。実効雨量は、前期実効雨量に連続雨量を加えた値であるが、前期実効雨量は今回の一連の降雨前に降った雨量(前期雨量と言う)にどれだけ地中に残存するかを示す係数をかけ累積した雨量である。 The rain amount determination diagram described above will be described in more detail. FIG. 7 shows an example of a rainfall judgment diagram, where the vertical axis is the hourly rainfall (unit: mm / h) which is the rainfall that has fallen in one hour, and the horizontal axis is the effective rainfall (unit: mm). Effective rainfall is the value obtained by adding continuous rainfall to the previous period's effective rainfall, but the previous period's effective rainfall is a coefficient that indicates how much rain remains in the ground in the rainfall that occurred before this series of rainfalls (referred to as the previous period's rainfall). Accumulated rainfall.
図中のCL(Critical Line)は土石流発生危険基準線を示し、過去の実績を基に土石流が発生する可能性が最も高いと定めた危険レベルである。CLより上側の領域は土石流発生に関して危険であり、下側の領域は一応安全である。地域によって地形や地質が異なり、CLはその地域によって定められる。 CL (Critical Line) in the figure indicates a debris flow generation risk reference line, which is a risk level determined that the possibility of debris flow is most likely based on past results. The area above CL is dangerous for debris flow generation, and the area below is safe for the time being. The topography and geology differ from region to region, and CL is determined by the region.
EL(Evacuation Line)は避難基準線を表し、この地域にいる人が安全な雛難場所に避難する目安である。ELの求め方は、その地域の過去における最大の時間雨量を縦軸にとり、その点を通って横軸に平行な直線がCLと交わった点を求め、その点から横軸に垂直に降ろした直線で示される。 EL (Evacuation Line) represents the evacuation reference line, and is a guideline for people in this area to evacuate to safe places. The EL is calculated by taking the maximum amount of rainfall in the past in the area on the vertical axis, finding the point through which the line parallel to the horizontal axis intersects the CL, and dropping from that point perpendicular to the horizontal axis. Indicated by a straight line.
WL(Warning Line)は警戒基準線を表し、雨量の情報に注意し、危険を感じたら安全な場所に避難する目安である。上記の最大の時間雨量でELに到着する1時間前の実効雨量で示されるものである。 WL (Warning Line) represents a warning reference line, which is an indication of evacuating to a safe place if you feel the danger and pay attention to the rainfall information. It is indicated by the effective rainfall one hour before arriving at the EL with the above maximum hourly rainfall.
SL(Snake Line)はスネーク曲線を表し、時間毎に時間雨量と実効雨量とを雨量判定図にプロットして結んだ線で、時間雨量と実効雨量とで表される降雨の軌跡である。このSLがCLを超えると、過去の土石流災害の経験から土石流災害が発生する可能性が高い、ということになる。なお、SLは種々の降雨情報を用いて表示することが可能であるが、ここでは時間雨量と実効雨量とを指標としている(非特許文献1参照)。 SL (Snake Line) represents a snake curve, and is a trajectory of rainfall represented by hourly rainfall and effective rainfall, which is a line obtained by plotting hourly rainfall and effective rainfall on a rainfall judgment diagram for each hour. If this SL exceeds CL, it means that there is a high possibility that a debris flow disaster will occur based on past debris flow disaster experiences. Although SL can be displayed using various types of rainfall information, here, hourly rainfall and effective rainfall are used as indices (see Non-Patent Document 1).
防災担当の予報官は、この雨量判定図を基に土石流災害発生の有無を予測するが、上述のように雨量判定図には時刻表示がないので時系列に変化を読み取ることができない。このため、予報官の予測判断を支援するために雨量判定図に時刻を表示する技術が知られている(特許文献1)。
土石流災害の予知は、予報官が雨量判定図に今後の雨量を予測線として入力して描画させ、基準線に到達する時間を求めていた。このため、予知結果を得るまでに多くの時間を要し、土砂災害への対応が遅れる、という問題があった。 For prediction of debris flow disasters, forecasters input the future rainfall as a prediction line and draw it on the rainfall judgment map, and calculated the time to reach the reference line. For this reason, there was a problem that it took a lot of time to obtain the prediction result, and the response to the sediment disaster was delayed.
また、上述のように雨量判定図は過去の降雨軌跡を示すものであり、この雨量判定図から降雨の動向を読み取ると共に、過去の事例に基づいて今後の雨量の予測を行うことは予報官の経験と勘に負うところが大きく、予報官によって予知結果が異なる場合があった。 In addition, as described above, the rainfall judgment map shows the past rainfall trajectory, and it is the forecaster's responsibility to read the rainfall trend from this rainfall judgment chart and to predict future rainfall based on past cases. It depends heavily on experience and intuition, and the forecast results may differ depending on the forecaster.
特許文献1に提案された雨量判定図に時刻表示することは予報官の判断をより確かなものにする一助になると考えられるがこれだけで充分とは言えず、より一層の災害発生予知の確率を高めることが求められている。 Although it is thought that displaying the time on the rainfall judgment map proposed in Patent Document 1 will help to make the judgment of the forecaster more reliable, this is not enough, and it will increase the probability of further predicting the occurrence of a disaster. There is a need to increase it.
本発明は、予報官の技量によらず短時間で土石流災害発生の予知を行うことができる土石流危険判定装置、土石流危険判定方法および土石流危険判定プログラムを提供することを目的とする。 An object of the present invention is to provide a debris flow risk judgment device, a debris flow risk judgment method, and a debris flow risk judgment program that can predict the occurrence of a debris flow disaster in a short time regardless of the skill of a forecaster.
上記目的を達成するため、土石流危険判定装置は実績雨量記憶部、雨量情報取得部、実効雨量算出部、グラフ記憶部、危険度判定確度算出部および出力部を有する。 In order to achieve the above object, the debris flow risk determination apparatus includes an actual rainfall storage unit, a rainfall information acquisition unit, an effective rainfall calculation unit, a graph storage unit, a risk determination accuracy calculation unit, and an output unit.
実績雨量記憶部は、降雨前の雨量に基づく前期実効雨量と、単位時間当たりの雨量と、
その単位時間当たりの雨量を計測した時刻との情報を含む雨量情報を格納するものである
。
Actual rainfall storage unit, and the previous fiscal year the effective rainfall based on the rainfall of the previous rainfall, and the rainfall per unit time,
The rainfall information including information on the time when the rainfall per unit time is measured is stored.
雨量情報取得部は、実績雨量記憶部から、現在時刻に直近の時刻に対応する直近雨量と、現在時刻から所定時間前までの雨量のうち最大を示す最大雨量と最小を示す最小雨量とを取得する。 The rainfall information acquisition unit acquires, from the actual rainfall storage unit, the most recent rainfall corresponding to the time closest to the current time, and the maximum and minimum rainfalls that indicate the maximum and minimum of the rainfall from the current time to a predetermined time ago. To do.
実効雨量算出部は、直近雨量の実効雨量である第一の直近実効雨量と、最大雨量と直近
雨量と最小雨量とが現在時刻から所定時間継続した場合のそれぞれの実効雨量である最大
実効雨量と第二の直近実効雨量と最小実効雨量とを実績雨量記憶部を参照して算出する。
実効雨量の算出には前期実効雨量の値が必要のため、実績雨量記憶部を参照して算出する
。
The effective rainfall calculation unit calculates the first nearest effective rainfall, which is the effective rainfall of the most recent rainfall, and the maximum effective rainfall, which is the respective effective rainfall when the maximum rainfall, the latest rainfall, and the minimum rainfall continue for a predetermined time from the current time. The second latest effective rainfall and the minimum effective rainfall are calculated with reference to the actual rainfall storage unit.
For required value before phase effective rainfall in the calculation of the effective rainfall, calculated with reference to the actual rainfall storage unit.
グラフ記憶部は、直近雨量と第一の直近実効雨量とに基づいた第一の点と、最大雨量と最大実効雨量とに基づいた第二の点と、直近雨量と第二の直近実効雨量とに基づいた第三の点と、最小雨量と最小実効雨量とに基づいた第四の点との位置を、縦軸を時間雨量、横軸を実効雨量とするグラフ上で算出し格納する。 The graph storage unit includes a first point based on the most recent rainfall and the first most recent effective rainfall, a second point based on the maximum and most effective rainfall, and the most recent rainfall and the second most recent effective rainfall. The positions of the third point based on the above and the fourth point based on the minimum rainfall and the minimum effective rainfall are calculated and stored on a graph with the vertical axis representing the hourly rainfall and the horizontal axis representing the effective rainfall.
危険度判定確度算出部は、第一乃至第四の点により定まるグラフ上の多角形の領域に対し、グラフに定められる危険度判定の基準を示す所定の値を越えている領域の割合を算出し、割合に対応して予め定められる危険度判定の確度を求める。 The risk determination accuracy calculation unit calculates a ratio of a region exceeding a predetermined value indicating a risk determination criterion defined in the graph to a polygonal region on the graph determined by the first to fourth points. Then, the accuracy of risk determination determined in advance corresponding to the ratio is obtained.
出力部は、グラフ記憶部に格納されている第一乃至第四の点と、第一乃至第四の点を結ぶ線とを前記グラフ上にプロットしたグラフと、確度を含む危険度判定に関する情報とを出力する。 The output unit includes a graph in which the first to fourth points stored in the graph storage unit and a line connecting the first to fourth points are plotted on the graph, and information relating to risk determination including accuracy. Is output.
雨量判定図において、現在時刻に直近の雨量(直近雨量)と、現在時刻から所定時間前までの最大雨量、直近雨量および最小雨量とが所定時間その雨量を継続した場合のそれぞれの予測値の4点で定まる領域に対して、所定の基準値(例えば、WL)を超えている領域の割合で危険度判定の確度を表すようにしたので、予測値の手入力を不要とし短時間で予知結果を得ることができる。また、その予知結果は危険度と共にその判定の確度を知ることができる。また、経験や勘を排除したので予報の担当者によるバラツキがなくなる。 In the rainfall judgment chart, the most recent rainfall (current rainfall) at the current time, the maximum rainfall from the current time, the most recent rainfall, and the minimum rainfall for each predicted value of 4 when the rainfall continues for a predetermined time. Since the accuracy of risk determination is expressed by the ratio of the area that exceeds a predetermined reference value (for example, WL) with respect to the area determined by the point, the prediction result can be obtained in a short time without requiring manual input of the predicted value. Can be obtained. Moreover, the prediction result can know the accuracy of the determination together with the degree of danger. Also, since experience and intuition are eliminated, there is no variability due to the person in charge of forecasting.
本発明の実施形態を図1〜図6を用いて説明する。 An embodiment of the present invention will be described with reference to FIGS.
図1は、本発明の土石流危険判定装置の構成例を示すもので、本発明に関連する部分のみを示した図である。土石流危険判定装置100はプログラムやデータを制御する主制御部110、雨量を観測するテレメータから送信される雨量データを受信する通信制御部120、キーボード(KB)131やディスプレイ(DISP)132、スピーカ(SP)133を制御する入出力制御部130、主メモリ140上に展開した土石流危険判定プログラム150、テレメータから送信された雨量データを計測時刻と対応付けて格納する実績雨量記憶部160、土石流危険判定プログラム150で危険度の判定に参照される危険度判定確度テーブル161および判定に用いた雨量判定図のグラフ上の位置情報を記憶するグラフ記憶部162から構成する。
FIG. 1 shows a configuration example of a debris flow risk judging device according to the present invention, and is a diagram showing only a portion related to the present invention. The debris flow
土石流危険判定プログラム150は、更に雨量情報取得部151、実効雨量算出部152、グラフ位置算出部153、危険度判定確度算出部154および出力部155から構成する。次にこれらの各部の概要を説明する。
The debris flow
雨量情報取得部151は、実績雨量記憶部160から直近の雨量と現在時刻から所定時間前までの最大雨量、最小雨量の情報を取得する。
The rainfall
実効雨量算出部152は、直近雨量の実効雨量と、最大雨量、直近雨量および最小雨量が現在時刻から所定時間継続したときの実効雨量(予測実効雨量ということになる)を求めることを行う。
The effective
グラフ位置算出部153は、雨量取得部151で取得した雨量と実効雨量算出部152で求めた実効雨量をもとに、直近雨量におけるグラフ上(雨量判定図)の位置と、3H継続した最大雨量と直近雨量と最小雨量におけるグラフ上の位置の計4点の位置を求める。
Based on the rainfall acquired by the
危険度判定確度算出部154は、4点の位置で定まる領域に対し、その領域のうち危険度を表す基準線を超える領域の割合を求め、その求めた割合から危険度判定確度テーブル161を参照して危険度判定の確度を求め、当該確度の表示情報を取得する。
The risk determination
出力部155は、グラフ位置算出部153で求めた4点と、その4点で定まる領域と危険度判定の情報をディスプレイ132に表示する。
The
次に、実績雨量記憶部160と危険度判定確度テーブル161のデータ例について説明する。
Next, data examples of the actual
図2は、実績雨量記憶部160のデータ例を示したものである。テレメータから送信された雨量データを基に土石流危険判定装置100は図に示される雨量データの記録を行う。実績雨量記憶部160は、雨量データを計測した「年月日」と「時刻」、今回の一連の降雨前の雨量から計算で求まる「前期実効降雨」、テレメータで観測される「10分間雨量」、10分間雨量を1時間の雨量に換算した「時間雨量」および前期実効雨量とその時点の積算した雨量で定まる「実効雨量」の各フィールドから構成する。
FIG. 2 shows an example of data in the actual
図2のデータ例は、一連の降雨が2008年12月1日の5:10〜5:20の間に始まった例を示しており、2008年12月1日の5:00から現在時刻までの雨量データが示される。 The data example in FIG. 2 shows an example in which a series of rainfalls started between 5:10 and 5:20 on December 1, 2008, from 5:00 on December 1, 2008 to the current time. The rainfall data for is shown.
5:00の時点では前期実効雨量は前期の雨量をもとに計算された28mm、10分間雨量は0mmである。実効雨量は前期実効雨量に10分間雨量を加算して求まる値で、10分間雨量が0mmなので前期実効雨量と同じ28mmとなる。降雨の始まってからの最初の雨量が得られた5:20の10分間雨量は0.5mmで、時間雨量は10分間雨量を6倍した3mmとなる。このときの実効雨量は5:10の実効雨量28mmに10分間雨量0.5mmを加算した28.5mmとなる。なお、図2に示される現在時刻から8時間前までの最大雨量と最小雨量は、時間雨量でそれぞれ16.8mmと1.8mmである。 At 5:00, the effective rainfall for the previous period is 28 mm, calculated based on the rainfall for the previous period, and 0 mm for 10 minutes. The effective rainfall is a value obtained by adding the rainfall for 10 minutes to the effective rainfall for the previous period, and since the rainfall for 10 minutes is 0 mm, it is 28 mm which is the same as the effective rainfall for the previous period. At 5:20 when the first rainfall from the beginning of rainfall was obtained, the 10-minute rainfall was 0.5 mm, and the hourly rainfall was 3 mm, six times the rainfall for 10 minutes. The effective rainfall at this time is 28.5 mm, which is obtained by adding the rain of 0.5 mm for 10 minutes to the effective rainfall of 28 mm of 5:10. Note that the maximum rainfall and the minimum rainfall from the current time shown in FIG. 2 to 8 hours before are 16.8 mm and 1.8 mm, respectively.
図3は、危険度判定確度テーブル161のデータ例を示し、ここでは、警告レベルにおいて後述する領域の面積比率に対応してその警告レベルの確度とディスプレイ132に表示する表示文の例を示している。計算で求まる面積比率は4捨5入し、0の場合は警告レベルに達していないと判定し、1%−10%は「小」の確率で警告レベルにあり、11%−30%は「中」の確率で警告レベルにあり、31%以上は「大」の確率で警告レベルにあると判定し、それぞれの確率に該当する表示文をディスプレイ132に表示する。
FIG. 3 shows an example of data in the risk determination accuracy table 161. Here, the warning level accuracy corresponding to the area ratio of the area to be described later at the warning level and an example of a display sentence displayed on the
次に、土石流危険判定装置100の処理のフローを説明する。図4は、オペレータによって土石流の危険度判定の指示がなされ、土石流危険判定プログラム150が起動された後の処理フローを示している。ここでは、実績雨量記憶部160および危険度判定確度テーブル161は、それぞれ図2、図3に示すデータが格納されているものとする。また、雨量判定図には土石流発生危険基準線(CL)がY=−33X+80の一次直線で設定され、避難基準線(EL)が実効雨量166mmの位置(過去の最大雨量を27mmとした)に、警戒基準線(CL)が実効雨量139mmの位置に設定してあるものとする。
Next, the processing flow of the debris flow
まず、実績雨量記憶部160を参照して直近の時間雨量とその実効雨量、そして現在時刻(13:15とする)から8H前までの最大雨量と最小雨量とを求める。図2から、それらは12mm、108mm(以上、13:30)、16.8mm(10:00)、1.8mm(6:50)である(S100)。
First, the most recent rainfall amount and its effective rainfall amount, and the maximum and minimum rainfall amounts 8 hours before the current time (13:15) are obtained with reference to the actual
次に、最大雨量と直近雨量および最小雨量とが現在時刻から3H継続して降った場合のそれぞれの実効降雨量である予測最大実効雨量、予測直近実効雨量、予測最小実効雨量を求める。予測最大実効雨量は、直近実効雨量で108mmに最大雨量16.8×3を加算して158.4mmが求まる。予測直近実効雨量および予測最小実効雨量も同様にして144mm、113.4mmを求めることができる(S110)。 Next, the predicted maximum effective rainfall, the predicted latest effective rainfall, and the predicted minimum effective rainfall, which are the effective rainfalls when the maximum rainfall, the latest rainfall, and the minimum rainfall have continued for 3H from the current time, are obtained. The predicted maximum effective rainfall is 158.4 mm obtained by adding the maximum rainfall of 16.8 × 3 to 108 mm as the latest effective rainfall. Similarly, the predicted nearest effective rainfall and the predicted minimum effective rainfall can be 144 mm and 113.4 mm (S110).
雨量判定図において、直近雨量と直近実効雨量とでA点を、最大雨量と予測最大実効雨量とでB点を、直近雨量と予測直近実効雨量とでC点を、最小雨量と予測最小実効雨量とでD点を求める。図5は、雨量判定図におけるA〜Dの各点の位置を示している。なお、図5に示したX軸に平行な点線は、上の方から最大雨量、直近雨量および最小雨量を示しており、3H後の予測を示すB〜D点はそれぞれその線上にあることになる。求めた雨量判定図における各点の位置はグラフ記憶部162に格納しておく(S120)。 In the rainfall judgment chart, point A for the most recent rainfall and the latest effective rainfall, point B for the maximum rainfall and the predicted maximum effective rainfall, point C for the latest rainfall and the predicted latest effective rainfall, and point C for the minimum and predicted minimum effective rainfall Find D point. FIG. 5 shows the positions of the points A to D in the rainfall determination diagram. In addition, the dotted line parallel to the X-axis shown in FIG. 5 indicates the maximum rainfall, the latest rainfall, and the minimum rainfall from the upper side, and points B to D indicating the prediction after 3H are on the lines respectively. Become. The position of each point in the obtained rainfall judgment chart is stored in the graph storage unit 162 (S120).
続いて、A〜Dで定まる領域とこの領域が警戒基準線(WL)を超える領域との面積比率を求める。警戒基準線を超える領域は、図5において斜線が示される領域である(S130)。 Subsequently, an area ratio between a region determined by A to D and a region where this region exceeds the warning reference line (WL) is obtained. The region exceeding the alert reference line is a region indicated by diagonal lines in FIG. 5 (S130).
求めた面積比率を危険度判定確度テーブル161を参照し、危険度の判定とその確度を求める。例えば、この例では面積比率が25%であったので、危険度判定確度テーブル161を参照して中程度の確度で警告レベルにあることが判る。該当する表示文フィールドの情報を取得する(S140)。 The risk ratio determination and its accuracy are obtained by referring to the risk determination accuracy table 161 for the obtained area ratio. For example, since the area ratio is 25% in this example, it can be seen that the warning level is at a medium accuracy with reference to the risk determination accuracy table 161. Information on the corresponding display text field is acquired (S140).
グラフ記憶部162に格納した4点の位置を取り出し、それらの4点とその4点を順次結んで表される多角形と、A点を原点としてB〜Dの各点をそれぞれ結ぶ線と、危険度判定確度の表示情報とをディスプレイに表示する。ディスプレイの表示例えば図6のように示される(S150)。
The positions of the four points stored in the
A点を原点としてB〜Dの各点を結ぶ線のいずれかが警告基準線を超えている場合は、スピーカ133からオペレータに注意を促すためにアラーム音を報知する。図6に示されるように、現在時刻に対して直近の降雨量の位置(即ち、A点の位置)から結ばれた3H後の予測最大雨量(B点)および予測直近雨量(C点)の線は警告基準線を超えているのでアラーム音が報知される。この例では、アラーム音を報知するようにしたが、オペレータに注意を促すことが目的であるのでアラーム音に代えて危険度判定情報の表示を例えばブリンキングさせてもよく、アラームの方法はどのような方法であってもよい(S160)。
When any of the lines connecting the points B to D with the point A as the origin exceeds the warning reference line, an alarm sound is notified from the
なお、図4の処理フローにおける各ステップの図1における動作主体は、ステップ100(以降S100と言う)が雨量情報取得部151、S110が実効雨量算出部152、S120がグラフ位置算出部153、S130とS140が危険度判定確度算出部154、そしてS150とS160が出力部155である。
1 in each step in the processing flow of FIG. 4 is the rainfall
本実施形態では、警告基準線(WL)について危険度とその確度を判定するようにしたが、避難基準線(EL)や土石流発生危険基準線で(CL)あってもよく、また、それらについて同時に行ってもよい。同時に行う場合は、危険度のレベルはCL>EL>WLであるので、危険度の高い順序で危険度判定とその確度を表示するようにしてもよい。 In the present embodiment, the risk level and the accuracy are determined for the warning reference line (WL), but there may be an evacuation reference line (EL) or a debris flow generation risk reference line (CL). You may do it at the same time. When performing at the same time, since the risk level is CL> EL> WL, the risk determination and its accuracy may be displayed in the order of high risk.
また、本実施形態では3H後の予測雨量をもとに危険度とその確度を自動で表すようにしたが、オペレータに任意の予測時間を入力させるようにしてもよい。 In the present embodiment, the risk and the accuracy are automatically expressed based on the predicted rainfall after 3H. However, the operator may input an arbitrary predicted time.
また、本発明を決められた時間毎に自動的に実行するようにしてもよい。 Further, the present invention may be automatically executed at predetermined time intervals.
100 土石流危険判定装置
110 主制御部
120 通信制御部
130 入出力制御部
131 キーボード(KB)
132 ディスプレイ(DISP)
133 スピーカ(SP)
140 主メモリ
150 土石流危険判定プログラム
151 雨量情報取得部
152 実効雨量算出部
153 グラフ位置算出部
154 危険度判定確度算出部
155 出力部
160 実績雨量記憶部
162 危険度判定確度テーブル
163 グラフ記憶部
DESCRIPTION OF
132 Display (DISP)
133 Speaker (SP)
140
Claims (6)
雨量を計測した時刻との情報を含む雨量情報を格納する実績雨量記憶部と、
前記実績雨量記憶部から、現在時刻に直近の前記時刻に対応する直近雨量と、該現在時
刻から所定時間前までの雨量のうち最大を示す最大雨量と最小を示す最小雨量とを取得す
る雨量情報取得部と、
前記直近雨量の実効雨量である第一の直近実効雨量と、前記最大雨量と該直近雨量と前
記最小雨量とが現在時刻から所定時間継続した場合のそれぞれの実効雨量である最大実効
雨量と第二の直近実効雨量と最小実効雨量とを前記実績雨量記憶部を参照して算出する実
効雨量算出部と、
前記直近雨量と前記第一の直近実効雨量とに基づいた第一の点と、前記最大雨量と前記
最大実効雨量とに基づいた第二の点と、該直近雨量と前記第二の直近実効雨量とに基づい
た第三の点と、前記最小雨量と前記最小実効雨量とに基づいた第四の点との位置を、縦軸
を時間雨量、横軸を実効雨量とするグラフ上で算出し格納するグラフ記憶部と、
前記第一乃至第四の点により定まるグラフ上の多角形の領域に対し、該グラフに定めら
れる危険度判定の基準を示す所定の値を越えている領域の割合を算出し、該割合に対応し
て予め定められる危険度判定の確度を求める危険度判定確度算出部と、
前記グラフ記憶部に格納されている前記第一乃至第四の点と、該第一乃至第四の点を結
ぶ線とを前記グラフ上にプロットしたグラフと、前記確度を含む危険度判定に関する情報
とを出力する出力部と
を有することを特徴とする土石流危険判定装置。 A previous period effective rainfall based on rainfall before rainfall, the rainfall per unit time, and actual rainfall storage unit for storing the rainfall information including information on the time measured rainfall per the unit time,
Rainfall information for acquiring the latest rainfall corresponding to the time nearest to the current time and the maximum and minimum rainfalls indicating the maximum and minimum of the rainfall from the current time to a predetermined time before from the actual rainfall storage unit. An acquisition unit;
A first nearest effective rainfall that is an effective rainfall of the latest rainfall, a maximum effective rainfall that is an effective rainfall when the maximum rainfall, the latest rainfall, and the minimum rainfall have continued for a predetermined time from a current time; An effective rainfall calculation unit for calculating the latest effective rainfall and the minimum effective rainfall with reference to the actual rainfall storage unit,
A first point based on the most recent rainfall and the first nearest effective rainfall; a second point based on the maximum rainfall and the maximum effective rainfall; and the most recent rainfall and the second most recent effective rainfall. The position of the third point based on the above and the fourth point based on the minimum rainfall and the minimum effective rainfall are calculated and stored on a graph with the vertical axis representing the hourly rainfall and the horizontal axis representing the effective rainfall. A graph storage unit to
For the polygonal area on the graph determined by the first to fourth points, calculate the ratio of the area exceeding the predetermined value indicating the criterion of risk determination defined in the graph, and correspond to the ratio A risk determination accuracy calculation unit for obtaining a predetermined risk determination accuracy;
Information regarding risk determination including the accuracy and a graph in which the first to fourth points stored in the graph storage unit and a line connecting the first to fourth points are plotted on the graph. And a debris flow hazard judgment device characterized by comprising: an output unit for outputting.
と第三の点、第一の点と第四の点をそれぞれ結んだ線のいずれかが、前記グラフ上の所定
の値を超えた場合にアラームを出力する
ことを特徴とする請求項1に記載の土石流危険判定装置。 The output unit further includes a line connecting the first point and the second point, the first point and the third point, and the first point and the fourth point stored in the graph storage unit. The debris flow risk determination device according to claim 1, wherein an alarm is output when any of the values exceeds a predetermined value on the graph.
雨量を計測した時刻との情報を含む雨量情報を格納した実績雨量記憶部から、現在時刻に
直近の前記時刻に対応する直近雨量と、該現在時刻から所定時間前までの雨量のうち最大
を示す最大雨量と最小を示す最小雨量とを取得する雨量情報取得手順と、
前記直近雨量の実効雨量である第一の直近実効雨量と、前記最大雨量と該直近雨量と前
記最小雨量とが現在時刻から所定時間継続した場合のそれぞれの実効雨量である最大実効
雨量と第二の直近実効雨量と最小実効雨量とを前記実績雨量記憶部を参照して算出する実
効雨量算出手順と、
前記直近雨量と前記第一の直近実効雨量とに基づいた第一の点と、前記最大雨量と前記
最大実効雨量とに基づいた第二の点と、該直近雨量と前記第二の直近実効雨量とに基づい
た第三の点と、前記最小雨量と前記最小実効雨量とに基づいた第四の点との位置を、縦軸
を時間雨量、横軸を実効雨量とするグラフ上で算出しグラフ記憶部に格納するグラフ記憶
手順と、
前記第一乃至第四の点により定まるグラフ上の多角形の領域に対し、該グラフに定めら
れる危険度判定の基準を示す所定の値を越えている領域の割合を算出し、該割合に対応し
て予め定められる危険度判定の確度を求める危険度判定確度算出手順と、
前記グラフ記憶部に格納されている前記第一乃至第四の点と、該第一乃至第四の点を結
ぶ線とを前記グラフ上にプロットしたグラフと、前記確度を含む危険度判定に関する情報
とを出力する出力手順と
を有することを特徴とする土石流危険判定方法。 A previous period effective rainfall based on rainfall before rainfall, the rainfall per unit time, from actual rainfall storage unit that stores rainfall information including information on the time measured rainfall per the unit time, the most recent to current time Rainfall information acquisition procedure for acquiring the latest rainfall corresponding to the time, the maximum rainfall showing the maximum and the minimum rainfall showing the minimum of the rainfall from the current time to a predetermined time before,
A first nearest effective rainfall that is an effective rainfall of the latest rainfall, a maximum effective rainfall that is an effective rainfall when the maximum rainfall, the latest rainfall, and the minimum rainfall have continued for a predetermined time from a current time; An effective rainfall calculation procedure for calculating the latest effective rainfall and the minimum effective rainfall with reference to the actual rainfall storage unit,
A first point based on the most recent rainfall and the first nearest effective rainfall; a second point based on the maximum rainfall and the maximum effective rainfall; and the most recent rainfall and the second most recent effective rainfall. The position of the third point based on the above and the fourth point based on the minimum rainfall and the minimum effective rainfall are calculated on a graph with the vertical axis representing the hourly rainfall and the horizontal axis representing the effective rainfall. A graph storage procedure to be stored in the storage unit;
For the polygonal area on the graph determined by the first to fourth points, calculate the ratio of the area exceeding the predetermined value indicating the criterion of risk determination defined in the graph, and correspond to the ratio A risk determination accuracy calculation procedure for obtaining a predetermined risk determination accuracy;
Information regarding risk determination including the accuracy and a graph in which the first to fourth points stored in the graph storage unit and a line connecting the first to fourth points are plotted on the graph. And a debris flow hazard judgment method characterized by comprising:
点と第三の点、第一の点と第四の点をそれぞれ結んだ線のいずれかが、前記グラフ上の所
定の値を超えた場合にアラームを出力する
ことを特徴とする請求項3に記載の土石流危険判定方法。 The output procedure further includes a line connecting the first point and the second point, the first point and the third point, and the first point and the fourth point stored in the graph storage unit. The debris flow risk determination method according to claim 3, wherein an alarm is output when any one of the graphs exceeds a predetermined value on the graph.
降雨前の雨量に基づく前期実効雨量と、単位時間当たりの雨量と、該単位時間当たりの
雨量を計測した時刻との情報を含む雨量情報を格納した実績雨量記憶部から、現在時刻に
直近の前記時刻に対応する直近雨量と、該現在時刻から所定時間前までの雨量のうち最大
を示す最大雨量と最小を示す最小雨量とを取得する雨量情報取得手順と、
前記直近雨量の実効雨量である第一の直近実効雨量と、前記最大雨量と該直近雨量と前
記最小雨量とが現在時刻から所定時間継続した場合のそれぞれの実効雨量である最大実効
雨量と第二の直近実効雨量と最小実効雨量とを前記実績雨量記憶部を参照して算出する実
効雨量算出手順と、
前記直近雨量と前記第一の直近実効雨量とに基づいた第一の点と、前記最大雨量と前記
最大実効雨量とに基づいた第二の点と、該直近雨量と前記第二の直近実効雨量とに基づい
た第三の点と、前記最小雨量と前記最小実効雨量とに基づいた第四の点との位置を、縦軸
を時間雨量、横軸を実効雨量とするグラフ上で算出しグラフ記憶部に格納するグラフ記憶
手順と、
前記第一乃至第四の点により定まるグラフ上の多角形の領域に対し、該グラフに定めら
れる危険度判定の基準を示す所定の値を越えている領域の割合を算出し、該割合に対応し
て予め定められる危険度判定の確度を求める危険度判定確度算出手順と、
前記グラフ記憶部に格納されている前記第一乃至第四の点と、該第一乃至第四の点を結
ぶ線とを前記グラフ上にプロットしたグラフと、前記確度を含む危険度判定に関する情報
とを出力する出力手順と
を実行させるための土石流危険判定プログラム。 On the computer,
A previous period effective rainfall based on rainfall before rainfall, the rainfall per unit time, from actual rainfall storage unit that stores rainfall information including information on the time measured rainfall per the unit time, the most recent to current time Rainfall information acquisition procedure for acquiring the latest rainfall corresponding to the time, the maximum rainfall showing the maximum and the minimum rainfall showing the minimum of the rainfall from the current time to a predetermined time before,
A first nearest effective rainfall that is an effective rainfall of the latest rainfall, a maximum effective rainfall that is an effective rainfall when the maximum rainfall, the latest rainfall, and the minimum rainfall have continued for a predetermined time from a current time; An effective rainfall calculation procedure for calculating the latest effective rainfall and the minimum effective rainfall with reference to the actual rainfall storage unit,
A first point based on the most recent rainfall and the first nearest effective rainfall; a second point based on the maximum rainfall and the maximum effective rainfall; and the most recent rainfall and the second most recent effective rainfall. The position of the third point based on the above and the fourth point based on the minimum rainfall and the minimum effective rainfall are calculated on a graph with the vertical axis representing the hourly rainfall and the horizontal axis representing the effective rainfall. A graph storage procedure to be stored in the storage unit;
For the polygonal area on the graph determined by the first to fourth points, calculate the ratio of the area exceeding the predetermined value indicating the criterion of risk determination defined in the graph, and correspond to the ratio A risk determination accuracy calculation procedure for obtaining a predetermined risk determination accuracy;
Information regarding risk determination including the accuracy and a graph in which the first to fourth points stored in the graph storage unit and a line connecting the first to fourth points are plotted on the graph. A debris flow risk assessment program for executing the output procedure.
点と第三の点、第一の点と第四の点をそれぞれ結んだ線のいずれかが、前記グラフ上の所
定の値を超えた場合にアラームを出力する
ことを実行させるための請求項5に記載の土石流危険判定プログラム。 The output procedure further includes a line connecting the first point and the second point, the first point and the third point, and the first point and the fourth point stored in the graph storage unit. The debris flow risk judgment program according to claim 5, wherein any one of them outputs an alarm when a predetermined value on the graph is exceeded.
Priority Applications (1)
| Application Number | Priority Date | Filing Date | Title |
|---|---|---|---|
| JP2008332334A JP5526541B2 (en) | 2008-12-26 | 2008-12-26 | Debris flow risk judgment device, debris flow risk judgment method, and debris flow risk judgment program |
Applications Claiming Priority (1)
| Application Number | Priority Date | Filing Date | Title |
|---|---|---|---|
| JP2008332334A JP5526541B2 (en) | 2008-12-26 | 2008-12-26 | Debris flow risk judgment device, debris flow risk judgment method, and debris flow risk judgment program |
Publications (2)
| Publication Number | Publication Date |
|---|---|
| JP2010150862A JP2010150862A (en) | 2010-07-08 |
| JP5526541B2 true JP5526541B2 (en) | 2014-06-18 |
Family
ID=42570237
Family Applications (1)
| Application Number | Title | Priority Date | Filing Date |
|---|---|---|---|
| JP2008332334A Expired - Fee Related JP5526541B2 (en) | 2008-12-26 | 2008-12-26 | Debris flow risk judgment device, debris flow risk judgment method, and debris flow risk judgment program |
Country Status (1)
| Country | Link |
|---|---|
| JP (1) | JP5526541B2 (en) |
Cited By (1)
| Publication number | Priority date | Publication date | Assignee | Title |
|---|---|---|---|---|
| CN106053760A (en) * | 2016-06-30 | 2016-10-26 | 吉林大学 | Debris flow source starting simulation apparatus based on combined action of surface flow scouring and rainfall |
Families Citing this family (4)
| Publication number | Priority date | Publication date | Assignee | Title |
|---|---|---|---|---|
| JP6450129B2 (en) * | 2014-05-12 | 2019-01-09 | 国立大学法人京都大学 | Slope failure prediction method and slope failure prediction device |
| TW201730778A (en) * | 2015-10-06 | 2017-09-01 | Nec Corp | Information processing device, information processing system, data display method and program storage medium |
| JP7260374B2 (en) * | 2019-04-03 | 2023-04-18 | 東海旅客鉄道株式会社 | Debris flow risk assessment method and debris flow risk assessment program |
| CN114462716B (en) * | 2022-02-18 | 2022-09-27 | 成都理工大学 | Post-earthquake debris flow forecasting method, device, equipment and readable storage medium |
Family Cites Families (4)
| Publication number | Priority date | Publication date | Assignee | Title |
|---|---|---|---|---|
| JPS59185224A (en) * | 1983-04-04 | 1984-10-20 | Japan Radio Co Ltd | Pre-alarm device for debris flow |
| JPS60117175A (en) * | 1983-11-30 | 1985-06-24 | Japan Radio Co Ltd | Alarming apparatus for avalanche of sand and stone |
| JP3576911B2 (en) * | 2000-01-28 | 2004-10-13 | 富士通アクセス株式会社 | Debris flow judgment diagram display device |
| JP2005200972A (en) * | 2004-01-16 | 2005-07-28 | Kokusai Kogyo Co Ltd | Disaster-information service system |
-
2008
- 2008-12-26 JP JP2008332334A patent/JP5526541B2/en not_active Expired - Fee Related
Cited By (1)
| Publication number | Priority date | Publication date | Assignee | Title |
|---|---|---|---|---|
| CN106053760A (en) * | 2016-06-30 | 2016-10-26 | 吉林大学 | Debris flow source starting simulation apparatus based on combined action of surface flow scouring and rainfall |
Also Published As
| Publication number | Publication date |
|---|---|
| JP2010150862A (en) | 2010-07-08 |
Similar Documents
| Publication | Publication Date | Title |
|---|---|---|
| JP6763393B2 (en) | Disaster prediction system, water content prediction device, disaster prediction method and program recording medium | |
| JP5526541B2 (en) | Debris flow risk judgment device, debris flow risk judgment method, and debris flow risk judgment program | |
| JP2007256183A (en) | Forecasting system for occurrence of disaster due to typhoon | |
| JP2019045290A (en) | River water level prediction system | |
| WO2019073937A1 (en) | Risk evaluation system | |
| US20150088719A1 (en) | Method for Predicting Financial Market Variability | |
| JP4251538B2 (en) | Slope failure prediction system | |
| JP5693491B2 (en) | Reservoir dynamic monitoring system | |
| JP2020134300A (en) | Prediction method, prediction program and information processing apparatus | |
| JP2007263888A (en) | Building diagnosis system | |
| JP4261278B2 (en) | Flood control support device, program, and flood control support method | |
| JP4799300B2 (en) | Monitoring system | |
| JP5247301B2 (en) | Disaster prevention system judgment support system | |
| JP2010271877A (en) | Disaster occurrence probability evaluation system and program thereof | |
| JP6699672B2 (en) | Display control device, safety factor display method, and computer program | |
| JP2014006605A (en) | Warning system | |
| JP6555391B2 (en) | Prediction device, prediction system, prediction method, and program | |
| JP7083735B2 (en) | Cut slope failure prediction device, cut slope failure prediction method and cut slope failure prediction program | |
| JP2021196850A (en) | Real-time inland water flood/inundation prediction system, real-time inland water flood/inundation prediction apparatus, real-time inland water flood/inundation prediction method, real-time inland water flood/inundation prediction program, computer readable recording medium, and device storing real-time inland water flood/inundation prediction program | |
| JP2018073214A (en) | Demand prediction device and demand prediction method | |
| JP4590845B2 (en) | Work management system, work management method, and work management program | |
| JP4979395B2 (en) | Lightning strike warning device and method | |
| JP2006242747A (en) | Air temperature prediction correction device | |
| JP6583421B2 (en) | Information processing apparatus, information processing system, data display method, and computer program | |
| JP2005050236A (en) | Sediment disaster information processing device and method for providing sediment disaster information using same |
Legal Events
| Date | Code | Title | Description |
|---|---|---|---|
| A621 | Written request for application examination |
Free format text: JAPANESE INTERMEDIATE CODE: A621 Effective date: 20110907 |
|
| A977 | Report on retrieval |
Free format text: JAPANESE INTERMEDIATE CODE: A971007 Effective date: 20120924 |
|
| A131 | Notification of reasons for refusal |
Free format text: JAPANESE INTERMEDIATE CODE: A131 Effective date: 20121002 |
|
| A521 | Written amendment |
Free format text: JAPANESE INTERMEDIATE CODE: A523 Effective date: 20121130 |
|
| A131 | Notification of reasons for refusal |
Free format text: JAPANESE INTERMEDIATE CODE: A131 Effective date: 20130507 |
|
| A521 | Written amendment |
Free format text: JAPANESE INTERMEDIATE CODE: A523 Effective date: 20130703 |
|
| TRDD | Decision of grant or rejection written | ||
| A01 | Written decision to grant a patent or to grant a registration (utility model) |
Free format text: JAPANESE INTERMEDIATE CODE: A01 Effective date: 20140318 |
|
| A61 | First payment of annual fees (during grant procedure) |
Free format text: JAPANESE INTERMEDIATE CODE: A61 Effective date: 20140331 |
|
| R150 | Certificate of patent or registration of utility model |
Ref document number: 5526541 Country of ref document: JP Free format text: JAPANESE INTERMEDIATE CODE: R150 |
|
| LAPS | Cancellation because of no payment of annual fees |