JP5333089B2 - Chromatographic data processor - Google Patents
Chromatographic data processor Download PDFInfo
- Publication number
- JP5333089B2 JP5333089B2 JP2009208273A JP2009208273A JP5333089B2 JP 5333089 B2 JP5333089 B2 JP 5333089B2 JP 2009208273 A JP2009208273 A JP 2009208273A JP 2009208273 A JP2009208273 A JP 2009208273A JP 5333089 B2 JP5333089 B2 JP 5333089B2
- Authority
- JP
- Japan
- Prior art keywords
- noise
- peak
- target compound
- value
- ratio
- Prior art date
- Legal status (The legal status is an assumption and is not a legal conclusion. Google has not performed a legal analysis and makes no representation as to the accuracy of the status listed.)
- Active
Links
Images


Description
本発明は、ガスクロマトグラフ(GC)や液体クロマトグラフ(LC)で得られるクロマトグラム、ガスクロマトグラフ質量分析装置(GC/MS)や液体クロマトグラフ質量分析装置(LC/MS)で得られるマスクロマトグラムやトータルイオンクロマトグラムなど、各種クロマトグラムのデータを処理するデータ処理装置に関する。 The present invention relates to a chromatogram obtained by a gas chromatograph (GC) or a liquid chromatograph (LC), a mass chromatogram obtained by a gas chromatograph mass spectrometer (GC / MS) or a liquid chromatograph mass spectrometer (LC / MS). The present invention relates to a data processing apparatus for processing data of various chromatograms such as a total ion chromatogram and a total ion chromatogram.
GC/MSやLC/MSでは、クロマトグラフにより目的試料に含まれる各種成分を時間方向に分離し、その分離された成分を質量分析部においてそれぞれイオン化して質量電荷比に応じて分離して検出する。例えば質量分析部において所定の質量電荷比の範囲(質量範囲)を繰り返し走査しつつ、クロマトグラフにおいて試料を導入した時点から所定時間が経過するまで測定を続行することにより、所定の質量範囲のマススペクトルデータが繰り返し得られる。こうして得られたデータに基づいて、横軸を時間、縦軸を強度(イオン強度)としたマスクロマトグラムを、所定の質量範囲の各質量電荷比において作成することができる。また、質量電荷比に依らず、得られたイオンの強度を合算することにより、トータルイオンクロマトグラムを作成することができる。 In GC / MS and LC / MS, various components contained in the target sample are separated in the time direction using a chromatograph, and the separated components are ionized in the mass spectrometer and separated according to the mass-to-charge ratio. To do. For example, by repeatedly scanning a predetermined mass-to-charge ratio range (mass range) in the mass analyzer and continuing the measurement until a predetermined time has elapsed from the time when the sample was introduced into the chromatograph, Spectral data is obtained repeatedly. Based on the data thus obtained, a mass chromatogram having the horizontal axis as time and the vertical axis as intensity (ion intensity) can be created at each mass-to-charge ratio in a predetermined mass range. Moreover, a total ion chromatogram can be created by adding up the intensity | strength of the obtained ion irrespective of mass to charge ratio.
このようなGC/MSやLC/MSにおいて試料中の或る測定対象化合物の含有の有無を調べるには、測定対象化合物由来の質量電荷比のマスクロマトグラムに着目し、測定対象化合物の出現予測時間範囲に有意なピークが存在するか否かを確認するようにしている。例えば農薬分析や薬物分析などを行う際には、使用が禁止されている化合物を測定対象化合物とし、上記方法で測定対象化合物の含有の有無を調べることで試料のスクリーニングを実施する。測定対象化合物の出現予測時間範囲に有意なピークが存在するか否かの判断は、まず、その出現予測時間範囲において、予め設定した検出条件を満たすピークを自動的に検出し、次いで、その検出されたピークが有意なものであるか否かを判定する、という手順で行われる。 In such GC / MS or LC / MS, in order to examine the presence or absence of a certain measurement target compound in a sample, pay attention to the mass chromatogram of the mass-to-charge ratio derived from the measurement target compound, and predict the appearance of the measurement target compound. Whether or not there is a significant peak in the time range is confirmed. For example, when pesticide analysis, drug analysis, or the like is performed, a compound whose use is prohibited is used as a measurement target compound, and a sample is screened by examining the presence or absence of the measurement target compound by the above method. In order to determine whether or not a significant peak exists in the predicted appearance time range of the measurement target compound, first, a peak that satisfies a preset detection condition is automatically detected in the predicted appearance time range, and then the detection is performed. It is performed by the procedure of determining whether or not the peak obtained is significant.
或るピークが有意であるか否かの判定は、通常、ピークのSN比の結果に基づいて行われる。例えば、計算されたピークのSN比が予め設定された閾値以上であればそのピークは有意であると判断し、そのピークに対応した測定対象化合物が含まれていると結論付ける。一方、計算されたピークのSN比が閾値未満であればそのピークは測定対象化合物由来のピークではなく、ノイズ等に起因する無意味なピークであると判断する(例えば特許文献1など)。 Whether or not a certain peak is significant is usually determined based on the result of the SN ratio of the peak. For example, if the SN ratio of the calculated peak is equal to or greater than a preset threshold value, the peak is determined to be significant, and it is concluded that the measurement target compound corresponding to the peak is included. On the other hand, if the calculated SN ratio of the peak is less than the threshold, it is determined that the peak is not a peak derived from the measurement target compound but a meaningless peak due to noise or the like (for example, Patent Document 1).
従来のデータ処理では、上記のようにピークのSN比を計算するときの信号値(S)としては検出されたピークのピークトップの強度値が用いられ、ノイズ値(N)は測定対象化合物の出現予測時間範囲の中でピーク区間(ピーク開始点からピーク終了点までの間)を除いた全ての測定点の値を使用して計算される。ところが、そのノイズ値を計算するノイズ区間に、ピーク検出されなかった夾雑成分が存在すると、その夾雑成分の影響がノイズ値に現れる。そのため、ノイズ値が真値よりも大きい値になってしまい、結果的にピークのSN比が見かけ上悪くなって、測定対象化合物が含まれているにも拘わらず含まれていないと誤った判定を下す場合がある。 In the conventional data processing, the intensity value of the peak top of the detected peak is used as the signal value (S) when calculating the SN ratio of the peak as described above, and the noise value (N) is the value of the measurement target compound. It is calculated using the values of all measurement points excluding the peak interval (between the peak start point and the peak end point) in the appearance prediction time range. However, if there is a noise component for which no peak is detected in the noise interval for calculating the noise value, the influence of the noise component appears in the noise value. Therefore, the noise value becomes a value larger than the true value, and as a result, the SN ratio of the peak is apparently deteriorated, and it is erroneously determined that it is not included even though the measurement target compound is included. May be dropped.
そのため、従来、こうした問題を回避するために、オペレータが処理対象のクロマトグラムを表示画面上で確認し、測定対象化合物の出現予測時間範囲の中で夾雑成分の影響が見られない部分を見い出し、該測定対象化合物の含有の有無を判定するためのノイズ値を計算する時間範囲として手動で設定するようにしている。しかしながら、従来のこうしたピークSN比評価方法では次のような問題がある。
(1)農薬分析や薬物分析では測定対象化合物が数百にも及ぶことがあり、そうした場合に、それら1つ1つについてオペレータがクロマトグラムを確認してノイズ時間範囲を設定するのは大きな負担である。また、作業効率が悪く、スループットも低い。
(2)ノイズ時間範囲の設定の仕方はオペレータによって異なるため、複数のオペレータが処理した結果は必ずしも同一になるとは限らない。特にオペレータの経験や技量によって大きな差異が生じることがあり、スクリーニングの精度低下の一因となる。
Therefore, conventionally, in order to avoid such a problem, the operator confirms the chromatogram to be processed on the display screen, and finds a portion where the influence of the contaminating component is not seen in the predicted appearance time range of the measurement target compound, The noise value for determining whether or not the measurement target compound is contained is manually set as a time range for calculating the noise value. However, the conventional peak SNR evaluation method has the following problems.
(1) There are hundreds of compounds to be measured in pesticide analysis and drug analysis. In such cases, it is a heavy burden for the operator to check the chromatogram and set the noise time range for each of them. It is. In addition, work efficiency is poor and throughput is low.
(2) Since the method of setting the noise time range differs depending on the operator, the results processed by a plurality of operators are not necessarily the same. In particular, large differences may occur depending on the experience and skill of the operator, which contributes to a decrease in screening accuracy.
本発明は上記課題を解決するために成されたものであり、その目的とするところは、多数の測定対象化合物の含有の有無を、高い精度で克つ効率的に判定することができるクロマトグラフ用データ処理装置を提供することにある。 The present invention has been made to solve the above-mentioned problems, and the object of the present invention is for a chromatograph capable of efficiently determining the presence or absence of a large number of measurement target compounds with high accuracy. It is to provide a data processing apparatus.
上記課題を解決するためになされた本発明は、クロマトグラフ分析又はクロマトグラフ質量分析により得られたクロマトグラムデータを処理するクロマトグラフ用データ処理装置において、
a)クロマトグラム上で目的化合物に対応するピーク検出を行い、検出されたピークの強度を信号値として求める信号値算出手段と、
b)前記目的化合物に対して設定された探索時間範囲内で、該時間範囲よりも狭い時間幅であるノイズ時間幅を該ノイズ時間幅よりも狭い時間幅ずつ時間方向にずらしつつ、前記ノイズ時間幅に含まれるクロマトグラムデータを用いてノイズ値を計算するという処理を繰り返すことにより、その探索時間範囲における最小のノイズ値を求めるノイズ値算出手段と、
c)前記信号値算出手段により得られた信号値と前記ノイズ値算出手段により得られたノイズ値とから、目的化合物に対するピークのSN比を計算するピークSN比算出手段と、
を備え、前記ピークSN比算出手段により算出されたSN比に基づいて、そのピークに対応した目的化合物の含有の有無を判断するようにしたことを特徴としている。
In order to solve the above problems, the present invention provides a chromatographic data processing apparatus for processing chromatogram data obtained by chromatographic analysis or chromatographic mass spectrometry.
a) signal value calculating means for detecting a peak corresponding to the target compound on the chromatogram and obtaining the intensity of the detected peak as a signal value;
b) within the search time range set for the target compound, while shifting the noise time width, which is a time width narrower than the time range, in the time direction by a time width narrower than the noise time width , Noise value calculating means for obtaining the minimum noise value in the search time range by repeating the process of calculating the noise value using the chromatogram data included in the width;
c) Peak SN ratio calculating means for calculating the SN ratio of the peak for the target compound from the signal value obtained by the signal value calculating means and the noise value obtained by the noise value calculating means;
And the presence or absence of the target compound corresponding to the peak is determined based on the S / N ratio calculated by the peak S / N ratio calculating means.
ここでいうクロマトグラムとは、クロマトグラフ分析で取得される通常のクロマトグラムのほか、クロマトグラフ質量分析により取得されるトータルイオンクロマトグラム、マスクロマトグラムを含む。また、クロマトグラフはガスクロマトグラフ、液体クロマトグラフのいずれも含む。 The chromatogram here includes, in addition to a normal chromatogram obtained by chromatographic analysis, a total ion chromatogram and mass chromatogram obtained by chromatographic mass analysis. The chromatograph includes both a gas chromatograph and a liquid chromatograph.
本発明に係るクロマトグラフ用データ処理装置では、好ましくは、前記探索時間範囲と前記ノイズ時間幅との少なくとも一方をオペレータが入力設定するためのパラメータ設定手段、をさらに備える構成とするとよい。 The chromatographic data processing apparatus according to the present invention is preferably configured to further include parameter setting means for an operator to input and set at least one of the search time range and the noise time width.
本発明に係るクロマトグラフ用データ処理装置において、信号値算出手段は、目的化合物のピークの予測保持時間に対して所定のマージンを見込んで設定される時間範囲においてピーク検出を実行し、ピークが見い出されたならば、そのピークトップの強度を信号値として取得する。ピーク検出は従来の周知の方法を用いればよく、所定のピーク検出条件の下でピークが見い出せない場合には、その目的化合物が含まれないと判断できる。 In the chromatographic data processing apparatus according to the present invention, the signal value calculation means performs peak detection in a time range set with a predetermined margin for the predicted retention time of the peak of the target compound, and a peak is found. If so, the intensity of the peak top is obtained as a signal value. A conventional well-known method may be used for peak detection, and when a peak cannot be found under predetermined peak detection conditions, it can be determined that the target compound is not included.
ノイズ値算出手段は、その目的化合物について、例えば上記のようにパラメータ設定手段を介して設定された探索時間範囲内で、ノイズ時間幅を該ノイズ時間幅よりも狭い時間幅ずつ時間方向にずらしつつ、そのノイズ時間幅に含まれるクロマトグラムデータを用いてノイズ値を計算する。このとき、信号値算出手段によりピーク検出がなされた区間、つまりそのピークの開始点から終了点までの間の区間についてはノイズ値計算から除外してもよいが、あえて除外しなくても問題ない。ノイズ値の計算方法も特に限定されず、例えば、そのノイズ時間幅内の信号の最大強度と最小強度との差を求める方法、そのノイズ時間幅内の信号値の標準偏差を求める方法、などがある。ノイズの種類(原因)によってノイズ計算方法を変更したほうがよい場合もあるから、予め用意された複数のノイズ計算方法の中からオペレータが適宜の方法を選択できるようにしてもよい。
The noise value calculation means shifts the noise time width of the target compound in the time direction by a time width narrower than the noise time width within the search time range set via the parameter setting means as described above, for example. The noise value is calculated using the chromatogram data included in the noise time width. At this time, the section in which the peak is detected by the signal value calculation means, that is, the section from the start point to the end point of the peak may be excluded from the noise value calculation, but it does not matter if it is not excluded. . The calculation method of the noise value is not particularly limited, for example, a method for obtaining the difference between the maximum intensity and the minimum intensity of the signal within the noise time width, a method for obtaining the standard deviation of the signal value within the noise time width, and the like. is there. Since it may be better to change the noise calculation method depending on the type (cause) of the noise, the operator may select an appropriate method from a plurality of noise calculation methods prepared in advance.
ノイズ値が小さいほど、夾雑成分の影響を受けていない信号領域であると推測できる。そこでノイズ値算出手段は、探索時間範囲内でノイズ時間幅の位置をずらす毎に算出されたノイズ値の中で最小のものをその探索時間範囲におけるノイズ値とする。SN比算出手段は、上記信号値算出手段により得られたピークの信号値と上記ノイズ値算出手段により得られたノイズ値(つまり、その探索時間範囲内の最小のノイズ値)とからピークのSN比を計算する。例えばこうして算出されたSN比の値が表示部などに出力され、オペレータはその値を確認し、例えばSN比が所定の閾値以上である場合にそのピークに対応した目的化合物が含有されていると判断する。 It can be estimated that the smaller the noise value is, the signal region is not affected by the contamination component. Therefore, the noise value calculation means sets the smallest noise value calculated every time the position of the noise time width is shifted within the search time range as the noise value in the search time range. The S / N ratio calculating means calculates the SN of the peak from the peak signal value obtained by the signal value calculating means and the noise value obtained by the noise value calculating means (that is, the minimum noise value within the search time range). Calculate the ratio. For example, the value of the SN ratio calculated in this way is output to a display unit or the like, and the operator confirms the value. For example, when the SN ratio is equal to or higher than a predetermined threshold, the target compound corresponding to the peak is contained. to decide.
また、そうした判断をオペレータが下さずに、前記ピークSN比算出手段により算出されたSN比に基づいて、そのピークに対応した目的化合物の含有の有無を判断する含有判定手段を備え、自動的に目的化合物の有無が判断されるようにしてもよい。 Further, the content determination means for determining whether or not the target compound corresponding to the peak is contained is automatically provided based on the SN ratio calculated by the peak SN ratio calculation means without the operator making such a determination. The presence or absence of the target compound may be determined.
多数の目的化合物の含有の有無をそれぞれ調べる(スクリーニングする)場合には、各化合物について、上記の信号値算出手段、ノイズ値算出手段、及び、ピークSN比算出手段による処理を繰り返せばよい。また、マスクロマトグラムデータを処理対象とする場合には、必要に応じて適宜、異なる質量電荷比のマスクロマトグラムについて同様の処理を繰り返せばよい。 In the case of examining (screening) the presence or absence of a large number of target compounds, the processing by the signal value calculation means, noise value calculation means, and peak SN ratio calculation means may be repeated for each compound. In addition, when mass chromatogram data is a processing target, the same processing may be repeated for mass chromatograms having different mass-to-charge ratios as necessary.
なお、目的化合物のピークを検出する時間範囲と最小のノイズ値を探索する探索時間範囲とは同一でもよいが、必ずしも同一である必要はない。 The time range for detecting the peak of the target compound and the search time range for searching for the minimum noise value may be the same, but are not necessarily the same.
本発明に係るクロマトグラフ用データ処理装置によれば、各目的化合物について探索時間範囲とノイズ時間幅とが与えられさえすれば、その条件の下で、夾雑成分の影響を受けていないと推測されるノイズ算出区間が自動的に選択され、その区間に含まれるクロマトグラムデータに基づくノイズ値を利用したピークのSN比が計算される。したがって、オペレータ自らがクロマトグラムを確認して、ノイズ値算出のために夾雑成分の影響のない区間を抽出するような面倒な作業は不要になり、オペレータの負担が軽減されるとともに作業効率の改善によりスループットが向上する。また、ノイズ算出区間の設定がオペレータの判断に依存しないので、目的化合物の含有の有無の判断のばらつきがなくなり、常に同じ基準で正確な判断が可能となる。特に、残留農薬スクリーニングや禁止薬物スクリーニングなど、膨大な数の化合物の含有の有無を調べる必要がある場合でも、作業時間を大幅に短縮化し、且つ、そのスクリーニングの精度を向上させることができる。 According to the chromatographic data processing apparatus of the present invention, as long as a search time range and a noise time width are given for each target compound, it is presumed that under the conditions, the target compound is not affected by a contaminant component. The noise calculation interval is automatically selected, and the SN ratio of the peak using the noise value based on the chromatogram data included in the interval is calculated. Therefore, the operator himself / herself confirms the chromatogram, and the troublesome work of extracting the section free from the influence of the contaminating components for the calculation of the noise value becomes unnecessary, reducing the burden on the operator and improving the work efficiency. Throughput is improved. In addition, since the setting of the noise calculation section does not depend on the operator's judgment, there is no variation in the judgment as to whether or not the target compound is contained, and accurate judgment can always be made based on the same standard. In particular, even when it is necessary to examine the presence or absence of a huge number of compounds, such as residual agricultural chemical screening and prohibited drug screening, the working time can be greatly shortened and the screening accuracy can be improved.
以下、本発明に係るクロマトグラフ用データ処理装置について一例を挙げて詳細に説明する。図1は本発明に係るクロマトグラフ用データ処理装置を適用したGC/MSの一実施例の全体構成図である。 Hereinafter, the chromatograph data processing apparatus according to the present invention will be described in detail with an example. FIG. 1 is an overall configuration diagram of an embodiment of GC / MS to which a chromatographic data processing apparatus according to the present invention is applied.
このGC/MSは、試料に対して分析を実行してデータを収集するために、GC部1とMS部5とを備える。GC部1において、ヘリウム等のキャリアガスが一定流量で試料気化室3を経てカラム4に供給される。所定のタイミングでインジェクタ2から試料気化室3に微量の試料液が注入されると、該試料液は短時間で気化し、キャリアガス流に乗ってカラム4に導入される。そして、カラム4を通過する間に、試料に含まれる各種成分は分離され、時間的にずれてカラム4出口から流出する。カラム4から流出する試料ガスはMS部5においてイオン源6に導入され、試料ガス中成分分子は例えば電子イオン化法や化学イオン化法などによりイオン化される。発生したイオンは四重極質量フィルタ等の質量分離器7に導入され、質量分離器7によりイオンは質量電荷比m/zに応じて分離されて検出器8に到達する。例えば質量分離器7が四重極質量フィルタである場合には、四重極質量フィルタへの印加電圧を所定範囲で繰り返し走査することで、検出器8に到達するイオンの質量電荷比が走査される。
The GC / MS includes a
検出器8は到達したイオンの量に応じた検出信号を出力し、検出信号はA/D変換器9でデジタルデータに変換されてデータ処理部10に入力される。データ処理部10は、クロマトグラム作成部11、ピークSN比計算部12、化合物含有判定部13、化合物含有判定パラメータ記憶部14、などを機能ブロックとして含む。データ処理部10は制御部15と接続され、入力部18から入力された化合物含有判定パラメータが制御部15を介して化合物含有判定パラメータ記憶部14に格納され、また制御部15を介してクロマトグラムや化合物含有判定部13の判定結果などが表示部17の画面上に表示される。図示しないが、制御部15はGC部1及びMS部5の動作を制御する。
The
なお、データ処理部10及び制御部15の実体はパーソナルコンピュータであり、そのコンピュータに予めインストールされた専用の制御・処理ソフトウエアを実行することにより、それぞれの機能を実現するものとすることができる。
The entity of the
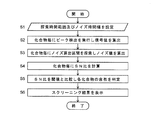
本実施例のGC/MSでは、多数の測定対象化合物が含まれる可能性がある試料を分析し、その分析により収集されるデータ(クロマトグラムデータ)を用いて各測定対象化合物の含有の有無を調べるスクリーニング(例えば残留農薬スクリーニング)が実行される。図2はそのスクリーニング処理の手順を示すフローチャート、図3は図2中のステップS3の処理の詳細フローチャート、図4は最適ノイズ算出区間探索のためのパラメータの一例を示す図、図5は最適ノイズ算出区間探索の動作を説明するための模式図である。以下、これら図を用いて、本実施例のGC/MSに特徴的な測定対象化合物スクリーニング処理について説明する。 In the GC / MS of this example, a sample that may contain a large number of measurement target compounds is analyzed, and the presence or absence of each measurement target compound is determined using data (chromatogram data) collected by the analysis. Screening (eg residual pesticide screening) is performed. FIG. 2 is a flowchart showing the procedure of the screening process, FIG. 3 is a detailed flowchart of the process of step S3 in FIG. 2, FIG. 4 is a diagram showing an example of parameters for searching the optimum noise calculation section, and FIG. It is a schematic diagram for demonstrating the operation | movement of a calculation area search. Hereinafter, the measurement target compound screening process characteristic of the GC / MS of this example will be described with reference to these drawings.
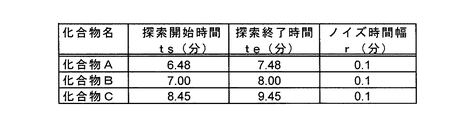
まず、オペレータは入力部18より、化合物含有判定パラメータとして少なくとも測定対象化合物毎に探索時間範囲とノイズ時間幅とを入力する(ステップS1)。入力された上記パラメータは、データ処理部10の化合物含有判定パラメータ記憶部14に保存される。図4に一例を示すように、探索時間範囲は探索開始時間と探索終了時間を一組としたものである。なお、同一種の測定対象化合物を対象とするスクリーニングでは、1回、上記のようなパラメータを設定すれば、そのパラメータを利用して多数の試料のスクリーニングを実施することができる。また、オペレータが入力することなく、予めデータベースに登録された値などを用いるようにしてもよい。
First, the operator inputs a search time range and a noise time width at least for each measurement target compound as compound content determination parameters from the input unit 18 (step S1). The input parameters are stored in the compound content determination
試料に対しGC/MS分析が実行されることでリアルタイムに収集されるデータ又は既に収集されて記憶部などに保存されているデータに対するスクリーニング処理が開始されると、データ処理部10においてクロマトグラム作成部11は、収集されたデータに基づいてクロマトグラム(特定の質量電荷比のマスクロマトグラム又はトータルイオンクロマトグラム)を作成する。ピークSN比計算部12はクロマトグラムに対し次の手順でピークSN比の計算を実行する。
When a screening process is started for data collected in real time by GC / MS analysis on a sample or data already collected and stored in a storage unit or the like, the
まず測定対象化合物毎に、予測保持時間を元に設定されるピーク検出時間範囲内でピーク検出を実行し、ピークが検出されたならばそのピークトップの強度値を求めてその測定対象化合物に対する信号値とする(ステップS2)。ピーク検出は従来から知られている方法(例えば特開2004−184148号公報の記載参照)を用いることができ、通常、ピークが検出されると、ピークの開始時刻、ピークトップの出現時刻、ピークの終了時刻が得られる。ピークの開始時刻から終了時刻までがピーク区間である。なお、ピーク検出時間範囲は上記の探索時間範囲と同一でもよいが、必ずしも同一である必要はない。このピーク検出処理により、例えば図4に示した化合物A、B、Cのそれぞれについてピークが検出され、それらピークのピークトップの強度値が信号値として求まる。 First, for each measurement target compound, peak detection is performed within the peak detection time range set based on the predicted retention time, and if a peak is detected, the peak top intensity value is obtained and the signal for that measurement target compound is obtained. A value is set (step S2). A conventionally known method can be used for peak detection (see, for example, the description of JP-A-2004-184148). Normally, when a peak is detected, the peak start time, peak top appearance time, peak The end time of is obtained. The peak period is from the start time to the end time of the peak. The peak detection time range may be the same as the search time range described above, but is not necessarily the same. By this peak detection process, for example, peaks are detected for each of the compounds A, B, and C shown in FIG. 4, and the peak top intensity values of these peaks are obtained as signal values.
次に、測定対象化合物毎に適切なノイズ算出区間を探索しノイズ値を求める(ステップS3)。図3により詳細に説明すると、ピークSN比計算部12は化合物含有判定パラメータ記憶部14から或る1つの測定対象化合物に対する探索時間範囲[ts,te]及びノイズ時間幅rを取得する(ステップS10)。例えば、化合物AのピークSN比を求める際には、探索時間範囲:[6.48(分),7.48(分)]、ノイズ時間幅:0.1(分)が取得される。次に、その探索開始時間tsを変数Xに設定し、X〜X+rの区間、つまりts〜ts+rのノイズ算出区間に含まれる測定点(クロマトグラムデータ)を取得する(ステップS11、S12)。但し、X〜X+rのノイズ算出区間にピーク区間が重なる場合には、このノイズ算出区間は処理から除外する(ステップS13)。
Next, an appropriate noise calculation section is searched for each measurement target compound to obtain a noise value (step S3). Describing in more detail with reference to FIG. 3, the peak SN
最初の上記ステップS11〜S13の処理により、図5中に[1]で示すノイズ算出区間が設定され、その区間内のクロマトグラムデータが収集される。続いて、この収集されたデータからそのノイズ算出区間におけるノイズ値を計算する(ステップS14)。ノイズ値の算出方法は特に限定されず、例えば任意に設定された区間における信号強度の最大値と最小値との差(つまりピークtoピーク値)を求める方法、任意に設定された区間における信号強度の標準偏差(つまり実効値)を求める方法、などが代表的なものである。 As a result of the first steps S11 to S13, a noise calculation section indicated by [1] in FIG. 5 is set, and chromatogram data in that section is collected. Subsequently, a noise value in the noise calculation section is calculated from the collected data (step S14). The noise value calculation method is not particularly limited. For example, a method for obtaining a difference between a maximum value and a minimum value of a signal intensity in an arbitrarily set interval (that is, a peak-to-peak value), and a signal intensity in an arbitrarily set interval A typical method is to obtain a standard deviation (that is, an effective value).
次に、算出されたノイズ値がその探索時間範囲においてこれまでに得られたノイズ値の中で最小であるか否かを判定し(ステップS15)、最小であればそのときのノイズ算出区間X〜X+rを暫定ノイズ算出区間として内部メモリに一時的に記憶する(ステップS16)。一方、ステップS15においてそのときのノイズ値が最小でなければステップS16をパスしてステップS17へ進む。この場合、内部メモリの暫定ノイズ算出区間は更新されない。そして、変数Xをインクリメントする(ステップS17)。ここでいうインクリメントは、探索開始時間ts直後の測定点から順に1測定点ずつ、時間的に後方にずらすことを意味する。そして、X+rが探索終了時間teを超えているか否かを判定し(ステップS18)、超えていなければステップS12に戻って上記処理を繰り返す。 Next, it is determined whether or not the calculated noise value is the minimum among the noise values obtained so far in the search time range (step S15), and if it is the minimum, the noise calculation section X at that time is determined. ~ X + r are temporarily stored in the internal memory as a provisional noise calculation section (step S16). On the other hand, if the noise value at that time is not minimum in step S15, step S16 is passed and the process proceeds to step S17. In this case, the provisional noise calculation section of the internal memory is not updated. Then, the variable X is incremented (step S17). The increment here means that the measurement point is shifted backward by one measurement point in order from the measurement point immediately after the search start time ts. Then, it is determined whether or not X + r exceeds the search end time te (step S18). If not, the process returns to step S12 and the above process is repeated.
即ち、図5中に[1]で示すノイズ算出区間のノイズ値が算出されると、次に[2]で示すノイズ算出区間のノイズ値が算出される。こうして1測定点ずつノイズ値を計算する時間幅rのノイズ算出区間がずらされ、各ノイズ算出区間におけるノイズ値が計算されて最小値を与えるノイズ算出区間が暫定ノイズ算出区間としてメモリに残される。上述したようにピークが検出された区間はノイズではないので除外されるが、計算上は、あえて除外する処理を行わなくても、みかけ上ノイズ値が大きくなるので、結果的にはこのピーク区間は除外されることになる。 That is, when the noise value in the noise calculation section indicated by [1] in FIG. 5 is calculated, the noise value in the noise calculation section indicated by [2] is then calculated. In this way, the noise calculation interval of the time width r for calculating the noise value for each measurement point is shifted, and the noise value in each noise calculation interval is calculated and the noise calculation interval giving the minimum value is left in the memory as the provisional noise calculation interval. As described above, the section in which the peak is detected is excluded because it is not noise. However, in the calculation, the noise value apparently increases without performing the process of excluding it. Will be excluded.
ステップS18でX+rが探索終了時間teを超えていると判定されると、探索時間範囲内で時間幅rの区間を設定できなくなるから、ステップS19に進み、その時点でメモリに格納されている暫定ノイズ算出区間を正式なノイズ算出区間と決定し、その区間に対するノイズ値を取得する。これにより、1つの測定対象化合物に対する適切なノイズ値が求まる。 If it is determined in step S18 that X + r has exceeded the search end time te, the interval of the time width r cannot be set within the search time range, so the process proceeds to step S19, and the provisional stored in the memory at that point in time. The noise calculation interval is determined as the formal noise calculation interval, and the noise value for that interval is acquired. Thereby, an appropriate noise value for one measurement target compound is obtained.
複数の測定対象化合物のノイズ値を求める場合には、測定対象化合物毎に図3に示した処理を実行することでそれぞれノイズ値を計算する。このようなノイズ値を計算するための最適なノイズ算出区間の探索とノイズ値の決定とは、オペレータによる操作や判断に依ることなく、自動的に遂行される。 When obtaining the noise values of a plurality of measurement target compounds, the noise values are calculated by executing the processing shown in FIG. 3 for each measurement target compound. The search for the optimum noise calculation section and the determination of the noise value for calculating the noise value are automatically performed without depending on the operation or judgment by the operator.
図2に戻ると、各測定対象化合物の信号値とノイズ値とが求まったならば、測定対象化合物毎に信号値とノイズ値とからSN比を計算する(ステップS4)。これにより、図6に一例を示すように、化合物毎に、ノイズ値、信号値、SN比が求まる。次に、化合物含有判定部13は化合物毎に、算出されたSN比を閾値と比較し、SN比が閾値以上である場合にステップS2で検出されたピークが有意であり、その測定対象化合物が試料に含まれていると判断する。一方、SN比が閾値未満であればステップS2で検出されたピークは例えば夾雑成分などに由来するノイズであり、その測定対象化合物が試料に含まれていないと判断する(ステップS5)。ここでピークの有意性を判断する基準となる閾値は、例えば化合物含有判定パラメータの1つとして予めオペレータが設定しておくことが可能である。また化合物毎に閾値を変えることも可能である。
Returning to FIG. 2, when the signal value and the noise value of each measurement target compound are obtained, the SN ratio is calculated from the signal value and the noise value for each measurement target compound (step S4). Thereby, as an example is shown in FIG. 6, a noise value, a signal value, and an SN ratio are obtained for each compound. Next, the compound
このようにして試料中に含まれる可能性のある測定対象化合物が、実際に含まれるか否かが自動的に判断された結果は、例えば一覧表などの形式で表示部17(又は図示しない印刷出力部)から出力される。それによって、オペレータ自らはクロマトグラムを確認して夾雑成分の影響を受けない区間を見つけるといった面倒な操作を行うことなく、多数の測定対象化合物のスクリーニング結果を得ることができる。 The result of automatically determining whether or not the measurement target compound that may be contained in the sample is actually contained in this way is displayed in the display unit 17 (or a print (not shown) in the form of a list, for example. Output from the output unit). Thereby, the operator himself / herself can obtain screening results for a large number of compounds to be measured without performing a troublesome operation of confirming the chromatogram and finding a section that is not affected by the contaminating components.
上記説明では、SN比を求めた後に該SN比に基づく化合物の含有の有無の判定まで自動で行うようにしていたが、例えば図6に示したような各化合物のSN比の計算結果を表示部17や印刷出力部から出力し、オペレータがそれを見て各測定対象化合物の含有の有無を判断するようにしてもよい。即ち、図1に示した構成で、データ処理部10が化合物含有判定部13を有しておらず、その機能をオペレータ自身が行うようにしてもよい。
In the above description, the calculation of the SN ratio of each compound as shown in, for example, FIG. It may be output from the
また、上記実施例では異なる質量電荷比のマスクロマトグラムを考慮していなかったが、例えば1乃至複数の測定対象化合物毎に異なる質量電荷比のマスクロマトグラムを対象として同様の処理を実行するようにしてもよい。特に数百にも及ぶ多数の化合物の一斉分析を行う際には、このような手法が採用されることが多い。 Moreover, although the mass chromatograms having different mass-to-charge ratios are not considered in the above-described embodiments, for example, the same processing is performed on mass chromatograms having different mass-to-charge ratios for each of one or more measurement target compounds. It may be. In particular, such a technique is often employed when performing simultaneous analysis of a large number of compounds, which may be several hundred.
また、上記実施例では本発明に係るデータ処理装置をGC/MSに適用していたが、LC/MSでもよく、また、検出器が質量分析計ではない、GCやLCにも本発明を適用できることは明らかである。 In the above embodiment, the data processing apparatus according to the present invention is applied to GC / MS. However, the data processing apparatus may be LC / MS, and the present invention is also applied to GC and LC in which the detector is not a mass spectrometer. Obviously we can do it.
また、上記実施例は本発明の一例であり、本願発明の趣旨の範囲で適宜変形、修正、追加を行っても本願特許請求の範囲に包含されることは明らかである。 Moreover, the said Example is an example of this invention, and even if it changes suitably, amends, and is added in the range of the meaning of this invention, it is clear that it is included in the claim of this application.
1…GC部
2…インジェクタ
3…試料気化室
4…カラム
5…MS部
6…イオン源
7…質量分離器
8…検出器
9…A/D変換器
10…データ処理部
11…クロマトグラム作成部
12…ピークSN比計算部
13…化合物含有判定部
14…化合物含有判定パラメータ記憶部
15…制御部
17…表示部
18…入力部
DESCRIPTION OF
Claims (2)
a)クロマトグラム上で目的化合物に対応するピーク検出を行い、検出されたピークの強度を信号値として求める信号値算出手段と、
b)前記目的化合物に対して設定された探索時間範囲内で、該時間範囲よりも狭い時間幅であるノイズ時間幅を該ノイズ時間幅よりも狭い時間幅ずつ時間方向にずらしつつ、前記ノイズ時間幅に含まれるクロマトグラムデータを用いてノイズ値を計算するという処理を繰り返すことにより、その探索時間範囲における最小のノイズ値を求めるノイズ値算出手段と、
c)前記信号値算出手段により得られた信号値と前記ノイズ値算出手段により得られたノイズ値とから、目的化合物に対するピークのSN比を計算するピークSN比算出手段と、
を備え、前記ピークSN比算出手段により算出されたSN比に基づいて、そのピークに対応した目的化合物の含有の有無を判断するようにしたことを特徴とするクロマトグラフ用データ処理装置。
In a chromatographic data processing apparatus for processing chromatogram data obtained by chromatographic analysis or chromatographic mass spectrometry,
a) signal value calculating means for detecting a peak corresponding to the target compound on the chromatogram and obtaining the intensity of the detected peak as a signal value;
b) within the search time range set for the target compound, while shifting the noise time width, which is a time width narrower than the time range, in the time direction by a time width narrower than the noise time width , Noise value calculating means for obtaining the minimum noise value in the search time range by repeating the process of calculating the noise value using the chromatogram data included in the width;
c) Peak SN ratio calculating means for calculating the SN ratio of the peak for the target compound from the signal value obtained by the signal value calculating means and the noise value obtained by the noise value calculating means;
A chromatograph data processing apparatus characterized in that, based on the S / N ratio calculated by the peak S / N ratio calculating means, the presence or absence of a target compound corresponding to the peak is determined.
前記探索時間範囲と前記ノイズ時間幅との少なくとも一方をオペレータが入力設定するためのパラメータ設定手段、をさらに備えることを特徴とするクロマトグラフ用データ処理装置。 The chromatographic data processing apparatus according to claim 1,
A chromatograph data processing apparatus, further comprising parameter setting means for an operator to input and set at least one of the search time range and the noise time width.
Priority Applications (1)
| Application Number | Priority Date | Filing Date | Title |
|---|---|---|---|
| JP2009208273A JP5333089B2 (en) | 2009-09-09 | 2009-09-09 | Chromatographic data processor |
Applications Claiming Priority (1)
| Application Number | Priority Date | Filing Date | Title |
|---|---|---|---|
| JP2009208273A JP5333089B2 (en) | 2009-09-09 | 2009-09-09 | Chromatographic data processor |
Publications (3)
| Publication Number | Publication Date |
|---|---|
| JP2011058930A JP2011058930A (en) | 2011-03-24 |
| JP2011058930A5 JP2011058930A5 (en) | 2012-01-19 |
| JP5333089B2 true JP5333089B2 (en) | 2013-11-06 |
Family
ID=43946740
Family Applications (1)
| Application Number | Title | Priority Date | Filing Date |
|---|---|---|---|
| JP2009208273A Active JP5333089B2 (en) | 2009-09-09 | 2009-09-09 | Chromatographic data processor |
Country Status (1)
| Country | Link |
|---|---|
| JP (1) | JP5333089B2 (en) |
Families Citing this family (8)
| Publication number | Priority date | Publication date | Assignee | Title |
|---|---|---|---|---|
| US10386346B2 (en) * | 2011-09-05 | 2019-08-20 | Shimadzu Corporation | System and method for processing chromatogram data |
| US9117638B2 (en) | 2011-12-30 | 2015-08-25 | Dh Technologies Development Pte. Ltd. | Intelligent background data acquisition and subtraction |
| DE102017112612A1 (en) | 2016-06-10 | 2017-12-14 | Hitachi High-Tech Science Corporation | A liquid chromatograph and method for correcting variations in a detector output of the liquid chromatograph |
| JP7012989B2 (en) * | 2016-06-10 | 2022-01-31 | 株式会社日立ハイテクサイエンス | Liquid chromatograph and detector output value fluctuation correction means for liquid chromatograph |
| WO2020100182A1 (en) * | 2018-11-12 | 2020-05-22 | 株式会社島津製作所 | Chromatography device |
| WO2021261202A1 (en) * | 2020-06-23 | 2021-12-30 | 株式会社島津製作所 | Data generation method and device, and discriminator generation method and device |
| CN114609319B (en) * | 2022-02-14 | 2023-08-22 | 天津国科医疗科技发展有限公司 | Spectral peak identification method and system based on noise estimation |
| CN116046968A (en) * | 2023-03-02 | 2023-05-02 | 北京澳诺科技有限公司 | Liquid chromatography workstation data processing method, system and storable medium |
Family Cites Families (4)
| Publication number | Priority date | Publication date | Assignee | Title |
|---|---|---|---|---|
| JPH0954072A (en) * | 1995-08-17 | 1997-02-25 | Shimadzu Corp | Chromatograph data processing device |
| JPH1021373A (en) * | 1996-07-05 | 1998-01-23 | Fuji Photo Film Co Ltd | Picture analyzing device |
| JP3574010B2 (en) * | 1999-07-23 | 2004-10-06 | 昭和電工株式会社 | Differential refractive index detector and liquid chromatograph apparatus having the same |
| JP4470505B2 (en) * | 2004-02-04 | 2010-06-02 | 株式会社島津製作所 | Data processing equipment for chromatographic mass spectrometry |
-
2009
- 2009-09-09 JP JP2009208273A patent/JP5333089B2/en active Active
Also Published As
| Publication number | Publication date |
|---|---|
| JP2011058930A (en) | 2011-03-24 |
Similar Documents
| Publication | Publication Date | Title |
|---|---|---|
| JP5333089B2 (en) | Chromatographic data processor | |
| JP4973628B2 (en) | Chromatograph mass spectrometry data analysis method and apparatus | |
| JP4614002B2 (en) | Data processing equipment for chromatographic mass spectrometry | |
| JP3805979B2 (en) | Mass spectrometry method and apparatus | |
| JP5482912B2 (en) | Chromatograph mass spectrometer | |
| JP2011033346A (en) | Method and device for analyzing chromatograph mass spectrometry data | |
| JPWO2008053530A1 (en) | Quantitative measurement method | |
| US7619212B2 (en) | Chromatographic analyzer | |
| WO2018087824A1 (en) | Data analysis apparatus for chromatography mass spectrometry | |
| JP5757264B2 (en) | Chromatographic mass spectrometry data processor | |
| CN113227778A (en) | Chromatograph mass analysis device | |
| JPH10142196A (en) | Mass analyzing method and device | |
| JP2004251830A (en) | Mass spectrometer data processor and data processing method | |
| JP4470505B2 (en) | Data processing equipment for chromatographic mass spectrometry | |
| JP2017161442A (en) | Chromatograph mass analysis data processing device | |
| JP4470811B2 (en) | Chromatographic analyzer | |
| US11841351B2 (en) | Sample analysis apparatus | |
| JP4057664B2 (en) | Data processing device for chromatograph / mass spectrometer | |
| JP7334788B2 (en) | WAVEFORM ANALYSIS METHOD AND WAVEFORM ANALYSIS DEVICE | |
| JP3663140B2 (en) | Mass spectrometry method and mass spectrometer | |
| JP6226823B2 (en) | Chromatograph mass spectrometer and control method thereof | |
| JP5747839B2 (en) | Data processing equipment for chromatographic mass spectrometry | |
| JP7056767B2 (en) | Substance identification method using chromatograph | |
| JP7088306B2 (en) | Chromatograph device | |
| JP2012163475A (en) | Content determination method in gas chromatography |
Legal Events
| Date | Code | Title | Description |
|---|---|---|---|
| A521 | Written amendment |
Free format text: JAPANESE INTERMEDIATE CODE: A523 Effective date: 20111128 |
|
| A621 | Written request for application examination |
Free format text: JAPANESE INTERMEDIATE CODE: A621 Effective date: 20111128 |
|
| A977 | Report on retrieval |
Free format text: JAPANESE INTERMEDIATE CODE: A971007 Effective date: 20121129 |
|
| A131 | Notification of reasons for refusal |
Free format text: JAPANESE INTERMEDIATE CODE: A131 Effective date: 20130402 |
|
| A521 | Written amendment |
Free format text: JAPANESE INTERMEDIATE CODE: A523 Effective date: 20130528 |
|
| TRDD | Decision of grant or rejection written | ||
| A01 | Written decision to grant a patent or to grant a registration (utility model) |
Free format text: JAPANESE INTERMEDIATE CODE: A01 Effective date: 20130702 |
|
| A61 | First payment of annual fees (during grant procedure) |
Free format text: JAPANESE INTERMEDIATE CODE: A61 Effective date: 20130715 |
|
| R151 | Written notification of patent or utility model registration |
Ref document number: 5333089 Country of ref document: JP Free format text: JAPANESE INTERMEDIATE CODE: R151 |