JP4388553B2 - Generate a color conversion profile for printing - Google Patents
Generate a color conversion profile for printing Download PDFInfo
- Publication number
- JP4388553B2 JP4388553B2 JP2006539127A JP2006539127A JP4388553B2 JP 4388553 B2 JP4388553 B2 JP 4388553B2 JP 2006539127 A JP2006539127 A JP 2006539127A JP 2006539127 A JP2006539127 A JP 2006539127A JP 4388553 B2 JP4388553 B2 JP 4388553B2
- Authority
- JP
- Japan
- Prior art keywords
- color
- ink amount
- sample
- evaluation index
- amount data
- Prior art date
- Legal status (The legal status is an assumption and is not a legal conclusion. Google has not performed a legal analysis and makes no representation as to the accuracy of the status listed.)
- Active
Links
- 238000007639 printing Methods 0.000 title claims description 60
- 238000006243 chemical reaction Methods 0.000 title claims description 55
- 239000000976 ink Substances 0.000 claims description 410
- 238000011156 evaluation Methods 0.000 claims description 147
- 238000000034 method Methods 0.000 claims description 130
- 230000003595 spectral effect Effects 0.000 claims description 116
- 239000013598 vector Substances 0.000 claims description 84
- 238000012545 processing Methods 0.000 claims description 60
- 238000004364 calculation method Methods 0.000 claims description 58
- 230000008569 process Effects 0.000 claims description 55
- 230000015572 biosynthetic process Effects 0.000 claims description 32
- 238000013441 quality evaluation Methods 0.000 claims description 30
- 238000004088 simulation Methods 0.000 claims description 22
- 238000012937 correction Methods 0.000 claims description 17
- 238000009826 distribution Methods 0.000 claims description 9
- 230000001419 dependent effect Effects 0.000 claims description 7
- 238000005259 measurement Methods 0.000 claims description 4
- 208000031509 superficial epidermolytic ichthyosis Diseases 0.000 description 54
- 239000003086 colorant Substances 0.000 description 43
- 238000009499 grossing Methods 0.000 description 31
- 238000005457 optimization Methods 0.000 description 26
- 238000010586 diagram Methods 0.000 description 24
- 230000014509 gene expression Effects 0.000 description 15
- 238000012986 modification Methods 0.000 description 15
- 230000004048 modification Effects 0.000 description 15
- 230000032823 cell division Effects 0.000 description 13
- 238000013507 mapping Methods 0.000 description 12
- 238000001228 spectrum Methods 0.000 description 12
- 230000000052 comparative effect Effects 0.000 description 10
- 230000006978 adaptation Effects 0.000 description 8
- 230000008859 change Effects 0.000 description 8
- 238000005286 illumination Methods 0.000 description 8
- 230000002457 bidirectional effect Effects 0.000 description 6
- 238000003384 imaging method Methods 0.000 description 6
- 230000007423 decrease Effects 0.000 description 5
- 239000000463 material Substances 0.000 description 5
- 230000035945 sensitivity Effects 0.000 description 5
- 230000000007 visual effect Effects 0.000 description 5
- 238000004737 colorimetric analysis Methods 0.000 description 4
- 230000010354 integration Effects 0.000 description 4
- 239000011159 matrix material Substances 0.000 description 4
- 238000010606 normalization Methods 0.000 description 4
- 238000010422 painting Methods 0.000 description 4
- 230000011218 segmentation Effects 0.000 description 4
- 238000004422 calculation algorithm Methods 0.000 description 3
- 230000001413 cellular effect Effects 0.000 description 3
- 238000012512 characterization method Methods 0.000 description 3
- 238000004590 computer program Methods 0.000 description 3
- 241000282412 Homo Species 0.000 description 2
- 238000013459 approach Methods 0.000 description 2
- 230000008901 benefit Effects 0.000 description 2
- 230000000740 bleeding effect Effects 0.000 description 2
- 238000005516 engineering process Methods 0.000 description 2
- 238000002474 experimental method Methods 0.000 description 2
- 230000002349 favourable effect Effects 0.000 description 2
- 230000001788 irregular Effects 0.000 description 2
- 238000012804 iterative process Methods 0.000 description 2
- 230000003252 repetitive effect Effects 0.000 description 2
- 239000007787 solid Substances 0.000 description 2
- VYZAMTAEIAYCRO-UHFFFAOYSA-N Chromium Chemical compound [Cr] VYZAMTAEIAYCRO-UHFFFAOYSA-N 0.000 description 1
- 238000007796 conventional method Methods 0.000 description 1
- 230000003247 decreasing effect Effects 0.000 description 1
- 238000001914 filtration Methods 0.000 description 1
- 230000012447 hatching Effects 0.000 description 1
- 238000009877 rendering Methods 0.000 description 1
- 230000002441 reversible effect Effects 0.000 description 1
- 238000010187 selection method Methods 0.000 description 1
- 238000000926 separation method Methods 0.000 description 1
- 230000009466 transformation Effects 0.000 description 1
Images


Classifications
-
- H—ELECTRICITY
- H04—ELECTRIC COMMUNICATION TECHNIQUE
- H04N—PICTORIAL COMMUNICATION, e.g. TELEVISION
- H04N1/00—Scanning, transmission or reproduction of documents or the like, e.g. facsimile transmission; Details thereof
- H04N1/46—Colour picture communication systems
- H04N1/56—Processing of colour picture signals
- H04N1/60—Colour correction or control
- H04N1/603—Colour correction or control controlled by characteristics of the picture signal generator or the picture reproducer
- H04N1/6033—Colour correction or control controlled by characteristics of the picture signal generator or the picture reproducer using test pattern analysis
Landscapes
- Engineering & Computer Science (AREA)
- Multimedia (AREA)
- Signal Processing (AREA)
- Facsimile Image Signal Circuits (AREA)
- Color Image Communication Systems (AREA)
- Color, Gradation (AREA)
- Investigating Or Analysing Materials By Optical Means (AREA)
- Image Processing (AREA)
Description
この発明は、印刷に用いられる色変換プロファイルの生成技術に関する。 The present invention relates to a technique for generating a color conversion profile used for printing.
近年、カラープリンタとしてインクジェットプリンタやレーザプリンタなどが普及してきている。カラープリンタでは、入力カラー画像データを複数種類のインクの量に変換する色変換ルックアップテーブルが用いられる。従来の色変換ルックアップテーブルの作成方法では、(i) 多数のカラーパッチを印刷し、(ii) 各カラーパッチを測色して測色値を求め、(iii) 各カラーパッチの測色値と各カラーパッチの印刷に使用されたインク量との対応関係を表すルックアップテーブルを作成していた。 In recent years, inkjet printers, laser printers, and the like have become widespread as color printers. The color printer uses a color conversion lookup table that converts input color image data into a plurality of types of ink amounts. In the conventional method of creating a color conversion lookup table, (i) a number of color patches are printed, (ii) each color patch is measured to determine a colorimetric value, and (iii) each color patch colorimetric value is measured. And a look-up table showing the correspondence between the ink amount used for printing each color patch.
しかし、測色値は、測色時の観察条件(viewing condition)に依存する。従って、ある観察条件で好ましい色再現を有する印刷物が得られるように色変換ルックアップテーブルを作成したとしても、その色変換ルックアップテーブルを用いて作成された印刷物が他の観察条件では好ましい色再現を達成できない場合がある。そこで、従来から、種々の観察条件で好ましい色再現を達成できる色変換ルックアップテーブルを作成することが望まれていた。また、例えば絵画の複製を作るために、原画の色の見えをなるべく忠実に再現することのできる色変換ルックアップテーブルを作成したいという要望もあった。 However, the colorimetric value depends on the viewing condition during colorimetry. Therefore, even if a color conversion lookup table is created so that a printed material having a preferable color reproduction under certain viewing conditions can be obtained, the printed material created using the color conversion lookup table is preferable under other viewing conditions. May not be achieved. Therefore, conventionally, it has been desired to create a color conversion lookup table that can achieve preferable color reproduction under various viewing conditions. There has also been a desire to create a color conversion lookup table that can reproduce the color appearance of the original picture as faithfully as possible, for example, in order to make a reproduction of a painting.
さらに、色変換ルックアップテーブルを用いて作成された印刷物の画質は、当該色変換ルックアップテーブルに規定された測色値とインク量に大きく依存している。実用上は、種々の観察条件で好ましい色再現を達成すると同時に高画質の印刷物を得られるように色変換ルックアップテーブルを作成する必要がある。そこで、上述のように種々の観察条件で好ましい色再現を達成すると同時に高画質の印刷を実施可能な色変換ルックアップテーブルを作成することが望まれていた。これらの要望は、色変換ルックアップテーブルに限らず、一般に、色変換に使用される各種のプロファイルに共通する要望であった。 Furthermore, the image quality of a printed matter created using the color conversion lookup table largely depends on the colorimetric value and the ink amount specified in the color conversion lookup table. In practice, it is necessary to create a color conversion look-up table so that high-quality printed matter can be obtained while at the same time achieving favorable color reproduction under various viewing conditions. Therefore, as described above, it has been desired to create a color conversion lookup table that achieves preferable color reproduction under various viewing conditions and can perform high-quality printing. These requests are not limited to the color conversion look-up table, and are generally requests common to various profiles used for color conversion.
従って、本発明は、種々の観察条件で好ましい色再現を達成できる色変換プロファイルを作成する。本発明は、また、原画の色の見えをなるべく忠実に再現することのできる色変換プロファイルを作成する。さらに、本発明は、高画質の印刷を実施することが可能な色変換プロファイルを作成する。例えば、観察者に粒状性を感じさせにくく、滑らかに階調が変化し、階調変化のダイナミックレンジが大きな印刷物を得ることが可能な色変換プロファイルを作成する。 Therefore, the present invention creates a color conversion profile that can achieve favorable color reproduction under various viewing conditions. The present invention also creates a color conversion profile that can reproduce the color appearance of the original image as faithfully as possible. Furthermore, the present invention creates a color conversion profile that enables high-quality printing. For example, a color conversion profile is created that makes it difficult for an observer to feel graininess, allows a gradation to change smoothly, and provides a printed matter with a large dynamic range of gradation change.
プリンタで使用可能な複数のインクのインク量セットを表すインク量データと、測色値との対応関係を規定するプロファイルを作成する方法は、(a)インク量データを、前記インク量データに従って印刷されるカラーパッチの分光反射率に変換するように構成された分光プリンティングモデルコンバータを準備する工程と、(b)複数のインクのインク量セットをそれぞれ表す複数のサンプルインク量データを準備する工程と、(c)前記分光プリンティングモデルコンバータを用いて、各サンプルインク量データを、前記サンプルインク量データによって表されるインク量で印刷されるべき仮想サンプルパッチの分光反射率に変換する工程と、(d)各サンプルインク量データについて評価指数を算出する工程であって、前記評価指数は、前記分光反射率から算出されるサンプル色と比較の基礎として選択された比較色との間の色差を表す色差評価指数と、前記サンプルインク量データに従って印刷されるべき仮想サンプルパッチの画質を示す画質評価指数とを含む、工程と、(e)前記評価指数に基づいて、複数のサンプルインク量データを選択する工程と、(f)前記選択された複数のサンプルインク量データに基づいて、測色値とインク量データとの対応関係を規定するプロファイルとして、前記サンプルインク量データを用いて印刷されるカラーパッチの測色値と前記サンプルインク量データとの対応関係を示すルックアップテーブルを作成する工程と、を備える。前記画質評価指数は、前記サンプルインク量データに従って印刷されるべき仮想サンプルカラーパッチの粒状性を示す粒状性指数を含む。 A method for creating a profile that defines the correspondence between ink amount data representing a plurality of ink amount sets that can be used in a printer and colorimetric values is as follows: (a) printing ink amount data according to the ink amount data Preparing a spectral printing model converter configured to convert the spectral reflectance of the color patch to be converted, and (b) preparing a plurality of sample ink amount data respectively representing an ink amount set of a plurality of inks; (C) using the spectral printing model converter, converting each sample ink amount data into a spectral reflectance of a virtual sample patch to be printed with an ink amount represented by the sample ink amount data; d) a step of calculating an evaluation index for each sample ink amount data, wherein the evaluation index is A color difference evaluation index representing the color difference between the spectral selected reference color as a basis for comparison sample color and calculated from the reflectance image quality indicating the quality of a virtual sample patch to be printed according to the sample ink amount data and a rating index and step, based on the (e) the evaluation index, the steps of selecting a plurality of sample ink amount data, based on a plurality of sample ink amount data that is the selected (f), colorimetry As a profile that defines the correspondence between the value and the ink amount data , a lookup table is created that indicates the correspondence between the colorimetric value of the color patch printed using the sample ink amount data and the sample ink amount data. A process. The image quality evaluation index includes a graininess index indicating the graininess of a virtual sample color patch to be printed according to the sample ink amount data .
この方法によれば、適切な色差評価指数を設定することによって、種々の観察条件で好ましい色再現を達成できる色変換プロファイルや、原画の色の見えをなるべく忠実に再現することのできる色変換プロファイルを作成することができる。また、画質評価指数を算出することにより、印刷物の画質を客観的に評価することが可能になり、上述の色再現を達成すると同時に高画質の印刷を実行可能な色変換プロファイルを作成することができる。さらに、上述のステップ(f)において、格子点配置の平滑程度を示す平滑程度評価指数を定義し、高評価のサンプルを用いて色変換プロファイルを作成することにより、滑らかに階調が変化する印刷物を得ることが可能な色変換プロファイルを作成することができる。 According to this method, by setting an appropriate color difference evaluation index, a color conversion profile that can achieve preferable color reproduction under various viewing conditions and a color conversion profile that can reproduce the color appearance of the original image as faithfully as possible. Can be created. Also, by calculating the image quality evaluation index, it is possible to objectively evaluate the image quality of the printed matter, and it is possible to create a color conversion profile that can execute high-quality printing while achieving the above-described color reproduction. it can. Furthermore, in the above step (f), a smoothness evaluation index indicating the smoothness of the grid point arrangement is defined, and a color conversion profile is created using a highly evaluated sample, whereby the printed matter whose gradation changes smoothly. Can be created.
なお、色差評価指数としては、非色恒常性指数(Color Inconstancy Index)を含むものや、メタメリズム指数(Metamerism Index)を含むものなどを利用することができる。非色恒常性指数を含む評価指数を用いたときには、種々の観察条件で好ましい色再現を達成できる色変換プロファイルを作成することができる。 As the color difference evaluation index, one including a non-color constancy index (Color Inconstancy Index) or one including a Metamerism Index (Metamerism Index) can be used. When an evaluation index including a non-color constancy index is used, a color conversion profile that can achieve preferable color reproduction under various viewing conditions can be created.
また、画質評価指数としては、粒状性を評価する指数、格子点配置の平滑程度を評価する指数、色域の大きさを評価する指数、インク量を評価する指数等を採用することができる。粒状性を評価する指数を使用すれば、観察者に粒状性を感じさせにくくすることができる。粒状性指数としては、仮想的なパッチにおけるドットの記録状態をシミュレートし、シミュレート結果の空間周波数を評価する指数を含むものを利用することができる。この指数によれば、印刷物におけるドットの粒状性やノイズを定量化することが可能になり、実際の印刷を行わなくても粒状性を評価することが可能になる。さらに、ドットの記録状態をシミュレートするに際して、ドットの形状や誤差に起因する位置の変動、制御法の差異によって生じる形状,位置の変動を考慮することにより、非常に正確にドットの記録状態をシミュレートすることが可能になる。 As the image quality evaluation index, an index for evaluating graininess, an index for evaluating the degree of smoothness of the grid point arrangement, an index for evaluating the size of the color gamut, an index for evaluating the ink amount, and the like can be used. If an index for evaluating the graininess is used, it is possible to make it difficult for the observer to feel the graininess. As the graininess index, an index including an index for simulating a dot recording state in a virtual patch and evaluating a spatial frequency of a simulation result can be used. According to this index, it becomes possible to quantify the graininess and noise of dots in the printed matter, and it is possible to evaluate the graininess without performing actual printing. Furthermore, when simulating the dot recording state, the dot recording state can be very accurately determined by taking into account the position variation caused by the dot shape and error, and the shape and position variation caused by differences in control methods. It becomes possible to simulate.
また、平滑程度評価指数としては、サンプルの色に相当する格子点について所定の色空間内でその配置の平滑程度を評価する指数を採用可能である。このように所定の色空間内でサンプルの色に相当する格子点の配置が平滑化すれば、色変換プロファイルによる変換精度を向上し、トーンジャンプの発生を抑えることができる。すなわち、色変換プロファイルの作成時および作成後の色変換時には補間演算を使用するが、一般に、各色空間で整然と並んでいる格子点の方がその間に位置する色を補間演算によって算出する際に空間の局所的位置によって補間精度を大きく変動させることなく補間を行うことができる。従って、本発明によって格子点配置を平滑化することで、色変換プロファイルの作成時および作成後の色変換時に高精度に補間演算を実施することが可能になる。この結果、トーンジャンプの発生を抑え、滑らかに階調が変化する印刷物を得ることが可能な色変換プロファイルを作成することが可能になる。また、格子点の配置を平滑化する際に、色域の大きさを維持する束縛条件を使いながら平滑化を行うことで、大きな色域を確保することができる。この結果、豊かな階調の印刷物を得ることが可能になる。 As the smoothness degree evaluation index, an index for evaluating the degree of smoothness of the arrangement of the lattice points corresponding to the color of the sample in a predetermined color space can be employed. If the arrangement of the grid points corresponding to the sample colors in the predetermined color space is smoothed in this way, the conversion accuracy by the color conversion profile can be improved and the occurrence of tone jump can be suppressed. That is, interpolation calculation is used at the time of creating a color conversion profile and at the time of color conversion after creation, but in general, a grid point that is regularly arranged in each color space has a space when calculating colors located between them by interpolation calculation. The interpolation can be performed without greatly changing the interpolation accuracy depending on the local position. Therefore, by smoothing the grid point arrangement according to the present invention, it becomes possible to perform interpolation calculation with high accuracy at the time of color conversion profile creation and color conversion after creation. As a result, it is possible to create a color conversion profile that can suppress the occurrence of tone jumps and obtain a printed matter that smoothly changes in gradation. Further, when smoothing the arrangement of grid points, a large color gamut can be ensured by performing smoothing while using a constraint condition that maintains the size of the color gamut. As a result, it is possible to obtain a printed material with rich gradation.
なお、本発明は、種々の形態で実現することが可能であり、例えば、プロファイル作成方法およびプロファイル作成装置、それらの方法または装置の機能を実現するためのコンピュータプログラム、そのコンピュータプログラムを記録した記録媒体、そのコンピュータプログラムを含み搬送波内に具現化されたデータ信号、等の形態で実現することができる。 The present invention can be realized in various forms. For example, a profile creation method and a profile creation apparatus, a computer program for realizing the functions of the method or the apparatus, and a recording in which the computer program is recorded It can be realized in the form of a medium, a data signal including the computer program and embodied in a carrier wave, and the like.
次に、本発明の実施の形態を以下の順序で説明する。
A.第1実施形態
B.第2実施形態
C.第3実施形態
D.第4実施形態
E.第5実施形態
F.分光プリンティングモデルの一例
G.変形例
Next, embodiments of the present invention will be described in the following order.
A. First Embodiment B. Second Embodiment C. Third Embodiment D. Fourth Embodiment E. First Embodiment Fifth Embodiment An example of a spectral printing model Modified example
A.第1実施形態:
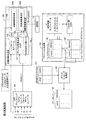
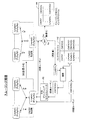
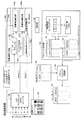
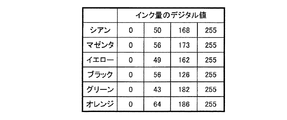
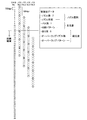
図1は、本発明の第1実施形態としてのプロファイル作成システムの構成を示すブロック図である。このシステムは、分光プリンティングモデルコンバータ100と、評価指数生成部120と、選択部130と、プロファイル生成部140と、ガマットマッピング処理部160とを備えている。むろん、このシステム構成は一例であり、他の種々の形態を採用可能である。分光プリンティングモデルコンバータ100は、インク量データを、そのインク量データに応じて印刷されるカラーパッチの分光反射率Rsmp(λ)に変換する。なお、本明細書において「カラーパッチ」とは、有彩色のパッチに限らず、無彩色のパッチも含む広い意味を有している。この実施形態では、シアン(C)、マゼンタ(M)、イエロー(Y)、ブラック(K)、オレンジ(O)、および、グリーン(G)の6色のインクを利用可能なカラープリンタを想定しており、分光プリンティングモデルコンバータ100もこの6種類のインクの吐出量を入力としている。一実施例では、これらの入力値はCMYKOG各色のインクの吐出量を256階調で示す階調値である。分光プリンティングモデルについては、F節で詳述する。以下では、「分光プリンティングモデル」を「フォワードモデル」とも呼ぶ。
A. First embodiment:
FIG. 1 is a block diagram showing the configuration of a profile creation system as a first embodiment of the present invention. This system includes a spectral
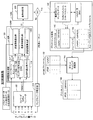
評価指数生成部120は、サンプル色算出部122と、比較色算出部124と、評価指数算出部126とハーフトーン処理部128とを含んでいる。当該評価指数生成部120の構成は一例であり、他にも種々の構成を採用可能である。評価指数算出部126は、画質評価指数算出部1260と色差評価指数算出部1262とを含んでいる。当該評価指数生成部126の構成は一例であり、他にも種々の構成を採用可能である。サンプル色算出部122は、サンプルインク量データに対する分光反射率Rsmp(λ)を用いて、第1の観察条件における測色値CV1を算出する。本実施形態では、第1の観察条件として標準の光D50を用いる。この第1の観察条件で得られた測色値CV1で表される色を「サンプル色」とも呼ぶ。比較色算出部124は、サンプルインク量データに対する分光反射率Rsmp(λ)を用いて、第2の観察条件における測色値CV2を算出する。本実施形態では、第2の観察条件として標準の光F11を用いる。以下では、第2の観察条件で得られた測色値CV2で表される色を「比較色」とも呼ぶ。
The evaluation
上述の説明から理解できるように、第1実施形態において、サンプル色算出部122と比較色算出部124は、同じ分光反射率Rsmp(λ)を用いて異なる観察条件における測色値CV1,CV2をそれぞれ算出する。色差評価指数算出部1262は、これらの測色値CV1,CV2を用いて、サンプルインク量データによる出力色を異なる観察条件で観察した場合の色の色差を表す色差評価指数CDI(Color Difference Index)を算出する。
As can be understood from the above description, in the first embodiment, the sample
ハーフトーン処理部128は、上記分光プリンティングモデルコンバータ100に対して入力するCMYKOGの階調値を取得してハーフトーン処理を実施するモジュールである。本実施例では、各画素の色を256より少ない階調(例えば2階調)で表現したハーフトーンデータを色毎に生成する。このハーフトーン処理に際しては、所定の面積の一様な色の仮想パッチを印刷できるようなハーフトーンデータを生成する。すなわち、上記階調値の画素がドットマトリクス状に並んでいる状態を想定してハーフトーン処理を実施する。
The
なお、ハーフトーン処理部128においては各種アルゴリズムを採用可能であるが、本実施形態によって作成するプリンタルックアップテーブル180を使用するプリンタで採用されているアルゴリズムと同じアルゴリズムを採用する。また、ハーフトーンデータの階調は2階調に限られず、4階調など種々の階調数を採用可能である。画質評価指数算出部1260は、これら色毎のハーフトーンデータを用いて、プリンタによる実際の印刷を経ることなくドットの記録状態をシミュレートする。また、このシミュレート結果を用いて、この記録状態における印刷物の画質を評価する画質評価指数IQI(Image Quality Index)を算出する。
Various algorithms can be employed in the
評価指数算出部126は、上述の色差評価指数CDIと画質評価指数IQIとを用いて、サンプルインク量データの良否を判定するための評価指数EI1を算出する。評価指数EI1の具体例については後述する。
The evaluation
選択部130は、良好な評価指数EI1を有するサンプルインク量データを選択する。プロファイル生成部140は、選択されたサンプルインク量データと、それらのサンプルインク量データを用いて印刷されるカラーパッチの測色値(L*a*b*値)とを用いて、インクプロファイル142を作成する。このインクプロファイル142は、測色値(L*a*b*値)とCMYKOGのインク量との対応関係を示すルックアップテーブルである。なお、「インクプロファイル」を「出力デバイスプロファイル」とも呼ぶ。本明細書において、「プロファイル」とは、色空間の変換を行うための変換規則を具現化したものを意味しており、各種のデバイスプロファイルとルックアップテーブルとを含む広い意味を有している。
The
ガマットマッピング処理部160は、このインクプロファイル142と、予め準備されたsRGBプロファイル162とを用いて、プリンタルックアップテーブル180を作成する。ここで、sRGBプロファイル162としては、例えばsRGB色空間をL*a*b*色空間に変換するプロファイルを使用することができる。なお、「sRGBプロファイル」を「入力デバイスプロファイル」とも呼ぶ。プリンタルックアップテーブル180は、入力カラー画像データ(例えばsRGBデータ)をインク量データに変換するためのものである。
The gamut
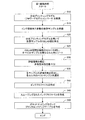
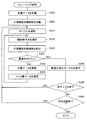
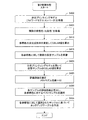
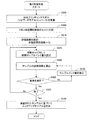
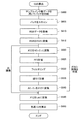
図2は、第1実施形態の処理手順を示すフローチャートである。ステップS10では、分光プリンティングモデルを決定して、コンバータ100を作成する。一実施例では、分光プリンティングモデルとしてセル分割ユール・ニールセン分光ノイゲバウアモデル(Cellular Yule-Nielsen Spectral Neugebauer Model)を使用する。その詳細についはF節で説明する。
FIG. 2 is a flowchart illustrating a processing procedure according to the first embodiment. In step S10, a spectral printing model is determined and the
ステップS15では、多数の仮想サンプルを設定する。ここで、「仮想サンプル」とは、プロファイルの作成処理において使用される仮のインク量データ、および、そのインク量データに応じて印刷される仮想的なカラーパッチを意味している。なお、以下では、仮想サンプルを単に「サンプル」とも呼ぶ。一実施例では、CMYKOGの各インクに関して、0〜100%の範囲で10%おきに11点のインク量をそれぞれ設定し、6種類のインクの量のすべての組合せを仮想サンプル(サンプルインク量データ)として準備した。この結果、116=1,771,561個の仮想サンプルが準備された。なお、「インク量100%」とは、1種類のインクでベタ打ちとなるインク量を意味する。 In step S15, a large number of virtual samples are set. Here, the “virtual sample” means provisional ink amount data used in profile creation processing and a virtual color patch printed according to the ink amount data. Hereinafter, the virtual sample is also simply referred to as “sample”. In one embodiment, for each ink of CMYKOG, 11 points of ink amounts are set every 10% in the range of 0 to 100%, and all combinations of six types of ink amounts are set as virtual samples (sample ink amount data). ) Prepared as. As a result, 11 6 = 1,771,561 virtual samples were prepared. Note that “100% ink amount” means an ink amount that is solid with one type of ink.
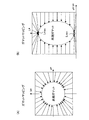
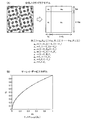
ステップS20では、分光プリンティングモデルコンバータ100を用いて各仮想サンプルのサンプルインク量データを分光反射率Rsmp(λ)に変換し、この分光反射率Rsmp(λ)からCIELAB表色系の測色値L*a*b*を算出する。一実施例では、CIE標準の光D50、および、CIE1931 2°観測者の観察条件で測色値を算出した。以下では、仮想サンプルを特定の観察条件で観察したときの色を「サンプル色」と呼ぶ。図3(A)〜3(C)は、一実施例で算出されたサンプル色の分布を示している。図3(A)の横軸はCIELAB表色系のa*軸であり、縦軸はb*軸である。図3(B),(C)の横軸はa*軸およびb*であり、縦軸はL*軸である。これから理解できるように、116個のサンプル色は、明度L*の低いところに集中しており、明度L*の高いところではまばらに分布している。サンプル色をより均一に分布させるためには、サンプルインク量を、比較的低いインク量の範囲ではより細かい間隔で設定し、比較的高いインク量の範囲ではより粗い間隔で設定するようにしてもよい。
In step S20, the sample ink amount data of each virtual sample is converted into the spectral reflectance Rsmp (λ) using the spectral
ステップS25では、測色値の色空間(ここではCIELAB空間)を複数のセルに分割し、複数のサンプル色をセルに関してソート(分類)する。一実施例では、CIELAB空間を16×16×16個のセルに均等に分割した。なお、このとき複数のサンプルと上記コンバータ100によって変換される前の仮想サンプルとを対応づけておく。
In step S25, the color space of the colorimetric values (here, CIELAB space) is divided into a plurality of cells, and the plurality of sample colors are sorted (classified) with respect to the cells. In one embodiment, the CIELAB space was evenly divided into 16 × 16 × 16 cells. At this time, a plurality of samples and a virtual sample before being converted by the
ステップS30では、好ましいサンプルの選択に使用する評価指数EI1を設定する。第1実施形態で使用される評価指数EI1は、以下の(1)式で表される。 In step S30, an evaluation index EI 1 used to select a preferred sample is set. The evaluation index EI 1 used in the first embodiment is expressed by the following equation (1).
![]()
![]()
CIIは、例えば以下の式で表現される。 CII is expressed by the following formula, for example.

ここで、ΔL* 、ΔC*ab 、ΔH*ab はそれぞれ、CV1とCV2についての明度差、彩度差、色相差を示している。CIIを算出する上で、CIELAB空間のCV1,CV2は図4に示す色順応変換(CAT)によって共通の観察条件下、例えば、D65光源下での値に変換される。CIIについては、Billmeyer and Saltzman's Principles of Color Technology, 3rd edition, John Wiley & Sons, Inc, 2000, p.129, p.213-215を参照。 Here, ΔL *, ΔC * ab , and ΔH * ab represent the lightness difference, saturation difference, and hue difference for CV1 and CV2, respectively. In calculating CII, CV1 and CV2 in CIELAB space are converted into values under common observation conditions, for example, under the D65 light source, by chromatic adaptation conversion (CAT) shown in FIG. For CII, see Billmeyer and Saltzman's Principles of Color Technology, 3rd edition, John Wiley & Sons, Inc, 2000, p.129, p.213-215.
なお、(2)式の右辺は、CIE1994年色差式において、明度と彩度の係数kL,kCの値を2に設定し、色相の係数kHの値を1に設定した色差ΔE*94(2:2)に相当する。CIE1994年色差式では、(2)式の右辺の分母の係数SL,Sc,SHは以下の(3)式で与えられる。 The right side of the equation (2) is the color difference ΔE * in the CIE 1994 color difference equation in which the values of the lightness and saturation coefficients k L and k C are set to 2 and the value of the hue coefficient k H is set to 1. It corresponds to 94 (2: 2) . CIE1994_nenshokusashikidewa, the coefficient of the denominator of the right-hand side of (2) S L, S c, S H is given by the following equation (3).
なお、CIIの算出に使用する色差式としては、他の式を用いることも可能である。 In addition, as a color difference formula used for calculation of CII, other formulas can also be used.
CIIは、あるカラーパッチを第1と第2の異なる観察条件下で観察したときの色の見えの差として定義されている。従って、CIIが小さいサンプルは、異なる観察条件での色の見えの差が小さいという点で好ましい。 CII is defined as the difference in color appearance when a color patch is observed under first and second different viewing conditions. Therefore, a sample having a small CII is preferable in that the difference in color appearance under different viewing conditions is small.
GIは、例えば以下の式で表現される。
![]()
![]()
GIについては、例えば、Makoto Fujino,Image Quality Evaluation of Inkjet Prints, Japan Hardcopy '99, p.291-294を参照。なお、(4)式のaLは明度補正項、WS(u)は画像のウイナースペクトラム、VTFは視覚の空間周波数特性、uは空間周波数である。(4)式では一次元で示しているが、空間周波数u,vの関数として二次元画像の空間周波数を算出することは容易である。 Regarding GI, see, for example, Makoto Fujino, Image Quality Evaluation of Inkjet Prints, Japan Hardcopy '99, p.291-294. In equation (4), a L is a brightness correction term, WS (u) is a winner spectrum of an image, VTF is a visual spatial frequency characteristic, and u is a spatial frequency. Although the expression (4) shows one dimension, it is easy to calculate the spatial frequency of the two-dimensional image as a function of the spatial frequencies u and v.
GIは、ある印刷物を観察者が視認したときに、その観察者が感じる粒状感(あるいはノイズの程度)であり、GIが小さい程、観察者が感じる粒状感は小さくなる。むろん、GIは画像を印刷したときの粒状性を評価する指数であればよく、他の式を用いることも可能である。 The GI is a graininess (or noise level) felt by an observer when an observer visually recognizes a certain printed matter. The smaller the GI, the smaller the graininess felt by the observer. Of course, GI may be an index for evaluating the graininess when an image is printed, and other formulas may be used.
図2のステップS35では、評価指数生成部120が、各サンプルに対する評価指数EI1を算出し、選択部130がこの評価指数EI1に応じてCIELAB色空間の各セル内で最良のサンプルを選択する。
In step S35 of FIG. 2, the evaluation
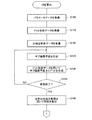
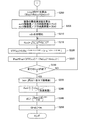
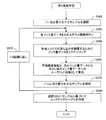
図4は、ステップS35の詳細手順を示すフローチャートである。ステップS55では、あるセル内の1つのサンプルを選択する。ステップS60では、分光プリンティングモデルコンバータ100を用いて、そのサンプルの分光反射率Rsmp(λ)を算出する。次のステップS62〜S66は評価指数生成部120のサンプル色算出部122(図1)によって実行され、ステップS68〜S72は比較色算出部124によって実行される。また、ステップS75はハーフトーン処理部128によって実行される。
FIG. 4 is a flowchart showing the detailed procedure of step S35. In step S55, one sample in a certain cell is selected. In step S60, using the spectral
サンプル色算出部122は、ステップS62において、分光反射率Rsmp(λ)を用いて第1の観察条件下で三刺激値XYZを算出する。一実施例では、CIE標準の光D50、および、CIE1931 2°観測者の観察条件で三刺激値XYZを算出した。本明細書において、「観察条件」とは照明光と観測者の組合せを意味しているが、特に言及しない限り観測者としてCIE1931 2°観測者を使用する。ステップS64では、この三刺激値XYZに色順応変換を適用して、標準観察条件での対応色を算出する。一実施例では、標準観察条件の光源として標準の光D65を用い、色順応変換としてCIECAT02を利用した。CIECAT02については、例えば"The CIECAM02 Color Appearance Model", Nathan Moroney et al., IS&T/SID Tenth Color Imaging Conference, pp.23-27, および、"The performance of CIECAM02", Changjun Li et al., IS&T/SID Tenth Color Imaging Conference, pp.28-31に記載されている。但し、色順応変換としては、フォン・クリースの色順応予測式などの他の任意の色順応変換を用いることも可能である。ステップS66では、この対応色のCIELAB表色系の測色値CV1=(L*a*b*)D50→D65を算出する。この下付き文字「D50→D65」は、標準の光D50の下での色の見えを、標準の光D65の対応色で表現した測色値であることを意味している。
In step S62, the sample
比較色算出部124も、第2の観察条件でサンプル色算出部122と同様の演算を実行する。すなわち、ステップS68において、分光反射率Rsmp(λ)を用いて第2の観察条件下で三刺激値XYZを算出する。一実施例では、CIE標準の光F11、および、CIE1931 2°観測者の観察条件で三刺激値XYZを算出した。ステップS70では、この三刺激値XYZに色順応変換を適用して、標準観察条件での対応色を算出する。そして、ステップS72では、この対応色のCIELAB表色系の測色値CV2=(L*a*b*)F11→D65を算出する。
The comparative
サンプル色の測色値CV1=(L*a*b*)D50→D65と、比較色の測色値CV2=(L*a*b*)F11→D65は、同一の標準観察条件におけるそれぞれの対応色の測色値なので、それらの色差ΔEであるCII(上記(2)式参照)は、サンプル色と比較色の色の見えの違いをかなり正確に表現する値となる。 Sample colorimetric value CV1 = (L * a * b *) D50 → D65 and comparative colorimetric value CV2 = (L * a * b *) F11 → D65 Since it is a colorimetric value of the corresponding color, the color difference ΔE CII (see the above equation (2)) is a value that expresses the difference in appearance between the sample color and the comparative color fairly accurately.
なお、標準観察条件は、標準の光D65に限らず、任意の照明光下での観察条件を採用することができる。例えば、標準の光D50を標準観察条件として採用した場合には、図4のステップS64は不要であり、また、ステップS70では標準の光D50に対する色順応変換が実行される。但し、CIELAB表色系を用いて算出される色差ΔEは、標準の光D65を用いたときに最も信頼性の高い値を示す。この点からは、標準観察条件として標準の光D65を用いることが好ましい。 Note that the standard observation conditions are not limited to the standard light D65, and observation conditions under any illumination light can be employed. For example, when the standard light D50 is adopted as the standard viewing condition, step S64 in FIG. 4 is not necessary, and chromatic adaptation conversion is performed on the standard light D50 in step S70. However, the color difference ΔE calculated using the CIELAB color system shows the most reliable value when the standard light D65 is used. From this point, it is preferable to use the standard light D65 as the standard observation condition.
ステップS75では、上述のステップS55で選択されたサンプルのインク量データを入力とし、このインク量データの画素を複数個集めて形成される仮想パッチについて色毎にハーフトーン処理を実行する。ステップS80では、色差評価指数算出部1262(図1)が上述の測色値CV1,CV2を用い、上記(2)式に従って非色恒常性指数CIIを算出する。また、画質評価指数算出部1260が上述のハーフトーンデータを用い、図5,図10に示すフローチャートに従ってGIを算出する。そして、上記(1)式に従って評価指数EI1を算出する。
In step S75, the ink amount data of the sample selected in step S55 described above is input, and halftone processing is executed for each color for a virtual patch formed by collecting a plurality of pixels of the ink amount data. In step S80, the color difference evaluation index calculation unit 1262 (FIG. 1) uses the above-described colorimetric values CV1 and CV2 to calculate the non-color constancy index CII according to the above equation (2). Further, the image quality evaluation
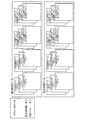
以下、GIを算出するための処理を詳説する。画質評価指数算出部1260は上記ハーフトーンデータに基づいてGIを算出するが、本実施形態においては当該ハーフトーンデータに基づいて、実際に印刷を実施することなくドットの記録状態をシミュレートすることによってGIを算出する。本実施形態ではシミュレートに必要なデータを用意し、ハーフトーンデータにおける画素より高分解能のサブ画素でサブ画素平面を形成し、当該サブ画素平面上でドットの記録状態をシミュレートする。
Hereinafter, the process for calculating GI will be described in detail. The image quality evaluation
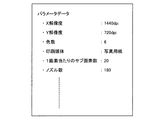
一実施例では、上記シミュレートに必要なデータとしてパラメータデータとドット形状データと分光反射率データとを用意する。パラメータデータは、シミュレート対象のプリンタで上述のプリンタルックアップテーブル180を利用して印刷を実施する際の条件を特定するデータである。すなわち、本実施形態によって作成されるプリンタルックアップテーブル180は、このプリンタにてこの条件で印刷を実行するときに参照されるので、図5のステップS100では、プリンタルックアップテーブル180を利用する所望の条件をパラメータデータとする。なお、ここで説明する実施例ではシミュレート対象のプリンタとして、キャリッジを主走査させ、紙送りローラによって副走査を行いながら、キャリッジに形成されたノズルからインクを吐出するプリンタを想定している。 In one embodiment, parameter data, dot shape data, and spectral reflectance data are prepared as data necessary for the simulation. The parameter data is data for specifying conditions for performing printing using the printer look-up table 180 described above with the printer to be simulated. That is, since the printer lookup table 180 created by the present embodiment is referred to when printing is performed under this condition with this printer, in step S100 of FIG. 5, the printer lookup table 180 is desired to be used. These conditions are used as parameter data. In the embodiment described here, it is assumed that the printer to be simulated is a printer that ejects ink from nozzles formed on the carriage while main-scanning the carriage and performing sub-scanning with a paper feed roller.
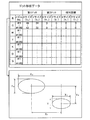
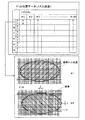
図6はパラメータデータの例を説明する説明図である。同図においては、パラメータデータに主走査方向の解像度(X解像度)と副走査方向の解像度(Y解像度)、インクの色数,印刷媒体の種類、”サブ画素数/画素”およびノズル数が含まれている。X解像度とY解像度は解像度をdpi等の単位で指定したデータであり、同図においてはそれぞれ1440dpi,720dpiである。なお、本明細書では主走査方向をX方向とし、副走査方向をY方向として定義する。インクの色数はプリンタに搭載されるインクの色数であり、本実施形態では上述のようにCMYKOGの6色である。むろん、インクの色自体を直接的に指定しても良い。印刷媒体は写真用紙など媒体の種類を示すデータである。すなわち、シミュレートする印刷媒体によってドットの記録状態が異なるので、シミュレートに必要なパラメータを定義する際に印刷媒体を区別し、印刷媒体と各パラメータとを対応づけて定義する。むろん、複数種類の媒体の使用を想定していないのであれば、当該印刷媒体を示すデータは必須ではない。 FIG. 6 is an explanatory diagram illustrating an example of parameter data. In the figure, the parameter data includes the resolution in the main scanning direction (X resolution) and the resolution in the sub-scanning direction (Y resolution), the number of ink colors, the type of print medium, “number of subpixels / pixel”, and the number of nozzles. It is. The X resolution and the Y resolution are data in which the resolution is specified in units such as dpi, and are 1440 dpi and 720 dpi in FIG. In this specification, the main scanning direction is defined as the X direction, and the sub scanning direction is defined as the Y direction. The number of colors of ink is the number of colors of ink mounted on the printer, and in this embodiment, there are six colors of CMYKOG as described above. Of course, the ink color itself may be specified directly. The print medium is data indicating the type of medium such as photographic paper. That is, since the dot recording state differs depending on the printing medium to be simulated, the printing medium is distinguished when defining the parameters necessary for the simulation, and the printing medium and each parameter are defined in association with each other. Of course, if the use of a plurality of types of media is not assumed, data indicating the print media is not essential.
サブ画素数/画素はハーフトーンデータにおける各画素をそれより小さなサブ画素に分割する際の分割数を示しており、図6においては各画素を縦横20個のサブ画素に分割することを示している。むろん、この分割数は利用者が印刷条件として指定しても良いし、20に限定されるわけではない。本明細書では、ハーフトーンデータにおけるドットマトリクスの各ドットを単に画素と呼び、これを分割して得られる各ドットをサブ画素と呼ぶ。ノズル数は、シミュレーション対象のプリンタに搭載されるキャリッジに形成されたノズルの副走査方向の数を示している。なお、パラメータデータには、以上の例以外にもGIを算出する際に必要な種々のデータを採用可能である。 The number of subpixels / pixel indicates the number of divisions when each pixel in the halftone data is divided into smaller subpixels. FIG. 6 shows that each pixel is divided into 20 vertical and horizontal subpixels. Yes. Of course, the number of divisions may be specified by the user as a printing condition, and is not limited to 20. In the present specification, each dot of the dot matrix in the halftone data is simply referred to as a pixel, and each dot obtained by dividing this is referred to as a sub-pixel. The number of nozzles indicates the number of nozzles formed in the carriage mounted on the simulation target printer in the sub-scanning direction. In addition to the above examples, various data necessary for calculating the GI can be used as the parameter data.
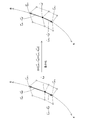
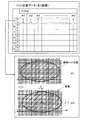
ステップS110では、ドット形状データを決定する。ドット形状データは印刷媒体上に記録されるドットをサブ画素平面上で再現するために、ドットの形状および大きさを特定するためのパラメータであり、各パラメータはノズル毎に決定する。図7はドット形状データの例を説明する説明図である。一実施例ではドットの形状が楕円形であると予め決められており、楕円の長径および短径によってその形状および大きさを特定するようにしてある。また、図7に示す例では、インク滴がノズルから印刷媒体に達するまでにインク滴が2つに分離する場合にも対応できるように第1ドットと第2ドットの大きさおよび両者の相対距離をパラメータとして特定できるようになっている。 In step S110, dot shape data is determined. The dot shape data is a parameter for specifying the shape and size of the dot in order to reproduce the dot recorded on the print medium on the sub-pixel plane, and each parameter is determined for each nozzle. FIG. 7 is an explanatory diagram illustrating an example of dot shape data. In one embodiment, the dot shape is predetermined to be elliptical, and the shape and size are specified by the major axis and minor axis of the ellipse. In the example shown in FIG. 7, the sizes of the first dot and the second dot and the relative distance between them are also applicable to the case where the ink droplet is separated into two before the ink droplet reaches the printing medium from the nozzle. Can be specified as a parameter.
すなわち、第1ドットの主走査方向サイズ(X0)および副走査方向サイズ(Y0)と第2ドットの主走査方向サイズ(X1)および副走査方向サイズ(Y1)を記述可能であり、さらに、第1ドットと第2ドットとの相対距離を主走査方向の距離(X2)と副走査方向の距離(Y2)で記述可能である。また、各データは、上述のパラメータデータに示される印刷媒体についてのデータであり、各ノズル毎,インクの色毎に用意する。 That is, the main scanning direction size (X 0 ) and sub-scanning direction size (Y 0 ) of the first dot and the main scanning direction size (X 1 ) and sub-scanning direction size (Y 1 ) of the second dot can be described. Furthermore, the relative distance between the first dot and the second dot can be described by the distance (X 2 ) in the main scanning direction and the distance (Y 2 ) in the sub scanning direction. Each data is data about the print medium indicated by the parameter data described above, and is prepared for each nozzle and each ink color.
図7の下部には各パラメータによって特定されるドットの形状を示している。第1ドットと第2ドットにおいては、ドット形状データによって指定される各走査方向のサイズを長径あるいは短径とした楕円を形成し、各ドットの形状とする。各ドットの相対距離は両者の中心からの距離として特定可能である。なお、ドット形状データは、シミュレーション対象のプリンタに搭載されるキャリッジに形成された各ノズルから実際にインクを吐出するとともに印刷媒体上の形状および大きさを計測することによって作成され、各パラメータの値はサブ画素単位で決められる。従って、サブ画素平面上で各走査方向のサイズを一義的に特定可能である。 The lower part of FIG. 7 shows the dot shape specified by each parameter. In the first dot and the second dot, an ellipse having a major axis or a minor axis in the scanning direction designated by the dot shape data is formed to form the shape of each dot. The relative distance of each dot can be specified as the distance from the center of both. The dot shape data is created by actually ejecting ink from each nozzle formed on the carriage mounted on the simulation target printer and measuring the shape and size on the print medium. Is determined in units of sub-pixels. Therefore, the size in each scanning direction can be uniquely specified on the sub-pixel plane.
図7に示す例では、Cインクについてノズル番号1にて形成される第1ドットの主走査方向サイズが46,副走査方向サイズが24である。また、第2ドットのサイズは主走査方向,副走査方向ともに”0”である。このため、相対距離も”0”である。この場合、インク滴が飛翔中に分離しないことを示しており、一回のインク滴の吐出によって第1ドットが一つ形成されることになる。
In the example shown in FIG. 7, the size of the first dot formed with
また、プリンタに備えられたキャリッジを主走査方向に移動させながらインク滴を吐出すると、インク滴は印刷媒体に対して主走査方向に相対速度を持ちながら飛翔し、印刷媒体上で主走査方向と長径とが略平行な楕円のドットを形成する。従って、ドット形状は一般的には図7の下部に示すように主走査方向が長径となった楕円であるが、むろん、長径方向が限定されることはないし、長径と短径を同じ値にすることによって円形のドットであるとしても良い。また、ドットの分離数を3以上にしても良いし、複数のサブ画素によって構成されるドット形状のパターン自体を示すデータを記録するようにしても良い。 Further, when ink droplets are ejected while moving the carriage provided in the printer in the main scanning direction, the ink droplets fly while having a relative speed in the main scanning direction with respect to the printing medium, and the main scanning direction on the printing medium. Ellipse dots whose major axis is substantially parallel are formed. Therefore, the dot shape is generally an ellipse having a major axis in the main scanning direction as shown in the lower part of FIG. 7, but, of course, the major axis direction is not limited, and the major axis and the minor axis are set to the same value. By doing so, it may be a circular dot. Further, the number of dot separations may be three or more, or data indicating a dot-shaped pattern itself composed of a plurality of sub-pixels may be recorded.
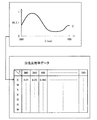
ステップS120では、分光反射率データを決定する。分光反射率データは印刷媒体上に記録したドットの反射率を複数の光の波長に対応づけて示すデータである。図8は分光反射率データの例を説明する説明図である。分光反射率はプリンタにて使用する各色のインクおよび印刷媒体に対してインクを記録しない状態(図8におけるW)について予め決められている。例えば、図8の上部には、Cインクの分光反射率(R(λ))を示しており、このような分光反射率を予め測定し、波長380nmから780nmまで10nm間隔で反射率を特定して分光反射率データとする。また、分光反射率データも上述のパラメータデータに示される印刷媒体に対応づけられるデータである。 In step S120, spectral reflectance data is determined. Spectral reflectance data is data indicating the reflectance of dots recorded on a print medium in association with wavelengths of a plurality of lights. FIG. 8 is an explanatory diagram for explaining an example of spectral reflectance data. The spectral reflectance is determined in advance for each color ink used in the printer and a state where ink is not recorded on the printing medium (W in FIG. 8). For example, the upper part of FIG. 8 shows the spectral reflectance (R (λ)) of C ink. Such spectral reflectance is measured in advance, and the reflectance is specified at intervals of 10 nm from a wavelength of 380 nm to 780 nm. Spectral reflectance data. The spectral reflectance data is also data associated with the print medium indicated by the parameter data described above.
本実施形態においては、この印刷媒体におけるインク量制限の最大値で所定の大きさのパッチを印刷し、所定の光源下で当該パッチを測定することによって分光反射率を取得する。すなわち、このようにして得られた分光反射率が各ドットを観察したときの分光反射率であるとしている。なお、このような分光反射率の取得法は一例であり、所定のインク記録率でパッチを印刷し、印刷媒体上のドットの面積とドットが記録されていない部分の面積との比率を利用して各色の分光反射率を算出してもよく、種々の構成を採用可能である。また、本発明においては、各サブ画素毎に色彩値(本実施形態では明度)を算出することができればよく、この意味では、分光反射率を示すデータを用意することが必須というわけではない。例えば、単色での色彩値および複数色を重ね合わせたときの色彩値を示すデータを予め用意する構成を採用可能である。 In the present embodiment, a patch having a predetermined size is printed with a maximum value of the ink amount limitation in the print medium, and the spectral reflectance is obtained by measuring the patch under a predetermined light source. That is, the spectral reflectance obtained in this way is the spectral reflectance when each dot is observed. Note that this method of obtaining spectral reflectance is an example, and a patch is printed at a predetermined ink recording rate, and the ratio of the area of the dot on the print medium to the area of the part where no dot is recorded is used. Thus, the spectral reflectance of each color may be calculated, and various configurations can be employed. In the present invention, it is only necessary to be able to calculate a color value (brightness in this embodiment) for each sub-pixel. In this sense, it is not essential to prepare data indicating spectral reflectance. For example, it is possible to employ a configuration in which data indicating a color value for a single color and a color value when a plurality of colors are superimposed are prepared in advance.
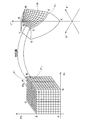
ステップS100〜S120においてシミュレートに必要なデータを作成したら、ステップS125では上記ハーフトーンデータを取得し、ドットの記録状態をシミュレートするためのサブ画素平面を形成する。すなわち、上記ハーフトーンデータにおける各画素を上記パラメータデータのサブ画素数/画素で分割し、分割して得られたサブ画素によってシミュレートを行う平面を形成する。この結果、ハーフトーンデータのドットマトリクスがさらに分解能の高いドットマトリクスになる。なお、具体的な処理としては、各サブ画素について記録状態データを特定できるように配列を定義するなどして実現可能である。 When data necessary for simulation is created in steps S100 to S120, the halftone data is acquired in step S125, and a sub-pixel plane for simulating the dot recording state is formed. That is, each pixel in the halftone data is divided by the number of subpixels / pixel of the parameter data, and a plane for simulation is formed by the subpixels obtained by the division. As a result, the dot matrix of halftone data becomes a dot matrix with higher resolution. Note that specific processing can be realized by defining an array so that the recording state data can be specified for each sub-pixel.
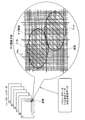
図9は、本実施形態におけるシミュレーション処理を説明するための説明図である。同図において、左上にはハーフトーン処理後のハーフトーンデータを示し、同図中央にはサブ画素平面を示している。すなわち、同図中央に示すように画素より小さな矩形で形成される平面をサブ画素平面と考える。なお、図9では、サブ画素平面の左上の端を座標(0,0)とし、主走査方向の座標をx,副走査方向の座標をyとしている。サブ画素平面を形成したら、上記画質評価指数算出部1260はステップS130において上記ドット形状データを参照し、このサブ画素平面上でドット形状をシミュレートする。
FIG. 9 is an explanatory diagram for explaining a simulation process in the present embodiment. In the figure, the upper left shows halftone data after halftone processing, and the center of the figure shows a sub-pixel plane. That is, a plane formed by a rectangle smaller than a pixel as shown in the center of the figure is considered as a sub-pixel plane. In FIG. 9, the upper left end of the sub-pixel plane is the coordinate (0, 0), the coordinate in the main scanning direction is x, and the coordinate in the sub scanning direction is y. When the sub-pixel plane is formed, the image quality evaluation
すなわち、上記ハーフトーンデータにおいては各画素についてドットを形成するか否かを2階調で指定しているので、このハーフトーンデータから各画素に対応するサブ画素上にドットを形成するか否かを決定することができる。また、シミュレート対象のプリンタにおいて実施する主走査および副走査の制御法を特定すれば、上記ハーフトーンデータにおける各画素のドットを形成するノズルを特定することができる。そこで、ドット形状データを参照すれば、各画素に対応するサブ画素において形成されるドットの形状を詳細に特定することができる。むろん、上記制御法を示すデータを上述のパラメータデータとして作成しても良い。 That is, in the halftone data, whether or not to form a dot for each pixel is specified in two gradations, so whether or not to form a dot on the sub-pixel corresponding to each pixel from this halftone data. Can be determined. Further, by specifying the main scanning and sub-scanning control methods implemented in the printer to be simulated, it is possible to specify the nozzles that form the dots of each pixel in the halftone data. Therefore, by referring to the dot shape data, it is possible to specify in detail the shape of the dot formed in the sub-pixel corresponding to each pixel. Of course, data indicating the control method may be created as the parameter data.
本実施形態においては、各画素の中心を基準の位置としており、上記第1ドットの中心がこの基準の位置に相当するようにドットを配置する。この処理を全画素に対して行えば、図9にハッチをかけて示すようにサブ画素平面上にドットを形成することができる。以上のように、ドットの形状を詳細に特定しつつサブ画素平面上にドットを形成したら、上記パラメータデータに示される色数の全色についてドットを形成する処理が終了したか否か判別し(ステップS135)、全色について終了したと判別されるまでステップS125以降の処理を繰り返す。このようにして得られるデータは各色毎にドットの記録状態を示しており、ここではこのデータを記録状態データと呼ぶ。 In the present embodiment, the center of each pixel is set as a reference position, and the dots are arranged so that the center of the first dot corresponds to the reference position. If this process is performed on all the pixels, dots can be formed on the sub-pixel plane as shown by hatching in FIG. As described above, when the dots are formed on the sub-pixel plane while specifying the shape of the dots in detail, it is determined whether or not the process for forming the dots has been completed for all the numbers of colors indicated in the parameter data ( In step S135, the processes in and after step S125 are repeated until it is determined that all colors have been completed. The data obtained in this way indicates the dot recording state for each color, and this data is called recording state data here.
全インク色について記録状態データを作成したら、各インク色によって形成されるドットが人間の目によってどのように視認されるのかを評価できるようにするために、上記画質評価指数算出部1260はステップS140にて各インクを重畳した状態での明度を算出する。すなわち、所定の光源を想定し、上記分光反射率データと人間の目の分光感度とから三刺激値XYZを算出し、さらにこの三刺激値XYZからL*a*b*値を算出する。
When the recording state data is created for all ink colors, the image quality evaluation
得られたL*が明度であり、サブ画素平面上の各座標について明度が特定されることになる(これをL(x,y)と表記する)。なお、各インク色毎のサブ画素平面において座標(x,y)は同じ位置に相当するので、異なるインク色のサブ画素平面で同じ座標上にドットが形成されている場合には、各色の分光反射率を互いに乗じて重畳された分光反射率として明度を算出すればよい。座標(x,y)にドットが形成されていない場合には、印刷媒体における明度(上記分光反射率データのW)がL(x,y)となる。L(x,y)が得られたら、画質評価指数算出部1260は図10に示すフローチャートに従って処理を行い、当該L(x,y)に基づいてGIを算出する。
The obtained L * is the lightness, and the lightness is specified for each coordinate on the sub-pixel plane (this is expressed as L (x, y)). Since the coordinates (x, y) in the sub-pixel plane for each ink color correspond to the same position, when dots are formed on the same coordinate in the sub-pixel plane of different ink colors, the spectral of each color The brightness may be calculated as the spectral reflectance superimposed by multiplying the reflectances. When no dot is formed at the coordinates (x, y), the brightness (W of the spectral reflectance data) on the print medium is L (x, y). When L (x, y) is obtained, the image quality evaluation
図11はGIを算出する様子を説明する説明図である。本実施形態において、GIは画像の明度を空間周波数(cycle/mm)で評価する。このために、まず図11の左端に示す明度L(x,y)に対してFFT(Fast Fourier Transformation)を実施する(ステップS200)。図10,図11においては得られた空間周波数のスペクトルをS(u,v)として示している。なお、スペクトルS(u,v)は実部Re(u,v)と虚部Im(u,v)とからなり、S(u,v)=Re(u,v)+jIm(u,v)である。このスペクトルS(u,v)は上述のウイナースペクトラムに相当する。 FIG. 11 is an explanatory diagram for explaining how the GI is calculated. In the present embodiment, the GI evaluates the brightness of an image with a spatial frequency (cycle / mm). For this purpose, first, FFT (Fast Fourier Transformation) is performed on the lightness L (x, y) shown at the left end of FIG. 11 (step S200). 10 and 11, the obtained spatial frequency spectrum is shown as S (u, v). The spectrum S (u, v) is composed of a real part Re (u, v) and an imaginary part Im (u, v), and S (u, v) = Re (u, v) + jIm (u, v). It is. This spectrum S (u, v) corresponds to the above-described winner spectrum.
ここで、(u,v)は(x,y)の逆空間の次元を持つが、本実施形態において(x,y)は座標として定義され、実際の長さの次元に対応させるには解像度等を考慮しなければならない。従って、S(u,v)を空間周波数の次元で評価する場合も次元の変換が必要である。そこで、まず、座標(u,v)に対応した空間周波数の大きさf(u,v)を算出するため、シミュレート対象となっている画像の最低周波数を算出する(ステップS205)。シミュレート対象となっている画像の最低周波数は、シミュレート対象のハーフトーンデータで印刷される印刷結果において1回振動する周波数であり、主走査方向(X方向)と副走査方向(Y方向)とのそれぞれについて定義される。 Here, (u, v) has an inverse space dimension of (x, y). In this embodiment, (x, y) is defined as a coordinate, and resolution is required to correspond to the actual length dimension. Etc. must be taken into account. Therefore, even when evaluating S (u, v) in the spatial frequency dimension, dimension conversion is required. Therefore, first, in order to calculate the magnitude f (u, v) of the spatial frequency corresponding to the coordinates (u, v), the lowest frequency of the image to be simulated is calculated (step S205). The lowest frequency of the image to be simulated is a frequency that vibrates once in the print result printed with the halftone data to be simulated, and is in the main scanning direction (X direction) and the sub-scanning direction (Y direction). And for each.
すなわち、主走査方向の最低周波数euはX解像度/(X方向の画素数×25.4),副走査方向の最低周波数evはY解像度/(Y方向の画素数×25.4)と定義される。なお、X解像度,Y解像度は上記パラメータデータによって特定されるデータである。また、ここでは1インチを25.4mmとしている。各走査方向の最低周波数eu,evが算出されれば、任意の座標(u,v)における空間周波数の大きさf(u,v)は((eu・u)2+(ev・v)2))1/2として算出することが可能になる。 That is, the lowest frequency e u in the main scanning direction is X resolution / (number of pixels in the X direction × 25.4), and the lowest frequency e v in the sub-scanning direction is Y resolution / (number of pixels in the Y direction × 25.4). Defined. The X resolution and Y resolution are data specified by the parameter data. Here, 1 inch is 25.4 mm. Minimum frequency e u in each scanning direction, if e v is calculated, the spatial frequency in arbitrary coordinates (u, v) size f (u, v) is ((e u · u) 2 + (e v・ V) 2 )) It can be calculated as 1/2 .
一方、人間の目は、空間周波数の大きさf(u,v)に応じて明度に対する感度が異なり、当該視覚の空間周波数特性は、例えば、図11の中央下部に示すVTF(f)のような特性である。この図11におけるVTF(f)はVTF(f)=5.05×exp(−0.138・d・π・f/180)×(1−exp(−0.1・d・π・f/180))である。なお、ここでdは印刷物と目の距離でありfは上記空間周波数の大きさfである。このfは上述(u,v)の関数として表現されているので、視覚の空間周波数特性VTFは(u,v)の関数VTF(u,v)とすることができる。 On the other hand, human eyes have different sensitivities to lightness depending on the magnitude f (u, v) of the spatial frequency, and the visual spatial frequency characteristic is, for example, VTF (f) shown in the lower center of FIG. It is a characteristic. VTF (f) in FIG. 11 is VTF (f) = 5.05 × exp (−0.138 · d · π · f / 180) × (1−exp (−0.1 · d · π · f / 180)). Here, d is the distance between the printed material and the eyes, and f is the magnitude f of the spatial frequency. Since f is expressed as a function of the above (u, v), the visual spatial frequency characteristic VTF can be a function VTF (u, v) of (u, v).
上述のスペクトルS(u,v)に対してこのVTF(u,v)を乗じれば、視覚の空間周波数特性を考慮した状態でスペクトルS(u,v)を評価することができる。また、この評価を積分すればサブ画素平面全体について空間周波数を評価することができる。そこで、一実施例においては、ステップS210〜S230の処理で積分までの処理を行っており、まず、(u,v)を双方とも”0”に初期化し(ステップS210)、ある座標(u,v)での空間周波数f(u,v)を算出する(ステップS215)。また、この空間周波数fにおけるVTFを算出する(ステップS220)。 By multiplying the above-mentioned spectrum S (u, v) by this VTF (u, v), the spectrum S (u, v) can be evaluated in a state in which the visual spatial frequency characteristic is taken into consideration. If this evaluation is integrated, the spatial frequency can be evaluated for the entire sub-pixel plane. Therefore, in one embodiment, the processing up to integration is performed in steps S210 to S230. First, both (u, v) are initialized to “0” (step S210), and a certain coordinate (u, v The spatial frequency f (u, v) at v) is calculated (step S215). Further, the VTF at the spatial frequency f is calculated (step S220).
VTFが得られたら、当該VTFの2乗とスペクトルS(u,v)の2乗とを乗じ、積分結果を代入するための変数Powとの和を算出する(ステップS225)。すなわち、スペクトルS(u,v)は実部Re(u,v)と虚部Im(u,v)とを含むので、その大きさを評価するため、まず、VTFの2乗とスペクトルS(u,v)の2乗とによって積分を行う。そして、座標(u,v)の総てについて以上の処理を実施したか否かを判別し(ステップS230)、全座標(u,v)について処理を終了したと判別されなければ、未処理の座標(u,v)を抽出してステップS215以降の処理を繰り返す。なお、VTFは図11に示すように空間周波数の大きさが大きくなると急激に小さくなってほぼ”0”となるので、座標(u,v)の値域を予め所定の値以下に制限することにより必要充分な範囲で計算を行うことができる。 When the VTF is obtained, the sum of the square of the VTF and the square of the spectrum S (u, v) and the variable Pow for substituting the integration result are calculated (step S225). That is, since the spectrum S (u, v) includes a real part Re (u, v) and an imaginary part Im (u, v), in order to evaluate the magnitude, first, the square of the VTF and the spectrum S ( Integration is performed by the square of u, v). Then, it is determined whether or not the above processing has been performed for all coordinates (u, v) (step S230), and if it is not determined that the processing has been completed for all coordinates (u, v), unprocessed The coordinates (u, v) are extracted, and the processing from step S215 is repeated. Note that, as shown in FIG. 11, VTF suddenly decreases and becomes almost “0” as the spatial frequency increases, so that the range of coordinates (u, v) is limited to a predetermined value or less in advance. Calculation can be performed within a necessary and sufficient range.
積分が終了したら、Pow1/2/全サブ画素数を算出する(ステップS235)。すなわち、変数Powの平方根によって上記スペクトルS(u,v)の大きさの次元に戻すとともに、全サブ画素数で除して規格化する。この規格化により、元のハーフトーンデータの画素数に依存しない客観的な指数(図10のInt)を算出している。むろん、ここでは規格化を実施できればよいので、上記ハーフトーンデータの画素数で除して規格化しても良い。また、規格化によれば、画像の大きさに関わらず粒状性を評価することができるが、上述のハーフトーンデータの画素数を常に同じ画素数として粒状性を評価するのであれば、必ずしも規格化は必要ない。 When the integration is completed, Pow 1/2 / total number of subpixels is calculated (step S235). That is, the dimension is returned to the dimension of the spectrum S (u, v) by the square root of the variable Pow, and is normalized by dividing by the total number of sub-pixels. By this normalization, an objective index (Int in FIG. 10) that does not depend on the number of pixels of the original halftone data is calculated. Of course, it suffices if normalization can be performed here, and normalization may be performed by dividing by the number of pixels of the halftone data. According to the standardization, it is possible to evaluate the graininess regardless of the size of the image. However, if the graininess is always evaluated with the same number of pixels of the above-described halftone data, the standardity is not necessarily required. It is not necessary.
本実施形態においては、さらに、印刷物全体の明度による影響を考慮した補正を行ってGIとしている。すなわち、本実施形態においては、空間周波数のスペクトルが同じであっても印刷物全体が明るい場合と暗い場合とでは人間の目に異なった印象を与え、全体が明るい方が粒状性を感じやすいものとして補正を行う。このため、まず、全画素について明度L(x,y)を足し合わせ、全画素で除することにより、画像全体の明度の平均Aveを算出する(ステップS240)。 In the present embodiment, correction is performed in consideration of the influence of lightness of the entire printed matter, and the result is set as GI. In other words, in this embodiment, even if the spatial frequency spectrum is the same, the printed matter gives different impressions to the human eyes when it is bright and dark, and the brighter one feels more grainy. Make corrections. For this reason, first, the lightness L (x, y) is added to all the pixels and divided by all the pixels to calculate the average lightness Ave of the entire image (step S240).
そして、画像全体の明るさによる補正係数a(L)をa(L)=((Ave+16)/116)0.8と定義し、この補正係数a(L)を算出(ステップS245)するとともに上記Intに乗じてGIとする(ステップS250)。なお、補正係数a(L)は、上述の明度補正項aLに相当する。また、補正係数としては、明度の平均によって係数の値が増減する関数であればよく、他にも種々の関数を採用可能である。むろん、GIを評価する成分は明度成分に限られず、色相、彩度成分を考慮して空間周波数を評価しても良いし、色彩値として、明度成分,赤−緑成分,黄−青成分を算出し、それぞれをフーリエ変換した後、各色成分毎に予め定義された視覚の空間周波数特性を乗じてGIを算出しても良い。 Then, the correction coefficient a (L) based on the brightness of the entire image is defined as a (L) = ((Ave + 16) / 116) 0.8, and this correction coefficient a (L) is calculated (step S245) and the above Int Multiply to make GI (step S250). The correction coefficient a (L) corresponds to the brightness correction term a L described above. The correction coefficient may be a function whose coefficient value increases or decreases according to the average brightness, and various other functions can be adopted. Of course, the component for evaluating the GI is not limited to the lightness component, and the spatial frequency may be evaluated in consideration of the hue and the saturation component, and the lightness component, the red-green component, and the yellow-blue component are used as the color values. After calculating and Fourier-transforming each, GI may be calculated by multiplying a visual spatial frequency characteristic defined in advance for each color component.
以上の処理によりCIIとGIとを算出すると、上記図4に示すステップS80では、上記(1)式によって評価指数EI1を算出する。ステップS85では、処理対象となっているセルに含まれるすべてのサンプル色に関して評価指数EI1の算出が終了したか否かが判断される。こうして、ステップS55〜S85が繰り返し実行されて、そのセル内のすべてのサンプル色に関して評価指数EI1が算出される。ステップS90では、選択部130が、そのセル内のサンプル色のうちで、評価指数EI1が最良であるサンプルを、そのセルに関する代表サンプルとして選択する。この結果、少なくとも1つのサンプルを含む各セルに関して、1つの代表サンプルがそれぞれ選択される。以下では、代表サンプルを「高評価サンプル」とも呼ぶ。
When CII and GI are calculated by the above processing, in step S80 shown in FIG. 4, the evaluation index EI 1 is calculated by the above equation (1). In step S85, it is determined whether or not the calculation of the evaluation index EI 1 has been completed for all sample colors included in the cell to be processed. Thus, steps S55 to S85 are repeatedly executed, and the evaluation index EI 1 is calculated for all the sample colors in the cell. In step S90, the
なお、ステップS20で分割された複数のセルの中には、サンプル色を全く含まないセルも存在する。従って、図4の処理は、少なくとも1つのサンプル色を含むようなセルを対象として実行され、サンプル色を1つも含まないセルは処理対象から除外される。以上のようにして代表サンプルを選択したら、ステップS40では、そのCIELAB測色値とインク量とを対応付けてインクプロファイル142を作成する。この測色値は、上記ステップS66あるいはS72で算出した測色値でも良いし、プリンタルックアップテーブル180を用いて印刷する印刷環境の光源に合わせた測色値を算出しても良い。
Note that among the plurality of cells divided in step S20, there is a cell that does not include any sample color. Therefore, the process of FIG. 4 is performed for cells that include at least one sample color, and cells that do not include any sample color are excluded from the processing target. After the representative sample is selected as described above, in step S40, the
上述のようにセルは163個あるので、ステップS35で選択された代表サンプルは163個以下である。一般的プリンタで使用するプリンタルックアップテーブル180において規定するインク量のサンプル数やサンプルの色は上記代表サンプルと必ずしも一致しない。そこで、任意のインク量に対応する測色値は代表サンプルを参照して補間演算を実施する必要がある。補間演算として線形補間、非線形補間いずれを採用するにしても、代表サンプルがCIELAB空間で不規則に配置されていると、補間演算の精度が悪くなる。補間演算の精度が悪いと、プリンタルックアップテーブル180で色変換を実施する際の変換精度も悪く、このプリンタルックアップテーブル180を利用した印刷で高画質の印刷結果を得ることができない。 Since there are 16 3 cells as described above, the number of representative samples selected in step S35 is 16 3 or less. The number of ink samples and the sample color specified in the printer look-up table 180 used in a general printer do not always match the representative sample. Therefore, the colorimetric value corresponding to an arbitrary ink amount needs to be interpolated with reference to the representative sample. Regardless of whether linear interpolation or non-linear interpolation is adopted as the interpolation calculation, if the representative samples are irregularly arranged in the CIELAB space, the accuracy of the interpolation calculation deteriorates. If the accuracy of the interpolation calculation is poor, the conversion accuracy when performing color conversion using the printer lookup table 180 is also poor, and a high-quality print result cannot be obtained by printing using the printer lookup table 180.
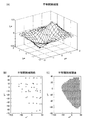
そこで、ステップS45においては、インクプロファイル142に対してスムージング処理を行い、高精度に補間演算を実施可能な代表サンプルを選びなおしてスムージングされたインクプロファイル144を作成する。図12は、一実施例におけるスムージング処理を説明する説明図である。この実施例では、インクプロファイル142に記述された測色値をCIELAB空間内の格子点と考え、この格子点の配置がCIELAB空間で平滑化されているか否かを評価する平滑程度評価指数SEIを定義する。
Therefore, in step S45, smoothing processing is performed on the
ここで、配置の平滑程度とは、空間中に複数の格子点が並んでいるときの歪みの程度である。例えば、色空間内に格子点が立方格子状に並んでいる場合には歪みがないが、各格子点が立方格子点位置からずれると格子としては歪みが大きくなる。また色空間内に格子点が均等に並んでいるほど平滑程度が高いと言えるし、色空間内で隣り合う格子点を結ぶ曲線であって当該色空間に形成される色域の一方の境界から他方の境界に向けて引かれる曲線を考えたときに、この曲線が高次関数で記述されるほど平滑程度が低いと言える。 Here, the smoothness of the arrangement is the degree of distortion when a plurality of lattice points are arranged in the space. For example, there is no distortion when lattice points are arranged in a cubic pattern in the color space, but the distortion increases as a lattice when each lattice point deviates from the position of the cubic lattice point. In addition, it can be said that the smoothness is higher as the grid points are evenly arranged in the color space, and it is a curve connecting adjacent grid points in the color space and from one boundary of the color gamut formed in the color space. When considering a curve drawn toward the other boundary, it can be said that the degree of smoothness is lower as this curve is described by a higher-order function.
一般に、各色空間で整然と並んでいる格子点の方がその間に位置する色を補間演算によって算出する際に空間の局所的位置によって補間精度を大きく変動させることなく補間を行うことができる。従って、スムージングによって格子点位置を最適化することで、インクプロファイルを参照して補間を実施する際の補間精度を高くすることができる。なお、スムージングによって最適化を行う格子点を最適化対象の格子点とも呼ぶ。 In general, when a grid point arranged in order in each color space calculates a color positioned between them by interpolation calculation, interpolation can be performed without greatly changing the interpolation accuracy depending on the local position of the space. Therefore, by optimizing the grid point position by smoothing, it is possible to increase the interpolation accuracy when performing interpolation with reference to the ink profile. Note that a lattice point to be optimized by smoothing is also referred to as an optimization target lattice point.
SEIにおいてはその値によって配置の平滑程度を示すことができれば良く、その値を理想値に近づけるようにすることによって評価を向上させる。図12に示す一実施例では、スムージング対象の測色値の格子点(最適化対象の格子点)の位置を示す位置情報を定義し、当該位置情報を変数とする関数としてSEIを定義する。また、格子点配置の平滑程度が高くなるほど値が小さくなる関数としてSEIを定義する。このような定義によれば、SEIの極小を与える測色値を探索することによって格子点配置を最適化することができる。この探索に際しては、種々の手法を採用可能である。例えば、準ニュートン法や共益勾配法等種々のアルゴリズムを採用することができる。 In SEI, it is only necessary that the smoothness of the arrangement can be indicated by the value, and the evaluation is improved by bringing the value close to the ideal value. In one embodiment shown in FIG. 12, position information indicating the position of the grid point of the colorimetric value to be smoothed (lattice point to be optimized) is defined, and SEI is defined as a function using the position information as a variable. In addition, SEI is defined as a function whose value decreases as the smoothness of the grid point arrangement increases. According to such a definition, the grid point arrangement can be optimized by searching for a colorimetric value that gives the minimum of SEI. Various methods can be employed for this search. For example, various algorithms such as the quasi-Newton method and the common benefit gradient method can be employed.
図13は、この実施例における処理手順を示すフローチャートである。プロファイル生成部140はスムージング処理を実施するにあたり、ステップS300で上述の位置情報を定義する。図14は、位置情報を定義する際の例を示している。インクプロファイル142においては、複数の測色値が記述されており、この測色値をCIELAB空間にプロットすると図14の右側に示すような色域を形成する。なお、測色値は離散的な値の集まりであるが、図14においてはプロットされた測色値の中で最も外側の格子点が形成する色域の外面を示している。また、各頂点WKRGBCMYはそれぞれ白、黒、赤、緑、青、シアン、マゼンタ、黄を示し、無彩色W,Kではそれぞれ最高明度と最低明度の色に相当し、有彩色RGBCMYではそれぞれの色における最高彩度の色に相当する。
FIG. 13 is a flowchart showing a processing procedure in this embodiment. In performing the smoothing process, the
位置情報は、CIELAB空間の各格子点を一義的に特定するとともに、周囲の隣接格子点との相対的な位置関係を把握できるように定義する。一実施例では3つの変数(Pr,Pg,Pb)について、0≦Pr≦R方向の格子点数−1,0≦Pg≦G方向の格子点数−1,0≦Pb≦B方向の格子点数−1と定義する。ここで、R方向の格子点数とは、図14の右側に示す色域において、ブラック(K)とレッド(R)とを結ぶ稜線上に位置する格子点の数である。同様にG方向の格子点数とは、図14の右側に示す色域において、ブラック(K)とグリーン(G)とを結ぶ稜線上に位置する格子点の数であり、B方向の格子点数とは、図14の右側に示す色域において、ブラック(K)とブルー(B)とを結ぶ稜線上に位置する格子点の数である。 The position information is defined so that each lattice point in the CIELAB space is uniquely specified and a relative positional relationship with surrounding neighboring lattice points can be grasped. In one embodiment, for three variables (Pr, Pg, Pb), 0 ≦ Pr ≦ R number of lattice points−1, 0 ≦ Pg ≦ G direction of lattice points−1, 0 ≦ Pb ≦ B direction of lattice points− 1 is defined. Here, the number of grid points in the R direction is the number of grid points located on the ridge line connecting black (K) and red (R) in the color gamut shown on the right side of FIG. Similarly, the number of grid points in the G direction is the number of grid points located on the ridge line connecting black (K) and green (G) in the color gamut shown on the right side of FIG. Is the number of grid points located on the ridge line connecting black (K) and blue (B) in the color gamut shown on the right side of FIG.
3つの変数(Pr,Pg,Pb)の初期値は整数とする。ここで、位置情報(Pr,Pg,Pb)を3次元直交空間にプロットすると図14の左側に示すように略立方体の格子を形成する。なお、図14の左側では直線の交点が位置情報(Pr,Pg,Pb)の初期値に相当する。また、図14に示す格子点の数は一例である。以上のように位置情報を定義した上で、上述のCIELAB空間の各格子点と対応づければ、各格子点の位置および周囲の隣接格子点との相対的な位置関係を把握することが可能になる。 The initial values of the three variables (Pr, Pg, Pb) are integers. Here, when the position information (Pr, Pg, Pb) is plotted in a three-dimensional orthogonal space, a substantially cubic lattice is formed as shown on the left side of FIG. On the left side of FIG. 14, the intersection of the straight lines corresponds to the initial value of the position information (Pr, Pg, Pb). Further, the number of grid points shown in FIG. 14 is an example. By defining the position information as described above and associating it with each lattice point in the CIELAB space described above, it is possible to grasp the position of each lattice point and the relative positional relationship with surrounding neighboring lattice points. become.
そこで、図14の左側に示す略立方体の外面が図14の右側に示す色域の外面に相当すると考えて位置情報とCIELAB空間の各格子点とを対応づける。例えば、色域の外面WMBC(外面P1)は、図14の左側では位置情報Pbを最大値に固定し、位置情報Pr,Pgを任意の値として形成される外面P1’に相当する。そこで、外面P1上の頂点Bに相当する格子点と外面P1’上の頂点Bに相当する格子点(Pbが最大値,Pr=Pg=0)に対応づけるなどして、外面P1上の格子点と外面P1’上の位置情報とを対応づける。 Therefore, it is assumed that the outer surface of the substantially cube shown on the left side of FIG. 14 corresponds to the outer surface of the color gamut shown on the right side of FIG. 14, and the positional information is associated with each lattice point in the CIELAB space. For example, the outer surface WMBC (outer surface P 1 ) of the color gamut corresponds to the outer surface P 1 ′ formed with the position information Pb fixed to the maximum value on the left side of FIG. Therefore, by, for example, associating to the lattice point corresponding to the vertex B of the grid point and an outer surface P 1 corresponding to the vertex on the outer surface P 1 B '(Pb maximum value, Pr = Pg = 0), an outer surface P 1 The upper grid point is associated with the position information on the outer surface P 1 ′.
同様に、色域の外面P1より内側に曲面P2を考え、外面P1に存在し、かつ曲面P2に近い格子点を抽出すれば、図14の左側に示す立方体内の平面P2’上の位置情報と対応づけることができる。同様の作業によって、色域内の全ての格子点と位置情報とを対応づけることができる。以上のように格子点と位置情報とを対応づけることができれば、位置情報により任意の格子点の位置を特定することができる。 Similarly, if the curved surface P 2 is considered inside the outer surface P 1 of the color gamut and lattice points existing on the outer surface P 1 and close to the curved surface P 2 are extracted, the plane P 2 in the cube shown on the left side of FIG. 'Can be associated with the location information above. By the same operation, all grid points in the color gamut can be associated with the position information. As described above, if the lattice point and the position information can be associated with each other, the position of an arbitrary lattice point can be specified by the position information.
例えば、隣接する2つの格子点の位置情報がそれぞれ(Pr0,0,0),(Pr1,0,0)であったとき、これらの格子点の間の任意の位置はPr0〜Pr1の間の任意の値Pr2によって(Pr2,0,0)と表現される。むろん、上述の位置情報の定義は一例であり、CIELAB空間の各格子点を一義的に特定し、周囲の隣接格子点との相対的な位置関係を把握することができれば他の手法で位置情報を決定しても良い。なお、一つの面上に存在する格子点の数は((インクプロファイル142に記述された全ての測色値の数)1/3)2などによって決定しても良い。 For example, when the position information of two adjacent lattice points is (Pr 0 , 0 , 0) and (Pr 1 , 0, 0), any position between these lattice points is Pr 0 to Pr. An arbitrary value Pr 2 between 1 is expressed as (Pr 2 , 0, 0). Of course, the above-described definition of the position information is an example, and if it is possible to uniquely identify each lattice point in the CIELAB space and grasp the relative positional relationship with surrounding neighboring lattice points, the position information can be obtained by another method. May be determined. Note that the number of grid points existing on one surface may be determined by ((number of all colorimetric values described in the ink profile 142) 1/3 ) 2 or the like.
色域内の全ての格子点と位置情報とを対応づけたら、ステップS305にてSEIを定義する。図12に示す一実施例では、最適化対象の格子点からその格子点に隣接する隣接格子点へ向けたベクトルであって互いに略逆向きのベクトルの和の絶対値を含む関数でSEIを定義する。このSEIは、最適化対象の格子点が属するCIELAB空間の部位毎に異なる関数形とすることができる。一実施例では、色域の部位毎に異なる関数形とする。なお、関数のより具体的な例は後述する。 When all the grid points in the color gamut are associated with the position information, SEI is defined in step S305. In one embodiment shown in FIG. 12, the SEI is defined by a function including the absolute value of the sum of vectors which are directed from the lattice point to be optimized to the adjacent lattice point adjacent to the lattice point and are substantially opposite to each other. To do. This SEI can have a different function form for each part of the CIELAB space to which the optimization-targeted grid point belongs. In one embodiment, the function form is different for each part of the color gamut. A more specific example of the function will be described later.
SEIを定義したら、図13のステップS310〜S350の処理によって最適化処理を行う。ステップS310では、上記インクプロファイル142に記述されたサンプルから最適化対象の格子点を一つ抽出する。初期ルーチンにおいてはインクプロファイル142に記述されたインク量データおよびこのインク量データに対応する測色値自体を最適化対象とする。ステップS315では、インクプロファイル142に記述された測色値の中から、上記最適化対象のLab格子点の周囲に存在するとともに当該格子点に隣接する格子点に相当する測色値を抽出する。なお、ここで抽出される測色値は、SEIの関数形によって異なっており、詳細は後述する。また、隣接格子点が既に最適化されている場合は、最適化後の格子点の測色値を抽出する。
Once SEI is defined, optimization processing is performed by the processing in steps S310 to S350 in FIG. In step S310, one optimization target lattice point is extracted from the sample described in the
ステップS320では、上記最適化対象の格子点およびその隣接格子点を利用してSEIを算出する。SEIの変数は上記位置情報である。従って、最適化対象の格子点およびその隣接格子点の位置情報によってSEIを算出することができる。また、SEIは最適化対象の格子点の配置が平滑化されるほど値が小さくなる関数であるので、最適化対象の格子点の位置情報を更新して最適化対象の格子点位置を変動させることにより最適な格子点位置を探索することができる。そこで、ステップS325では、SEIの値が所定の閾値以下になっているか否かを判別する。すなわち、SEIの値が所定の閾値以下になっているときに格子点の位置が最適化(充分に平滑化)されたと判別する。 In step S320, an SEI is calculated using the optimization-targeted grid point and its adjacent grid points. The SEI variable is the position information. Accordingly, the SEI can be calculated from the position information of the lattice point to be optimized and its adjacent lattice points. Further, since SEI is a function whose value decreases as the arrangement of the optimization-target grid points is smoothed, the position information of the optimization-target grid points is updated to change the optimization-target grid point position. This makes it possible to search for the optimal lattice point position. Therefore, in step S325, it is determined whether or not the SEI value is equal to or less than a predetermined threshold value. That is, it is determined that the position of the grid point is optimized (sufficiently smoothed) when the SEI value is equal to or less than a predetermined threshold value.
また、ステップS325で格子点の位置が最適化されていないと判別されたときには、ステップS330にて位置情報を更新する。すなわち、最適化対象の格子点の位置情報を変数とし、準ニュートン法や共益勾配法等によってSEIを極小化する位置情報を算出してこれを新たな位置情報とする。位置情報が更新されると、ステップS335にてインクプロファイル142を参照し、当該位置情報に対応するインク量データを算出する。すなわち、更新後の位置情報から測色値を算出し、この測色値に対応するインク量データをインクプロファイル142から算出する。
If it is determined in step S325 that the position of the grid point is not optimized, the position information is updated in step S330. In other words, the position information of the lattice point to be optimized is used as a variable, position information that minimizes the SEI is calculated by the quasi-Newton method or the common benefit gradient method, and this is used as new position information. When the position information is updated, ink amount data corresponding to the position information is calculated with reference to the
このようにして、更新後の位置情報に対応する測色値およびインク量データを算出したら、上記ステップS315以降の処理を繰り返す。なお、繰り返し処理においては、ステップS330で更新した測色値と更新後の位置情報とを対応づけてステップS315以降の処理を繰り返してもよいし、図12に示すようにインク量データを上記コンバータ100に入力し、得られた結果から測色値を計算し、この測色値と更新後の位置情報とを対応づけてステップS315以降の処理を繰り返しても良い。また、ステップS330における更新においては、インクプロファイル142を参照してインク量データを算出するので、このインク量データにおいては上述のCIIおよびGIが小さいという性質を維持している。従って、更新後のインク量データで印刷を行ったとしても色の見えの差が小さく、粒状性を感じにくいという性質は維持される。
When the colorimetric value and the ink amount data corresponding to the updated position information are calculated in this way, the processes after step S315 are repeated. In the repetitive process, the colorimetric values updated in step S330 and the updated position information may be associated with each other, and the processes in and after step S315 may be repeated. As shown in FIG. The color measurement value may be calculated from the result obtained by inputting to 100, and the process after step S315 may be repeated by associating the color measurement value with the updated position information. In addition, since the ink amount data is calculated by referring to the
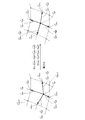
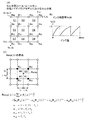
図12に示す破線の矩形は、ある関数形のSEIについて最適化処理を実施する様子を示している。左側の矩形は最適化前であり、右側の矩形は最適化後である。各矩形では、黒丸で最適化対象の格子点を示し、白丸で隣接格子点を示している。また、図に示す例では隣接格子点の測色値がそれぞれ(L*a*b*)1、(L*a*b*)3であり、その位置情報はそれぞれ(Pr,Pg,Pb)1,(Pr,Pg,Pb)3である。また、最適化対象の格子点の測色値が(L*a*b*)2であり、その位置情報は(Pr,Pg,Pb)2である。 A broken-line rectangle shown in FIG. 12 indicates a state in which optimization processing is performed on a certain function-type SEI. The left rectangle is before optimization, and the right rectangle is after optimization. In each rectangle, a black dot indicates a lattice point to be optimized, and a white circle indicates an adjacent lattice point. In the example shown in the figure, the colorimetric values of adjacent grid points are (L * a * b * ) 1 and (L * a * b * ) 3 , respectively, and their positional information is (Pr, Pg, Pb), respectively. 1 , (Pr, Pg, Pb) 3 . Further, the colorimetric value of the optimization-targeted grid point is (L * a * b * ) 2 and the position information is (Pr, Pg, Pb) 2 .
位置情報を利用すれば、図12示すベクトルa,ベクトルbのように、最適化対象の格子点からその格子点に隣接する隣接格子点へ向けたベクトルであって互いに略逆向きのベクトルを定義することができる。そこで、これらのベクトルの和の絶対値をSEIとする。上述のようにSEIを極小化すると位置情報が更新されて(Pr,Pg,Pb)2’となる。更新によってSEIが所定の閾値以下にならなければ(最適化されなければ)、この処理を繰り返す。すなわち、位置情報(Pr,Pg,Pb)2’に相当する測色値(L*a*b*)2’を算出し、この測色値によって最適化されていなければ再演算を行う。 If the position information is used, a vector directed from the lattice point to be optimized to an adjacent lattice point adjacent to the lattice point as vectors a and b shown in FIG. can do. Therefore, the absolute value of the sum of these vectors is SEI. When the SEI is minimized as described above, the position information is updated to (Pr, Pg, Pb) 2 ′. If the SEI does not fall below a predetermined threshold due to the update (if not optimized), this process is repeated. That is, a colorimetric value (L * a * b * ) 2 ′ corresponding to the position information (Pr, Pg, Pb) 2 ′ is calculated, and recalculation is performed if the colorimetric value is not optimized.
図12に示す例では、インクプロファイル142を参照し測色値(L*a*b*)1とインク量データ(CMYKOG)1との対応関係および測色値(L*a*b*)2とインク量データ(CMYKOG)2との対応関係から測色値(L*a*b*)2’に対応するインク量データ(CMYKOG)2’算出する。むろん、この補間は簡略化して示しており、更新後の測色値に近い値を有する4個以上の測色値をインクプロファイル142から抽出して補間演算を実施する。インク量データ(CMYKOG)2’を算出したら、この値をコンバータ100に入力してその測色値を算出する。そして、得られた測色値によって上述の最適化処理を繰り返す。すなわち、再帰的に演算を行う。
In the example shown in FIG. 12, the correspondence between the colorimetric value (L * a * b * ) 1 and the ink amount data (CMYKOG) 1 and the colorimetric value (L * a * b * ) 2 with reference to the
図13に示すフローチャートのステップS325で格子点の位置が最適化されたと判別されたときには、ステップS340にて最適化されたサンプルのデータをスムージングされたインクプロファイル144に登録する。図12に示す例では、最適化されたと判断された時点での測色値(L*a*b*)2’およびこの測色値に対応するインク量データ(CMYKOG)2’がインクプロファイル144に登録される。
When it is determined in step S325 in the flowchart shown in FIG. 13 that the position of the grid point has been optimized, the optimized sample data is registered in the smoothed
ステップS345においては、上記インクプロファイル142に記述されたインク量データの総てについて最適化が終了したか否かを判別する。そして、ステップS345においてインク量データの総てについて最適化が終了したと判別されるまでステップS310以降の処理を繰り返す。図13のフローチャートでは、さらに、ステップS350において、予め決められた回数の補正が実行されたか否か判別する。そして、ステップS350にて所定回数の補正が実行されたと判別されるまでステップS310以降の処理を繰り返す。すなわち、所定回数の補正を実行することによって最適化処理の結果が真の解になるようにしている。
In step S345, it is determined whether optimization has been completed for all the ink amount data described in the
むろん、格子点の配置が色域全体に渡って充分に最適化されていればよいので、ステップS350においては総てのインク量について上記SEIの値やその平均値が所定の閾値以下になっているか否かを判別しても良い。また、SEIの値の平均値が(n−1)回目の補正とn回目の補正と略一定の場合に充分に最適化されたとしても良く種々の構成を採用可能である。以上のようにして充分に格子点配置が平滑化された後には、上記インクプロファイル144に記述した測色値についてのスムージングが完了している。
Of course, since it is sufficient that the arrangement of the grid points is sufficiently optimized over the entire color gamut, in step S350, the value of SEI or the average value of all the ink amounts is equal to or less than a predetermined threshold value. It may be determined whether or not. Further, various configurations may be adopted even if the average value of the SEI values is substantially constant when the (n-1) th correction and the nth correction are substantially constant. After the grid point arrangement is sufficiently smoothed as described above, the smoothing for the colorimetric values described in the
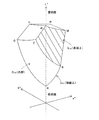
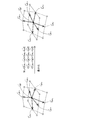
次に、ステップS315〜S335におけるSEIによる最適化処理の具体的な例について詳述する。図15は、インクプロファイル142に記述された測色値が形成する色域(ガマット)の模式図である。色域は同図に示すようにCIELAB空間中でいびつな形をしている。この色域はいびつな形であるが、その色域境界は上述の位置情報(Pr,Pg,Pb)が形成する立方体の境界と容易に対応づけることができる。すなわち、当該立方体の境界は立方体の外郭を形成する12本の稜線(エッジライン)および6個の外面であるが、図15に示す色域においてもその境界は12本の稜線および6個の外面にて構成される。より具体的には、位置情報(0,0,0)からPb軸上の稜線に沿ってPb成分のみを0より大きな可変値としてPr,Pg成分を最小値に固定したとき、この位置情報に対応する格子点は図15にてGs1と示した稜線上にある。
Next, a specific example of optimization processing by SEI in steps S315 to S335 will be described in detail. FIG. 15 is a schematic diagram of a color gamut formed by the colorimetric values described in the
同様に、位置情報が形成する立方体で一番上の面においてその頂点の色はそれぞれBWCMである。この面上の位置情報はPb成分のみを最大値に固定し、他の成分を任意に変化させることによって表現することができ、この面上の色は図15に示す色域ではGs2と示した面上にある。従って、上記位置情報のいずれか1つでも最大値あるいは最小値であればその色は色域境界上にあるといえる。この色域境界上の色について上記最適化の際にCIELAB空間内を自由に移動可能であるとすれば、充分に大きな色域の大きさを確保できなくなるおそれがある。そこで、本実施形態においては色域の大きさを維持するために、色域境界に形成される12本の稜線と6個の外面と色域内部とで関数形が異なるSEIを取得する。 Similarly, the color of the vertex on the top surface of the cube formed by the position information is BWCM. The position information on this surface can be expressed by fixing only the Pb component at the maximum value and arbitrarily changing other components. The color on this surface is indicated as G s2 in the color gamut shown in FIG. On the surface. Therefore, if any one of the position information is the maximum value or the minimum value, it can be said that the color is on the color gamut boundary. If the color on the boundary of the color gamut can be freely moved in the CIELAB space at the time of the optimization, there is a possibility that a sufficiently large color gamut size cannot be secured. Therefore, in the present embodiment, in order to maintain the size of the color gamut, SEIs having different function forms are acquired for the 12 ridge lines, six outer surfaces, and the inside of the color gamut formed at the color gamut boundary.
図16は、CIELAB空間中で色域境界に形成される稜線上の格子点を最適化するためのSEI(SI1)を説明する説明図である。同図において破線で示す曲線は色域境界に形成される稜線を示している。また、最適化対象の格子点は黒丸で示し、その周囲の格子点は白丸で示している。色域の大きさを維持するためには黒丸で示す最適化対象の格子点が破線で示す稜線上に存在する必要がある。そこで、本実施形態ではステップS310にて最適化対象として図16に示すように破線の稜線上に存在する格子点を抽出したときに、ステップS315では、当該最適化対象の格子点に隣接しかつ破線で示す稜線上に存在する格子点を抽出する。 FIG. 16 is an explanatory diagram for explaining SEI (SI 1 ) for optimizing grid points on the ridge line formed at the color gamut boundary in the CIELAB space. In the figure, a curved line indicated by a broken line indicates a ridge line formed at the color gamut boundary. The optimization-targeted grid points are indicated by black circles, and the surrounding grid points are indicated by white circles. In order to maintain the size of the color gamut, the grid point to be optimized indicated by a black circle needs to exist on the edge indicated by the broken line. Therefore, in the present embodiment, when a grid point existing on the broken ridge line is extracted as the optimization target in step S310 as shown in FIG. 16, in step S315, the grid point adjacent to the optimization target and Lattice points existing on the edge indicated by the broken line are extracted.
同図においては、最適化対象の格子点をベクトルLpとして示しており、隣接格子点として抽出される格子点をベクトルLa1,ベクトルLa2として示している。ここで、ベクトルLpは以下に示す式(5)によって算出され、上記位置情報(Pr,Pg,Pb)を変数として表現される。
![]()
![]()
SEIはこのベクトルLpおよびベクトルLa1,ベクトルLa2を利用し、以下に示す式(6)によって算出する。
![]()
![]()
格子点が均等に配置されると格子点配置が平滑化される傾向にあるので、式(6)に示すSI1を極小化することによって図16の右側に示すようにベクトルLpの格子点位置を最適化したベクトルL'pを取得することができる。また、ベクトルLp,ベクトルLa1,ベクトルLa2は位置情報(Pr,Pg,Pb)によって表現されるが、SI1においてはベクトルLa1,ベクトルLa2を与える位置情報は固定であり、ベクトルLpを与える位置情報(Pr,Pg,Pb)であって、そのうちいずれか一つのみを可変にするとともに他の二つを最小値あるいは最大値に固定している。例えば、図16に示す破線の稜線上の色はBとKの間に存在し、この色に相当する格子点を特定する位置情報Pr,Pgは最小値であるとともに位置情報Pbは任意の値である。そこで、CIELAB空間内の格子点をこの稜線上で移動させるためには、位置情報Pr,Pgを最小値に固定し、Pbを可変にすればよい。 Since the lattice point arrangement tends to be smoothed when the lattice points are evenly arranged, the lattice point of the vector L p is shown in the right side of FIG. 16 by minimizing SI 1 shown in Equation (6). A vector L ′ p having an optimized position can be obtained. The vector L p , the vector L a1 , and the vector L a2 are expressed by position information (Pr, Pg, Pb). In SI 1 , the position information that gives the vector L a1 and the vector L a2 is fixed, and the vector Position information (Pr, Pg, Pb) that gives L p , only one of which is variable, and the other two are fixed to the minimum value or the maximum value. For example, the color on the ridge line of the broken line shown in FIG. 16 exists between B and K. The position information Pr and Pg for specifying the grid point corresponding to this color is the minimum value and the position information Pb is an arbitrary value. It is. Therefore, in order to move the lattice points in the CIELAB space on this ridgeline, the position information Pr and Pg may be fixed to the minimum value and Pb may be made variable.
色域境界の他の稜線についても同様であり、最適化対象の格子点が色域境界上でKからRの稜線上に存在するときには、位置情報Pg,Pbを最小値に固定し、Prを可変にする。最適化対象の格子点が色域境界上でKからGの稜線上に存在するときには、位置情報Pr,Pbを最小値に固定し、Pgを可変にする。さらに、最適化対象の格子点が色域境界上でWからCの稜線上に存在するときには位置情報Pg,Pbを最大値に固定してPrを可変とし、最適化対象の格子点が色域境界上でWからMの稜線上に存在するときには位置情報Pr,Pbを最大値に固定してPgを可変とし、最適化対象の格子点が色域境界上でWからYの稜線上に存在するときには位置情報Pr,Pgを最大値に固定してPbを可変にする。 The same applies to the other ridge lines of the color gamut boundary. When the grid point to be optimized exists on the ridge line from K to R on the color gamut boundary, the position information Pg and Pb is fixed to the minimum value, and Pr is set to the minimum value. Make it variable. When the optimization-targeted grid point exists on the edge line from K to G on the color gamut boundary, the position information Pr, Pb is fixed to the minimum value, and Pg is made variable. Further, when the grid point to be optimized exists on the ridge line from W to C on the color gamut boundary, the positional information Pg and Pb are fixed to the maximum value and Pr is made variable, and the grid point to be optimized is changed to the color gamut. If the boundary information exists on the edge from W to M on the boundary, the position information Pr, Pb is fixed to the maximum value and Pg is variable, and the grid point to be optimized exists on the edge from W to Y on the color gamut boundary. When this is done, the position information Pr, Pg is fixed to the maximum value and Pb is made variable.
さらに、最適化対象の格子点が色域境界上でMからRの稜線上に存在するときには位置情報Prを最大値,Pgを最小値に固定してPbを可変とし、最適化対象の格子点が色域境界上でMからBの稜線上に存在するときには位置情報Pbを最大値,Pgを最小値に固定してPrを可変とし、最適化対象の格子点が色域境界上でCからGの稜線上に存在するときには位置情報Pgを最大値,Prを最小値に固定してPbを可変とし、最適化対象の格子点が色域境界上でCからBの稜線上に存在するときには位置情報Pbを最大値,Prを最小値に固定してPgを可変とする。 Further, when the optimization target grid point exists on the ridge line from M to R on the color gamut boundary, the position information Pr is fixed to the maximum value, Pg is fixed to the minimum value, and Pb is made variable. Is present on the ridge line from M to B on the color gamut boundary, the position information Pb is fixed to the maximum value, Pg is fixed to the minimum value, Pr is variable, and the grid point to be optimized is changed from C on the color gamut boundary. When it exists on the edge of G, position information Pg is fixed to the maximum value, Pr is set to the minimum value and Pb is variable, and when the grid point to be optimized exists on the edge of C to B on the gamut boundary The position information Pb is fixed to the maximum value and Pr is fixed to the minimum value, and Pg is made variable.
最適化対象の格子点が色域境界上でYからRの稜線上に存在するときには位置情報Prを最大値,Pbを最小値に固定してPgを可変とし、最適化対象の格子点が色域境界上でYからGの稜線上に存在するときには位置情報Pgを最大値,Pbを最小値に固定してPrを可変とする。以上のように、最適化対象の格子点の位置によって変動させる位置情報を適宜変化させてSEIを極小化すると、その時点でのSI1を極小化させる位置情報が算出され、この処理を繰り返すことによって格子点位置を最適化したベクトルL'pを取得することができる。 When the optimization target grid point exists on the edge line from Y to R on the color gamut boundary, the position information Pr is fixed to the maximum value, Pb is fixed to the minimum value, Pg is variable, and the optimization target grid point is the color. When it exists on the ridgeline from Y to G on the area boundary, the position information Pg is fixed to the maximum value, Pb is fixed to the minimum value, and Pr is variable. As described above, when the SEI is minimized by appropriately changing the position information to be varied depending on the position of the grid point to be optimized, the position information that minimizes SI 1 at that time is calculated, and this process is repeated. Thus, the vector L ′ p with the optimized grid point position can be obtained.
図17は、CIELAB空間中で色域の境界に形成される外面上の格子点を最適化するためのSEI(SI1)を説明する説明図である。同図において破線は格子点同士を結ぶ直線である。これらの格子点は色域境界の外面上に存在するので、紙面奥側あるいは手前側の一方のみに他の格子点が存在することになる。また、最適化対象の格子点は黒丸で示し、その周囲の格子点は白丸で示している。色域の大きさを維持するためには白丸および黒丸で示す格子点が存在する外面に対して最適化対象の格子点が垂直方向に大きく動くことは許されない。そこで、本実施形態ではステップS310で最適化対象として図17に黒丸で示す色域境界の外面上に存在する格子点を抽出したときに、ステップS315では当該最適化対象の格子点に対して4方で隣接しかつ色域境界の外面上に存在する4個の格子点を抽出する。 FIG. 17 is an explanatory diagram for explaining SEI (SI 1 ) for optimizing the grid points on the outer surface formed at the boundary of the color gamut in the CIELAB space. In the figure, the broken line is a straight line connecting the lattice points. Since these lattice points exist on the outer surface of the color gamut boundary, other lattice points exist only on one of the back side and the near side of the drawing. The optimization-targeted grid points are indicated by black circles, and the surrounding grid points are indicated by white circles. In order to maintain the size of the color gamut, the grid point to be optimized is not allowed to move significantly in the vertical direction with respect to the outer surface where the grid points indicated by white circles and black circles exist. Therefore, in the present embodiment, when a grid point existing on the outer surface of the color gamut boundary indicated by a black circle in FIG. 17 is extracted as an optimization target in step S310, in step S315, four grid points for the optimization target grid point are extracted. Four grid points that are adjacent to each other and exist on the outer surface of the color gamut boundary are extracted.
同図においても最適化対象の格子点をベクトルLpとして示しており、隣接格子点として抽出される格子点をベクトルLa1〜ベクトルLa4として示している。ここで、ベクトルLpは上記式(5)によって算出され、上記位置情報(Pr,Pg,Pb)を変数として表現される。色域境界の外面上に存在する格子点を最適化するためのSEIは、ベクトルLpおよびベクトルLa1〜ベクトルLa4を利用し、以下に示す式(7)で表現される。
隣接する格子点を結ぶ線(図17ではベクトルLa1〜ベクトルLp〜ベクトルLa2が示す格子点を通る線等)が直線に近く、また格子点が均等に配置されるほど格子点配置が平滑化される傾向にあるので、式(7)に示すSI2を極小化することによって図17の右側に示すようにベクトルLpの格子点位置を最適化したベクトルL'pを取得することができる。 A line connecting adjacent grid points (in FIG. 17, a line passing through the grid points indicated by the vector L a1 to the vector L p to the vector L a2, etc.) is closer to a straight line, and the grid points are arranged more uniformly. Since it tends to be smoothed, the vector L ′ p in which the lattice point position of the vector L p is optimized as shown on the right side of FIG. 17 is obtained by minimizing SI 2 shown in Expression (7). Can do.
また、ベクトルLp,ベクトルLa1〜ベクトルLa4は位置情報(Pr,Pg,Pb)によって表現されるが、SI2においてはベクトルLpを与える位置情報(Pr,Pg,Pb)であって、そのうちいずれか二つのみを可変にするとともに他の一つを最小値あるいは最大値に固定している。例えば、図15に斜線で示す色域境界の外面WMBC上の色に相当する格子点の位置情報Pbは最大値であるとともに位置情報Pr,Pgは任意の値である。そこで、CIELAB空間内の格子点を外面WMBC上で移動させるためには、位置情報Pbを最大値に固定し、Pr,Pgを可変にすればよい。 Further, the vector L p , the vector L a1 to the vector L a4 are expressed by position information (Pr, Pg, Pb), but in SI 2 , the position information (Pr, Pg, Pb) giving the vector L p is , Only two of them are made variable and the other one is fixed to the minimum value or the maximum value. For example, the position information Pb of the grid point corresponding to the color on the outer surface WMBC of the color gamut boundary shown by the oblique lines in FIG. 15 is the maximum value, and the position information Pr and Pg are arbitrary values. Therefore, in order to move the lattice points in the CIELAB space on the outer surface WMBC, the position information Pb may be fixed to the maximum value and Pr and Pg may be made variable.
色域境界の他の外面についても同様であり、色域境界の外面MRKB上で格子点を移動させるためには、位置情報Pgを最小値に固定し、Pr,Pbを可変にすればよい。色域境界の外面RYGK上で格子点を移動させるためには、位置情報Pbを最小値に固定し、Pr,Pgを可変にすればよい。 The same applies to other outer surfaces of the color gamut boundary, and in order to move the lattice points on the outer surface MRKB of the color gamut boundary, the position information Pg is fixed to the minimum value, and Pr and Pb may be made variable. In order to move the grid point on the outer surface RYGK of the color gamut boundary, the position information Pb is fixed to the minimum value, and Pr and Pg may be made variable.
さらに、色域境界の外面YWCG上で格子点を移動させるためには、位置情報Pgを最大値に固定し、Pr,Pbを可変にすればよい。色域境界の外面WYRM上で格子点を移動させるためには、位置情報Prを最大値に固定し、Pg,Pbを可変にすればよい。色域境界の外面CGKB上で格子点を移動させるためには、位置情報Prを最小値に固定し、Pg,Pbを可変にすればよい。以上のように、最適化対象の格子点の位置によって変動させる位置情報を選択してSI2を極小化すると、その時点でのSEIを極小化させる位置情報が算出され、この処理を繰り返すことによって格子点位置を最適化したベクトルL'pを取得することができる。 Furthermore, in order to move the grid point on the outer surface YWCG of the color gamut boundary, the position information Pg may be fixed to the maximum value, and Pr and Pb may be made variable. In order to move the grid point on the outer surface WYRM of the color gamut boundary, the position information Pr is fixed to the maximum value, and Pg and Pb may be made variable. In order to move the grid point on the outer surface CGKB of the color gamut boundary, the position information Pr is fixed to the minimum value, and Pg and Pb may be made variable. As described above, when the position information to be changed depending on the position of the grid point to be optimized is selected and SI 2 is minimized, the position information that minimizes the SEI at that time is calculated, and this process is repeated. A vector L ′ p in which the position of the lattice point is optimized can be acquired.
図18は、CIELAB空間中で色域境界以外の内部に存在する格子点を最適化するためのSEI(SI3)を説明する説明図である。同図における破線は色域を2方向に切断した場合に形成される面上に存在する複数個の格子点同士を結ぶ直線である。また、最適化対象の格子点は黒丸で示し、その周囲の格子点は白丸で示している。本実施形態にて色域内部の格子点については色域の大きさを維持するための条件を課することなく自由に移動させる。そこで、本実施形態ではステップS310にて最適化対象として図18に黒丸で示す色域の内部に存在する格子点を抽出したときに、ステップS315では、当該最適化対象の格子点に対して6方で隣接する6個の格子点を抽出する。 FIG. 18 is an explanatory diagram for explaining SEI (SI 3 ) for optimizing lattice points existing inside the CIELAB space other than the color gamut boundary. The broken line in the figure is a straight line connecting a plurality of lattice points existing on the surface formed when the color gamut is cut in two directions. The optimization-targeted grid points are indicated by black circles, and the surrounding grid points are indicated by white circles. In the present embodiment, the lattice points inside the color gamut are moved freely without imposing conditions for maintaining the size of the color gamut. Therefore, in this embodiment, when a grid point existing within the color gamut indicated by a black circle in FIG. 18 is extracted as an optimization target in step S310, in step S315, 6 grid points for the optimization target grid point are extracted. 6 grid points adjacent to each other are extracted.
同図においても最適化対象の格子点をベクトルLpとして示しており、隣接格子点として抽出される格子点をベクトルLa1〜ベクトルLa6として示している。ここで、ベクトルLpは上記式(5)によって算出され、上記位置情報(Pr,Pg,Pb)を変数として表現される。色域の内部に存在する格子点を最適化するためのSEIは、ベクトルLpおよびベクトルLa1〜ベクトルLa6を利用し、以下に示す式(8)で表現される。
隣接する格子点を結ぶ線(図18ではベクトルLa1〜ベクトルLp〜ベクトルLa2が示す格子点を通る線等)が直線に近く、また格子点が均等に配置されるほど格子点配置が平滑化される傾向にあるので、式(8)に示すSI3を極小化することによって図18の右側に示すようにベクトルLpの格子点位置を最適化したベクトルL'pを取得することができる。 A line connecting adjacent lattice points (in FIG. 18, a line passing through the lattice points indicated by vector L a1 to vector L p to vector L a2, etc.) is closer to a straight line, and the lattice points are arranged more uniformly. Since it tends to be smoothed, the vector L ′ p in which the lattice point position of the vector L p is optimized as shown on the right side of FIG. 18 is obtained by minimizing SI 3 shown in the equation (8). Can do.
また、ベクトルLp,ベクトルLa1〜ベクトルLa6は位置情報(Pr,Pg,Pb)によって表現され、SI3においてはベクトルLpを与える位置情報(Pr,Pg,Pb)の総てを可変にしている。以上のように、位置情報を変動させてSI3を極小化すると、その時点でのSEIを極小化させる位置情報が算出され、この処理を繰り返すことによって格子点位置を最適化したベクトルL'pを取得することができる。 Further, the vector L p , the vector L a1 to the vector L a6 are expressed by position information (Pr, Pg, Pb), and in SI 3 , all the position information (Pr, Pg, Pb) that gives the vector L p is variable. I have to. As described above, when SI 3 is minimized by changing the position information, the position information that minimizes the SEI at that time is calculated, and the vector L ′ p that optimizes the lattice point position by repeating this process. Can be obtained.
以上の処理によりプロファイル生成部140がスムージングされたインクプロファイル144を作成すると、上述のプリンタルックアップテーブル180を作成する際の補間処理を容易にするために等間隔のルックアップテーブルを作成する。すなわち、スムージングされたインクプロファイル144では、Lab格子点配置が平滑化されているものの、格子点同士の間隔が必ずしも等間隔ではない。格子点同士の間隔が等間隔でない場合、プリンタルックアップテーブル180を作成する際に任意の補間点を補間するための格子点を探索しづらい。また、補間演算の処理自体も煩雑になる。
When the
そこで、本実施形態では、スムージングされたインクプロファイル144について補間演算を行って格子点間隔を等間隔にする。図19(A)〜図19(C)は、不等間隔補間を実施する際の例を説明する説明図である。図19(A)はCIELAB空間を示しており、図中の丸はスムージング後の格子点の位置を示し、網模様は細かなセルのグリッドを示している。このような補間によれば、等間隔のLab格子点に対応するインク量を算出することができる。図19(B)および図19(C)は、L*=23.8での補間前と補間後のLab格子点の例をそれぞれ示している。この不等間隔補間は、例えばMATLAB(MathWorks, Inc.の商標)のgriddata関数を用いて実行することができる。なお、不等間隔補間としては、非線形補間を用いても良く、あるいは線形補間を用いても良い。通常は、非線形補間の方が線形補間よりも精度が高く、処理速度は遅い傾向にある。
Therefore, in the present embodiment, interpolation processing is performed on the smoothed
以上のように、等間隔のLab格子とインク量との対応関係を規定した等間隔プロファイルを作成したら、図2に示すステップS50では、ガマットマッピング処理部160(図1)が、上述の等間隔プロファイルとsRGBプロファイル162とに基づいてガマットマッピングを行い、プリンタルックアップテーブル180を作成する。ガマットマッピングを行う理由は、プリンタで実現可能な色空間(「インク色空間」とも呼ぶ)の色域と、入力色空間(この実施形態ではsRGB空間)で実現可能な色域とに差があるためである。インク色空間の色域は上述の等間隔プロファイルで規定されており、入力色空間の色域はsRGBプロファイル162で規定されている。一般に、入力色空間とインク色空間には食い違いがあるので、入力色空間の色域をインク色空間の色域にマッピングする必要がある。
As described above, when the equally spaced profile that defines the correspondence between the equally spaced Lab lattice and the ink amount is created, in step S50 shown in FIG. 2, the gamut mapping processing unit 160 (FIG. 1) performs the above-described equally spaced. Gamut mapping is performed based on the profile and the
図20(A)および図20(B)は、ガマットマッピングの一例を示している。ここでは、いわゆるガマットクリッピングと呼ばれる方法が採用されている。具体的には、図20(A)に示すように、インク色空間の色域の外側にあるsRGB色空間の色は、色相を保った状態で彩度を低下させるようにマッピングされる。明度L*に関しては、インク色空間の明度範囲内にある色は、明度がそのまま維持される。インク色空間の明度の最大値Lmaxよりも大きな明度を有する色は、最大値Lmaxにマッピングされる。一方、インク色空間の明度の最小値Lminよりも大きな明度を有する色は、最小値Lminにマッピングされる。なお、ガマットマッピングの方法としては、従来から種々の方法が知られており、そのいずれの方法を採用してもよい。 20A and 20B show an example of gamut mapping. Here, a so-called gamut clipping method is employed. Specifically, as shown in FIG. 20A, the colors in the sRGB color space outside the color gamut of the ink color space are mapped so as to reduce the saturation while maintaining the hue. Regarding the lightness L *, the lightness of the color within the lightness range of the ink color space is maintained as it is. A color having a lightness greater than the maximum lightness value Lmax of the ink color space is mapped to the maximum value Lmax. On the other hand, a color having a lightness greater than the lightness minimum value Lmin of the ink color space is mapped to the minimum value Lmin. Various gamut mapping methods are conventionally known, and any of them may be adopted.
こうしてガマットマッピングが行われると、最終的なプリンタルックアップテーブル180が完成する。このルックアップテーブル180は、sRGBデータを入力とし、6種類のインクのインク量を出力とするルックアップテーブルである。このプリンタルックアップテーブル180をプリンタに実装すれば、色彩恒常性が高い(すなわち、異なる観察条件における色の見えの変化が小さな)印刷物を作成することが可能である。また、印刷物によって人間が感じる粒状性を抑えることが可能である。さらに、上述のスムージングの結果、トーンジャンプのない高画質な印刷物を得ることが可能である。 When gamut mapping is thus performed, the final printer lookup table 180 is completed. This lookup table 180 is a lookup table that receives sRGB data and outputs ink amounts of six types of ink. If this printer look-up table 180 is mounted on a printer, it is possible to create a printed matter with high color constancy (that is, a small change in color appearance under different viewing conditions). In addition, it is possible to suppress the graininess felt by humans by the printed matter. Furthermore, as a result of the above-described smoothing, it is possible to obtain a high-quality printed matter without tone jump.
なお、以上の実施形態では、sRGBとCMYKOGとの対応関係を規定するプリンタルックアップテーブル180を作成したが、むろん、プロファイルとしては他の形態を採用することも可能である。例えば、入力側の機器依存色を機器非依存色に変換するソースプロファイルと機器非依存色を出力側の機器依存色に変換するメディアプロファイルとを利用して色変換を行う構成において、メディアプロファイルの作成に本発明を適用することも可能である。この場合、スムージングされたインクプロファイル144から格子点を等間隔化し、これをLab空間でガマットマッピングすることによってメディアプロファイルを作成する。すなわち、スムージングされたインクプロファイル144から格子点を等間隔化したプロファイルが作成されるとプリンタのガマットが確定されるので、このガマット外に存在するCIELAB空間の格子点をガマット表面あるいはガマット内の格子点に対応づける。この結果作成されるプロファイルによれば、上記ソースファイルから得られる任意のCIELAB値をCMYKOG値に変換することが可能になる。
In the above embodiment, the printer lookup table 180 that defines the correspondence relationship between sRGB and CMYKOG is created, but other profiles can be adopted as a matter of course. For example, in a configuration that performs color conversion using a source profile that converts device-dependent colors on the input side to device-independent colors and a media profile that converts device-independent colors to device-dependent colors on the output side, It is also possible to apply the present invention to creation. In this case, a media profile is created by equalizing grid points from the smoothed
B.第2実施形態:
図21は、本発明の第2実施形態としてのシステム構成を示すブロック図である。図1に示した第1実施形態のシステムとの大きな違いは、参照カラーパッチ102を用いる点と、評価指数EIとして非色恒常性指数(CII)の代わりにメタメリズム指数(後述する)を含む指数を使用する点である。
B. Second embodiment:
FIG. 21 is a block diagram showing a system configuration as the second embodiment of the present invention. The major difference from the system of the first embodiment shown in FIG. 1 is that the
図22は、第2実施形態の処理手順を示すフローチャートである。ステップS400では、分光プリンティングモデルを決定してコンバータ100を作成する。このステップは、図2のステップS10と同じである。ステップS405では、複数の比較色を準備する。図21の例では、複数の比較色を与えるための原画として参照カラーパッチ102を準備し、これらの参照カラーパッチ102の分光反射率Rref(λ)を図示しない分光反射率計で測定する。なお、参照カラーパッチ102は、複数のカラーパッチを含んでいるオリジナルカラーパッチである。参照カラーパッチ102の代わりに、例えば絵画から複数の比較色を取得するようにしてもよい。なお、参照カラーパッチ102や絵画から得られる色を「参照色」とも呼ぶ。ステップS410では、比較色算出部124aが、参照色(比較色)の分光反射率Rref(λ)を用いて、複数の観察条件における測色値CV2をそれぞれ算出する。本実施形態では、複数の観察条件として3種類の標準の光D50,F11,Aを用いる。
FIG. 22 is a flowchart illustrating a processing procedure according to the second embodiment. In step S400, the spectral printing model is determined and the
ステップS415では、各比較色に対して、その比較色と条件等色度が高いと期待される複数の仮想サンプル(サンプルインク量データ)を準備する。ここで条件等色度とは、一対の物体色(サンプル色と比較色)を複数の照明光下で観察したときの条件等色の安定性(いわゆる照明光条件等色度)を意味している。ステップS420では、これらの仮想サンプルに対する測色値CV1を算出する。具体的には、第1実施形態と同様に、各仮想サンプルのインク量データを分光プリンティングモデルコンバータ100で分光反射率Rsmp(λ)に変換し、この分光反射率Rsmp(λ)を用いて、比較色対して用いたのと同じ複数の観察条件における測色値CV1をそれぞれ算出する。
In step S415, for each comparative color, a plurality of virtual samples (sample ink amount data) that are expected to have high chromaticity with the comparative color and conditions are prepared. Here, the condition isochromaticity means the stability of the condition isochromatic color (so-called illumination light condition isochromaticity) when a pair of object colors (sample color and comparison color) are observed under a plurality of illumination lights. Yes. In step S420, a colorimetric value CV1 for these virtual samples is calculated. Specifically, as in the first embodiment, the ink amount data of each virtual sample is converted into the spectral reflectance Rsmp (λ) by the spectral
ステップS425では、次の(9)式で表される評価指数EI2を設定する。
![]()
![]()
MIiは、例えば以下の(10)式で表現される。
このメタメリズム指数MIiは、i番目の照明光下におけるサンプル色と比較色の色差である。ΔL* ,ΔC*ab ,およびΔH*ab は、それぞれ、i番目の照明光かにおけるサンプル色と比較色の明度差、彩度差、色相差である。従って、上記(9)式の右辺第1項は、照明光条件等色度を表す指数であることが理解できる。メタメリズム指数については、Billmeyer and Saltzman's Principles of Color Technology, 3rd edition, John Wiley & Sons, Inc, 2000, p.127, p.211-213を参照。 The metamerism index MIi is a color difference between the sample color and the comparison color under the i-th illumination light. ΔL *, ΔC * ab , and ΔH * ab are the brightness difference, saturation difference, and hue difference between the sample color and the comparison color in the i-th illumination light, respectively. Therefore, it can be understood that the first term on the right side of the above equation (9) is an index representing the chromaticity of the illumination light condition. For metamerism indices, see Billmeyer and Saltzman's Principles of Color Technology, 3rd edition, John Wiley & Sons, Inc, 2000, p.127, p.211-213.
上述した(2)式と(10)式とを比較すれば理解できるように、MIを与える式としては、CIIを与える式と同じ色差式を用いることができる。MIとCIIとの違いは、前者は2つの物体色を同一の観察条件下で観察したときの色の差であり、後者は1つの物体色を異なる観察条件下で観察したときの色の差である点である。なお、MIの算出に使用する色差式として(10)式以外の式を用いることも可能である。 As can be understood by comparing the above-described formulas (2) and (10), the same color difference formula as the formula that gives CII can be used as the formula that gives MI. The difference between MI and CII is that the former is the difference in color when two object colors are observed under the same observation conditions, and the latter is the difference in color when one object color is observed under different observation conditions. It is a point. It is also possible to use an expression other than the expression (10) as the color difference expression used for calculating MI.
ステップS340では、評価指数生成部120aが、各サンプルに対する評価指数EI2を算出する。GIの算出法は上記図5,図10に示す方法と同じである。評価指数EI2を算出すると、選択部130がこの評価指数EI2に応じて各参照色に対する最良のサンプルを選択する。ステップS435では、各参照色に対して選択されたサンプルを用いて、スムージングされたインクプロファイル144およびプリンタルックアップテーブル180が生成される。このステップS435は、図2のステップS40〜S50とほぼ同じ処理である。なお、絵画を忠実に再現するためのルックアップテーブとして、例えば絵画の色の色番号を入力とし、インク量を出力とするテーブルを作成してもよい。この場合には、ステップS45のスムージング処理やステップS50のガマットマッピングは省略可能である。
In step S340, the evaluation
このように、第2実施形態では、メタメリズム指数MIを含む評価指数EI2を用いて、サンプルインク量データの中から高い評価値を有するものを選択し、選択されたサンプルインク量データに基づいてインクプロファイルを作成する。この結果、種々の異なる観察条件下において参照色との色差が小さな色を有する印刷物を作成可能な色変換プロファイルを作成することができる。また、評価指数にGIが含まれているので、印刷物によって人間が感じる粒状性を抑えることが可能である。さらに、上述のスムージングの結果、トーンジャンプのない高画質な印刷物を得ることが可能である。この第2実施形態は、特に、原画を忠実に再現するための色変換プロファイルの作成に有用である。
また、第1実施形態で用いた非色恒常性指数CIIは異なる観察条件下での色差を表しており、第2実施形態で用いたメタメリズム指数MIも色差を表している。従って、第1および第2実施形態で用いた評価指数EIの第1項は、いずれも2つの色の色差を表す指数を含んでいることが理解できる。
As described above, in the second embodiment, the evaluation index EI 2 including the metamerism index MI is used to select one having a high evaluation value from the sample ink amount data, and based on the selected sample ink amount data. Create an ink profile. As a result, it is possible to create a color conversion profile that can create a printed matter having a color with a small color difference from the reference color under various different observation conditions. Moreover, since GI is included in the evaluation index, it is possible to suppress the graininess felt by humans by the printed matter. Furthermore, as a result of the above-described smoothing, it is possible to obtain a high-quality printed matter without tone jump. This second embodiment is particularly useful for creating a color conversion profile for faithfully reproducing an original image.
Further, the non-color constancy index CII used in the first embodiment represents a color difference under different observation conditions, and the metamerism index MI used in the second embodiment also represents a color difference. Therefore, it can be understood that the first term of the evaluation index EI used in the first and second embodiments includes an index representing the color difference between the two colors.
C.第3実施形態:
図23は、本発明の第3実施形態としてのシステム構成を示すブロック図である。図1に示した第1実施形態のシステムとの大きな違いは、選択部130aが基準判定部200を含む点と、サンプルデータ修正部210が追加されている点である。この第3実施形態では、あるサンプルが所定の評価基準を満たさない場合には、サンプルデータ修正部210がそのサンプルインク色データを修正し、修正されたサンプルインク色データに対する評価指数EIの算出が再度実行される。そして、評価基準を満足したサンプルを利用して、色変換プロファイルが作成される。
C. Third embodiment:
FIG. 23 is a block diagram showing a system configuration as a third embodiment of the present invention. A major difference from the system of the first embodiment shown in FIG. 1 is that the
図24は、第3実施形態の処理手順を示すフローチャートである。ステップS500では、分光プリンティングモデルを作成する。このステップS500は、図2のステップS10と同じものである。ステップS505では、CIELAB空間を複数のセルに分割する。ここでは、第1実施形態のステップS25で使用されたものと同じ16×16×16個のセル分割を利用できる。 FIG. 24 is a flowchart illustrating a processing procedure according to the third embodiment. In step S500, a spectral printing model is created. This step S500 is the same as step S10 in FIG. In step S505, the CIELAB space is divided into a plurality of cells. Here, the same 16 × 16 × 16 cell division as that used in step S25 of the first embodiment can be used.
ステップS510では、サンプルの良否を決定するための評価指数EIを設定する。第3実施形態では、第1実施形態の評価指数EI1=f(CII,GI)を利用する。この代わりに、第2実施形態の評価指数EI2=f(MI,GI)を用いることも可能である。 In step S510, an evaluation index EI for determining the quality of the sample is set. In the third embodiment, the evaluation index EI 1 = f (CII, GI) of the first embodiment is used. Instead, the evaluation index EI 2 = f (MI, GI) of the second embodiment can be used.
ステップS515〜S530は、各セル毎に1つの代表サンプルを選択するための再帰的ルーチンである。ステップS515では、CIELAB空間内の1つのセルを処理対象(対象セル)として選択し、その対象セルにおける初期サンプルインク量データを設定する。この初期サンプルインク量データは、そのインク量データに応じて印刷されるサンプル色の測色値(L*a*b*値)が、対象セル内に存在するものである。サンプル色の測色値は、第1の観察条件(例えば標準の光D50およびCIE1931 2°観測者)で算出される。設定された初期サンプルインク量データの測色値が対象セル内に入っていない場合には、対象セル内の測色値が得られるまで初期線プルインク量データが修正される。 Steps S515 to S530 are a recursive routine for selecting one representative sample for each cell. In step S515, one cell in the CIELAB space is selected as a processing target (target cell), and initial sample ink amount data in the target cell is set. In this initial sample ink amount data, a colorimetric value (L * a * b * value) of a sample color printed according to the ink amount data exists in the target cell. The colorimetric value of the sample color is calculated under the first observation condition (for example, standard light D50 and CIE 1931 2 ° observer). If the colorimetric value of the set initial sample ink amount data is not in the target cell, the initial line pull ink amount data is corrected until the colorimetric value in the target cell is obtained.
なお、セルによっては、セル内の測色値を与えるようなインク量データが存在しない場合がある。例えば、高明度または低明度で彩度が高いセルの色は再現できない。このような場合には、そのセルは、処理の対象外としてその後の処理から除外される。 Depending on the cell, there may be no ink amount data that gives a colorimetric value in the cell. For example, the color of a cell with high or low brightness and high saturation cannot be reproduced. In such a case, the cell is excluded from the subsequent processing as being out of the processing target.
ステップS520では、評価指数算出部120が、初期サンプルインク量データの評価指数EIを算出する。この評価指数EIは、例えば上記(2)式に従って算出される。ステップS520では、基準判断部200が、評価指数EIが予め設定された評価基準を満足するか否かを判断する。評価基準としては、例えば、以下の(11)式を用いることができる。
![]()
![]()
上記(11)式を用いる場合には、評価指数EIが許容上限値δ以下の場合に基準を満足するものと判定される。なお、1つの評価指数EIを使用する代わりに、1つのサンプルインク量データに関して複数種類の異なる評価指数を算出し、各評価指数がそれぞれの評価基準をすべて満足する場合に、そのサンプルインク量データが基準を満足すると判断するようにしてもよい。 When the above equation (11) is used, it is determined that the criterion is satisfied when the evaluation index EI is equal to or less than the allowable upper limit value δ. In addition, instead of using one evaluation index EI, when a plurality of different evaluation indexes are calculated for one sample ink amount data and each evaluation index satisfies all the evaluation criteria, the sample ink amount data May be determined to satisfy the criteria.
初期サンプルインク量データが評価基準を満足しない場合には、ステップS530においてサンプルデータ修正部210が初期サンプルインク量データを修正する。このとき、修正後のサンプルインク量データに関しては、以下のようないくつかの制限条件を付けることが好ましい。
(制限条件1):修正後のサンプルインク量データで与えられる測色値が、対象セル内にある。
(制限条件2):修正後のサンプルインク量データで表されるインク量が、インクデューティ制限値を満足する。
If the initial sample ink amount data does not satisfy the evaluation criteria, the sample
(Restriction condition 1): The colorimetric value given by the corrected sample ink amount data is in the target cell.
(Restriction condition 2): The ink amount represented by the corrected sample ink amount data satisfies the ink duty limit value.
制限条件1は、対象セルに対する代表サンプルを求めるために必要な条件である。制限条件2は、修正後のサンプルインク量データが、現実の印刷に使用できるインク量を表すことを保証するための条件である。なお、インクデューディ制限値とは、印刷媒体上の単位面積当たりに吐出可能なインク量であり、インクの滲みを考慮して印刷媒体の種類毎に予め設定される。通常のインクデューティ制限値は、各インクのインク量の最大値と、全インクの合計インク量の最大値とを含んでいる。なお、上記制限条件1,2以外の制限条件を追加するようにしてもよい。
The
こうしてサンプルインク量データが修正されると、修正されたサンプルインク量データを用いて上述したステップS520,S525の処理が再度実行される。こうして、ステップS520〜S530の処理が再帰的に実行され、評価基準を満たすサンプルが、その対象セルに対する代表サンプルとして選択される。なお、ある対象セルに関する再帰的処理を所定回行っても評価基準を満足するサンプルが得られない場合も考えられる。この場合には、その対象セルに関してそれまで調べられた複数のサンプルの中で、最も評価基準に近いサンプル(最も評価指数の良いサンプル)を代表サンプルとして選択してもよい。あるいは、その対象セルに関しては代表サンプルを選択しないものとしてもよい。 When the sample ink amount data is corrected in this way, the processes of steps S520 and S525 described above are executed again using the corrected sample ink amount data. In this way, the processing of steps S520 to S530 is recursively executed, and a sample that satisfies the evaluation criteria is selected as a representative sample for the target cell. Note that there may be a case where a sample satisfying the evaluation criteria cannot be obtained even if a recursive process related to a certain target cell is performed a predetermined number of times. In this case, the sample closest to the evaluation criterion (the sample with the best evaluation index) may be selected as the representative sample among the plurality of samples that have been examined so far for the target cell. Alternatively, no representative sample may be selected for the target cell.
ステップS535では、すべてのセルに関する処理が完了したか否かが判断され、完了していなければステップS515に戻り、次のセルに関する処理を開始する。こうして、すべてのセルに関して処理が終了すると、ステップS540において、選択された代表サンプルを用いてスムージングされたインクプロファイル144およびプリンタルックアップテーブル180が作成される。このステップS540の処理は、図2のステップS40〜S50と同じものである。
In step S535, it is determined whether or not processing for all cells has been completed. If not, processing returns to step S515 and processing for the next cell is started. Thus, when the processing is completed for all the cells, the
このように、第3実施形態では、所定の測色値の色空間(上記の例ではCIELAB色空間)を複数のセルに分割し、所定の評価基準を満足する代表サンプルを各セル毎に再帰的に追求し、これらの代表サンプルを用いてプロファイルやルックアップテーブルを作成する。従って、第1実施形態に比べて、1つもサンプルを含まないセルの数を低減することができる。この結果、より広い色域を有するプリンタルックアップテーブル180を得ることができる。また、色再現特性の点でもより優れたプリンタルックアップテーブル180を得ることが可能である。 As described above, in the third embodiment, a color space of a predetermined colorimetric value (CIELAB color space in the above example) is divided into a plurality of cells, and a representative sample that satisfies a predetermined evaluation criterion is recursed for each cell. In pursuit of this, profiles and lookup tables are created using these representative samples. Therefore, compared to the first embodiment, the number of cells that do not include any sample can be reduced. As a result, the printer lookup table 180 having a wider color gamut can be obtained. Further, it is possible to obtain a printer look-up table 180 that is superior in terms of color reproduction characteristics.
D.第4実施形態:
上述のように、評価指数は色差評価指数CDIと画質評価指数IQIのみならず、他の評価指数を加えても良い。例えば、以下の(12)式のようにインク量を評価する評価指数を加えても良い。
![]()
As described above, the evaluation index may include not only the color difference evaluation index CDI and the image quality evaluation index IQI but also other evaluation indexes. For example, an evaluation index for evaluating the ink amount may be added as in the following equation (12).
![]()
ここで、k1〜k3はCIIとGIとTink の評価指数に対する寄与の大きさを調整するための係数である。また、Tinkは、そのサンプルで使用されるインク量の合計値である。例えば、6種類のインクのインク量がすべて20%のときには、Tinkの値は120%=1.2になる。合計インク量Tinkは画質とかなりの相関があり、合計インク量Tinkが少ないほど画質が良い可能性がある。従って、(12)式は、CII,GIがほぼ同じ場合に、合計インク量Tinkが少ないほど良好な(すなわち小さな)評価指数EI1が得られる式となっている。 Here, k 1 to k 3 are coefficients for adjusting the magnitude of contribution to the evaluation index of CII, GI, and Tink. Also, Tink is the total amount of ink used in the sample. For example, when the ink amounts of six types of ink are all 20%, the value of Tink is 120% = 1.2. The total ink amount Tink has a considerable correlation with the image quality, and the smaller the total ink amount Tink, the better the image quality. Therefore, the expression (12) is an expression that, when CII and GI are substantially the same, a better (that is, smaller) evaluation index EI 1 is obtained as the total ink amount Tink is smaller.
E.第5実施形態:
格子点の平滑程度を評価する指数SIは上述のように評価指数EI1と別個に算出する構成に限られない。すなわち、平滑程度評価指数SIを評価指数EI1の一部とする構成を採用可能である。
EI1 = k1・CII + k2・GI + k3・SI …(13a)
E. Fifth embodiment:
The index SI for evaluating the degree of smoothness of the grid points is not limited to the configuration calculated separately from the evaluation index EI 1 as described above. That is, a configuration in which the smoothness degree evaluation index SI is part of the evaluation index EI 1 can be employed.
EI 1 = k 1・ CII + k 2・ GI + k 3・ SI… (13a)
ここで、k1〜k3はCIIとGIとSIと の評価指数に対する寄与の大きさを調整するための係数である。また、SIは、一旦、サンプルの平滑程度を評価する指数であり、平滑化されるほど値が小さくなる。従って、(13a)式は、CII,GIがほぼ同じ場合に、平滑化されるほど良好な(すなわち小さな)評価指数EI1が得られる式となっている。 Here, k 1 to k 3 are coefficients for adjusting the magnitude of contribution of CII, GI, and SI to the evaluation index. Moreover, SI is an index for once evaluating the degree of smoothness of a sample, and the value becomes smaller as smoothing is performed. Therefore, the expression (13a) is an expression that can obtain an evaluation index EI 1 that is better (that is, smaller) as it is smoothed when CII and GI are substantially the same.
この実施形態は、図1に示す第1実施形態とほぼ同様の構成によって実現可能であるが、スムージング処理は評価指数算出部126によって実施され、プロファイル生成部140においてはスムージングを実施しない。一実施例では、上記(13a)式によってSIを評価する前に、(13a)式の第1項および第2項によって初期サンプルセットを選択し、初期サンプルセットを利用してSIを算出してスムージングされたインク量データを選択する。具体的には、図25に示すフローチャートに沿って処理を行う。すなわち、上記第1実施形態と同様の処理によって評価指数算出部126で評価指数を算出し、ステップS550では、選択部130が(1)式を最小化するサンプルを選択し、これを初期サンプルセットとする。これらの初期サンプルセットはステップS55以降の繰り返し処理における初回のばかし対象となる。すなわち、この実施形態では、CIELAB空間において3次元ガウス関数(Gaussian function)によるぼかし処理が行われる。ガウス関数は、CIELAB空間中の対象サンプルとこれに近い他のサンプルのサンプルインク量に関する重みを与える。そして、インク量に重み係数値を乗じた値を足し合わせ、重み係数値の合計で規格化を行って、対象サンプルに対するスムージングされたサンプルインク量を得る。ステップS560では、色域外にてインク量が“0”に落ち込むことを防止するためにリスケーリング処理が実施される。すなわち、各インク量データは各色のインク量データの最大値によって除される。このリスケーリング処理はスムージング処理における繰り返しにおいてガマット内のインク量が低減してしまうことを防止するために実施される。
Although this embodiment can be realized by a configuration substantially similar to that of the first embodiment shown in FIG. 1, the smoothing process is performed by the evaluation
ステップS565では、以下の(13b)式によって、各インク量データについて上記ぼかしがなされる前のインク量格子点とぼかしがなされた後のインク量格子点との距離を算出し、SIとする。
上述のステップS555〜S570を所定回数繰り返す(S575)。この繰り返し処理において、上記(13a)式で選択されたインク量データは3次元ガウス関数によってぼかし処理が施される。そして、選択部130は、以上のような繰り返し処理の最後で算出された(13a)式に基づいて、各セル内でもっとも評価指数が小さなサンプルを選択し、これをスムージングされたサンプルとする。プロファイル生成部140は、ステップS580において、このサンプルに基づいてインクプロファイル142を算出し、ガマットマッピング処理部160はこのインクプロファイル142と、予め準備されたsRGBプロファイル162とを用いて、プリンタルックアップテーブル180を作成する。
The above steps S555 to S570 are repeated a predetermined number of times (S575). In this iterative process, the ink amount data selected by the above equation (13a) is subjected to a blurring process using a three-dimensional Gaussian function. Then, the
この実施形態によれば、プロファイル生成部140において再帰演算を実施することなくスムージングされたプロファイルを作成することが可能になる。また、上記インクプロファイル142からプリンタルックアップテーブル180を作成するに際して、サンプル数を増加させても良い。この場合、プロファイル生成部140が、代表サンプルに基づいて不等間隔補間(non-uniform interpolation)を行うことによって、予備インクプロファイルを作成する。この予備インクプロファイルは、CIELAB測色値をインク量に変換する色変換ルックアップテーブルである。「予備的」という接頭語は、ステップS25で分割された比較的粗いセルに関するプロファイルであることを意味している。なお、この不等間隔補間は、例えばMATLAB(MathWorks, Inc.の商標)のgriddata関数を用いて実行することができる。一実施例としては、CIELAB空間の64×64×64個程度のグリッド点を有する予備プロファイルが挙げられる。
According to this embodiment, the
そして、プロファイル生成部140は、予備プロファイルを線形補間することによって、最終インクプロファイル142を作成する。この最終インクプロファイル142は、予備プロファイルよりもさらに細かなセルのグリッド点を入力とするプロファイルである。一実施例としては、CIELAB空間の256×256×256個のグリッド点を入力とするプロファイルが挙げられる。上述したように、予備プロファイルはCIELAB空間の64×64×64個のグリッド点を入力としているので、予備プロファイルを線形補間することによって最終インクプロファイル142を容易に得ることができる。
Then, the
最終インクプロファイル142として、256×256×256個のグリッド点を入力とするプロファイルを作成すれば、CIELABのすべての入力値に対するインク量を直ちに得ることができる。従って、その後のルックアップテーブルの作成に要する処理時間を短縮することができる。但し、最終インクプロファイル142の代わりに予備インクプロファイルを用いて、後述するプリンタルックアップテーブル180を作成することも可能である。なお、この実施形態についてはCDIとしてCIIを採用している例を説明したが、むろん、CDIとしてはCIIに限られずMIであっても良い。
If a profile having 256 × 256 × 256 grid points as input is created as the
F.分光プリンティングモデルの一例:
以下では、分光プリンティングモデルの一例としてセル分割ユール・ニールセン分光ノイゲバウアモデル(Cellular Yule-Nielsen Spectral Neugebauer Model)を説明する。このモデルは、よく知られた分光ノイゲバウアモデルとユール・ニールセンモデルとに基づいている。なお、以下の説明では、CMYの3種類のインクを用いた場合のモデルについて説明するが、これを任意の複数のインクを用いたモデルに拡張することは容易である。分光ノイゲバウアモデルとユール・ニールセンモデルについては、Color Res Appl 25, 4-19, 2000, R Balasubramanian, Optimization of the spectral Neugebauer model for printer characterization, J. Electronic Imaging 8(2), 156-166 (1999),を参照。
F. An example of a spectral printing model:
Hereinafter, a Cellular Yule-Nielsen Spectral Neugebauer Model will be described as an example of a spectral printing model. This model is based on the well-known spectroscopic Neugebauer model and the Yule-Nielsen model. In the following description, a model using three types of CMY inks will be described, but it is easy to extend this to a model using a plurality of arbitrary inks. For the spectral Neugebauer model and the Yule-Nielsen model, see
図26は、分光ノイゲバウアモデルを示す図である。分光ノイゲバウアモデルでは、任意の印刷物の分光反射率R(λ)は、以下の(14)式で与えられる。
インク被覆率fc,fm,fyは、図26(B)に示すマーレイ・デービスモデルで与えられる。マーレイ・デービスモデルでは、例えばシアンインクの面積率fcは、シアンのインク吐出量dcの非線形関数であり、1次元ルックアップテーブルの形で与えられる。インク被覆率がインク吐出量の非線形関数となる理由は、単位面積に少量のインクが吐出された場合にはインクが十分に広がるが、多量のインクが吐出された場合にはインクが重なり合うためにインクで覆われる面積があまり増加しないためである。 The ink coverage ratios fc, fm, and fy are given by the Murray-Davis model shown in FIG. In the Murray-Davis model, for example, the area ratio fc of cyan ink is a nonlinear function of the cyan ink discharge amount dc, and is given in the form of a one-dimensional lookup table. The reason why the ink coverage is a nonlinear function of the ink discharge amount is that the ink spreads sufficiently when a small amount of ink is discharged per unit area, but the ink overlaps when a large amount of ink is discharged. This is because the area covered with ink does not increase so much.
分光反射率に関するユール・ニールセンモデルを適用すると、上記(14)式は以下の(15a)式または(15b)式に書き換えられる。
セル分割ユール・ニールセン分光ノイゲバウアモデル(Cellular Yule-Nielsen Spectral Neugebauer Model)は、上述したユール・ニールセン分光ノイゲバウアモデルのインク色空間を複数のセルに分割したものである。 The cell division Yule-Nielsen Spectral Neugebauer model is obtained by dividing the ink color space of the above-described Yule-Nielsen Spectral Neugebauer model into a plurality of cells.
図27(A)は、セル分割ユール・ニールセン分光ノイゲバウアモデルにおけるセル分割の例を示している。ここでは、簡単のために、シアンのインク被覆率fcとマゼンタのインク被覆率fmの2つの軸を含む2次元空間でのセル分割を描いている。なお、これらの軸fc,fmは、インク吐出量dc,dmを示す軸と考えることもできる。白丸は、セル分割のグリッド点(「ノード」と呼ぶ)であり、2次元空間が9つのセルC1〜C9に分割されている。16個のノードにおける印刷物(カラーパッチ)に対しては、分光反射率R00, R10, R20, R30, R01, R11…R33がそれぞれ予め決定される。 FIG. 27A shows an example of cell division in the cell division Yule-Nielsen spectroscopic Neugebauer model. Here, for the sake of simplicity, a cell division in a two-dimensional space including two axes of a cyan ink coverage fc and a magenta ink coverage fm is depicted. These axes fc and fm can also be considered as axes indicating the ink discharge amounts dc and dm. White circles are cell division grid points (called “nodes”), and the two-dimensional space is divided into nine cells C1 to C9. Spectral reflectances R00, R10, R20, R30, R01, R11,..., R33 are determined in advance for printed matter (color patches) at 16 nodes.
図27(B)は、このセル分割に対応するインク被覆率fc(d)の形状を示している。ここでは、1種類のインクのインク量の範囲0〜dmaxが3つの区間に分割されており、インク被覆率fc(d)は、各区間毎に0から1まで単調に増加する曲線によって表されている。
FIG. 27B shows the shape of the ink coverage fc (d) corresponding to this cell division. Here, the
図27(C)は、図27(A)の中央のセルC5内にあるサンプルの分光反射率Rsmp(λ)の算出方法を示している。分光反射率Rsmp(λ)は、以下の(16)式で与えられる。
このように、インク色空間を複数のセルに分割すれば、分割しない場合に比べてサンプルの分光反射率Rsmp(λ)をより精度良く算出することができる。図28は、一実施例で採用されたセル分割のノード値を示している。この例に示されているように、セル分割のノード値は、各インク毎に独立に設定することが好ましい。 Thus, if the ink color space is divided into a plurality of cells, the spectral reflectance Rsmp (λ) of the sample can be calculated with higher accuracy than when the ink color space is not divided. FIG. 28 shows cell division node values employed in one embodiment. As shown in this example, it is preferable that the node value of cell division is set independently for each ink.
ところで、図27(A)に示すモデルにおいて、すべてのノードにおける分光反射率をカラーパッチの測定で得ることはできないのが普通である。この理由は、多量のインクを吐出すると滲みが発生してしまい、均一な色のカラーパッチを印刷できないからである。図29は、測定できない分光反射率を求める方法を示している。これは、シアンとマゼンタの2種類のインクのみを使用する場合の例である。シアンとマゼンタの2種類のインクで印刷される任意のカラーパッチの分光反射率R(λ)は、以下の(17)式で与えられる。
上記(17)式に含まれる複数のパラメータのうちで、シアンインクとマゼンタインクの両方が100%吐出量であるときの分光反射率Rb(λ)のみが未知であり、他のパラメータの値は既知であると仮定する。このとき、(17)式を変形すれば、以下の(18)式が得られる。
上述したように右辺の各項はすべて既知である。従って、(18)式を解くことによって、未知の分光反射率Rb(λ)を算出することができる。この分光反射率の見積もりにつては、R Balasubramanian, "Optimization of the spectral Neugebauer model for printer characterization", J. Electronic Imaging 8(2), 156-166 (1999)を参照。 As described above, all the terms on the right side are known. Therefore, the unknown spectral reflectance Rb (λ) can be calculated by solving the equation (18). For estimation of this spectral reflectance, see R Balasubramanian, “Optimization of the spectral Neugebauer model for printer characterization”, J. Electronic Imaging 8 (2), 156-166 (1999).
シアンとマゼンタの2次色以外の他の2次色の分光反射率も同様にして求めることが可能である。また、複数の2次色の分光反射率が求まれば、複数の3次色の分光反射率も同様にして求めることができる。こうして、高次の分光反射率を順次求めてゆくことによって、セル分割されたインク色空間の各ノードにおける分光反射率をすべて求めることが可能である。 Spectral reflectances of secondary colors other than the cyan and magenta secondary colors can be obtained in the same manner. If the spectral reflectances of a plurality of secondary colors are obtained, the spectral reflectances of a plurality of tertiary colors can be obtained in the same manner. In this way, by sequentially obtaining higher-order spectral reflectances, it is possible to obtain all the spectral reflectances at each node in the ink color space divided into cells.
図1に示す分光プリンティングコンバータ100は、図27(A)に示すようにセル分割されたインク色空間の各ノードにおける分光反射率の値と、図27(C)に示すインク被覆率を示す1次元ルックアップテーブルとを有しており、これらを用いて任意のサンプルインク量データに対する分光反射率Rsmp(λ)を算出するように構成されている。
The
なお、一般に、印刷されたカラーパッチの分光反射率は、インクセットと印刷媒体とに依存する。従って、図1に示す分光プリンティングモデルコンバータ100は、インクセットと印刷媒体との組合せ毎に作成される。また、インクプロファイル142やプリンタルックアップテーブル180も、インクセットと印刷媒体との組合せ毎に作成される。
In general, the spectral reflectance of the printed color patch depends on the ink set and the print medium. Accordingly, the spectral
G.変形例:
G1.変形例1:
上記実施形態では、インクとしてCMYKOGの6種類のインクを用いていたが、インクの種類としてはこれに限らず、任意の複数種類のインクを使用することができる。但し、オレンジインクやグリーンインクのように、基本インク色CMYKの2次色に相当する色を有するインクを利用すれば、再現可能な分光反射率の形状の自由度がより大きくなる点で好ましい。
G. Variations:
G1. Modification 1:
In the above embodiment, six types of CMYKOG ink are used as the ink. However, the type of ink is not limited to this, and any of a plurality of types of ink can be used. However, it is preferable to use an ink having a color corresponding to the secondary colors of the basic ink colors CMYK, such as orange ink and green ink, in that the degree of freedom in the shape of the reproducible spectral reflectance is increased.
G2.変形例2:
上述した第1ないし第3実施形態では、測色値の色空間を複数のセルに分割し、各セルにおいて評価指数EIが最良であるサンプルを代表サンプルとして選択し、一方、第3実施形態では、各セルに対して評価指数EIが所定の基準を満足するようにサンプルを最適化することによって代表サンプルを決定していた。しかし、色変換プロファイルを作成する際に用いる複数の代表サンプルを選択する方法は、これらに限らず、一般には、評価指数EIに基づいて複数の代表サンプルを選択することが可能である。例えば、測色値の色空間を複数のセルに分割せずに複数の代表サンプルを選択することも可能である。具体的には、測色値の色空間内で複数のグリッド点(ノード)を設定し、各ノードの近傍において所定の評価基準を満足するサンプルをそのノードの代表サンプルとして選択することができる。
G2. Modification 2:
In the first to third embodiments described above, the color space of the colorimetric value is divided into a plurality of cells, and the sample having the best evaluation index EI in each cell is selected as the representative sample, whereas in the third embodiment, The representative sample is determined by optimizing the sample so that the evaluation index EI satisfies a predetermined criterion for each cell. However, the method of selecting a plurality of representative samples used when creating a color conversion profile is not limited to these, and generally, a plurality of representative samples can be selected based on the evaluation index EI. For example, it is possible to select a plurality of representative samples without dividing the color space of the colorimetric values into a plurality of cells. Specifically, a plurality of grid points (nodes) can be set in the color space of the colorimetric values, and a sample that satisfies a predetermined evaluation criterion in the vicinity of each node can be selected as a representative sample of that node.
G3.変形例3:
上述のGIを算出する際には、ドット形状データによって各ノズルから吐出されるインクが印刷媒体に記録される際の形状をシミュレートしていたが、さらにキャリッジに形成されるノズルからインクを吐出する際のインク吐出特性を加味してシミュレートを行っても良い。例えば、各ノズルから吐出されたインクが基準のドット形成位置からずれるずれ量を予めデータ化しておけば、各インク滴が記録される位置の誤差を考慮してドット形成位置を微調整し、記録状態データを作成することができる。
G3. Modification 3:
When calculating the above-mentioned GI, the shape when ink ejected from each nozzle is recorded on the print medium is simulated by the dot shape data, but ink is further ejected from the nozzle formed on the carriage. The simulation may be performed in consideration of the ink ejection characteristics at the time. For example, if the amount of deviation of the ink discharged from each nozzle from the reference dot formation position is converted into data in advance, the dot formation position is finely adjusted in consideration of the error in the position where each ink droplet is recorded, and the recording is performed. State data can be created.
図30は、このデータの例を説明する説明図である。図30に示すドット位置データは、上記キャリッジに形成された複数のノズル毎に、基準の位置からのずれをサブ画素単位で記述したデータである。すなわち、同じ条件でインク滴を吐出した場合であっても複数のノズル同士ではインク滴の記録位置に誤差が生じる。そこで、プリンタにおいて各ノズルからインクを吐出させて記録位置を計測し、ずれ量を示すデータとする。このとき、あるノズルにおける記録位置を基準のドット形成位置とし、この基準のドット形成位置にドットを形成するノズルは主走査方向のずれ(X)と副走査方向のずれ(Y)とがともに”0”であるとする。図30に示す例においては、上記画素の中心が基準のドット形成位置になるようにしている。 FIG. 30 is an explanatory diagram for explaining an example of this data. The dot position data shown in FIG. 30 is data describing the deviation from the reference position in units of sub-pixels for each of a plurality of nozzles formed on the carriage. That is, even when ink droplets are ejected under the same conditions, an error occurs in the ink droplet recording position between a plurality of nozzles. Therefore, ink is ejected from each nozzle in the printer and the recording position is measured to obtain data indicating the amount of deviation. At this time, a recording position at a certain nozzle is set as a reference dot formation position, and a nozzle that forms a dot at the reference dot formation position has both a deviation (X) in the main scanning direction and a deviation (Y) in the sub-scanning direction. Assume that it is 0 ″. In the example shown in FIG. 30, the center of the pixel is the reference dot formation position.
基準のドット形成位置からずれが生じる場合には、主走査方向および副走査方向につき、そのずれ量に相当するサブ画素をドット位置データとして記述する。なお、このドット位置データは、ノズル毎に記述されるので各インク色毎にずれが記述される。このドット位置データを用いてシミュレーション処理を行うための構成および処理フローは上記図5,図10とほぼ同様であるが、ステップS130における処理が異なっている。 When a deviation occurs from the reference dot formation position, the sub-pixel corresponding to the deviation amount is described as dot position data in the main scanning direction and the sub-scanning direction. Since the dot position data is described for each nozzle, a shift is described for each ink color. The configuration and processing flow for performing the simulation processing using the dot position data are substantially the same as those in FIGS. 5 and 10, but the processing in step S130 is different.
すなわち、このステップS130では、上記ドット形状データを参照して各ノズルによって形成されるドットの形状を特定するとともに、上記ドット位置データを参照してドットの形成位置を調整する。図30に示すデータを例に説明すれば、ノズル番号1では主走査方向のずれ(X)と副走査方向のずれ(Y)とがともに”0”であるので、図30の下部に示すようにノズル番号1から吐出されるインクについては基準のドット形成位置にドットが形成されることとする。
That is, in this step S130, the dot shape formed by each nozzle is specified with reference to the dot shape data, and the dot formation position is adjusted with reference to the dot position data. The data shown in FIG. 30 will be described as an example. In
ノズル番号2では主走査方向のずれ(X)が”2”、副走査方向のずれ(Y)が”1”である。従って、ノズル番号2のドットについては、基準のドット形成位置である画素の中心から主走査方向にサブ画素2個,副走査方向にサブ画素1個ずらした位置Pにドットが形成されることとする。以上のように、各ノズル間の誤差も加味しながらドットの記録状態を特定し、これに基づいてGIを算出すれば、ノズル間の誤差を含めて印刷画質を評価することが可能になる。
In
G4.変形例4:
本発明において考慮できるインク吐出特性は、以上のようなノズル間誤差に限られない。例えば、キャリッジの送り誤差のような、各種駆動誤差を考慮しても良い。図31は、送り誤差を考慮する際のドット位置データの例を説明する説明図である。図31に示すドット位置データは、主走査の回数(パス)毎に、基準の位置からのずれをサブ画素単位で記述したデータである。すなわち、上記キャリッジは主走査と副走査を繰り返してドットを記録するので、キャリッジを主走査方向に駆動するときの駆動誤差や紙送りローラにおける送り誤差に起因してドットの記録位置に誤差が生じ得る。そこで、プリンタにおいて各ノズルからインクを吐出させて記録位置を計測し、ずれ量を示すデータとする。このとき、あるパスにおける記録位置を基準のドット形成位置とし、この基準のドット形成位置にドットを形成するパスは主走査方向のずれ(X)と副走査方向のずれ(Y)とがともに”0”であるとする。図31に示す例においては、上記画素の中心が基準のドット形成位置になるようにしている。
G4. Modification 4:
The ink ejection characteristics that can be considered in the present invention are not limited to the above-described error between nozzles. For example, various drive errors such as carriage feed errors may be considered. FIG. 31 is an explanatory diagram for explaining an example of dot position data when considering a feed error. The dot position data shown in FIG. 31 is data in which the deviation from the reference position is described in units of sub-pixels for each number of main scans (pass). That is, since the carriage records dots by repeating main scanning and sub-scanning, an error occurs in the dot recording position due to a driving error when driving the carriage in the main scanning direction or a feeding error in the paper feed roller. obtain. Therefore, ink is ejected from each nozzle in the printer and the recording position is measured to obtain data indicating the amount of deviation. At this time, a recording position in a certain pass is set as a reference dot formation position, and a pass in which dots are formed at the reference dot formation position has both a deviation (X) in the main scanning direction and a deviation (Y) in the sub scanning direction. Assume that it is 0 ″. In the example shown in FIG. 31, the center of the pixel is the reference dot formation position.
基準のドット形成位置からずれが生じる場合には、主走査方向および副走査方向につき、そのずれ量に相当するサブ画素をドット位置データとして記述する。なお、このドット位置データにおいては、各インク色毎に各パスで生じる基準のドット形成位置からのずれを記述する。また、パス数の上限(図31の#N)としては特に限定されないが、プリンタにおいて印刷可能な最大の印刷媒体サイズに対応させるのが好ましい。例えば、A4サイズの印刷媒体の全面に印刷を行う場合に必要なパス数がパス数の上限となる。 When a deviation occurs from the reference dot formation position, the sub-pixel corresponding to the deviation amount is described as dot position data in the main scanning direction and the sub-scanning direction. In this dot position data, a deviation from the reference dot formation position that occurs in each pass is described for each ink color. The upper limit of the number of passes (#N in FIG. 31) is not particularly limited, but it is preferable to correspond to the maximum print medium size that can be printed by the printer. For example, the number of passes required when printing on the entire surface of an A4 size print medium is the upper limit of the number of passes.
このドット位置データを利用してシミュレーション処理を行うための構成および処理フローは上記図5、図10とほぼ同様であるが、ステップS130における処理が異なっている。ステップS130においては、上記ドット形状データを参照して各パスによって形成されるドットの形状を特定するとともに、上記ドット位置データを参照してドットの形成位置を調整する。図31に示すデータを例に説明すれば、パス番号1では主走査方向のずれ(X)と副走査方向のずれ(Y)とがともに”0”であるので、図31の下部に示すようにパス番号1から吐出されるインクについては基準のドット形成位置にドットが形成されることとする。
The configuration and processing flow for performing the simulation processing using the dot position data are substantially the same as those in FIGS. 5 and 10, but the processing in step S130 is different. In step S130, the dot shape data is identified by referring to the dot shape data, and the dot formation position is adjusted by referring to the dot position data. Taking the data shown in FIG. 31 as an example, in
パス番号2では主走査方向のずれ(X)が”2”、副走査方向のずれ(Y)が”−1”である。従って、パス番号2のドットについては、基準のドット形成位置である画素の中心から主走査方向にサブ画素2個,副走査の逆方向にサブ画素1個ずらした位置P’にドットが形成されることとする。以上のように、各パス間の誤差も加味しながらドットの記録状態を特定し、これに基づいてGIを算出すれば、パス間の誤差を含めて印刷画質を評価することが可能になる。
In
なお、上述のノズル間誤差と送り誤差とは同時に発生しうる。そこで、図30、図31に示すドット位置データの双方を予め作成しておき、上記ステップS130にて双方のドット位置データが示すずれ量を上記基準のドット形成位置に加えてドット形成位置を調整する構成を採用しても良い。また、図30,図31に示す例では、サブ画素単位でずれ量を表現しているので、画素をサブ画素に分割する分割数や解像度等に対応させておく必要があり、これらの条件が変わればその条件に対応したドット位置データを参照することになる。むろん、この構成は一例であり、上述のようにして計測したずれ量を長さの単位で記述しておき、解像度や画素の分割数に応じてサブ画素単位でのずれ量を算出する構成を採用しても良い。 Note that the above-described nozzle error and feed error can occur simultaneously. Therefore, both the dot position data shown in FIGS. 30 and 31 are prepared in advance, and the dot formation position is adjusted by adding the deviation amount indicated by both the dot position data to the reference dot formation position in step S130. You may employ | adopt the structure to do. In the examples shown in FIGS. 30 and 31, since the shift amount is expressed in units of sub-pixels, it is necessary to correspond to the number of divisions, resolution, and the like for dividing the pixels into sub-pixels. If changed, the dot position data corresponding to the condition is referred to. Of course, this configuration is only an example, and the amount of deviation measured as described above is described in units of length, and the amount of deviation in sub-pixel units is calculated according to the resolution and the number of pixel divisions. It may be adopted.
G5.変形例5:
また、上述の実施形態においては、特定の主走査および副走査の制御法でキャリッジおよび紙送りローラを駆動するプリンタを想定していたが、各種の制御法でキャリッジおよび紙送りローラを駆動するプリンタにおいて本発明を適用することも可能である。すなわち、制御法が異なればあるハーフトーンデータの同じ画素であってもその画素のドットを形成するためのノズルやパスが異なる。そこで、制御法に基づいてノズルを特定できるように構成する。
G5. Modification 5:
In the above-described embodiment, the printer that drives the carriage and the paper feed roller by a specific main scanning and sub-scanning control method is assumed. However, the printer that drives the carriage and the paper feed roller by various control methods. It is also possible to apply the present invention. That is, if the control method is different, nozzles and passes for forming dots of the same pixel of a certain halftone data are different. Therefore, the nozzle is specified based on the control method.
図32は、主走査および副走査の制御法とキャリッジに形成された複数のノズルの配置とを示す制御法データの例を説明する説明図である。同図に示す制御法データには、ノズルの配置としてノズル数とノズル密度が記述されている。ノズル数はキャリッジにおいて副走査方向に並べられたノズルの数を示しており、図32では簡単のためにノズル数を7としているが、通常は180個など、より多数のノズルである。ノズル密度は、副走査方向に並べられたノズルの密度をdpi単位で示している。すなわち、副走査方向の1インチ当たりのノズル数によって密度を示している。図32に示す例ではノズル密度が記述されていないが、ノズルを特定するためにノズル密度が必要であれば、ここにデータを記述する。 FIG. 32 is an explanatory diagram for explaining an example of control method data indicating a control method for main scanning and sub-scanning and an arrangement of a plurality of nozzles formed on the carriage. In the control method data shown in the figure, the number of nozzles and the nozzle density are described as the nozzle arrangement. The number of nozzles indicates the number of nozzles arranged in the sub-scanning direction in the carriage. In FIG. 32, the number of nozzles is 7 for simplicity, but there are usually a larger number of nozzles such as 180. The nozzle density indicates the density of nozzles arranged in the sub-scanning direction in dpi units. That is, the density is indicated by the number of nozzles per inch in the sub-scanning direction. In the example shown in FIG. 32, the nozzle density is not described, but if the nozzle density is necessary to specify the nozzle, data is described here.
また、主走査の制御法としてパス数と記録パターン(print pattern)とを記述可能である。パス数は、主走査方向の1ライン(ラスタ)を何回のパスで満たすのかを示しており、記録パターンは2回以上のパスで1ラスタを満たす場合に隣り合うドットをどのパスで記録するのかを示している。例えば、”0”が先のパス、”1”が後のパスを示すように定義し、記録パターンとして”01011010”としておけば、各ドットを記録するためのパスを特定することが可能である。図32に示す例では、パス数が”1”であるので、記録パターンは記述されていない。 In addition, the number of passes and a print pattern can be described as a main scanning control method. The number of passes indicates how many passes one line (raster) in the main scanning direction is filled. When the recording pattern fills one raster in two or more passes, the adjacent dots are recorded in which pass. Is shown. For example, if it is defined that “0” indicates the first pass and “1” indicates the subsequent pass, and “01011010” is set as the recording pattern, it is possible to specify the pass for recording each dot. . In the example shown in FIG. 32, since the number of passes is “1”, the recording pattern is not described.
副走査の制御法としては、送り量とオーバーラップノズル数とオーバーラップパターンとを記述可能である。送り量は副走査時の送り量をラスタ数単位で示したデータである。すなわち、上記Y解像度によれば1ラスタの長さが判明する(例えば、Y解像度が720dpiの場合には1/720インチ)ので、送り量をラスタ数で示すことにより、一回当たりの実際の副走査送り量が判明する。オーバーラップノズル数は副走査方向の上端と下端に形成された複数のノズルで同じパスを埋める(オーバーラップ)ように制御する際に、そのノズル数を示すデータである。オーバーラップパターンはあるラスタにおいて上端と下端のどちらでどの位置のドットを形成するのかを示すデータである。図32に示す例では、オーバーラップ制御を行わないこととし、オーバーラップノズル数とオーバーラップパターンとは記述されていない。 As a sub-scanning control method, a feed amount, the number of overlap nozzles, and an overlap pattern can be described. The feed amount is data indicating the feed amount at the time of sub-scan in units of the number of rasters. That is, according to the Y resolution, the length of one raster can be determined (for example, 1/720 inch when the Y resolution is 720 dpi). The sub-scan feed amount is determined. The number of overlap nozzles is data indicating the number of nozzles when control is performed so that the same path is filled (overlap) with a plurality of nozzles formed at the upper and lower ends in the sub-scanning direction. The overlap pattern is data indicating which dot is formed at the upper end or the lower end in a certain raster. In the example shown in FIG. 32, the overlap control is not performed, and the number of overlap nozzles and the overlap pattern are not described.
図32の左側には、同図に示す制御法データの内容における制御を例示してある。ここに示すラスタは主走査方向の1ラインであり、上から順にラスタ番号を付けて示している。すなわち、紙面左右方向が主走査方向に相当し、紙面上下方向が副走査方向に相当する。パス番号はパスの回数であり、この番号の下に各パスにおけるノズルの位置を実線の丸で示し、上から順に1〜7のノズル番号を付している。なお、この例では、副走査方向の解像度が720dpi,副走査方向のノズル密度が180dpiであることを想定しており、各ノズルの間の距離は4ラスタ分に相当する。
The left side of FIG. 32 illustrates control in the contents of the control method data shown in FIG. The raster shown here is one line in the main scanning direction, and is shown with raster numbers in order from the top. That is, the horizontal direction on the paper surface corresponds to the main scanning direction, and the vertical direction on the paper surface corresponds to the sub-scanning direction. The pass number is the number of passes. Below this number, the position of the nozzle in each pass is indicated by a solid circle, and the
制御法データにおいて送り量が”5”となっているので、パス番号2においては、副走査方向に5ラスタ分送られる。この送り量を繰り返すと、ラスタ番号13以下においては番号のラスタにドットを記録するノズルが存在するようになる。そこで、制御法データに従った制御ではラスタ番号12より上にはドットを記録せず、ラスタ番号13より下にドットを記録する。従って、上記ハーフトーンデータにおける一番上のラスタにおいては4番のノズルでドットが形成される。
Since the feed amount is “5” in the control method data, in the
以上のように、制御法データを利用すれば、各ラスタのドットを形成するノズルを特定することができるので、上記ステップS130において、上記制御法データを参照してノズルを特定し、上記ドット形状データを参照してドットの形状を特定する。この結果、複雑な制御を行う場合であっても容易にその制御法におけるGIを算出することが可能になる。なお、上記制御法データを参照すれば、図32の左側に示すようにパス番号も分かる(すなわち、主走査の回数を特定可能である)ので、上記ドット位置データを参照して送り誤差を考慮することもできる。むろん、上記ドット位置データを参照してノズル間の誤差を考慮することもできる。 As described above, by using the control method data, it is possible to specify the nozzles that form the dots of each raster. Therefore, in step S130, the nozzles are specified by referring to the control method data, and the dot shape is determined. The dot shape is specified by referring to the data. As a result, even when complex control is performed, it is possible to easily calculate GI in the control method. If the control method data is referred to, the pass number is also known as shown on the left side of FIG. 32 (that is, the number of main scans can be specified), so that the feed error is considered with reference to the dot position data. You can also Of course, an error between nozzles can be considered by referring to the dot position data.
図32においては省略したが、むろん、上記パス数が2の場合は記録パターンを示すデータを使ってノズルを特定することができるし、オーバーラップの制御を行うときもオーバーラップノズル数およびオーバーラップパターンを示すデータを使ってノズルを特定することができる。むろん、他の制御法でキャリッジおよび紙送りローラを駆動する場合には、他のパラメータを制御法データに記述してその制御法において各ドットを形成するドットやパスを特定すればよい。他のノズル配置、例えば、副走査方向に多数のノズルを並べてノズルアレイを形成するとともにこのノズルアレイを主走査方向に並べ、同じ色のインクを吐出するように構成する場合には、そのノズル配置を示すデータを制御法データに記述し、このデータと制御法を示すデータとによって各ドットを形成するドットやパスを特定すればよい。 Although omitted in FIG. 32, of course, when the number of passes is 2, the nozzles can be specified using the data indicating the recording pattern, and the number of overlap nozzles and overlap can also be controlled when performing overlap control. The nozzle can be specified using the data indicating the pattern. Of course, when the carriage and the paper feed roller are driven by another control method, other parameters may be described in the control method data, and the dot or pass forming each dot may be specified by the control method. In other nozzle arrangements, for example, when a nozzle array is formed by arranging a large number of nozzles in the sub-scanning direction and this nozzle array is arranged in the main scanning direction and configured to eject ink of the same color, the nozzle arrangement The control method data is described in the control method data, and the dot or pass forming each dot is specified by this data and the data indicating the control method.
G6.変形例6:
さらに、双方向印刷(Bi-D Print)を実施可能なプリンタや一回当たりのインク吐出量を調整可能なプリンタに対して本発明を適用することも可能である。図33はこの場合に用意するデータを示す説明図である。上記パラメータデータとしては、上述のパラメータに加えて双方向印刷を実施するか否かを示すデータと一回当たりのインク吐出量を調整するか否かを示すデータとを記述する。なお、この例では、一回当たりのインク吐出量を3段階(小中大)に調整可能である。
G6. Modification 6:
Furthermore, the present invention can also be applied to a printer capable of performing bidirectional printing (Bi-D Print) and a printer capable of adjusting the ink discharge amount per time. FIG. 33 is an explanatory diagram showing data prepared in this case. As the parameter data, in addition to the parameters described above, data indicating whether or not to perform bidirectional printing and data indicating whether or not to adjust the ink discharge amount per time are described. In this example, the ink discharge amount per time can be adjusted in three stages (small, medium and large).
双方向印刷においては主走査方向の往復双方でインクを吐出し、単方向印刷においては往復いずれか一方でインクを吐出する。従って、上記ドット形状データや分光反射率データ、ドット位置データは、双方向と単方向とで異なり得る。そこで、双方向用データと単方向用データとを予め用意しておく。このように構成しておけば、双方向、単方向いずれにおいても上記記録状態データを算出することが可能になる。 In bidirectional printing, ink is ejected in both directions of the main scanning direction, and in unidirectional printing, ink is ejected in either direction. Therefore, the dot shape data, the spectral reflectance data, and the dot position data can be different between bidirectional and unidirectional. Therefore, bidirectional data and unidirectional data are prepared in advance. With this configuration, it is possible to calculate the recording state data in both directions and unidirectional.
小中大3種のインク滴それぞれにおいては、記録されるドットの形状、分光反射率、誤差に起因するドットの形成位置が異なるので、小中大それぞれについて予め上記ドット形状データや分光反射率データ、ドット位置データを作成し、用意しておく。この場合、上記ハーフトーンデータは、小中大それぞれについてドットを記録するか否かを示したデータとなり、各インク色について3個のハーフトーンデータとなる。 Since each of the three small, medium, and large ink droplets has a different dot shape, spectral reflectance, and dot formation position due to an error, the dot shape data and spectral reflectance data are previously stored for each of the small, medium, and large ink droplets. The dot position data is created and prepared. In this case, the halftone data is data indicating whether dots are recorded for each of the small, medium, and large, and is three halftone data for each ink color.
記録状態データの作成に際しては、このハーフトーンデータを取得し、各ドットの大きさに応じたドット形状データや分光反射率データ、ドット位置データを参照すれば、各インク色および各大きさのドットを重畳した結果の記録状態データを算出することが可能である。以上のようにして算出した記録状態データに基づいてGIを算出すれば、双方向印刷時の粒状性を評価することが可能になるし、小中大3種のインク滴を使用する場合の粒状性を評価することが可能になる。このインク吐出量の調整は一例であり、他の実施例、例えば、異なるノズルから異なる量のインクを吐出するような構成を採用しても良い。 When creating the recording status data, obtain this halftone data and refer to the dot shape data, spectral reflectance data, and dot position data according to the size of each dot. It is possible to calculate recording state data as a result of superimposing. If GI is calculated based on the recording state data calculated as described above, it is possible to evaluate the granularity during bidirectional printing, and the granularity when using three types of ink droplets of small, medium, and large. It becomes possible to evaluate sex. The adjustment of the ink discharge amount is an example, and other embodiments, for example, a configuration in which different amounts of ink are discharged from different nozzles may be employed.
G7.変形例7:
上述のスムージング処理も一例であり、スムージング処理を行うことによって高精度に色変換実施可能なプロファイルを作成できる限りにおいて、他にも種々の構成を採用することができる。上記SEIにおいてはCIELAB空間での格子点配置の平滑程度が低下したときに値が大きくなるような関数を採用すれば良く、上述の関数の他、種々の関数を採用することができる。例えば、上記SI2,SI3においては、格子点が立方格子を形成するとしたときにベクトルが直交するような格子点のみを最適化対象の周囲の格子点として抽出していたが、このような選び方が必須という訳ではなく、例えば、図17のベクトルLa5,ベクトルLa6のように格子点が立方格子を形成するとしたときに対角位置にあるような格子点を含めてSEIとしても良い。このような対角位置にある格子点は、位置情報が形成する格子点においても対角位置にあり、特に上述の位置情報が形成する立方体のKWを結ぶグレー軸は格子点の対角方向に該当する。従って、対角位置にある格子点についても配置の平滑程度が向上すると、モノクロ出力時にトーンジャンプが発生することを防止することができる。
G7. Modification 7:
The above-described smoothing process is also an example, and various other configurations can be employed as long as a profile capable of performing color conversion with high accuracy can be created by performing the smoothing process. In the SEI, a function that increases a value when the smoothness of the lattice point arrangement in the CIELAB space is reduced may be employed, and various functions may be employed in addition to the above functions. For example, in the above SI 2 and SI 3 , only lattice points whose vectors are orthogonal when the lattice points form a cubic lattice are extracted as lattice points around the optimization target. The selection method is not essential, and for example, SEI may be included including lattice points that are diagonally located when lattice points form a cubic lattice, such as vector L a5 and vector L a6 in FIG. . The lattice points at such diagonal positions are also diagonal positions at the lattice points formed by the position information. In particular, the gray axis connecting the KWs of the cube formed by the position information described above is in the diagonal direction of the lattice points. Applicable. Therefore, if the smoothness of the arrangement of the grid points at the diagonal positions is improved, tone jumps can be prevented from occurring during monochrome output.
G8.変形例8:
上述の実施形態においては互いに逆向きのベクトルの和をとることによって平滑程度の高い格子点配置でSEIの値が小さくなるようにしていたが、むろん、他の構成を採用しても良い。例えば、格子点間の相対位置関係が類似しているか否かを評価する関数であっても良い。具体的には、図17においてベクトルLa5−ベクトルLa4とベクトルLa1−ベクトルLpとの差をとると両ベクトルの差ベクトル、すなわち(ベクトルLa5−ベクトルLa4)−(ベクトルLa1−ベクトルLp)が得られるが、当該差ベクトルの値が小さいほど格子点間の相対位置関係が類似していると言える。従って、ベクトルLa1−ベクトルLpと隣接する格子間ベクトルとの差をとって足し合わせることによって配置の平滑程度を評価するSEIを取得することができる。
G8. Modification 8:
In the above-described embodiment, the value of SEI is made small with a grid point arrangement with a high degree of smoothness by taking the sum of vectors in opposite directions, but other configurations may of course be employed. For example, it may be a function for evaluating whether or not the relative positional relationship between lattice points is similar. Specifically, in FIG. 17, when the difference between the vector L a5 -vector L a4 and the vector L a1 -vector L p is taken, the difference vector of both vectors, ie, (vector L a5 -vector L a4 ) − (vector L a1 -Vector L p ) is obtained, it can be said that the smaller the value of the difference vector, the more similar the relative positional relationship between the lattice points. Therefore, SEI that evaluates the degree of smoothness of the arrangement can be acquired by adding the difference between the vector L a1 -vector L p and the adjacent interstitial vector.
G9.変形例9:
上述のSEIでは、最適化対象の格子点を中心に互いに逆向きのベクトルの差をとり、それぞれの差を加え合わせていた。すなわち、CIELAB空間で全格子点が均等になる状態を理想としていた。しかし、インクプロファイル142に記述された測色値が形成する格子点が元々不均等であったり、意図的にCIELAB空間中の格子点間隔を不均等にしたい場合には、SEIを変更しても良い。このように格子点を不均等にしたときに最適であるとする例としては、SEIに式(19)のように重み変数を設けることで対処することが可能である。
In the SEI described above, the difference between vectors in opposite directions with respect to the optimization-targeted grid point is taken, and the respective differences are added together. That is, the ideal state is that all lattice points are uniform in the CIELAB space. However, if the grid points formed by the colorimetric values described in the
同式(19)においてW1>W2であるならば、差(ベクトルLa1−ベクトルLp)の大きさが(ベクトルLa2−ベクトルLp)の大きさより小さい状態でSI1の値を小さくすることができ、最適化対象の格子点が一方の格子点に近い状態が最適状態であるとすることができる。なお、重み係数としては種々の態様を採用可能であるが、格子点配置を不均等間隔にする場合に例えば式(20)によって決定することができる。
なお、重みを設けたSEIを設計することでCIELAB空間中の格子点間隔を制御する構成は、インク特性に応じて格子点間隔を不均等にする場合、すなわち、インク記録率が大きくなると濃度の変化度合が小さくなるというインク特性を考慮して低インク記録率で格子点を多くする場合に特に有用である。さらに、重みを設けたSEIを設計することでCIELAB空間中で局所的に格子点の密度を多くする構成は、局所的に色変換精度を高くしたい場合等に特に有用である。 It should be noted that the configuration in which the grid point spacing in the CIELAB space is controlled by designing the weighted SEI is such that when the grid point spacing is made unequal according to the ink characteristics, that is, when the ink recording rate increases, This is particularly useful when the number of lattice points is increased at a low ink recording rate in consideration of the ink characteristic that the degree of change is small. Furthermore, a configuration in which the density of lattice points is locally increased in the CIELAB space by designing a weighted SEI is particularly useful when it is desired to increase the color conversion accuracy locally.
G10.変形例10:
上記実施形態においては、CIELAB空間中の色域の部位毎に別個の隣接格子点を抽出して最適化対象の格子点配置をスムージングしているので、SI1〜SI3のそれぞれによって最適化される各格子点同士に関連がない。そこで、各部位毎に別個のSEIで格子点を最適化しつつ各部位の境界においても配置の平滑程度が高くなるように重み付け演算をしてもよい。
G10. Modification 10:
In the above embodiment, since the adjacent lattice points are extracted for each region of the color gamut in the CIELAB space and the lattice point arrangement to be optimized is smoothed, it is optimized by each of SI 1 to SI 3. There is no relation between the grid points. In view of this, weight calculation may be performed so that the degree of smoothness of the arrangement becomes high even at the boundary of each part while optimizing the lattice points by separate SEI for each part.
上述のSI1,SI2では位置情報(Pr,Pg,Pb)のいずれか一つまたは二つを固定していたが、SI3では位置情報(Pr,Pg,Pb)の三つとも可変であるので、色域境界付近では束縛条件が急激に変化する。また、色域の境界同士でも色域境界を形成する稜線と外面とでは束縛条件が急激に変化する。束縛条件が急激に変動すると、格子点配置を平滑化するために格子点を移動させる際の自由度および移動方向の自由度が全く異なるので、この場合に格子点配置の平滑程度の不連続が生じるおそれがある。そこで、束縛条件が急激に変化することを防止するために色域境界に近づくほど、位置情報が変動しにくくなるような重みを持った項をSEIに付加する。この構成としては例えば下記(21)式のようなSEIを採用可能である。
![]()
![]()
すなわち、上記式の第2項は色域境界に近ければ近いほど、重み係数Wrの値が大きく、位置情報Prが現在位置Pr0から離れるほど当該第2項が大きくなる。従って、SI1を極小化する最適化処理において位置情報Pr,Pr0は近い値になるとともに色域境界に近いほど両位置情報が近い値となる。なお、位置情報Pgのみを可変にしたり位置情報Pbのみを可変にした場合であっても同様の考え方でSI1に第2項を付加することができる。むろん、SI2,SI3でも同様であり、SI2では位置情報のうち2つの成分が可変であるのでSEIに対して2つの項が付加され、SI3では位置情報の3つの成分が可変であるのでSEIに対して3つの項が付加される。 That is, the second term in the above equation closer the gamut boundary, large value of the weighting factor W r, the position information Pr is the second term as the distance from the current position Pr 0 increases. Accordingly, in the optimization process for minimizing SI 1 , the position information Pr and Pr 0 are close to each other, and the position information is closer to the color gamut boundary. Even when only the position information Pg is made variable or only the position information Pb is made variable, the second term can be added to SI 1 in the same way. Of course, the same applies to SI 2 and SI 3. Since two components of position information are variable in SI 2 , two terms are added to SEI, and three components of position information are variable in SI 3. So there are three terms added to SEI.
G11.変形例11:
上述のスムージング処理ではインクプロファイル142に記述された測色値を用いてCIELAB空間で格子点配置の平滑程度を検証していたが、他の色空間でスムージングを行っても良い。例えばインク量空間内で各インク量データの格子点配置を考え、この格子点配置の平滑程度を評価する評価指数を算出することにより、インク量空間でスムージングを実施することが可能になる。
G11. Modification 11:
In the smoothing process described above, the degree of smoothness of the grid point arrangement is verified in the CIELAB space using the colorimetric values described in the
G12.変形例12:
さらに、上述のスムージング処理では、ステップS35で選択された163個以下の代表サンプルを使ってスムージング処理を行っていたが、この代表サンプルを用いて代表サンプル数を増減し、あるいは代表サンプルの格子点位置を調整してスムージング処理を実施しても良い。例えば、代表サンプルに基づいて不等間隔補間を行うことによって、CIELAB空間で643個程度の格子点および対応するインク量を算出し、これらを用いてスムージングを行う。この場合、163個のサンプルについてスムージングを行う場合と比較して距離が近い格子点同士で配置の平滑程度を評価することができるので、平滑程度を向上させやすい。また、代表サンプルに基づいて不等間隔補間を行うことによって、CIELAB空間でできるだけ等間隔に配置された格子点を抽出してスムージングを実行するように構成しても良い。この場合、初期の格子点配置に歪みが少なくなるので、計算過程でローカルミニマムに達しにくくすることができ、容易にスムージング処理を行うことができる。さらに、位置情報Pr,Pg,PbとLab値とをより簡単に対応づけることができる。
G12. Modification 12:
Further, in the above-described smoothing process, the smoothing process is performed using 16 3 or less representative samples selected in step S35, but the number of representative samples is increased or decreased using this representative sample, or a grid of representative samples is used. The smoothing process may be performed by adjusting the point position. For example, by performing non-uniform interpolation based on the representative sample, and calculating the 64 3 or so grid points and the corresponding amount of ink in the CIELAB space, it performs smoothing using these. In this case, since the degree of smoothness of the arrangement can be evaluated at lattice points that are closer in distance than when smoothing is performed on 16 3 samples, the degree of smoothness can be easily improved. Further, it may be configured to perform smoothing by extracting lattice points arranged at equal intervals in the CIELAB space by performing non-uniform interpolation based on the representative samples. In this case, since the initial lattice point arrangement is less distorted, it is difficult to reach the local minimum during the calculation process, and the smoothing process can be easily performed. Furthermore, the positional information Pr, Pg, Pb and the Lab value can be associated more easily.
G13.変形例13:
上記第4実施形態ではCDIとIQIとに加える評価指数としてTinkを採用していたが、例えば、以下の(22)式のように色域の大きさを評価する評価指数を加えても良い。
![]()
In the fourth embodiment, Tink is adopted as an evaluation index to be added to CDI and IQI. However, for example, an evaluation index for evaluating the size of the color gamut may be added as in the following equation (22).
![]()
G14.変形例14:
上述の実施形態では、インク量データが示す色の画素を複数個集めて所定の面積を持たせた仮想的なサンプルパッチを考えてシミュレーションによりGIを算出していたが、この仮想的なサンプルパッチを実際に印刷し、測色を行ってGIを算出しても良い。この構成は上述の実施形態とほぼ同様の構成によって実現することができるが、画質評価指数算出部における処理が上述の実施形態と異なる。図34は、仮想的なサンプルパッチを実際に印刷し、測色を行ってGIを算出する処理を示すフローチャートである。この処理では、仮想的なサンプルパッチを印刷し、印刷結果を測色してそのパッチのぼかし画像(blurred Image)と元の画像(original image)との差分を算出し、この差分をGIとする。このGIについては、M.D. Fairchild and G.M. Johnson, "Meet iCAM: and Image Color Appearance Model" IS&T/SID 10th Color Imaging Conference, Scottsdale, (2002), あるいはG.M. Johnson and M.D. Fairchild, "Rendering HDR Images" IS*T/SID 11th Color Imaging Conference, Scottsdale, (2003) に記述されたモデル(iCAM)を参照。
G14. Modification 14:
In the above-described embodiment, the GI is calculated by simulation in consideration of a virtual sample patch in which a plurality of pixels of the color indicated by the ink amount data are collected to have a predetermined area. May be actually printed and colorimetry may be performed to calculate GI. This configuration can be realized by a configuration substantially similar to the above-described embodiment, but the processing in the image quality evaluation index calculation unit is different from the above-described embodiment. FIG. 34 is a flowchart showing a process of actually printing a virtual sample patch and performing colorimetry to calculate a GI. In this process, a virtual sample patch is printed, the print result is measured, the difference between the blurred image of the patch and the original image is calculated, and this difference is defined as GI. . For this GI, MD Fairchild and GM Johnson, "Meet iCAM: and Image Color Appearance Model" IS & T / SID 10th Color Imaging Conference, Scottsdale, (2002), or GM Johnson and MD Fairchild, "Rendering HDR Images" IS * T / SID See model (iCAM) described in 11th Color Imaging Conference, Scottsdale, (2003).
ステップS600では、まず、上述のサンプルインク量データを用いて仮想的なサンプルパッチを形成し、このサンプルパッチを実際に印刷する。ステップS605においては、印刷したサンプルパッチをスキャンする。ここでは、スキャンの結果を用いて機器非依存色空間内の測色値を取得することができれば良く、市販されているスキャナや測色機等、種々の装置を使用可能である。また、サンプルパッチの粒状性を評価するので、サンプルパッチの印刷解像度より高い解像度でスキャンすることが好ましい。 In step S600, first, a virtual sample patch is formed using the above-described sample ink amount data, and this sample patch is actually printed. In step S605, the printed sample patch is scanned. Here, it is only necessary to obtain the colorimetric values in the device-independent color space using the scan result, and various devices such as commercially available scanners and colorimeters can be used. Since the granularity of the sample patch is evaluated, it is preferable to scan at a resolution higher than the printing resolution of the sample patch.
図34では、RGBスキャナによる例を示している。すなわち、ステップS605におけるスキャンの結果、ステップS610では、上記印刷されたサンプルパッチのRGBデータを取得する。このRGBデータは、機器依存色空間内のデータであるため、ステップS615ではスキャナ特性変換(scanner characterization)を行って機器非依存色空間であるXYZ色空間内のデータに変換する。 FIG. 34 shows an example using an RGB scanner. That is, as a result of the scan in step S605, RGB data of the printed sample patch is acquired in step S610. Since this RGB data is data in a device-dependent color space, in step S615, scanner characteristics conversion (scanner characterization) is performed to convert the data into data in an XYZ color space that is a device-independent color space.
ステップS620〜S640では、ぼかし画像を作成する。このために、ステップS620では、XYZ色空間を反対色空間(opponent-colors space)に変換する。すなわち、反対色空間の各チャンネルについては実験等によって人間の目におけるコントラスト感度関数(contrast sensitivity function(csf))を周波数空間で定義することが可能であるので、このcsfを利用できるように変換を行う。この変換は、例えば以下の(23)式によって算出することができる。
上記csfは周波数空間で定義されるので、ステップS625では、各反対色チャンネルlに対してフーリエ変換を実施する。ステップS630では、各反対色チャンネルに対して上述のcsfでフィルタリングを行う。すなわち、各成分に対してcsfを乗じる。一実施例では、輝度に対して下記(24)式を、クロミナンスチャンネルに対して下記(25)式を利用した。
![]()
![]()
以上のように、フィルタリングを行うと、ステップS635ではフィルタリング後の関数を逆フーリエ変換し、ステップS640でさらに反対色空間をXYZ色空間に変換する。この変換は、例えば以下の(26)式によって算出することができる。
以上の処理により、ぼかし画像のXYZ値が算出され、上記ステップS615では元の画像のXYZ値が算出されているので、ステップS645ではそれぞれの画像についてCIELAB値を算出する。そして、ステップS650では、元の画像の平均CIELAB値を算出し、CIEDE2000色差式によってぼかし画像と元の画像とにおける色差を算出する。 Through the above processing, the XYZ value of the blurred image is calculated, and the XYZ value of the original image is calculated in step S615. Therefore, in step S645, the CIELAB value is calculated for each image. In step S650, the average CIELAB value of the original image is calculated, and the color difference between the blurred image and the original image is calculated using the CIEDE2000 color difference formula.
以上のようにして画質評価指数算出部がGIを算出すると、評価指数算出部が評価指数を算出し、上述の実施形態と同様の処理によってプリンタルックアップテーブル180を作成する。以上のように、サンプルインク量データを用いて実際に印刷を行えば、現実の印刷物に基づいて画質を評価してインク量データを選択することが可能になる。 When the image quality evaluation index calculation unit calculates the GI as described above, the evaluation index calculation unit calculates the evaluation index, and creates the printer lookup table 180 by the same processing as in the above-described embodiment. As described above, if printing is actually performed using the sample ink amount data, the ink amount data can be selected by evaluating the image quality based on the actual printed matter.
なお、上記ステップS650で算出した色差を利用してGIを算出しても良い。例えば、粒状性が印刷媒体上の被覆率分布(area coverage distribution)に大きく依存することに着目してGIを決定することが可能である。この場合の実施例としては、6次元のインク量空間を被覆率(area coverage)によって4個程度のセルに分割し、セル内の総てのインク量データにおける上述の色差の平均を算出する。そして、この平均の色差がこのセル内の総てのインク量データについてのGIであるとしても良い。 Note that the GI may be calculated using the color difference calculated in step S650. For example, it is possible to determine the GI by paying attention to the fact that the graininess greatly depends on the area coverage distribution on the print medium. As an embodiment in this case, a six-dimensional ink amount space is divided into about four cells by area coverage, and the average of the above-described color differences in all ink amount data in the cell is calculated. The average color difference may be the GI for all the ink amount data in the cell.
本願発明が詳細に記述され図示されてきたが、これらは単なる説明のための例示であり、限定として解釈されるべきではなく、本願発明の精神とスコープはクレームの用語のみによって限定されることが理解される。 Although the present invention has been described and illustrated in detail, these are merely illustrative examples and should not be construed as limiting, and the spirit and scope of the present invention is limited only by the terms of the claims. Understood.
Claims (34)
(a)インク量データを、前記インク量データに従って印刷されるカラーパッチの分光反射率に変換するように構成された分光プリンティングモデルコンバータを準備する工程と、
(b)複数のインクのインク量セットをそれぞれ表す複数のサンプルインク量データを準備する工程と、
(c)前記分光プリンティングモデルコンバータを用いて、各サンプルインク量データを、前記サンプルインク量データによって表されるインク量で印刷されるべき仮想サンプルパッチの分光反射率に変換する工程と、
(d)各サンプルインク量データについて評価指数を算出する工程であって、前記評価指数は、前記分光反射率から算出されるサンプル色と比較の基礎として選択された比較色との間の色差を表す色差評価指数と、前記サンプルインク量データに従って印刷されるべき仮想サンプルパッチの画質を示す画質評価指数とを含む、工程と、
(e)前記評価指数に基づいて、複数のサンプルインク量データを選択する工程と、
(f)前記選択された複数のサンプルインク量データに基づいて、測色値とインク量データとの対応関係を規定するプロファイルとして、前記サンプルインク量データを用いて印刷されるカラーパッチの測色値と前記サンプルインク量データとの対応関係を示すルックアップテーブルを作成する工程と、
を備え、
前記画質評価指数は、前記サンプルインク量データに従って印刷されるべき仮想サンプルカラーパッチの粒状性を示す粒状性指数を含む、方法。A method for creating a profile that defines a correspondence relationship between ink amount data representing a set of ink amounts of a plurality of inks usable in a printer and colorimetric values,
(A) preparing a spectral printing model converter configured to convert the ink amount data into a spectral reflectance of a color patch printed according to the ink amount data;
(B) preparing a plurality of sample ink amount data each representing an ink amount set of a plurality of inks;
(C) using the spectral printing model converter, converting each sample ink amount data into a spectral reflectance of a virtual sample patch to be printed with an ink amount represented by the sample ink amount data;
(D) a step of calculating an evaluation index for each sample ink amount data, wherein the evaluation index is a color difference between a sample color calculated from the spectral reflectance and a comparison color selected as a basis for comparison. A color difference evaluation index representing and an image quality evaluation index indicating an image quality of a virtual sample patch to be printed according to the sample ink amount data;
(E) selecting a plurality of sample ink amount data based on the evaluation index;
(F) Color measurement of a color patch printed using the sample ink amount data as a profile that defines a correspondence relationship between the color measurement value and the ink amount data based on the selected plurality of sample ink amount data Creating a lookup table showing the correspondence between the value and the sample ink amount data ;
Equipped with a,
The image quality evaluation index includes a graininess index indicating a graininess of a virtual sample color patch to be printed according to the sample ink amount data .
前記工程(d)は、さらに、
前記サンプルインク量データに従って印刷されるべき仮想サンプルカラーパッチ上におけるインクドット形成状態をシミュレーションする工程と、
前記シミュレーション結果を用いて前記粒状性指数を算出する工程と、
を含む、方法。The method of claim 1 , comprising:
The step (d) further includes:
Simulating ink dot formation on a virtual sample color patch to be printed according to the sample ink amount data;
Calculating the graininess index using the simulation results;
Including a method.
前記インクドット形成状態は、画素を複数に分割した各サブ画素におけるインク吐出の有無によって決められるインクドットの詳細な形状及び位置によって表される、方法。The method of claim 2 , comprising:
The ink dot formation state is represented by a detailed shape and position of an ink dot determined by the presence or absence of ink ejection in each sub-pixel obtained by dividing a pixel .
前記シミュレーション工程は、さらに、
プリンタの複数のインク吐出ノズルに対するインク吐出特性を取得する工程と、
前記インク吐出特性を用いて前記インクドット形成状態を算出する工程と、
を含む、方法。The method of claim 2 , comprising:
The simulation process further includes:
Obtaining ink ejection characteristics for a plurality of ink ejection nozzles of the printer;
Calculating the ink dot formation state using the ink ejection characteristics;
Including a method.
前記インク吐出特性は、前記プリンタの機械的誤差に起因するドット形成位置のずれを含む、方法。The method of claim 4 , comprising:
The ink ejection characteristic includes a dot formation position shift caused by a mechanical error of the printer.
前記複数のノズルからは異なるサイズのインク滴が吐出され、
前記インク吐出特性は、各インクサイズに関して規定されている、方法。The method of claim 4 , comprising:
Ink droplets of different sizes are ejected from the plurality of nozzles,
The method, wherein the ink ejection characteristics are defined for each ink size.
前記シミュレーション工程は、さらに、
同一のサンプルインク量データが割り当てられた一様画像領域に対してハーフトーン処理を実行することによって、前記一様画像領域に対するハーフトーンデータを生成する工程と、
前記ハーフトーンデータを用いて前記一様画像領域上における前記インクドット形成状態を算出する工程と、
を含む、方法The method of claim 2 , comprising:
The simulation process further includes:
Generating halftone data for the uniform image region by performing halftone processing on the uniform image region to which the same sample ink amount data is assigned;
Calculating the ink dot formation state on the uniform image region using the halftone data;
Including, methods
前記粒状性指数を算出する工程は、さらに、
前記ドット形成状態の明度値分布を算出する工程と、
前記明度値分布の空間周波数を算出する工程と、
前記空間周波数から前記粒状性指数を算出する工程と、
を含む、方法The method of claim 2 , comprising:
The step of calculating the graininess index further includes:
Calculating a lightness value distribution of the dot formation state;
Calculating a spatial frequency of the brightness value distribution;
Calculating the graininess index from the spatial frequency;
Including, methods
前記工程(f)は、さらに、
特定の色空間内における複数の点の分布の平滑度を示す平滑程度評価指数を、1つの点の座標の関数として規定する工程と、
前記選択されたサンプルインク量データに対応する前記特定色空間内の点に対する前記平滑程度評価指数の値を算出する工程と、
前記平滑程度評価指数値が所定の基準を満足するか否かを判断する工程と、
前記平滑程度評価指数値が前記所定の基準を満足しないときには、
(i)前記特定の色空間内における前記点の座標を修正する工程と、
(ii)前記修正された座標を有する前記点に対する前記平滑程度評価指数値を算出する工程と、
を、前記平滑程度評価指数値が前記基準を満足するまで繰り返す工程と、
前記所定の基準を満たす平滑程度評価指数値を有する前記特定の色空間内の点の前記修正された座標に対応する複数のサンプルインク量データを再選択する工程と、
前記再選択された複数のサンプルインク量データに基づいて、測色値とインク量データとの対応関係を規定するプロファイルを作成する工程と、
を含む、方法。The method of claim 1, comprising:
The step (f) further includes
Defining a smoothness evaluation index indicating the smoothness of a distribution of a plurality of points in a specific color space as a function of the coordinates of one point;
Calculating a value of the smoothness evaluation index for a point in the specific color space corresponding to the selected sample ink amount data;
Determining whether the smoothness degree evaluation index value satisfies a predetermined criterion;
When the smoothness degree evaluation index value does not satisfy the predetermined criterion,
(I) modifying the coordinates of the point in the specific color space;
(Ii) calculating the smoothness evaluation index value for the point having the corrected coordinates;
Repeating until the smoothness degree evaluation index value satisfies the criteria,
Re-selecting a plurality of sample ink amount data corresponding to the modified coordinates of points in the specific color space having a smoothness evaluation index value satisfying the predetermined criteria;
Creating a profile that defines the correspondence between the colorimetric value and the ink amount data based on the reselected sample ink amount data;
Including a method.
前記平滑程度評価指数値は、前記特定の色空間の複数の部分において異なる関数形式を有する、方法The method of claim 9 , comprising:
The smoothness degree evaluation index value has a different function form in a plurality of parts of the specific color space.
前記平滑程度評価指数値は、対象の点から隣接する点にそれぞれ向かうほぼ反対方向の2つのベクトルの合成ベクトルの絶対値の関数である、方法The method of claim 9 , comprising:
The smoothness degree evaluation index value is a function of an absolute value of a combined vector of two vectors in substantially opposite directions respectively from an object point to an adjacent point.
前記対象の点がカラーガマットのエッジ上にあるときに、前記隣接する点は、前記カラーガマットのエッジ上に位置し、かつ、前記対象の点を挟んで反対側にあるように選択される、方法The method of claim 11 , comprising:
When the point of interest is on the edge of a color gamut, the adjacent points are selected to be located on the edge of the color gamut and on the opposite side of the point of interest; Method
前記対象の点がカラーガマットの外表面上にあるときに、前記隣接する点は、前記カラーガマットの外表面上に位置し、かつ、前記対象の点を挟んで反対側にあるように選択される、方法The method of claim 11 , comprising:
When the point of interest is on the outer surface of a color gamut, the adjacent points are selected to be located on the outer surface of the color gamut and on the opposite side of the point of interest. The method
前記対象の点がカラーガマットの内部にあるときに、前記隣接する点は、前記カラーガマットの内部に位置し、かつ、前記対象の点を挟んで反対側にあるように選択される、方法The method of claim 11 , comprising:
When the point of interest is inside a color gamut, the adjacent points are selected to be located inside the color gamut and on the opposite side of the point of interest.
前記画質評価指数は、単位面積当たりの合計インク量を表す指数を含む、方法。The method of claim 1, comprising:
The image quality evaluation index includes an index representing a total ink amount per unit area.
前記画質評価指数は、使用される印刷媒体に応じて複数の媒体依存指数から選択される媒体依存指数を含む、方法。The method of claim 1, comprising:
The image quality evaluation index includes a medium-dependent index selected from a plurality of medium-dependent indexes depending on a print medium used.
前記評価指数は、前記色差評価指数と前記画質評価指数の重み付き平均によって得られる、方法。The method of claim 1, comprising:
The evaluation index is obtained by a weighted average of the color difference evaluation index and the image quality evaluation index .
インク量データを、前記インク量データに従って印刷されるカラーパッチの分光反射率に変換する分光プリンティングモデルコンバータであって、複数のサンプルインク量データのそれぞれを、前記サンプルインク量データによって表されるインク量で印刷されるべき仮想サンプルパッチの分光反射率に変換する分光プリンティングモデルコンバータと、
各サンプルインク量データについて評価指数を算出する評価指数生成部であって、前記評価指数は、前記分光反射率から算出されるサンプル色と比較の基礎として選択された比較色との間の色差を表す色差評価指数と、前記サンプルインク量データに従って印刷されるべき前記仮想サンプルパッチの画質を示す画質評価指数とを含む、評価指数生成部と、
前記評価指数に基づいて、複数のサンプルインク量データを選択する選択部と、
前記選択された複数のサンプルインク量データに基づいて、測色値とインク量データとの対応関係を規定するプロファイルとして、前記サンプルインク量データを用いて印刷されるカラーパッチの測色値と前記サンプルインク量データとの対応関係を示すルックアップテーブルを作成するプロファイル作成部と、
を備え、
前記画質評価指数は、前記サンプルインク量データに従って印刷されるべき仮想サンプルカラーパッチの粒状性を示す粒状性指数を含む、装置。An apparatus for creating a profile that defines a correspondence relationship between ink amount data representing a plurality of ink amount sets that can be used by a printer and colorimetric values,
A spectral printing model converter for converting ink amount data into spectral reflectance of a color patch printed according to the ink amount data, wherein each of a plurality of sample ink amount data is represented by the sample ink amount data A spectral printing model converter that converts the spectral reflectance of a virtual sample patch to be printed in quantity;
An evaluation index generation unit for calculating an evaluation index for each sample ink amount data, wherein the evaluation index is a color difference between a sample color calculated from the spectral reflectance and a comparison color selected as a basis for comparison. An evaluation index generation unit including a color difference evaluation index representing, and an image quality evaluation index indicating an image quality of the virtual sample patch to be printed according to the sample ink amount data;
A selection unit that selects a plurality of sample ink amount data based on the evaluation index;
Based on the selected plurality of sample ink amount data, as a profile that defines the correspondence between the colorimetric value and the ink amount data, the colorimetric value of a color patch printed using the sample ink amount data, and the A profile creation unit that creates a look-up table indicating the correspondence with the sample ink amount data ;
Equipped with a,
The image quality evaluation index includes a graininess index indicating a graininess of a virtual sample color patch to be printed according to the sample ink amount data .
インク量データを、前記インク量データに従って印刷されるカラーパッチの分光反射率に変換する分光プリンティングモデルコンバータと、
複数のインクのインク量セットをそれぞれ表す複数のサンプルインク量データのデータソースと、
前記分光プリンティングモデルを用いて、各サンプルインク量データを、前記サンプルインク量データによって表されるインク量で印刷されるべき仮想サンプルパッチの分光反射率に変換する変換システムと、
各サンプルインク量データについて評価指数を算出する評価指数算出システムであって、前記評価指数は、前記分光反射率から算出されるサンプル色と比較の基礎として選択された比較色との間の色差を表す色差評価指数と、前記サンプルインク量データに従って印刷されるべき前記仮想サンプルパッチの画質を示す画質評価指数とを含む、評価指数算出システムと、
前記評価指数に基づいて、複数のサンプルインク量データを選択する選択システムと、
前記選択された複数のサンプルインク量データに基づいて、測色値とインク量データとの対応関係を規定するプロファイルとして、前記サンプルインク量データを用いて印刷されるカラーパッチの測色値と前記サンプルインク量データとの対応関係を示すルックアップテーブルを作成する作成システムと、
を備え、
前記画質評価指数は、前記サンプルインク量データに従って印刷されるべき仮想サンプルカラーパッチの粒状性を示す粒状性指数を含む、システム。A system for creating a profile that defines the correspondence between ink amount data representing a set of ink amounts of a plurality of inks that can be used in a printer and colorimetric values,
A spectral printing model converter that converts ink amount data into spectral reflectance of a color patch printed according to the ink amount data;
A data source of a plurality of sample ink amount data each representing an ink amount set of a plurality of inks;
A conversion system that converts each sample ink amount data into a spectral reflectance of a virtual sample patch to be printed with the ink amount represented by the sample ink amount data using the spectral printing model;
An evaluation index calculation system for calculating an evaluation index for each sample ink amount data, wherein the evaluation index indicates a color difference between a sample color calculated from the spectral reflectance and a comparison color selected as a basis for comparison. An evaluation index calculation system including a color difference evaluation index representing, and an image quality evaluation index indicating an image quality of the virtual sample patch to be printed according to the sample ink amount data;
A selection system for selecting a plurality of sample ink amount data based on the evaluation index;
Based on the selected plurality of sample ink amount data, as a profile that defines the correspondence between the colorimetric value and the ink amount data, the colorimetric value of a color patch printed using the sample ink amount data, and the A creation system for creating a look-up table showing the correspondence with sample ink amount data ;
Equipped with a,
The image quality evaluation index includes a graininess index indicating a graininess of a virtual sample color patch to be printed according to the sample ink amount data .
前記評価指数算出システムは、さらに、
前記サンプルインク量データに従って印刷されるべき仮想サンプルカラーパッチ上におけるインクドット形成状態をシミュレーションするシミュレーションシステムと、
前記シミュレーション結果を用いて前記粒状性指数を算出する粒状性算出システムと、
を含む、システム。The system of claim 19 , wherein
The evaluation index calculation system further includes:
A simulation system for simulating ink dot formation on a virtual sample color patch to be printed according to the sample ink amount data;
A graininess calculation system for calculating the graininess index using the simulation result;
Including the system.
前記インクドット形成状態は、画素を複数に分割した各サブ画素におけるインク吐出の有無によって決められるインクドットの詳細な形状及び位置によって表される、システム。21. The system of claim 20 , wherein
The ink dot formation state is represented by a detailed shape and position of an ink dot determined by the presence or absence of ink ejection in each sub-pixel obtained by dividing a pixel into a plurality of pixels .
前記シミュレーションシステムは、さらに、
プリンタの複数のインク吐出ノズルに対するインク吐出特性を取得する取得システムと、
前記インク吐出特性を用いて前記インクドット形成状態を算出する状態算出システムと、
を含む、システム。21. The system of claim 20 , wherein
The simulation system further includes:
An acquisition system for acquiring ink ejection characteristics for a plurality of ink ejection nozzles of the printer;
A state calculation system that calculates the ink dot formation state using the ink ejection characteristics;
Including the system.
前記インク吐出特性は、前記プリンタの機械的誤差に起因するドット形成位置のずれを含む、システム。The system of claim 22 , wherein
The system, wherein the ink ejection characteristics include a shift in a dot formation position due to a mechanical error of the printer.
前記シミュレーションシステムは、さらに、
同一のサンプルインク量データが割り当てられた一様画像領域に対してハーフトーン処理を実行することによって、前記一様画像領域に対するハーフトーンデータを生成する処理システムを含み、
前記算出システムは、前記ハーフトーンデータを用いて前記一様画像領域上における前記インクドット形成状態を算出する、システム21. The system of claim 20 , wherein
The simulation system further includes:
Including a processing system for generating halftone data for the uniform image region by performing halftone processing on the uniform image region to which the same sample ink amount data is assigned;
The calculation system calculates the ink dot formation state on the uniform image region using the halftone data.
前記粒状性算出システムは、さらに、
前記ドット形成状態の明度値分布を算出する分布算出システムと、
前記明度値分布の空間周波数を算出する周波数算出システムと、
を含み、
前記粒状性算出システムは、前記空間周波数から前記粒状性指数を算出する、システム21. The system of claim 20 , wherein
The graininess calculation system further includes:
A distribution calculation system for calculating a lightness value distribution of the dot formation state;
A frequency calculation system for calculating a spatial frequency of the brightness value distribution;
Including
The graininess calculation system calculates the graininess index from the spatial frequency.
前記作成システムは、さらに、
特定の色空間内における複数の点の分布の平滑度を示す平滑程度評価指数を、1つの点の座標の関数として規定する規定システムと、
前記選択されたサンプルインク量データに対応する前記特定色空間内の点に対する前記平滑程度評価指数の値を算出する平滑度算出システムと、
前記平滑程度評価指数値が所定の基準を満足するか否かを判断する判断システムと、
前記平滑程度評価指数値が前記所定の基準を満足しないときに、
(i)前記特定の色空間内における前記点の座標を修正し、
(ii)前記修正された座標を有する前記点に対する前記平滑程度評価指数値を算出する、
ことを、前記平滑程度評価指数値が前記基準を満足するまで繰り返す再帰修正システムと、
前記所定の基準を満たす平滑程度評価指数値を有する前記特定の色空間内の点の前記修正された座標に対応する複数のサンプルインク量データを再選択する再選択システムと、
を含み、
前記作成システムは、前記再選択された複数のサンプルインク量データに基づいて、測色値とインク量データとの対応関係を規定するプロファイルを作成する、システム。The system of claim 19 , wherein
The creation system further includes:
A defining system that defines a smoothness evaluation index indicating the smoothness of the distribution of a plurality of points in a specific color space as a function of the coordinates of one point;
A smoothness calculation system that calculates a value of the smoothness evaluation index for a point in the specific color space corresponding to the selected sample ink amount data;
A determination system for determining whether the smoothness degree evaluation index value satisfies a predetermined criterion;
When the smoothness degree evaluation index value does not satisfy the predetermined criterion,
(I) correcting the coordinates of the point in the specific color space;
(Ii) calculating the smoothness evaluation index value for the point having the modified coordinates;
A recursive correction system that repeats until the smoothness degree evaluation index value satisfies the criterion,
A reselection system for reselecting a plurality of sample ink amount data corresponding to the modified coordinates of points in the specific color space having a smoothness evaluation index value satisfying the predetermined criterion;
Including
The creation system creates a profile that defines a correspondence relationship between a colorimetric value and ink amount data based on the plurality of reselected sample ink amount data.
前記平滑程度評価指数値は、前記特定の色空間の複数の部分において異なる関数形式を有する、システム27. The system of claim 26 , wherein
The smoothness degree evaluation index value has a different function form in a plurality of parts of the specific color space.
前記平滑程度評価指数値は、対象の点から隣接する点にそれぞれ向かうほぼ反対方向の2つのベクトルの合成ベクトルの絶対値の関数である、システム27. The system of claim 26 , wherein
The smoothness degree evaluation index value is a function of the absolute value of the combined vector of two vectors in approximately opposite directions from the point of interest to adjacent points, respectively.
前記対象の点がカラーガマットのエッジ上にあるときに、前記隣接する点は、前記カラーガマットのエッジ上に位置し、かつ、前記対象の点を挟んで反対側にあるように選択される、システム30. The system of claim 28 , wherein
When the point of interest is on the edge of a color gamut, the adjacent points are selected to be located on the edge of the color gamut and on the opposite side of the point of interest; system
前記対象の点がカラーガマットの外表面上にあるときに、前記隣接する点は、前記カラーガマットの外表面上に位置し、かつ、前記対象の点を挟んで反対側にあるように選択される、システム30. The system of claim 28 , wherein
When the point of interest is on the outer surface of a color gamut, the adjacent points are selected to be located on the outer surface of the color gamut and on the opposite side of the point of interest. System
前記対象の点がカラーガマットの内部にあるときに、前記隣接する点は、前記カラーガマットの内部に位置し、かつ、前記対象の点を挟んで反対側にあるように選択される、システム30. The system of claim 28 , wherein
When the point of interest is inside a color gamut, the adjacent points are selected to be located inside the color gamut and on the opposite side across the point of interest
前記画質評価指数は、単位面積当たりの合計インク量を表す指数を含む、システム。The system of claim 19 , wherein
The image quality evaluation index includes an index representing a total ink amount per unit area.
前記画質評価指数は、使用される印刷媒体に応じて複数の媒体依存指数から選択される媒体依存指数を含む、システム。The system of claim 19 , wherein
The image quality evaluation index includes a medium-dependent index selected from a plurality of medium-dependent indices depending on a print medium used.
前記評価指数は、前記色差評価指数と前記画質評価指数の重み付き平均によって得られる、システム。The system of claim 19 , wherein
The evaluation index is obtained by a weighted average of the color difference evaluation index and the image quality evaluation index .
Applications Claiming Priority (2)
| Application Number | Priority Date | Filing Date | Title |
|---|---|---|---|
| US10/700,658 US7652789B2 (en) | 2003-11-03 | 2003-11-03 | Production of color conversion profile for printing |
| PCT/JP2004/016511 WO2005043884A1 (en) | 2003-11-03 | 2004-11-01 | Production of color conversion profile for printing |
Publications (3)
| Publication Number | Publication Date |
|---|---|
| JP2007516663A JP2007516663A (en) | 2007-06-21 |
| JP2007516663A5 JP2007516663A5 (en) | 2007-08-02 |
| JP4388553B2 true JP4388553B2 (en) | 2009-12-24 |
Family
ID=34551251
Family Applications (1)
| Application Number | Title | Priority Date | Filing Date |
|---|---|---|---|
| JP2006539127A Active JP4388553B2 (en) | 2003-11-03 | 2004-11-01 | Generate a color conversion profile for printing |
Country Status (3)
| Country | Link |
|---|---|
| US (1) | US7652789B2 (en) |
| JP (1) | JP4388553B2 (en) |
| WO (1) | WO2005043884A1 (en) |
Cited By (1)
| Publication number | Priority date | Publication date | Assignee | Title |
|---|---|---|---|---|
| US8711432B2 (en) | 2011-06-14 | 2014-04-29 | Seiko Epson Corporation | Image processing device, printing apparatus, image processing method, and method of producing printing apparatus |
Families Citing this family (79)
| Publication number | Priority date | Publication date | Assignee | Title |
|---|---|---|---|---|
| US7251058B2 (en) * | 2001-11-26 | 2007-07-31 | Ioan Pop | Method for generating customized ink/media transforms |
| US7173733B2 (en) * | 2002-11-07 | 2007-02-06 | University Of Delaware | Method for modeling color halftones |
| US7605943B2 (en) * | 2003-11-03 | 2009-10-20 | Seiko Epson Corporation | Production of a color conversion profile utilizing comparison of spectral reflectance data and comparative colors |
| US7706604B2 (en) * | 2003-11-03 | 2010-04-27 | Seiko Epson Corporation | Production of color conversion profile for printing |
| JP4238992B2 (en) * | 2003-12-15 | 2009-03-18 | 富士ゼロックス株式会社 | Color image processing method, color image processing apparatus, color image processing program, and storage medium |
| US7551315B2 (en) * | 2004-02-25 | 2009-06-23 | Seiko Epson Corportion | Color matching accuracy under multiple printing conditions |
| JP4343752B2 (en) * | 2004-03-31 | 2009-10-14 | キヤノン株式会社 | Color processing apparatus and method |
| JP4721398B2 (en) * | 2004-03-31 | 2011-07-13 | キヤノン株式会社 | Color processing apparatus and method |
| JP4265484B2 (en) * | 2004-06-08 | 2009-05-20 | コニカミノルタビジネステクノロジーズ株式会社 | Image processing apparatus, image processing method, and image forming apparatus |
| JP4646567B2 (en) * | 2004-08-05 | 2011-03-09 | キヤノン株式会社 | Color conversion table creation method and image processing apparatus |
| US7755817B2 (en) * | 2004-12-07 | 2010-07-13 | Chimei Innolux Corporation | Color gamut mapping |
| US7626742B2 (en) * | 2005-02-16 | 2009-12-01 | Samsung Electronics Co., Ltd. | Color data conversion apparatus and method using gamut boundary descriptors |
| KR100664958B1 (en) * | 2005-07-11 | 2007-01-04 | 삼성전자주식회사 | Method and printer printing converted image using pre-defined data and color property information |
| JP4586668B2 (en) * | 2005-08-01 | 2010-11-24 | 凸版印刷株式会社 | Color information processing method, color information processing apparatus, and program thereof |
| JP4595734B2 (en) * | 2005-08-03 | 2010-12-08 | セイコーエプソン株式会社 | Profile creation method, profile creation device, profile creation program, print control method, print control device, and print control program |
| JP2007049494A (en) * | 2005-08-10 | 2007-02-22 | Konica Minolta Business Technologies Inc | Creation method for color transformation table, image processing apparatus, image processing method, image forming apparatus, and record medium |
| US8111430B2 (en) * | 2005-09-13 | 2012-02-07 | Canon Kabushiki Kaisha | Color conversion apparatus and method |
| WO2007101472A1 (en) * | 2006-03-07 | 2007-09-13 | Hewlett-Packard Development Company, L.P. | Color selection |
| JP4235837B2 (en) | 2006-04-04 | 2009-03-11 | セイコーエプソン株式会社 | Graininess prediction, profile creation and printing device |
| JP2007281724A (en) * | 2006-04-04 | 2007-10-25 | Seiko Epson Corp | Prediction of graininess |
| JP4788486B2 (en) * | 2006-06-13 | 2011-10-05 | 富士ゼロックス株式会社 | Color gamut outline creation device and color gamut outline creation program |
| JP4247639B2 (en) * | 2006-06-14 | 2009-04-02 | セイコーエプソン株式会社 | Generate a color conversion profile for printing |
| US20080056566A1 (en) * | 2006-09-01 | 2008-03-06 | Texas Instruments Incorporated | Video processing |
| US20080130987A1 (en) * | 2006-11-30 | 2008-06-05 | Microsoft Corporation | Color Management of RAW Content from Digital Capture Devices |
| US7990588B2 (en) * | 2006-12-12 | 2011-08-02 | Canon Kabushiki Kaisha | Method of finding look-up table structures in color device sampling data |
| EP1973334A3 (en) * | 2007-03-20 | 2010-01-27 | Seiko Epson Corporation | Printing control according to combinations of color materials |
| JP4974030B2 (en) * | 2007-09-12 | 2012-07-11 | キヤノン株式会社 | Image processing apparatus and image processing method |
| US8564828B2 (en) * | 2007-11-09 | 2013-10-22 | Xerox Corporation | Automated methods and systems for assessing and summarizing gamut requirements |
| US20090185202A1 (en) * | 2008-01-18 | 2009-07-23 | Xerox Corporation | Methods and systems for selecting printing materials |
| JP4924458B2 (en) * | 2008-02-05 | 2012-04-25 | セイコーエプソン株式会社 | Color conversion correspondence information creating apparatus and method, program therefor, and printing apparatus manufacturing system and method |
| JP4985475B2 (en) * | 2008-02-29 | 2012-07-25 | セイコーエプソン株式会社 | Print control apparatus, print system, and print control program |
| US20100157334A1 (en) * | 2008-12-24 | 2010-06-24 | Canon Kabushiki Kaisha | Image processing apparatus, image processing system, image processing method, and medium storing program |
| US8077352B2 (en) * | 2009-01-26 | 2011-12-13 | Xerox Corporation | GAMUT aim and GAMUT mapping method for spatially varying color lookup tables |
| JP2012516440A (en) * | 2009-01-30 | 2012-07-19 | ヒューレット−パッカード デベロップメント カンパニー エル.ピー. | Method and system for determining a spectral vector from measured electromagnetic radiation intensity |
| US8330991B2 (en) * | 2009-03-03 | 2012-12-11 | Columbia Insurance Company | Method for managing metamerism of color merchandise |
| US8467090B2 (en) * | 2009-03-03 | 2013-06-18 | Columbia Insurance Company | Color selection apparatus and method for producing low metameric color merchandise |
| EP2227000A1 (en) * | 2009-03-04 | 2010-09-08 | Agfa Graphics N.V. | Method and apparatus for calculating metameric colors |
| ES2469717T3 (en) | 2009-03-04 | 2014-06-18 | Agfa Graphics N.V. | Method and apparatus for calculating metameric colors |
| JP5347629B2 (en) * | 2009-03-26 | 2013-11-20 | セイコーエプソン株式会社 | Image processing apparatus, image processing method, and program |
| US8311324B2 (en) | 2009-08-10 | 2012-11-13 | Canon Kabushiki Kaisha | Performing spectral gamut mapping for reproducing an image |
| US9584700B2 (en) * | 2009-10-26 | 2017-02-28 | Hewlett-Packard Development Company, L.P. | Color separation table optimized for a printing process according to a print attribute by selecting particular Neugebauer primaries and Neugebauer primary area coverages |
| US8610948B2 (en) | 2009-11-24 | 2013-12-17 | Canon Kabushiki Kaisha | Spectral gamut mapping by constrained subdivision of gamut |
| US8542402B2 (en) | 2009-12-18 | 2013-09-24 | Canon Kabushiki Kaisha | Selection of samples for spanning a spectral gamut |
| US8451495B2 (en) * | 2009-12-23 | 2013-05-28 | Xerox Corporation | Color inconstancy guide for spot color print applications |
| US8456700B2 (en) * | 2009-12-23 | 2013-06-04 | Xerox Corporation | Spectral matching guide for spot color print applications |
| US8456701B2 (en) * | 2009-12-23 | 2013-06-04 | Xerox Corporation | Reference color difference quantity guide for spot color applications |
| JP5655334B2 (en) * | 2010-03-19 | 2015-01-21 | ソニー株式会社 | Image processing apparatus and method, and program |
| US20110235141A1 (en) * | 2010-03-23 | 2011-09-29 | Shestak Vladimir V | Spot Color Matching Mechanism |
| JP5777322B2 (en) * | 2010-10-29 | 2015-09-09 | キヤノン株式会社 | Color processing apparatus and color processing method |
| JP5790996B2 (en) * | 2011-01-05 | 2015-10-07 | 株式会社リコー | Image forming apparatus |
| US8885932B2 (en) * | 2011-02-01 | 2014-11-11 | Canon Kabushiki Kaisha | Image processing apparatus and profile generation method |
| JP5720303B2 (en) * | 2011-02-28 | 2015-05-20 | セイコーエプソン株式会社 | Print control apparatus and print control program |
| JP2013150205A (en) | 2012-01-20 | 2013-08-01 | Seiko Epson Corp | Manufacturing method of printing device, colorimetric apparatus and colorimetric method |
| JP5957934B2 (en) | 2012-02-13 | 2016-07-27 | セイコーエプソン株式会社 | Printing apparatus, printing method, program |
| US9686444B2 (en) * | 2012-07-11 | 2017-06-20 | Hewlett-Packard Development Company, L.P. | Color separation and printing |
| CN103544334B (en) * | 2012-12-10 | 2016-06-22 | 慈溪市桥头京姬电子元件厂 | Many ink printer formulation selection algorithms based on CII and aberration |
| JP5856593B2 (en) * | 2013-08-30 | 2016-02-10 | 富士フイルム株式会社 | Color separation apparatus, color separation method, and color separation program |
| JP5856594B2 (en) * | 2013-08-30 | 2016-02-10 | 富士フイルム株式会社 | Color separation apparatus, color separation method, and color separation program |
| JP6349707B2 (en) | 2013-12-11 | 2018-07-04 | セイコーエプソン株式会社 | Color conversion apparatus, lookup table generation method, and lookup table generation apparatus |
| JP6349708B2 (en) * | 2013-12-11 | 2018-07-04 | セイコーエプソン株式会社 | Lookup table generation method and lookup table generation apparatus |
| JP6349747B2 (en) | 2014-01-30 | 2018-07-04 | セイコーエプソン株式会社 | Color conversion lookup table generation method, apparatus, and program |
| EP3125521B1 (en) | 2014-03-27 | 2019-03-13 | Fujifilm Corporation | Printing system, halftone processing rule generation method, characteristic parameter acquisition method, image processing device and method, halftone processing rule, halftone image, printed matter production method, inkjet printing system, and program |
| JP6326955B2 (en) * | 2014-05-15 | 2018-05-23 | 凸版印刷株式会社 | Color prediction system and color prediction method |
| JP6338480B2 (en) * | 2014-07-22 | 2018-06-06 | 株式会社Screenホールディングス | Color conversion apparatus and color conversion method |
| US10171706B2 (en) | 2014-10-30 | 2019-01-01 | Hewlett-Packard Development Company, L.P. | Configuring an imaging system |
| JP6552240B2 (en) * | 2015-03-26 | 2019-07-31 | キヤノン株式会社 | Image processing apparatus, image recording apparatus, setting method of dot mixing ratio, and program |
| JP6552241B2 (en) * | 2015-03-26 | 2019-07-31 | キヤノン株式会社 | Image processing apparatus and recording ratio determination method |
| JP6544961B2 (en) * | 2015-03-26 | 2019-07-17 | キヤノン株式会社 | IMAGE PROCESSING APPARATUS, IMAGE RECORDING APPARATUS, IMAGE PROCESSING METHOD, AND PROGRAM |
| JP6540240B2 (en) * | 2015-06-03 | 2019-07-10 | 凸版印刷株式会社 | Color estimation system, plate making data creation system, color estimation method and plate making data creation method |
| WO2017104449A1 (en) | 2015-12-18 | 2017-06-22 | セイコーエプソン株式会社 | Method for creating color conversion table |
| US9994053B2 (en) * | 2016-03-01 | 2018-06-12 | Electronics For Imaging, Inc. | Achieving ink cost saving for printing devices by taking visual appearance and real ink costs into account |
| EP3432566B1 (en) | 2016-03-17 | 2024-05-08 | Seiko Epson Corporation | Color correction table creating method, color correction table creating device, and program |
| JP6717058B2 (en) | 2016-06-01 | 2020-07-01 | 凸版印刷株式会社 | Reproduction color profile correction system, reproduction color profile correction method and program |
| US10979600B2 (en) * | 2017-09-05 | 2021-04-13 | Hp Indigo B.V. | Method and printer system for determining adjusted output settings |
| US10516809B2 (en) * | 2018-02-28 | 2019-12-24 | Ricoh Company, Ltd. | Optimizing number of grid points in multi-dimensional color lookup table |
| US11405529B2 (en) * | 2018-05-15 | 2022-08-02 | Hewlett-Packard Development Company, L.P. | Color table generation |
| US11023791B2 (en) * | 2019-10-30 | 2021-06-01 | Kyocera Document Solutions Inc. | Color conversion using neural networks |
| US20220247888A1 (en) * | 2021-02-03 | 2022-08-04 | Xerox Corporation | Utilizing a graininess-based metric to estimate a total colorant limit |
| JP2023165244A (en) * | 2022-05-02 | 2023-11-15 | セイコーエプソン株式会社 | Image analyzer |
Family Cites Families (20)
| Publication number | Priority date | Publication date | Assignee | Title |
|---|---|---|---|---|
| JPH09163382A (en) * | 1995-12-07 | 1997-06-20 | Toyo Ink Mfg Co Ltd | Color slurring correction method and device |
| JPH11261740A (en) | 1998-03-13 | 1999-09-24 | Ricoh Co Ltd | Picture evaluating method, its device and recording medium |
| JP2001320592A (en) | 2000-05-08 | 2001-11-16 | Fujitsu Ltd | Printer profile generator and printer profile generating method |
| US6652060B2 (en) * | 2000-07-12 | 2003-11-25 | Canon Kabushiki Kaisha | Image recording apparatus, image recording method, storage medium which stores computer-readable program and the same program |
| JP2002103582A (en) * | 2000-09-27 | 2002-04-09 | Seiko Epson Corp | Print onto surface layer of data recording medium |
| DE10110125A1 (en) * | 2001-03-02 | 2002-09-19 | Heidelberger Druckmasch Ag | Method for determining a color profile for printing with N printing inks |
| JP2002354276A (en) | 2001-05-23 | 2002-12-06 | Toppan Printing Co Ltd | Method and device for converting color |
| JP2003001810A (en) * | 2001-06-20 | 2003-01-08 | Canon Inc | Calibration apparatus, ink jet recording apparatus, calibration method, and recording medium wherein testing images for calibration are recorded |
| US7053910B2 (en) * | 2001-07-30 | 2006-05-30 | Canon Kabushiki Kaisha | Reducing metamerism in color management systems |
| JP2003065852A (en) * | 2001-08-29 | 2003-03-05 | Canon Inc | Image processing method, device and program |
| JP4765236B2 (en) * | 2001-09-27 | 2011-09-07 | ブラザー工業株式会社 | Color conversion characteristic setting device for image forming apparatus |
| US6698860B2 (en) * | 2001-11-01 | 2004-03-02 | E. I. Du Pont De Nemours And Company | Spectral color reproduction with six color output |
| JP4027084B2 (en) | 2001-11-14 | 2007-12-26 | キヤノン株式会社 | Image forming apparatus and control method thereof |
| US6752082B2 (en) * | 2002-02-21 | 2004-06-22 | Océ Display Graphics Systems | Systems and method for selecting a media for a print job |
| JP3973465B2 (en) * | 2002-03-19 | 2007-09-12 | リョービ株式会社 | Color matching method |
| JP3927849B2 (en) * | 2002-04-11 | 2007-06-13 | キヤノン株式会社 | Image processing system and control method thereof, image processing method, program, and recording medium |
| JP2003333355A (en) * | 2002-05-10 | 2003-11-21 | Canon Inc | Color evaluation apparatus and method |
| JP3787534B2 (en) * | 2002-05-20 | 2006-06-21 | キヤノン株式会社 | Image processing apparatus, image processing method, and image processing program |
| JP4340861B2 (en) * | 2003-09-11 | 2009-10-07 | セイコーエプソン株式会社 | Print control apparatus, print control method, and print control program |
| JP4247639B2 (en) * | 2006-06-14 | 2009-04-02 | セイコーエプソン株式会社 | Generate a color conversion profile for printing |
-
2003
- 2003-11-03 US US10/700,658 patent/US7652789B2/en active Active
-
2004
- 2004-11-01 WO PCT/JP2004/016511 patent/WO2005043884A1/en active Application Filing
- 2004-11-01 JP JP2006539127A patent/JP4388553B2/en active Active
Cited By (1)
| Publication number | Priority date | Publication date | Assignee | Title |
|---|---|---|---|---|
| US8711432B2 (en) | 2011-06-14 | 2014-04-29 | Seiko Epson Corporation | Image processing device, printing apparatus, image processing method, and method of producing printing apparatus |
Also Published As
| Publication number | Publication date |
|---|---|
| WO2005043884A1 (en) | 2005-05-12 |
| JP2007516663A (en) | 2007-06-21 |
| US20050094169A1 (en) | 2005-05-05 |
| US7652789B2 (en) | 2010-01-26 |
Similar Documents
| Publication | Publication Date | Title |
|---|---|---|
| JP4388553B2 (en) | Generate a color conversion profile for printing | |
| JP4528782B2 (en) | Generate a color conversion profile for printing | |
| JP4247639B2 (en) | Generate a color conversion profile for printing | |
| US7239422B2 (en) | Color gamut mapping using a cost function | |
| JP4561483B2 (en) | Determining the ink amount combination that reproduces the specified color | |
| US9965708B2 (en) | Color conversion apparatus, look-up table generating method, and look-up table generating apparatus | |
| JP4200365B2 (en) | Correspondence definition data creation grid point determination method, correspondence definition data creation grid point determination apparatus, correspondence definition data creation grid point determination program, print control apparatus, print control method, print control program, and image data processing apparatus | |
| JP4235837B2 (en) | Graininess prediction, profile creation and printing device | |
| EP1447972A2 (en) | Calibrating a digital printer using a cost function | |
| US20020154326A1 (en) | Image processing method and apparatus | |
| JP6349741B2 (en) | Look-up table generation method and color conversion device | |
| JP5589520B2 (en) | Color conversion profile creation apparatus, color conversion profile creation method, color conversion profile creation program, and printing apparatus | |
| JP2005103921A (en) | Apparatus for processing image, method for processing image, program for processing image and apparatus for controlling printing | |
| JP2010147586A (en) | Print result predicting method, profile forming method, printer, and survey sheet | |
| JP4380503B2 (en) | Lookup table creation method and separation method | |
| JP2008259169A (en) | Prediction of printing result | |
| JP2010221438A (en) | Printing apparatus, printing method and method for forming lookup table | |
| JP2012129905A (en) | Color conversion profile creation apparatus, color conversion profile creation method, color conversion profile creation program, and printer | |
| JP2003283856A5 (en) | ||
| KR100731582B1 (en) | Six Color Printer System and Method for Separating Six Color at the same | |
| JP2007281610A (en) | Preparation of profile | |
| JP2010141830A (en) | Profile creating method, printing control method, printing control device, and printer | |
| JP2010221437A (en) | Printing apparatus, printing method, and method for forming lookup table | |
| JP2011077974A (en) | Granularity predicting device, method of predicting granularity, method of creating profile, and printer | |
| JP2005284521A (en) | Printing control utilizing color transformation profile corresponding to color reproduction of multiple sorts |
Legal Events
| Date | Code | Title | Description |
|---|---|---|---|
| A521 | Request for written amendment filed |
Free format text: JAPANESE INTERMEDIATE CODE: A523 Effective date: 20070613 |
|
| A621 | Written request for application examination |
Free format text: JAPANESE INTERMEDIATE CODE: A621 Effective date: 20070613 |
|
| A131 | Notification of reasons for refusal |
Free format text: JAPANESE INTERMEDIATE CODE: A131 Effective date: 20090519 |
|
| A521 | Request for written amendment filed |
Free format text: JAPANESE INTERMEDIATE CODE: A523 Effective date: 20090818 |
|
| TRDD | Decision of grant or rejection written | ||
| A01 | Written decision to grant a patent or to grant a registration (utility model) |
Free format text: JAPANESE INTERMEDIATE CODE: A01 Effective date: 20090915 |
|
| A01 | Written decision to grant a patent or to grant a registration (utility model) |
Free format text: JAPANESE INTERMEDIATE CODE: A01 |
|
| A61 | First payment of annual fees (during grant procedure) |
Free format text: JAPANESE INTERMEDIATE CODE: A61 Effective date: 20091002 |
|
| R150 | Certificate of patent or registration of utility model |
Ref document number: 4388553 Country of ref document: JP Free format text: JAPANESE INTERMEDIATE CODE: R150 Free format text: JAPANESE INTERMEDIATE CODE: R150 |
|
| FPAY | Renewal fee payment (event date is renewal date of database) |
Free format text: PAYMENT UNTIL: 20121009 Year of fee payment: 3 |
|
| FPAY | Renewal fee payment (event date is renewal date of database) |
Free format text: PAYMENT UNTIL: 20121009 Year of fee payment: 3 |
|
| FPAY | Renewal fee payment (event date is renewal date of database) |
Free format text: PAYMENT UNTIL: 20131009 Year of fee payment: 4 |
|
| S531 | Written request for registration of change of domicile |
Free format text: JAPANESE INTERMEDIATE CODE: R313531 |
|
| R350 | Written notification of registration of transfer |
Free format text: JAPANESE INTERMEDIATE CODE: R350 |
|
| R250 | Receipt of annual fees |
Free format text: JAPANESE INTERMEDIATE CODE: R250 |
|
| R250 | Receipt of annual fees |
Free format text: JAPANESE INTERMEDIATE CODE: R250 |
|
| R250 | Receipt of annual fees |
Free format text: JAPANESE INTERMEDIATE CODE: R250 |
|
| R250 | Receipt of annual fees |
Free format text: JAPANESE INTERMEDIATE CODE: R250 |
|
| R250 | Receipt of annual fees |
Free format text: JAPANESE INTERMEDIATE CODE: R250 |