JP2004533036A - Data sharing in process plants - Google Patents
Data sharing in process plants Download PDFInfo
- Publication number
- JP2004533036A JP2004533036A JP2002570030A JP2002570030A JP2004533036A JP 2004533036 A JP2004533036 A JP 2004533036A JP 2002570030 A JP2002570030 A JP 2002570030A JP 2002570030 A JP2002570030 A JP 2002570030A JP 2004533036 A JP2004533036 A JP 2004533036A
- Authority
- JP
- Japan
- Prior art keywords
- data
- application
- plant
- collecting
- applications
- Prior art date
- Legal status (The legal status is an assumption and is not a legal conclusion. Google has not performed a legal analysis and makes no representation as to the accuracy of the status listed.)
- Pending
Links
Images


Classifications
-
- G—PHYSICS
- G05—CONTROLLING; REGULATING
- G05B—CONTROL OR REGULATING SYSTEMS IN GENERAL; FUNCTIONAL ELEMENTS OF SUCH SYSTEMS; MONITORING OR TESTING ARRANGEMENTS FOR SUCH SYSTEMS OR ELEMENTS
- G05B23/00—Testing or monitoring of control systems or parts thereof
- G05B23/02—Electric testing or monitoring
- G05B23/0205—Electric testing or monitoring by means of a monitoring system capable of detecting and responding to faults
- G05B23/0259—Electric testing or monitoring by means of a monitoring system capable of detecting and responding to faults characterized by the response to fault detection
- G05B23/0267—Fault communication, e.g. human machine interface [HMI]
-
- G—PHYSICS
- G05—CONTROLLING; REGULATING
- G05B—CONTROL OR REGULATING SYSTEMS IN GENERAL; FUNCTIONAL ELEMENTS OF SUCH SYSTEMS; MONITORING OR TESTING ARRANGEMENTS FOR SUCH SYSTEMS OR ELEMENTS
- G05B17/00—Systems involving the use of models or simulators of said systems
- G05B17/02—Systems involving the use of models or simulators of said systems electric
-
- G—PHYSICS
- G05—CONTROLLING; REGULATING
- G05B—CONTROL OR REGULATING SYSTEMS IN GENERAL; FUNCTIONAL ELEMENTS OF SUCH SYSTEMS; MONITORING OR TESTING ARRANGEMENTS FOR SUCH SYSTEMS OR ELEMENTS
- G05B2219/00—Program-control systems
- G05B2219/30—Nc systems
- G05B2219/32—Operator till task planning
- G05B2219/32015—Optimize, process management, optimize production line
Abstract
プロセスプラントは、例えば、プロセス制御機能領域、保守機能領域、及びビジネスシステム機能領域を含む種々のソースからのプラントの機能領域からプロセスプラントの資産に関連するデータ又は情報を集めるために、資産活用エキスパートを用いる。このデータ及び情報はデータベースに格納され及び送出され、例えば最適化及びモデリングツールのようなツールによって、調整された方法で処理される。このデータは、また、全体的により良好な又は最適化された制御、保守及びビジネスのアクティビティのために使用される他の領域又はツールに再配布される。情報又はデータは、デバイス、ループ、ユニット、その他の健全性、変動性、能力又は利用性に関連する保守機能によって集められ得、そして、この情報は、次に、プロセスオペレータ又は保守要員に送り出され、その人に現在又は将来の問題を知らせるために表示される。The process plant may be an asset utilization expert to gather data or information related to the assets of the process plant from functional areas of the plant from various sources including, for example, process control functional areas, maintenance functional areas, and business system functional areas. Is used. This data and information is stored and transmitted to a database and processed in a coordinated manner by tools such as, for example, optimization and modeling tools. This data is also redistributed to other areas or tools used for better or optimized control, maintenance and business activities overall. The information or data can be gathered by devices, loops, units, and other maintenance functions related to health, variability, capability, or availability, and this information is then sent to process operators or maintenance personnel. Is displayed to inform the person of a current or future problem.
Description
【技術分野】
【0001】
本願は、2001年3月1日に出願された米国仮出願番号60/273,164の優先権を主張する。この文書は、また、2001年9月17日に出願され「プロセス能力監視のプロセス装置監視及び制御との統合」と名付けられた米国特許出願番号09/953,811の継続出願であり、それは参照によって明確にここに取り込まれる。
【0002】
この開示は、概略的には、プロセスプラント内に於けるプロセス制御及び保守システムに関し、より詳しくは、プロセスプラント内の複数のデータソースからデータを集めて再配布する調整されたエキスパートシステムの使用に関する。
【背景技術】
【0003】
化学製品、石油又はその他プロセスに於いて使用されるプロセス制御システムは、少なくとも一つのホスト又はオペレータワークステーションと、フィールドデバイスのようなプロセス制御及び計測デバイスとに、アナログ、デジタル又はアナログ/デジタル結合バスを介して通信可能に接続された、一又はそれ以上の中央集権化され又は脱中央集権化されたプロセスコントローラを典型的に含んでいる。例えばバルブポジショナ、スイッチ、トランスミッタ、及びセンサ(例えば、温度、圧力及び流速センサ)であるフィールドデバイスは、例えばバルブの開閉、プロセスパラメータの計測などのプロセス内の機能を実行する。プロセスコントローラは、フィールドデバイスによって作成され若しくは関連するプロセス測定値若しくはプロセス変数及び/又はフィールドデバイスに関する情報を表す信号を受領し、制御ルーチンを実行するためにこの情報を使用し、及び次にプロセスの動作を制御するためにフィールドデバイスにバスの一つ又はそれ以上に亘って送り出される制御信号を生成する。フィールドデバイス及びコントローラからの情報は、プロセスの現状を見たり、プロセスの動作を変更したりするような、プロセスに関する所望の機能をオペレータが実行することを可能にするために、オペレータワークステーションにより実行される一つ以上のアプリケーションに典型的に利用できるようにされる。
【0004】
典型的プロセス制御システムは、バルブ、トランスミッタ、センサ等の、プロセスの動作の間これらのデバイスを制御するソフトウエアを実行する一又はそれ以上のプロセスコントローラに接続された多くのプロセス制御及び計測デバイスを有しているけれど、プロセス動作のために必要であるか又は関連がある多くの他の支持デバイスが存在する。これらの付加的なデバイスには、典型的なプラントの多くの場所に配置される、例えば電源供給装置、発電装置及び配電装置、並びにタービン等の回転装置が含まれる。この付加的な装置は、必ずしもプロセス変数を生成し又は使用するというわけではなく、多くの例においては、プロセス動作に影響を及ぼす目的で制御されず又は接続さえされていないが、それにもかかわらず、この装置は、プロセスの適正な動作のためには重要でやはり必要である。しかしながら、過去に於いては、プロセス制御を実行するときにこれらのデバイスが適切に作動していたと単に仮定すると、プロセスコントローラは、必ずしもこれらの他のデバイス又はプロセスコントローラを知る必要はかった。
【0005】
更に、多くのプロセスプラントは、ビジネス機能又は保守機能に関連した他のアプリケーションを実行するこれに関連する他のコンピュータを有している。例えば、幾つかのプラントコンピュータは、発注原料、交換部品又はプラント用のデバイスに関連するアプリケーション、販売予測及び生産ニーズ等に関連したアプリケーションを実行する。同様に、多くのプロセスプラント及び特にコンピュータ化したフィールドデバイスを使用するものは、これらのデバイスがプロセス制御及び計装デバイス又は他の種類のデバイスであるかどうかにもかかわらず、プラント内でデバイスをモニタし及び維持することを助けるアプリケーションを含んでいる。例えば、Fisher-Rosemount Systems社で販売されるAsset Management Solutions(AMS)アプリケーションは、通信を可能にし、フィールドデバイスに関連するデータを格納し、フィールドデバイスの動作状態を確認して追跡する。このようなシステムの例は、「フィールドデバイスマネージメントシステムに於いて使用するための統合通信ネットワーク」と名付けられた米国特許第5,960,214号に開示されている。幾つかの例においては、AMSアプリケーションは、デバイスと通信を行ってデバイス内のパラメータを変更するため、デバイスにそれ自身に於いて自己校正ルーチン又は自己診断ルーチンのようなアプリケーションを実行させるため、これらのデバイスの状態又は健全性についての情報を得るため等のために使用され得る。この情報は、これらのデバイスを監視し及び維持するために保守要員によって格納されて使用される。同様に、例えば回転機器並びに発電及び供給デバイス等の他の種類のデバイスを監視するために用いるアプリケーションの他の種類がある。これらの他の応用は、典型的には、保守要員が利用できて、プロセスプラント内でデバイスを監視し維持するために用いられる。しかしながら、多くの場合、外部のサービス機関は、プロセス能力及び機器を監視することに関連したサービスを実行する。これらの場合、外部のサービス機関は、それらが必要なデータを取得し、そのデータを分析するために典型的な所有アプリケーションを実行し、プロセスプラント要員には単に結果と勧告とを提供する。有用ではあっても、プラント要員が、計測された生データを見るか又は何れかの方法で分析されたデータを使用する能力に乏しいか又は持っていない。
【0006】
しかしながら、典型的プラント又はプロセスでは、プロセス制御アクティビティ、デバイス及び装置保守及び監視アクティビティ、並びにビジネスアクティビティに関連する機能は、これらのアクティビティが発生する場所、及び典型的にこれらのアクティビティを実行する人材の両方に別々に存在する。更に、これらの異なる機能に関連する異なる人々は、異なるアプリケーションのような異なるツールを異なるコンピュータで実行して異なる機能を実行している。多くの例では、これらの異なるツールは、そのプロセス内の異なるデバイスに関連し又はデバイスから集められた異なるタイプのデータを収集し又は使用し、そして、それらが必要とするデータを収集するために別々にセットアップされる。例えば、一般にプロセスの日々の動作を監督し、そして、主として概してプロセス動作の質及び連続性を保証することに対して責任があるプロセス制御オペレータは、プロセスのチューニングループ内の設定値をセットし及び変更すること、バッチ動作のようなプロセス動作をスケジュールすること等によって、プロセスに典型的に影響を及ぼす。これらのプロセス制御オペレータは、例えば、診断して、オートチューナ、ループアナライザ、ニューラルネットワークシステム等を含むプロセス制御システム内で、プロセス制御の問題を診断し及び修正するのに利用できる道具を使用し得る。また、プロセス制御オペレータも、動作について、オペレータに情報を提供する一つ以上のプロセスコントローラを介して、プロセス内で生成されるアラームを含むプロセス変数情報をプロセスから受領する。この情報は、標準のユーザーインターフェースを介してプロセス制御オペレータに提供される得る。
【0007】
更に、適正にオペレーティングループを検出し、問題を修正するために提案されているアクションのコースについての情報をオペレータに提供するために、プロセス制御ルーチンに関連する制御ルーチン又は機能ブロック又はモジュールの動作状態についてのプロセス制御変数及び制限された情報を使用するエキスパートエンジンを提供することが知られている。このようなエキスパートエンジンは、「プロセス制御システムに於ける診断」と題された1999年2月22日に出願された米国出願番号09/256585において、及び「診断エキスパートプロセス制御システム」と題された2000年2月7日に出願された米国特許出願番号09/499445において開示されており、いずれも本願明細書に参照によって明確にここに組み込まれる。同様に、プロセスプラントの制御アクティビティを最適化するために、プラント内の例えばリアルタイム最適化プログラム等の制御最適化プログラムを実行することは公知である。幾つかの最適化プログラムは、例えば利益のような幾つかの所望の最適化変数に関して、プラントの動作を最適化するように入力がどのように変更されるかを予測するために、プラントの複雑なモデルを用いている。
【0008】
他方、主にプロセス内の実際の機器が能率的に動作していることを保証するために、そして、故障している装置を修理及び交換することに責任がある保守要員は、例えば上で議論された保守インタフェース、AMSアプリケーションツールに加えて、プロセス内でデバイスの動作状態について情報を提供する多くの他の診断ツールを使用する。保守要員も、プラントの部分の停止を必要とし得る保守アクティビティを予定する。一般的にスマートフィールドデバイスと称される多くのプロセスデバイス及び機器のより新しいタイプについては、そのデバイスの動作につい他の問題を自動的に検知し、及び標準的な保守インターフェイスを介して保守要員にこれらの問題点を自動的に報告する検出及び診断ツールを含み得る。例えば、AMSソフトウェアは、デバイス状態及び診断情報を保守要員に報告し、及びデバイスにおいて何が発生しているかを決定し、及びデバイスによって提供されるデバイス情報にアクセスすることを可能にする通信及びその他ツールを提供する。
【0009】
典型的には、保守インタフェース及び保守要員は、常にというわけではないが、プロセス制御オペレータから離れて位置している。例えば、幾つかのプロセスプラントでは、プロセス制御オペレータは保守要員又はの任務を遂行し得、その逆も同様であり、又はこれらの機能に対して責任がある異なる人も同じインタフェースを使用できる。
【0010】
また、部品、供給品、原料等を発注すること、プラント内でどの製品を製造しどの変数を最適化するべきか等について選択することのような戦略的事業決定を行うこと、どの変数を最適化するかのようなビジネスアプリケーションに使用される責任ある人及びアプリケーションは、プロセスコントロールインターフェイス及び保守インターフェイスの両方から離れたプラントのオフィスに典型的に位置している。同様に、管理者又は他の人は、そのプロセスプラントに関連する離れた位置又は他のコンピュータシステムから、プラント動作を監視し及び長期の戦略的な決定をするのに使用するために、プロセスプラント内の特定の情報にアクセスすることを望むかもしれない。
【0011】
また更に、多くの場合、装置の監視、デバイスの動作のテスト、プラントが最適の方法で稼働しているかなどのいくつかの作業は、必要とされるデータを測定し、分析を行い、プラント要員にその分析の結果のみを提供する外部のコンサルタント又はサービス会社によって行なわれている。これらの場合、データは典型的には集められて独自の方法で格納され、めったに他の理由のためにプラント要員が利用できるようにされることはない。
【0012】
大部分は、プラント内で異なる機能を実行するために用いる非常に異なるアプリケーション、例えばプロセス制御動作、保守動作及び営業活動は分離されているので、これらの異なる作業のために使用される異なるアプリケーションは統合されることはなく、従って、データ又は情報を共有することはない。事実、多くのプラントは、全てではないが幾分かのこれらの異なるタイプのアプリケーションを含んでいる。更に、たとえアプリケーションの全てがプラント内に位置する場合であっても、異なる要員がこれらの異なるアプリケーション及び解析ツール及びこれらのツールを使用するので、そして、これらのツールはプラント内で一般に異なるハードウェアの位置にあるので、プラントの一つの機能的領域からの情報の流れは、たとえこの情報がプラント内の他の機能にとって有用であっても、ほとんど無い。例えば、回転機器データ解析ツールのようなツールが、十分に機能していない電力発生器又は一部の回転機器を検出するために(非プロセス変数型のデータに基づいて)、保守要員人によって使用され得る。このツールは、問題を検出し、デバイスが調整され修復され又は交換されるべきであることの必要性を保守要員に警告し得る。しかしながら、たとえ不十分な稼働をしているデバイスがループ又はプロセス制御動作によって監視されている幾つかの他の構成要素に影響を与えている問題を引き起こしていても、プロセス制御オペレータ(人間又はソフトウェアエキスパートの何れも)は、この情報の利益を有することはない。同様に、ビジネスマンは、たとえ故障しているデバイスが重大であっても、そして、ビジネスマンが所望する方法でプラントの最適化を妨げることがあっても、この事実に気づいてはいない。プロセス制御エキスパートが、プロセス制御システムに於けるループ又はユニットの低い能力を究極的に引き起こしているデバイスの問題に気づいているので、そして、プロセス制御オペレータ又はエキスパートがこの装置は完全に稼働していると見なしているので、プロセス制御エキスパートは、プロセス制御ループ内でそれが検出する問題を誤診し、又はループチューナのようなツールを適用しようとすることとなり、これは決してその問題を解決することはできない。同様に、ビジネスマンは、デバイスの故障により、(利益を最適化する等の)所望のビジネスの効果を決して達成することができない方法で、プラントを可動するというビジネス決定をすることとなる。
【0013】
多量のデータ解析及び他の決定並びにプロセス制御環境において利用できる他の検出及び診断ツールによれば、保守要員にとって有用なデバイスの健全性及び能力についての、プロセスオペレータ及びビジネスマンにとって役に立つ多くの情報がある。同様に、プロセス制御ループ及び他のルーチンの現在のオペレータの状態についての、プロセスオペレータにとって有用な多くの情報がある。同様に、ビジネスの機能を果たす過程で生成され又は使用される、保守要員又はプロセス制御オペレータにとってプロセスの動作の最適化に於いて有用な情報がある。しかしながら、過去に於いて、これらの機能が分離していたために、機能的な領域で生成され又は収集された情報は、他の機能領域では全く又は十分には使用されず、このことは、プロセスプラント内の資産の全体に亘る最適状態には及ばない使用となっている。
【発明の開示】
【課題を解決するための手段】
【0014】
プロセスプラントは、例えば、プラントの種々のソース又は機能領域、保守機能領域及びビジネスシステム機能領域からのプロセスプラントの資産に関連するデータ又は情報を収集するために、資産活用エキスパートを使用する。このデータ及び情報は、次に送り出され、例えば最適化及びモデリングツール等のツールによる調整された方法により処理され、そして、それがより良い又はより最適な制御、保守及びビジネスアクティビティを達成するのに使用される他の領域又はツールに再配布される。例えば、情報又はデータは、健全性、変数、デバイス、ループ、ユニット、その他の能力又は利用性に関連する保守機能によって集められ得る。この情報は、次に、それから送り出され、プロセスオペレータ又は保守要員に表示し、その人に現在又は将来の問題を知らせる。この同じ情報は、ループ内の現在の問題を修正するために、又は不適切に動作しているデバイスを捕らえ又は修正するようにシステムの制御計画を変更するために、プロセスオペレータによって使用され得る。
【0015】
一実施態様では、プロセスプラント内のデータ通信システムは、複数の異なるタイプのデータを格納するように構成されたデータベースと、異なる通信ネットワークを介してそのデータベースに通信可能に接続された複数のアプリケーションとを備え、複数のアプリケーションは、2又はそれ以上のプロセス制御アプリケーションと、最適化アプリケーションのようなプロセス品質監視アプリケーションと、プロセスデバイス監視アプリケーションと、ビジネスアプリケーションとを含んでいる。この場合、複数のアプリケーションのそれぞれは、データベース内に格納されるべきデータをそのデータベースに送出し、複数のアプリケーションの少なくとも一つはそのアプリケーションの他の一つを介してデータベースに送られたデータベースからのデータにアクセスするように構成されている。所望なら、複数のアプリケーションの一又はそれ以上が、そのプロセスプラントに関連するサービスプロバイダによって提供され又は実装され得る。
【発明を実施するための最良の形態】
【0016】
図1を参照すれば、プロセスプラント10は、多くのビジネス並びに他の一つ以上の通信ネットワークによって接続された多くの制御及び保守システムコンピュータシステムを含んでいる。プロセスプラント10は、一つ以上のプロセス制御システム12及び14を含んでいる。プロセス制御システム12は、PROVOX若しくはRS3システム、又はコントローラ12B及び入力/出力(I/O)カード12Cに接続され、次にアナログ及びHighway Addressable Remote Transmitter (HART)フィールドデバイス15のような種々のフィールドデバイスに接続されているオペレータインタフェース12Aを含む他のDCSのような従来のプロセス制御システムであってもよい。分散形プロセス制御システムであり得るプロセス制御システム14は、イーサネット(R)バスのようなバスを介して一つ以上の分散型コントローラ14Bに接続された一つ以上のオペレータインターフェイス14Aを含んでいる。例えば、コントローラ14Bは、テキサス州オースティンのFisher-Rosemount Systems, INC.によって販売されているDeltaV(登録商標)又はどのような他のタイプのコントローラであってもよい。コントローラ14Bは、例えばHART又はFieldbusフィールドデバイス、又は例えばPROFIBUS(R), WORLDFIP (R), Device-Net(R), AS-INTERFACE及びCAN protocolsの何れかを使用するどのようなコンピュータ化したデバイス若しくはコンピュータ化していないデバイスの1以上のフィールドデバイス16にI/Oを介して接続されている。既に知られているように、フィールドデバイス16は、他のデバイス情報と同様にプロセス変数に関連したコントローラ14Bに、アナログ又はデジタル情報を提供し得る。オペレータインタフェース14Aは、プロセス制御オペレータが、例えば制御最適化プログラム、診断エキスパート、ニューラルネットワーク、チューナ等のプロセスの動作を制御するのに有用なツールを格納し及び実行する。
【0017】
また更に、AMSアプリケーション又は他のデバイス監視又は通信アプリケーションを実行しているコンピュータのような保守システムは、保守及び監視アクティビティを実行するために、プロセス制御システム12及び14又はその個々のデバイスに接続され得る。例えば、幾つかの例では、バイス15上の他の保守アクティビティと通信し又は再構成し若しくは実行するために、保守コンピュータ18はコントローラ12B及び/又はデバイス15に、所望の通信ライン又は通信ネットワーク(無線又はハンドヘルドデバイスネットワークを含む)を介して接続され得る。同様に、AMSアプリケーションのような保守アプリケーションは、デバイス16の操作の状態に関連したデータ収集を含む保守及び監視機能を果たすように、分散形プロセス制御システム14に関連するユーザインターフェイス14Aの1以上によって実装され及び実行され得る。
【0018】
また、プロセスプラント10は、タービン、モータ等の種々の回転装置20を含み、そして、(バス、無線通信システム又は装置20に読み取るために接続されて次に除去されるハンドヘルドデバイスのような)幾つかの永続的又は一時的な通信リンクを介する保守コンピュータ22に接続されている。保守コンピュータ22は、例えば、回転装置20の動作状態を診断し監視し及び最適化するのに使用されるCSiシステム又は他の公知のアプリケーションによって提供される。保守要員は、プラント10内の回転装置20の能力を維持し及び監視するために、回転装置20に関する問題を決定するために、並びに回転装置20が修理され又は交換される時期及び必要性を決定するために、通常、アプリケーション23を使用する。幾つかのケースでは、外部のコンサルタント又はサービス機関が、装置20に関するデータを補足し又は測定し、問題、低い能力又は装置20に影響を与える他の問題を検出するために、装置20に対する解析を実行するのにこのデータを使用する。
【0019】
同様に、プラント10に関連する発電及び配電装置25を有する発電及び配電システム24は、例えばバスを介して、プラント10内の発電及び配電装置25の動作を行い及び監視する他のコンピュータ26に接続されている。コンピュータ26は、発電及び配電装置25を制御し及び維持するために、例えばLiebert及びASCO又は他の会社によって提供されているような、公知の電源制御及び診断アプリケーション27を実行する。また、多くの場合、外部のコンサルタント又はサービス機構は、装置25に関するデータを補足し又は測定するためにサービスアプリケーションを使用し、そして、このデータを、問題、低能力又は装置25に影響を与える他の問題を検出するために、装置25に対する解析を実行するのにこのデータを使用し得る。この場合には、(コンピュータ26のような)解析を行っているコンピュータは、どのような通信ラインを介してもそのシステム10の残りの部分に接続されてはおらず、又は一時的に接続されているだけである。
【0020】
過去に於いては、種々のプロセス制御システム12及び14並びに発電及び保守システム22及び26は、これらのシステムが有用な方法で生成し又は収集したデータを共有するような方法で互いに接続されてはいない。結果として、プロセス制御機能、発電機能及び回転装置機能のような異なる機能のそれぞれは、影響を受け又は特定の機能に影響を与えるプラント内の他の装置は完全に動作しているという仮定の下に運転されており、これは、もちろん、殆どあり得ないケースである。
【0021】
この問題を解決するために、プラント10内の種々の機能システムに関連する、プロセス制御システム12及び14、コンピュータ18、14A、22及び26に実装されているような保守機能並びにビジネス機能を含むコンピュータ又はインターフェイスに通信可能に接続されたコンピュータシステム30が備えられている。特に、コンピュータシステム30は、従来のプロセス制御システム12及びその制御システムに関連する保守インターフェイス18に通信可能に接続され、分散化されたプロセス制御システム14のプロセス制御及び/又は保守インターフェイス14Aに接続され、すべてバス32を介して、回転装置保守コンピュータ22並びに電源及び分散コンピュータ26に接続されている。バス32は、通信を提供するために、所望のローカルエリアネットワーク(LAN)又はワイドエリアネットワーク(WAN)のプロトコルを使用し得る。
【0022】
図1に示されているように、コンピュータ30は、同じ又は異なるネットワークバス32を介してビジネスシステムコンピュータ及び保守計画コンピュータ35及び36に接続され、例えば、統合業務(ERP)、材料リソース計画(MRP)、会計、生産及び顧客オーダーシステム、保守計画システム又は部品、供給品及び原料発注アプリケーション、生産スケジュールアプリケーションを含む他の所望のビジネスアプリケーション等を実行し得る。コンピュータ30は、例えばバス32を介して、遠隔位置からプラント10に接続されているのと同様に、プラントワイドLAN37、共同WAN38に接続されている。
【0023】
一実施形態では、バス32を介する通信は、XMLプロトコルを使用して発生する。ここで、各々のコンピュータ12A、18、14A、22、26、35、36等は、XMLラッパにラップされ、例えば、コンピュータ30に位置し得るXMLデータサーバに送られる。XMLが記述言語なので、サーバはいずれのタイプのデータも処理することができる。サーバでは、データは新たなXMLラッパでカプセル化され、すなわち、このデータは、1つのXMLスキーマから、受信するアプリケーションのそれぞれに対して生成される1以上のXMLスキーマにマップされる。このように、各々のデータ発信者は、よく理解しているかそのデバイス又はアプリケーションに都合のよいスキーマを使用してそのデータをラップすることができ、各々の受信アプリケーションは、受信アプリケーションにより使用され又は理解される異なるスキーマのデータを受信することができる。サーバは、1つのスキーマをソースに依存する他のスキーマ及びデータの宛先にマップするように構成されている。所望なら、サーバは、データの受領に基づいて特定のデータ処理機能又は他の機能を実行してもよい。マッピング及び処理機能のルールは、ここに記載されているシステムの可動に先立って準備されて格納されている。このように、データは何れか1つのアプリケーションから一つ以上の他のアプリケーションに送り出され得る。
【0024】
一般的に言って、コンピュータ30は、プロセス制御システム12及び14、保守インターフェイス18、22及び26、並びにビジネスシステム35及び36によって生成されたデータ及び他の情報を、これらのシステムのそれぞれによって実行されるデータ解析ツールによって生成される情報と同様に収集する資産活用エキスパートを格納し及び実行する。例えば、資産活用エキスパート50は、NEXUSによって現在提供されるOZエキスパートシステムに基づくものであってもよい。しかしながら、資産活用エキスパート50は、例えば、データマイニングシステムのタイプを含む他の所望のエキスパートシステムの何れかでもあってもよい。重要なことに、資産活用エキスパート50は、プロセスプラント10内のデータ及び情報センターとして機能し、保守領域のような一つの機能領域からのデータ及び情報の、プロセス制御又はビジネス機能領域のような他の機能領域への分配を調整することができる。資産活用エキスパート50は、プラント10内の異なる機能に関連する1以上のコンピュータシステムに分配され得る新たな情報を生成するために収集したデータを使用する。更に、資産活用エキスパート50は、プラント10内で使用されるべきデータの新たなタイプを生成するために、収集したデータを使用する他のアプリケーションの実行を行い又は監視し得る。
【0025】
特に、資産活用エキスパート50は、プロセス制御及び計測機器、発電デバイス、回転装置、ユニット、領域、その他のようなデバイスに関連するインデックスを生成し、又はプラント10内のループ等のようなプロセス制御エンティティに関連するインデックス生成ソフトウェア51を含み又は実行し得る。これらのインデックスは、次に、プロセス制御を最適化するのを助けるためにプロセス制御アプリケーションに提供され得、そして、プラント10の動作に関連するより完全な又は理解可能な情報をビジネスマンに提供するビジネスソフトウェア又はビジネスアプリケーションに提供され得る。資産活用エキスパート50は、また、保守データ(例えばデバイス状態情報)及びビジネスデータ(例えば予定された順序、タイムフレーム等)を、例えば最適化制御のような制御アクティビティをオペレータが実行するのを助けるプロセス制御システム14に関連する制御エキスパート52に提供することができる。制御エキスパート52は、例えばユーザインターフェイス14A若しくは制御システム14又は所望ならコンピュータ30内に配置される。
【0026】
一実施態様においては、制御エキスパート52は、例えば、上述の米国特許出願番号09/256,585号及び09/499,445号に記載されている制御エキスパートであり得る。しかしながら、これらの制御エキスパートは、これらの制御エキスパートによって実行される決定に於けるプラント10内のデバイス又は他のハードウエアの状態に関連するデータを付加的に組み込み及び使用し得る。特に、従来では、一般に、ソフトウェア制御エキスパートは、プロセスオペレータに決定又は推奨をするために、プロセス変数データ及び幾つかの限定されたデバイス状態データを使用するのみである。コンピュータシステム18,14A,22及び26並びにそれに実装されるデータ解析ツールによって提供されるようなデバイス状態情報に特に関連する資産活用エキスパート50によって提供される通信により、制御エキスパート52は、例えば健全性、能力、利用性及び可変性情報のようなデバイス状態情報を受領し及びプロセス変数情報に沿ってその決定に組み込むことができる。
【0027】
その上、資産活用エキスパート50は、デバイスの状態とプラント10内の制御アクティビティに関連する情報を、例えば作業命令生成アプリケーション又はプログラム54が作業命令及びプラント10内で検出された問題に基づいた部品の発注を自動的に生成し、又は実行されている作業に基づいて補給品が発注されるビジネスシステム35及び36に提供することができる。資産活用エキスパート50によって検出された制御システムに於ける変化は、ビジネスシステム35又は36に、例えばプログラム54を使用して実行スケジュール及び補給品発注を実行するアプリケーションを実行させる。同様の方法で、顧客の発注などに於ける変化は、ビジネスシステム35及び36に入力され得、このデータは資産活用エキスパート50に送られ、そして制御ルーチン又は制御エキスパート52に送られて、制御に於ける変化を引き起こして、例えば新たに発注された製品の製造を開始し、又はビジネスシステム35及び36に為された変化を実装する。もちろん、必要に応じて、バス32に接続している各々のコンピュータシステムは、コンピュータ内のほかのアプリケーションから適当なデータを得るように、そして、例えば資産活用エキスパート50にこのデータを送るように機能するアプリケーションをその中に有し得る。
【0028】
その上、資産活用エキスパート50は、プラント10内に一つ以上の最適化プログラム55に情報を送信し得る。例えば、制御最適化プログラム55はコンピュータ14Aに位置し得、そして、一つ以上の制御最適化ルーチン55A、55B等を実行することができる。付加的に又はその代わりに、最適化ルーチン55はコンピュータ30又は他のコンピュータ内に格納され及びコンピュータ30によって実行されることができ、それ故にデータは必然的に資産活用エキスパート50によって送られるべきである。所望なら、プラント10は、プラント10の特徴のモデルとなるモデル56を含み、これらのモデル56は、資産活用エキスパート50又は制御又は制御エキスパート52のような他のエキスパートによって実行されて、その目的について以下に詳細に述べるモデリング機能を実行する。しかしながら、一般的には、モデル56はデバイス、領域、ユニット、ループ等のパラメータを決定するために、欠陥のあるセンサ又は欠陥のある装置を最適化ルーチン55の一部として検出し、能力のようなインデックスを生成し及びそのインデックスをプラント10で使用するために利用し、多くの他の使用と同様に能力又は状態を監視するために使用され得る。モデル56は、イングランドのTeesideにあるMDC Technologyによって生成され又は販売されているものをモデルとしてもよく、又は他のどのような所望のタイプのモデルであってもよい。もちろん、プラント10内に提供され得る、そして資産活用エキスパート50からのデータを用いることができる多くの他のアプリケーションがあり、そして、ここに記載されているシステムは、ここで特に述べたアプリケーションに限定されるものではない。しかし、全体として、資産活用エキスパート50は、データの共有とプラント10の機能的な領域の全て間の資産の調整とを可能にすることによるプラント10内の資産の全ての使用を最適化するのを助ける。
【0029】
また、一般的に言って、一つ以上のユーザインタフェースルーチン58は、プラント10の内のコンピュータのうちの1台以上によって格納され及び実行され得る。例えば、コンピュータ30、ユーザインタフェース14A、ビジネスシステムコンピュータ35又は他のいかなるコンピュータも、ユーザインタフェースルーチン58を実行することができる。各々のユーザインタフェースルーチン58は、資産活用エキスパート50からの情報を受信し又は署名することができ、そして、同じか異なるデータの集合が、各々のユーザインタフェースルーチン58に送信され得る。ユーザインタフェースルーチン58の何れの一つも、異なるユーザーに異なるスクリーンを使用して異なる種類の情報を提供することができる。例えば、ユーザインタフェースルーチン58のうちの1つは、スクリーン若しくはスクリーンのセットを制御オペレータ又はビジネスマンに提供し、その人が標準の制御ルーチン又は制御最適化ルーチンに於いて使用するための最適化変数の制限を設定し又は選択することを可能とする。ユーザインタフェースルーチン58は、ユーザーが調整された幾つかのプロセスのインデックス生成ソフトウェア51により作成されるインデックスを見ることを可能にする制御ガイダンスツールを提供し得る。このオペレーターガイダンスツールは、また、プロセスプラント10の内の他のソフトウェアにより検出される情報と同じように、オペレータ又は他の人が、装置、制御ループ、ユニット等の状態に関する情報を得て、これらのエンティティに関する問題に関する情報を容易に見ることができるようにする。ユーザインタフェースルーチン58は、また、ツール23及び27により生成され又は提供される能力監視データ、AMSアプリケーション又は他の保守プログラム、又は資産活用エキスパート50と結合しているモデルによって生成されるような保守プログラムを使用して能力監視スクリーンを提供する。もちろん、ユーザインタフェースルーチン58は、いかなるユーザーアクセスも提供でき、そして、ユーザーがプラント10の機能的な領域のいずれか又は全てにおいて使用される能力又は他の変数を変更することを可能にする。
【0030】
ここで図2を参照すると、プロセスプラント10内で資産活用エキスパート50と他のコンピュータツール又はアプリケーション間のいくつかのデータフローを例示するデータフローダイヤグラムが提供されている。特に、資産活用エキスパート50は、バス(例えばFieldbus、HART及びイーサネット(R)バス)、バルブ、トランシーバ、センサー、サーバ及びコントローラのようなデータサーバ並びにプロセス計器、回転装置、電気設備、発電装置等と同様に、マルチプレクサ、送信機、センサー、ハンドヘルドデバイス、制御システム、無線周波数(RF)トランシーバ、オンライン制御システム、ウェブサーバ、ヒストリアン、制御モジュール又はプロセスプラント10内の他の制御アプリケーション、ユーザインターフェイス及びI/Oインターフェイスのようなインターフェイス等の多くのデータコレクタ又はデータソースからの情報を受け取り得る。このデータが他の機能システムによってどのようにして生成されるか又は使用されるかに基づいて、このデータはいかなる所望の形式も採り得る。また更に、このデータは、上で議論したXMLプロトコルのようないかなる所望又は適当なデータ通信プロトコル及び通信ハードウェアをも使用して、資産活用エキスパート50に送られ得る。しかし、一般的に言って、資産活用エキスパート50が自動的に1以上のデータソースから特定の種類のデータを受け取り、及び資産活用エキスパート50がそのデータに関して予め定められた動作を行い得るように、プラント10は構成される。
【0031】
また、資産活用エキスパート50は、上記で特定した米国特許出願番号09/256585号及び09/499445に記載されているようなプロセス制御システムのための能力追跡ツールと同様に、現在提供されているデバイスに関係している能力追跡ツールである典型的な保守データ解析ツールのようなデータ解析ツールから情報を受け取る(そして、実際に実行する)。データ解析ツールは、また、例えば、特定のタイプの問題の根本原因を検出する根本原因診断アプリケーション、米国特許第6,017,143号に記載されているようなイベント検出、参照によってここに明確に取り入れられる(1999年5月3日に出願された)米国特許出願番号09/303869号に記載されているような調整ループ診断、参照によってここに明確に取り入れられる(1999年2月25日に出願された)米国特許出願番号09/257896に記載された衝撃ラインプラッギング検出、その他のプラッギングライン検出アプリケーション、デバイス状態アプリケーション、デバイス構成アプリケーション、保守アプリケーション、デバイス格納、ヒストリアン、及びAMS、エクスプローラアプリケーション及び追跡監査アプリケーション等の情報表示ツールを含み得る。また更に、エキスパート50は、改良された制御エキスパート52のようなプロセス制御データ解析ツール、参照によってここに明確に取り入れられる米国特許出願番号09/593327号(2000年6月14日に出願)及び09/412078(1999年10月4日に出願)に記載されているようなモデル予言制御プロセスルーチン、チューニングルーチン、ファジー論理制御ルーチン、及びニューラルネットワーク制御ルーチンからのいかなるデータ及びいかなる情報も、プロセス制御システム10内に提供され得る米国特許第5,680,409号に記載されているよう仮想センサーからと同様に、受け取ることができる。また更に、資産活用エキスパート50は、オンライン振動のような回転装置、RF無線センサー及びハンドヘルドデータ収集ユニット、回転装置に関連するオイル分析、サーモグラフィ、超音波システム並びにレーザーアラインメント及びバランスシステムに関連するデータ解析ツールからの情報を受領し得、これらの全ては、プロセス制御システム10内の回転装置の問題又は状態を検出することに関連している。これらのツールは、現在ではこの分野で公知であり、本願明細書において更には述べない。また更に、資産活用エキスパート50は、例えば図1のアプリケーション23及び27のような電力管理並びに電源装置及び供給に関連したデータを受信でき、それはいかなる所望の電力管理及び電源装置モニタリング及び解析ツールを含み得る。
【0032】
一実施態様においては、資産活用エキスパート50は、例えば、プラント10のコンピュータ30又は他の所望のコンピュータによって実行されるデバイスモデル、ループモデル、ユニットモデル、領域モデル等のような、プラント10内の装置のいくつか又は全ての数学的ソフトウェアモデル56を実行し又は監視する。資産活用エキスパート50は、多くの理由により、これらのモデルにより生成され又は関連するデータを使用し得る。このデータ(又はモデルそれ自身)のいくつかは、プラント10内の仮想センサーに提供するために用いられ得る。このデータ又はモデルそれ自身のいくつかは、プラント10内で予測制御又はリアルタイム最適制御を実行するために用いられ得る。モデル56により生成されるデータのいくつかは、例えばビジネス及びプロセス制御アプリケーションのような他のアプリケーションにおいて使用されるインデックスを生成するために、インデックス生成ルーチン51によって使用され得る。これら及び他の目的へのモデル56の使用は、以下に更に詳細に述べられる。
【0033】
資産活用エキスパート50は、それが生成されるにつれて又は特定の定期的な時間ごとに、バス32又はプラント10内の他のどのような通信ネットワーク上のデータをも受領する。その後、周期的に又は必要に応じて、資産活用エキスパート50は、他のアプリケーションにるデータを再配布するか、又はプラント10内の他の機能システムにプラント10の制御又は動作の異なる態様に有用な他の情報を生成し又は提供するためにそのデータを用いる。特に、資産活用エキスパート50は、プロセスプラント10内で、インデックス生成ルーチン51に、能力インデックス、利用性インデックス、健全性インデックス及びデバイス、ユニット、ループ、領域若しくは他のエンティティの一つ以上と関連する変動性インデックスのような一連の合成インデックスを生成させるようにデータを供給し得る。これらのインデックスの生成及び活用も、本願明細書において更に詳細に議論される。
【0034】
また、資産活用エキスパート50は、これらのコントローラ、最適化プログラム55、ビジネスアプリケーション63、保守アプリケーション66等と関連するプロセスコントローラ又はインターフェイス内に位置する制御ルーチン62にデータを提供し又は受領する。
【0035】
さらに、制御エキスパート65(それは、予測プロセスコントローラを含み得る)は、過去に於いてはそれがデバイスを適切に機能させ又は全く機能させないように制御すると考えられていたが、制御されているデバイスの例えば、プロセスを制御しようと試みるときに考慮される、利用性、変動性、健全性又は前述の能力インデックス又はデバイス、ループなどの状態又は健全性に関連する他の情報 資産活用エキスパート50から情報を受け取ることができる。最適化プログラム55と同様に、予測コントローラ65は、ユーザインタフェースルーチン58に付加的な情報及びデータを提供し得る。予測コントローラ65又は最適化プログラム55は、制御システム内で予測に基づいて制御を最適化するために、例えば、ビジネス・アプリケーション63によって規定されるような資産活用エキスパート50から提供されるビジネスソリューションソフトウェアにより識別される目標及び将来のニーズと同様に、ネットワーク内のデバイスの実際の現状に関連するような状態情報を使用し得る。
【0036】
また更に、資産活用エキスパート50は、ビジネスソリューション又はビジネスコンピュータ35及び36で使用されているような統合業務ツールにデータを提供し及びこれからデータを受領し得る。これらのアプリケーションは、生産計画、原料計画、ビジネスアプリケーション等で使用するための自動的に部品発注、仕事の指示又は補給発注を生成する作業命令生成ツール54等を制御する生産計画ツールを含み得る。もちろん、部品発注、仕事の指示及び補給発注生成は、資産活用エキスパート50からの情報に基づいて自動的に完了され得、これにより、保守問題に関して修正動作を提供するのに必要な部品を受領する時間と同様に、資産が固定されるのに必要であると認識されるのに必要な時間を減少させる。
【0037】
資産活用エキスパート50はまた、保守システムアプリケーション66に情報を提供し得、それは直ちに保守要員に対し問題について警告をするだけでなくて、問題を修正するために必要な発注部品のような是正措置を採る。なお更に、新規なモデル68は、資産活用エキスパート50が利用できるが、いかなる単一システムにも以前は利用できなかった情報のタイプを使用して生成され得る。もちろん、資産活用エキスパート50がデータモデル及び解析ツールからの情報又はデータを受領するのみならず、統合業務ツール、保守ツール及びプロセス制御ツールからの情報を受け取ることも、図2から理解されるであろう。
【0038】
さらに、一つ以上の調整されたユーザインタフェースルーチン58は、オペレータ、保守要員、ビジネスマン等にヘルプ及び視覚化を提供するために、プラント10内の他のアプリケーションと同様に、資産活用エキスパート50と通信し得る。オペレータ及び他のユーザーは、予測制御を実行するか又は実装するため、プラント10の設定を変えるため、プラント10内のヘルプを見るか、又は資産活用エキスパート50により提供される情報に関連した他のいかなるアクティビティをも実行するために、調整されたユーザインタフェースルーチン58を使用し得る。上記のように、ユーザインタフェースルーチン58は、オペレーターガイダンスツールを含み得、これは、予測された又は最適化された制御を実行するために、プロセス内のプロセス又はデバイスの状態を見ることのような多くの機能を実行するのを助けるようにオペレータ又は他のユーザーによって使用され得るインデックスに関する情報と同様に、予測コントローラ65からの情報を受け取る。また更に、ユーザインタフェースルーチン58は、例えば資産活用エキスパート50を介するプロセスプラント10の他の部分に於けるツールの何れかからのデータを見るため又は得るために使用され得る。例えば、マネージャは何がそのプロセスで起こっているか又は戦略的プラントを作るために、何がプロセスプラント10に関連した高水準の情報を必要としているかについて知りたがることができる。
【0039】
従って、理解されるであろうように、一旦データが中心データベースで受け取られて、例えば、一般のフォーマットに変換されると、データは幾つかのアクセス可能な方法でデータベースに格納されて、資産管理ソフト50内で、アプリケーション又はユーザーが利用できるようにされる。例えば、プロセス制御、アラーミング、デバイス保守、故障診断、予測保守、財務計画、最適化等に関したアプリケーションは、これらのアプリケーションが非常に異なるか以前にはアクセス不可能であったデータソースからのデータなしには従来動作することが可能であったより良好に動作するように、異なるデータソースの一つ以上からデータを使用し結合し及び統合し得る。資産管理ソフト50の部分として図2に例示されているアプリケーションは、図1に記載されているアプリケーションのいずれかであってもよいか又は所望なら他のタイプのアプリケーションでもあり得る。もちろん、図2において例示される収集したデータを使用するデータソース及びアプリケーションの両方は、事実上例示的であり、より大きい、より小さい又は異なるデータソース及びアプリケーションも使用することができる。同様に、データソースそれ自身は、データ収集及び配布システム又はデータベースによって集められた受領データに構成され得る。このように、独自のアプリケーションを有する異なる製造業者又はサービスプロバイダは、これらのサービスプロバイダにより提供されている製品又はサービスを高めるプロセスプラントから以前に得られることができなかった特定のデータを集め得る。
【0040】
一実施態様においては、過去においてプロセス制御ネットワークから離れて独自のアプリケーションを使用してデータを収集し及び生成する従来のプロセス制御サービスプロバイダは、その収集し及び生成したデータをシステム50に提供し、次に、それは他のアプリケーションに利用できるようにされるであろう。これらのほかのアプリケーションは、ホストデバイス内のアプリケーション、ユーザインタフェース、コントローラ等のようなプロセス制御環境に、通信可能に接続されているコンピュータ内で実行されるアプリケーションであり得る。加えて、これらの他のアプリケーションは、従来のサービス機関によって提供され又は使用されるアプリケーションであってもよい。このように、プロセスシステムのオーナーによって所有されているアプリケーションも、サービスプロバイダによって所有され運用されているアプリケーションも、どのような方法でプロセスプラント内で生成されたどのようなデータも、使用するように設計され得る。その結果、アプリケーションによって以前に利用されなかったデータをそのアプリケーションが使用できるので、アプリケーションが強化され得る多くのインスタンスが存在する。例えば、腐食分析サービスプロバイダは、腐食分析の信頼性又は予測性を強化するために、独自のプロセス制御システム又は独自の装置監視アプリケーションによって集められたデータを使用することが可能である。非常に異なるタイプのサービスプロバイダ及びアプリケーションからのデータのこのようなクロスポリネーション(cross pollenation)は、以前では利用できなかった。
【0041】
上記したように、資産活用エキスパート50は、特定のプラントの動作又は、デバイス、ユニット、ループ、領域等のプラント内のエンティティをモデリングする一つ以上の数学的又はソフトウェアモデル56の実行を遂行し又は監視することができる。これらのモデルは、ハードウェアモデルであってもよく、又は、それらはプロセス制御モデルであってもよい。一実施態様においては、これらのモデルを生成するために、モデリングエキスパートはプラントを構成要素ハードウェア及び/又はプロセス制御部分に分割し、抽象概念のいかなる所望のレベルでも、異なる構成部分に対するモデルを提供する。例えば、プラントのモデルは、ソフトウェアで実装され、及びプラントの異なる領域に対する階層的に関連した相互接続されたモデルの一組を作り上げ又は含み得る。同様に、いずれのプラント領域のモデルも、これらのユニット内の入力及び出力間の相互接続を有するプラント内で、これらのユニットに対する個々のモデルを作り上げることができる。同様に、ユニットは、相互接続されたデバイスモデルその他を作り上げることができる。もちろん、領域モデルは、ユニットモデル、ループモデル等と相互接続されたデバイスモデルを有し得る。この例では、モデル階層、デバイスのようなより低いレベルのエンティティに対するモデルの入力及び出力は、ユニットのようなその入力及び出力が領域モデル等の更に高いレベルのモデルを生成するように相互接続されているより高水準のモデルを生成するために相互接続され得る。異なるモデルが結合され又は相互接続される方法は、もちろんモデリングされているプラントに依存する。プラント全体のための単一で完全な数学的モデルが使用され得る一方、領域、ユニット、ループ、デバイス等のようなプラントの異なる部分又はプラント内のエンティティに対する異なる独立の構成モデルを提供すること、及びこれらの異なるモデルを相互接続してより大きいモデルを形成することは、多くの理由により有用である。さらに、より大きいモデルの一部としての他の構成モデルと同様に、相互に独立に実行され得る構成要素モデルを使用することは望ましい。
【0042】
高度に数学的に正確又は理論的なモデル(例えば3次又は4次のモデル)がプラント全体について又は構成要素モデルの何れか又は全てについて使用することができる一方、個々のモデルが数学的にあるできる限り正確である必要はなく、例えば、1次若しくは2次又は他のタイプのモデルでもよい。これらのより単純なモデルは、一般にソフトウェアでより早く実行されることができ、そして、モデルの入力及び出力をここで記載した方法でプラント内で行われた入力及び出力の実際の測定値に一致させることにより、より正確にすることができる。換言すれば、個々のモデルは、プラント又はプラント内のエンティティを、プラントからの実際のフィードバックに基づいて、より正確なモデルに調整又は微調整され得る。
【0043】
階層的なソフトウェアモデルの使用は、ここで図3及び図4に関連して記載される。図3は、洗練されたプラント内の複合的な領域80、81及び82のモデルを例示する。図3に図示したように、領域モデル82は、プレプロセッサモデル88に原油のような原料を供給する原料ソース84の構成モデルを含んでいる。プレプロセッサ88は、原料に対して幾分かの精製を提供して出力に供給し、典型的に原油を更なる精製のための蒸留プロセス90に送る。蒸留プロセス90は、通常では望ましい製品であるC2H4と、及び、一般的に言って廃棄物であるC2H6とを出力する。C2H6は、更なる処理のためにプレプロセッサ88へのその出力を提供するC2クラッカ92にフィードバックされる。C2クラッカ92による蒸留プロセス90からのフィードバックは、リサイクルプロセスである。このように、領域82のモデルは、図3に示したように相互に接続された入力及び出力を有する、原料ソース84、プレプロセッサ88、蒸留プロセス90、及びC2クラッカ92に対する別々のモデルを含むことができる。すなわち、各々の構成モデルは、領域82のモデルを形成するために図3において例示された方法で、他の構成モデルの入力及び出力に結ばれ得る。もちろん、他の領域80及び81のモデルも、相互接続された入力及び出力を有する他の構成モデルを備え得る。
【0044】
ここで図4を参照すると、蒸留プロセス90の構成モデルが更に詳細に例示されており、上部部分100T及び底部部分100Bを有する蒸留塔100を含んでいる。蒸留塔100への入力103は、図3に示されているプレプロセッサ88に対するモデルの出力に結ばれ得る圧力及び温度の指示である。しかし、この入力は、オペレータによって、セットされ得るか又はプラント10内の実際の測定された入力又は変数に基づいて設定され得。一般的に言って、蒸留塔100は、その中に配置された多くのプレートを有し、流体は蒸留プロセスの間プレートの間を移動する。C2H4はカラム100の上部100Tから取り出され、還流ドラム102はカラム100の上部100Tにこの材料をフィードバックする。C2H6は、一般にカラム100の底部から出てくる。そして、リボイラ104は蒸留プロセスを補助するためにポリプロピレンをカラム100の底部100Bにポンプで送りこむ。もちろん、必要に応じて、蒸留プロセス90のモデルは、蒸留塔100に対する構成要素モデルから成り立ち得、還流ドラム102及びリボイラ104等は蒸留プロセス90の構成モデルを形成するために、図4に図示したように接続されるこれらのモデルの入力及び出力を有している。
【0045】
上記したように、蒸留プロセス90に対する構成モデルは、領域82のモデルの一部として実行され得、又は他のモデルとは別に個別に実行され得る。特に、蒸留塔100への入力103及び/又はC2H4及びC2H6の出力は実際に測定されることができ、これらの測定値が下記のように多くの方法で蒸留プロセス90のモデル内で使用され得る。一実施態様においては、蒸留プロセス90のモデルの入力及び出力は測定され、蒸留プロセス90のモデルと関連する他の要因又はパラメータ(例えば蒸留塔効率等)を決定するのに使用されて、蒸留プロセス90のモデルがプラント10内の実際の蒸留塔の操作により正確にマッチするように強いる。次に、例えば領域又はプラントモデルのようなより大きいモデルの一部として、蒸留プロセス90のモデルが算出されたパラメータとともに使用され得る。その代わりに又はそれに加えて、算出されたパラメータを有する蒸留プロセス90のモデルは、仮想センサーの測定値を決定し又はプラント10内の実際のセンサーの測定値がエラーかどうかを決定するために用いることができる。決定されたパラメータを有する蒸留プロセス90のモデルは、また、制御又は資産活用最適の学習等を行なうために用いることができる。なお更に、構成モデルは、プラント10の問題を生じることを検出し若しくは分離し、又はプラント10に対する変化がどのようにプラント10の最適化パラメータの選択に影響を及ぼすかを見るために用いることができる。
【0046】
所望ならば、いかなる特定のモデル又は構成要素モデルも、そのモデルと関連するパラメータの値を決定するために実行され得る。いくつか又は全ての効率パラメータのようなこれらのパラメータは、モデルのコンテキスト内のエンジニアにとって何かを意味し得るが、プラント10内で一般に測定不能である。より詳しくは、構成モデルは、式Y=F(X,P)によって、一般に数学的に記載されていることができ、ここで、モデルの出力Yが、入力X及び一組のモデルパラメータPの関数である。図4の蒸留プロセス90の蒸留塔モデルの実施態様においては、エキスパートシステムは、モデルが関係するエンティティへの実際の入力X及びそれからの出力Yを表す実際のプラントからのデータを、周期的にデータを集める(即ち、1時間ごと、10分ごと、1分ごと等)。次に、時々、例えば最大尤推定法、最小二乗法等の回帰分析又は他のいかなる回帰分析も、測定されたデータの複数のセットに基づいて未知のパラメータPの最も良い適合を決定するために、モデル並びに測定された入力及び出力の複数のセットを使用して実行され得る。このように、いかなる特定のモデルに対するモデルパラメータPも、モデルなっているエンティティにそのモデルを調和させるために、実際の又は測定された入力及び出力を使用して決定され得る。もちろん、このプロセスは、プラント10内で使用される何れか及び全ての構成モデルについて実行され得て、適当な数の測定された入力及び出力を使用して実行されることができる。好ましくは、資産活用エキスパート50は、プロセス制御ネットワークからの時間の期間に亘ってモデルに対する適当な入力及び出力に関連するデータを集め、このデータをモデル56によって使用するために格納する。次に、例えば1分、1時間、1日ごと等の所望の時間に、資産活用エキスパート50は、収集したデータを使用してモデルパラメータに対する最良の適合を決定するために、最も最近収集したデータの集合を用いて回帰分析を実行し得る。回帰分析で使用される測定された入力及び出力のセットは、そのモデルに対して前の回帰分析において使用されたデータのセットから独立し又は重複し得る。このように、例えば、特定のモデルのための回帰分析は、毎時間実行され得るが、最近の2時間に対する毎分集められた入力及び出力データを使用し得る。その結果、特定の回帰分析がデータにおいて使用されるデータの半分は、そのデータと重複し、すなわち、前の回帰分析において使用されたデータと同様である。回帰分析におけるデータのこの重複は、モデルパラメータの算出における多くの連続性又は整合性を提供する。
【0047】
同様に、回帰分析は、プロセス10内で測定を行っているセンサーがドリフトしているかどうか又はそれとともに関連する他の幾分かのエラーを有しているかを決定するために実行され得る。ここで、モデルとされているエンティティの測定された入力及び出力に関係している同じデータ又は潜在的に異なるデータは、集められて、例えば、資産活用エキスパート50により格納される。この場合、モデルはY+dY=F(X+dX,P)として一般的に数学的に表され、ここで、dYは出力Yの測定値に関係するエラーであり、dXは入力Xの測定値に関係するエラーである。もちろん、これらのエラーは、バイアス、ドリフト、非線形エラー等のいかなるタイプのエラーであってもよく、モデルは、入力X及び出力Yが、異なる種類の実際の測定値との異なる数学的関係を有する可能なエラーとともに、これに関連する異なる種類のエラーを有し得ると認識され得る。いずれにしても、回帰分析、例えば最大尤推定法、最小二乗法又は他のいかなる回帰分析も、未知のセンサーエラーdY及びdXに対する最良の適合を決定するために、測定された入力及び出力を有するモデルを使用して実行され得る。ここで、モデルパラメータPは、そのモデルに対する前の回帰分析を使用して算出されるパラメータPに基づいて、又は更なる未知数として扱われ得て、この回帰分析と結合して決定され得る。もちろん、回帰分析内で使用される未知数の数が増加するにつれて、必要なデータ量が増加して、そして、回帰分析を行うためにより長時間を要する。さらに、必要に応じて、モデルパラメータを決定するための回帰分析及びセンサーエラーを決定するための回帰分析は、必要に応じて異なる定期的な速度で、それぞれ独立に実行され得る。この異なる周期性は、例えば、測定可能なセンサーエラーが起こりそうである時間フレームが非常に異なる場合に、モデルパラメータの変化が起こりそうである時間フレームより大きいか小さい場合の何れでも、有益である。
【0048】
いずれにせよ、これらの構成モデルを使用して、資産活用エキスパート50は、時間対決定されたモデルパラメータの値(及び/又は、モデル入力及び出力)をプロットすることによって、資産能力監視を実行することができる。また更に、資産活用エキスパート50は、決定されたセンサーエラーdY及びdXを閾値と比較することによって、潜在的に不良のセンサーを検出することができる。一つ以上のセンサーがそれに関してより高いか又は特に容認できないエラーを有するように見える場合、資産活用エキスパート50は、保守要員及び/又はプロセス制御オペレータに不良のセンサーを知らせ得る。
【0049】
上記した能力監視活動を実行するために、構成モデルが異なる時間に異なる目的で実行され得て、多くの場合、周期的に実行され得ることが、この議論から理解されるであろう。もちろん、資産活用エキスパート50は、適当な目的のための適当なモデルの遂行を制御することができ、資産能力監視及び最適化のためのこれらのモデルの結果を使用し得る。同じモデルが、異なる目的、及びそのモデルと関連する異なるパラメータ又は変数を算出するために、資産活用エキスパート50によって実行され得ることが理解されるであろう。
【0050】
上記したように、パラメータ、入力、出力又はいかなる特定のモデルと関連する他の変数は、デバイス、ユニット、ループ、領域又はプロセス又はプラントの他のエンティティに対して、能力監視を提供するために格納され得る。所望ならば、これらの変数のうちの2つ以上は、多次元プロットを提供し又はエンティティの能力の測定を提供するために追跡又は監視される。この能力モデリングの一部として、パラメータの位置又はこの多次元プロット内の他の変数が、モニタされている調整されたパラメータによって定義されるように、エンティティが所望の又は受け入れられる領域の中にある又はその代わりにその領域の外にあるかどうか確認するために、閾値と比較され得る。このように、エンティティの能力は、そのエンティティと関連する一つ以上のパラメータ又は他の変数に基づき得る。図5は、このエンティティに対するパラメータP1及びP2の値によって定義される、図4の蒸留塔のような、エンティティの操作領域の二次元のプロットを例示している。ここで、パラメータP1及びP2(上記したモデル回帰分析を使用して又は他のいかなる所望の方法によっても決定され得る)は、二次元の方法でプロットされ、プロット上の点(それぞれP1の値及びP2の値により定義されている)は、T1−T10として例示される異なる時間に対して決定される。このように、位置XT1は、時間T1でのパラメータP1及びP2に対する値により定義される点をを表している。図5のプロット上のXT10に対する位置XT1は、エンティティが時間T1及びT6間の好ましい領域(領域1)内で動作し、時間T7であまり望ましくないが許容し得る領域(領域2)に入り、時間T10で許容できないか又は失敗している領域(領域3)に入っていることを示している。もちろん、これらの異なる領域の境界は、例えば、前もって専門家によって測定され、いかなる所望の時間においても、資産活用エキスパート50によるアクセスのためにコンピュータ30に格納される。図5は二次元のパラメータ能力モニタリング技術を例示している一方、この同じ技術は、能力監視を遂行するために、一次元、又は3以上の次元に適用され得る。更に、能力インデックスを生成するために、例えば、n次元のプロットのエンティティの位置に関する領域又は他の情報が、インデックス生成ルーチン51によって使用され得る。
【0051】
資産活用エキスパート50は、モデルパラメータ又は他のモデル変数又は他のモデル変数に基づいて上記のモニタリング技術を使用して、一つ以上のエンティティをモニタすることができ、これらのエンティティの動作状態又は能力測定値を、プロセス制御エキスパートシステム、保守要員、ビジネスアプリケーション、ユーザインタフェースルーチン58等のプロセスプラント10内の希望する人、機能又はアプリケーションに報告することが理解されるであろう。もちろん、各エンティティに対する、1、2、3又は所望の数のパラメータ又は変数に基づいて、エンティティ上の能力又は状態の監視を実行できることも理解されるであろう。この能力監視において使用される変数又はパラメータの同一性及び数は、一般にプロセスに精通している専門家によって測定され、及びモニタされているエンティティのタイプに基づくであろう。
【0052】
所望ならば、資産活用エキスパート50は、また、上記のようにモデルによって決定されるパラメータの一以上が、モデリングされているエンティティの設計パラメータに従って実行されるモデルによって決定される同じパラメータと比較することによって、能力インデックス又はプロットを規定し得る。特に、資産活用エキスパート50は、プロセスの現在の状態に従ってそれが動作し及びプラント10内で測定されたエンティティへの実際の入力を使用しているなら、エンティティの設計能力が何であるかを決定するためにモデルが関連しているプラント10内のエンティティの設計パラメータを使用してモデルを実行し得る。この設計能力は、そのエンティティに対する構成モデルによって決定されるような、又はエンティティの能力の測定値を生成するエンティティの測定された入力及び出力によって決定されるようなエンティティの実際の能力と比較され得る。
【0053】
このように、例えば、エンティティの能力は、上記した回帰分析に基づくエンティティ(その一つは、効率であってもよい)のパラメータを推定する構成モデルを使用して決定され得る。同時に、エンティティのモデルは、エンティティの設計基準に従って結果として生じ、しかしエンティティへの入力及びそれへの出力に基づいているパラメータを使用して実行される。従って、例えば、異なる原料がエンティティに入力されている場合、設計モデルは原料の変化から生じる効率を使用して実行されるであろう。いずれの場合においてもエンティティの能力は、実際のエンティティが動作している可能な又は設計された動作からどれくらい離れているかを示す能力インデックスを決定するために比較され得る。この能力インデックスは、次に、プロセス制御、保守若しくはビジネスマン等のアプリケーション若しくはシステムのユーザ又はアプリケーションに報告され及び使用され得る。
【0054】
構成モデル56は、また、プロセス最適化を実行するために用いることができる。特に、資産活用エキスパート50は、例えば、ビジネスアプリケーションを介してプロセス制御オペレータ又はビジネスマンにより提供される幾つかの最適化基準に関して、プラントの動作を最適化するために、個々の構成要素モデルを実行する最適化ルーチン55の一つ以上を使用し得る。最適化プログラム55は、その時プラント10の現状に基づいて、プラント10を最適化するためにリアルタイムで動作するリアルタイム最適化プログラムであり得る。これに代えて又はこれに加えて、最適化プログラム55は、ラント10の最も大きな最適化を提供するであろう特定のデバイス又はユニットをライン上に戻すような、プラント10になされるべき変化を決定できる。もちろん、他のタイプの最適化ルーチン55は、ここで言及されるそれらの代わりに又はそれらに加えて実行され得る。
【0055】
一実施態様において、MDC社により提供されるRTO+リアルタイム最適化ルーチンは、リアルタイム最適化プログラムとして使用することができ、プラント10の動作の間に、例えば、3〜5数分ごと、10〜15分ごと、1時間ごと等、様々な周期的な時間で実行され得る。もちろん、例えば3若しくは4時間ごと、又は3〜4日ごとのようにあまり頻繁ではない最適化を実行する他の周知若しくは後に開発された最適化プログラムルーチンをその代わりに使用することができる。
【0056】
RTO+最適化プログラムは、リアルタイム最適化を実行するためにそれが実行されるたびに、3つの一般のフェーズを実行する。RTO+最適化ルーチンは、様々なデバイス、ユニット等の目標値又は他の入力のような最適化を実行するために最適化プログラムによって操作され得る変数である最適化プログラムの設計の時点で先に示されている変数が、現時点で実際に操作され得るかどうかを決定するようにチェックしている間に、入力フェーズを最初に実行する。この情報は、プロセス制御システムからこの情報を得て何れかの所望のデータベース内にこの情報を格納する資産活用エキスパート50から、最適化プログラムが利用し得る。従って、入力フェーズの間、最適化プログラムは、資産活用エキスパート50からそれに提供されるデータに基づいて、可能な操作された入力のそれぞれがまだ利用可能に変更されているかどうかを実際に決定する。なぜなら、多くの例において、例えば、入力を提供するデバイスが動作していないか又はオフラインであるか又はデバイスがそのデバイスに対する入力を変更するのを妨げる設計モードで実行されているというような事実により、潜在的に操作された入力の一つ以上は、変更のために利用できないからである。
【0057】
入力フェーズの一部として、リアルタイム最適化プログラムは、また、最適化プログラムの最後の進行の間、変更するのを支持する変数が実際に変更されて、最適化プログラムの最後の実行から提示され又は計算された値、すなわちそれらが変更されるのを支持される値に実際に変更し又は近づけられる。いかなる理由であっても、特定の値に変化することを支持される変数がその値に近づかない場合、最適化プログラムは、変化が起こるのを防げ、そして、事実上、最適化プログラムの次の実行の間にこの変数をその値に変更する選択を取り除いてしまうという問題があるものと認識する。変数が理論的に有しなければならない値に達するのに失敗したことの検出は、また、最適化プログラムに、対処すべきシステム内の問題があることをオペレータに通知させるようにし得る。
【0058】
次に、入力フェーズの間、最適化プログラムは、例えば、プラント10から測定した実際の入力及び出力を使用して全体のモデルを作り上げる各々の個々のコンポーネントモデルの速い実行を行なう。各々の構成モデルの算出された出力は、次に、全てのモデルが正確に動作するのを妨げる特定の構成要素モデルに関する問題があるかどうか確認するために見直される。ここで、最適化プログラムは、モデルの個々の構成部品が現実的な出力を生成するのにこれらの実際の入力都合がよいかどうか確認するために、すでに格納された各々のエンティティに対して実際の測定された入力を使用し得る。
【0059】
各々の構成モデルが実行され得ると仮定するならば、最適化プログラムは、最適化プログラムの最適化する能力に影響を与え得るモデルにおける矛盾を探すことができる。例えば、最適化プログラムは、真のデバイスによって行われている測定が、デバイスに実際の入力を使用している構成モデルにより予測されるのと同様あるかどうか決定し得る。モデル(最も最近に算出されたモデルパラメータを使用して)は、そのモデルが18の流速を示し、そして流量メーターの流量が20であり、次に、最適化プログラムが先に定義済み制約より2だけ低い流量に関する制約をリセットする場合のように、出力の実際の測定から外れる出力を予測する。このように、その流量に関する制約が最初に25にセットされる場合、最適化プログラムはそのモデルにこの変数に関して2の誤差があると認識するので、最適化プログラムは23の制約を使用することができる。もちろん、最適化プログラムは、最適化ルーチン内の制約又は他の変数をリセットし、更新し又は調整するために、モデルとプラントの実際の測定値との間の他の不一致又は逸脱を見つけ出すことができる。
【0060】
一般に最適化フェーズとして知られている次のフェーズにおいては、全体のモデルを形成している他の構成要素モデルの一つ以上への入力として、1つの構成モデルからの出力を使用して、最適化プログラムは予め定められた順序で個々のモデルを実行する。モデル全体、ユーザによって提供された制約、及び最適化基準と同様に入力フェーズによって決定された新たな制約を用いて、最適化プログラムは、入力に対して為されるべき変更を決定し、又は現在最適化プログラムが動作している時間ウィンドウ上のプラントを最適化することが可能であるとして検出された変数を操作する。この時間ウィンドウは、3〜4分、3〜4時間等であり得、一般に最適化プログラムが動作する周期的な速度である。最適化ソフトウェアの使用は周知であり、何れかの所望の最適化ソフトウェアも、この目的のために使用され得る。従って、1つの実施態様では、精製プラントは、時価及びそれらの可能な出力と関連する多くの生産物によって決定されるC2クラッカによって生産され得る可能な出力製品に基づいて、できるだけ多くの利益を作り出すようにC2クラッカを作動させるように最適化され得る。しかし、制約は、たとえその製品の現在の価格が何に遭遇しようとも、満たされなければならないその製品の量を提供するビジネス契約が存在するので、C2クラッカがある程度の1つの製品を生産しなければならないということであってもよい。他の例では、最適化及び基準が1つの特定の原料の使用を最適化することであってもよい。なぜなら、そのプラントでその原料の過剰量を維持するためのコストは、最も高い時価を保持している製品のような他のコスト又は価格の懸念を暗くするからである。
【0061】
最終的に、ビジネスマン又はビジネスアプリケーションによって一般的に実行される最適化の基準の決定は、最適化プログラム、従って、究極的にプラント10の操作に、非常に重大な基準となるということが分かるであろう。その結果、資産活用エキスパート50は、ユーザインタフェースルーチン58を介してビジネスマンに、最適化基準が何れの特定の時間に於いて何であるかの選択の体系的なセットを提供し、及び最適化ルーチンにオペレータ又は他の何れかのユーザーによって為される選択を提供する。事実、選択され得る多くの最適化変数があり、これらの異なる基準の選択は、オペレータ又はビジネスマンがどのように方法によって何れかの所望のプロセスの異なる最適化基準を選ぶことを許容されるように、ユーザインタフェースを介してオペレータ又はビジネスマンに提供され得る。
【0062】
次に、最適化ルーチンは、最適化プログラムの結果の実現が達成され得る出力フェーズに入る。特に、操作された変数への提案された変更を計算した後、最適化プログラムは変更されるべき変数又は入力がまだ利用可能かを決定する。なぜなら、最適化プログラムが最適化フェーズ最適化を開始したときに利用可能であった1以上のデバイスが、オフラインとなっているか又はさもなければ利用できなくなっていることがあるからであり、このことは、入力変数の提案された変更が実装されるのを妨げるであろう。しかし、もし、変更されるべき全ての操作された変数がまだ変更され得るなら、提案された変更は、例えばユーザインタフェース(例えばグラフィカルユーザインタフェース)を介してオペレータに提供され得る。オペレータは、単にボタンを押すことができ、そして、最適化プログラムによって予め決められた方法で、設定点の変更等の、開始される又は自動的にプロセス制御ルーチンにダウンロードされる操作された変数に、変更を加えることができる。他の実施態様において、又は、動作後の段階において、例えば、プロセスが適切に動作しているときに、特定の時間ウィンドウ内でのこれらの変化の実装をオペレータが妨げなければ、最適化プログラムが自動的に提案された変更を実行し得る。このように、最適化プログラムの出力は、オペレータが、最適化プログラムからの変化が使用されることを妨げるように介入しない限り、最適化プログラムが実行されるあらゆる時間において使用され得る。この操作の一部として、ユーザインタフェースルーチン58の一つ以上は、行われるべき提案された変更をオペレータに示すスクリーン、及びユーザが変更を実装し又は変更が実装されるのを妨げるのに使用するボタン又はバーを提供できる。一実施態様において、もし、ユーザーが変更を実装するためにボタンを押すと、変化の全ては適当なコントローラに送られ、そこでそれらは制限が点検され、それから実行される。
【0063】
上記のようなリアルタイム最適化プログラムは、多くの理由により、大部分の最適化プログラムと比較的しばしば比較されて実行され得る。第1に、リアルタイム最適化プログラムは、典型的にプラントを設計するために用いられる高度に理論的なモデルより非常に速く典型的に実行される目的の構成要素モデルに対する適合性を使用する。しかし、モデルの一つ以上のパラメータがプラント10の実際の入力及び出力に基づいて調整され又は変更される(上記した回帰分析を使用して)ので、これらの構成モデルは正確である。すなわち、このリアルタイム最適化プログラムは、モデルをプラント10の実際の動作と一致させるためにモデル上の回帰分析の最後の実行によって提供されるモデルパラメータを使用する。また更に、上記した最適化プログラムは、それが制限された最適化ステップを使用するので、従来の最適化プログラムより高速である。すなわち、最適化プログラムは、最適化プログラムの個々の実行の間の時間期間上で最適化することを試みるだけであり、それは最適化ルーチンにより実行される処理の量を減少させる。また更に、リアルタイム最適化プログラムは、一つ以上の重要なイベントの出現を認識するように構成され得、これは、これらのイベントが前の推奨を実行不可能であるか望ましくなようにするときに、リスタートするために実時間最適化プログラムをトリガする。
【0064】
閉ループを使用している間、リアルタイム最適化プログラムが上記で議論されたが、同じ又は異なる構成要素を使用する他のタイプの最適化プログラム55も、リアルタイム最適化プログラムと共に又はこれとは別に、資産活用エキスパート50によって実行され得る。これらの他の最適化プログラムは、他の理由のため、しばしば実行されることができなかった。例えば、広帯域最適化プログラムは、たとえ、リアルタイム最適化プログラムがプラント10をそのポイントに、しばらくの間駆りたてることが可能ではない場合であっても、プロセスの最終の最適な動作ポイントが最終的にそうなるところを見つけ出し又は決定するように使用される。この広帯域最適化プログラムは、ビジネスマンがプラント10について長期予測をすることを可能にし、又はオペレータがプラント10の操作が望ましい領域に向かって進むかどうか決定することを可能にする。もし、広帯域最適化プログラムが最終的に達成可能な最適化位置がまだ許容できないと決定したなら、オペレータはプラント10の構成又は他の動作パラメータを変えることを決定することができる。
【0065】
選択最適化プログラムのような他の最適化プログラムは、オペレータ又は保守要員により実行されることを必要としているプロセス構成に於ける変化がよりよくプロセスを最適化することができたかどうか決定し得る。例えば、幾つかのケースでは、選択最適化プログラムはリアルタイム最適化プログラムが利用できると思われている特定のユニット又は他の操作された入力が、何かの理由で、例えばこれらの入力と関連するデバイスがダウンしているか又はオフラインである等の理由で、もはや利用できないと認識し得る。選択最適化プログラムは、これらのデバイス、ユニット等の一つ以上が利用できると仮定して、一つ以上の最適化試験を実行して、もし、これらのエンティティが操作に戻されるなら、どれだけよりよくプラント10が動作するか(すなわち、幾つかの最適化基準に関してどれだけ多くのプラント10が最適であるか)を決定する。この最適化プログラムは、例えば、プラント10がユニット又はデバイスをオンラインにすることによって、どれくらいのより多くの金を作ることができるかについて、オペレータ又はビジネスマンに伝えることができ、又はどのデバイス又はユニットが最初に動作させるかについて、オペレータ又はビジネスマンに伝えることができる。このような最適化プログラムは、また、プロセス又はその資産に対するどの基準の変更がそのプロセスを有益にし又は最適にするかを決定するために、特定のポンプ又はバルブをオン若しくはオフにすること、最適状態にはないモード等で実行されている他のデバイスを交換すること等により、最適化しようとすることができる。選択最適化プログラムは、オペレータ又はビジネスマンからの入力を使用するかもしれず及び/又は最適化変数を調整する方法を選択するためにデータ処理又はデータマイニングルーチンにおいて一般的である他の分岐及び境界技術を使用するかもしれない。また、プロセスをどのように変更するかを決定し又はもし実装されたらプロセスに対するどの変更がプラント10への改良又は最良の改良を提供するかを決定する特別の順序で適用する一連の規則を備えた選択最適化プログラムのような他の選択技術が使用され得る。
【0066】
上記の議論の結果として、モデルの使用がビジネスアプリケーション、プロセス制御アプリケーション及び資産保守及び監視アプリケーションについての新しいタイプのデータ又は情報を提供することが分かる。特に、能力監視を実行するために、そしてプラント内のデバイス、ユニット、領域等の相対的な能力を示す能力インデックスを生成するために、モデルが使用され得る。この能力インデックスは、エンティティの起こりうる能力に関するエンティティの能力の測定値であり得る。さらに、デバイス及びユニットモデルが上記で議論される一方、同様にこれらのタイプのエンティティに対する能力測定値及び最適化基準を提供するために、ループ、ユニット等のプロセス制御エンティティに対して、類似したモデルが作られ及び実行され得る。また、上記のように、モデルは、場合によっては、特定のデバイス又は他のエンティティの健全性を測定し若しくは示すため、又はこれらのエンティティを表す健全性インデックスを提供するために使用され得る。例えば、特定のモデルに使用される回帰分析によって決定されるような特定の入力及び出力センサーのエラー測定は、それらのデバイスの健全性の指示として使用し又はそれに変換することができる。また、プロセスコントローラにとって利用できない他の情報、例えばモデルパラメータ及びそのモデルに基づく仮想センサー測定値は、プロセスコントローラに又は多数の方法で使用されるビジネスマンに提供され得る。
【0067】
能力及び健全性インデックスの他に、資産活用エキスパート50は、インデックス生成ルーチン51が利用性インデックス及び変動性インデックスのような他の種類のインデックスを作成することを援助し得る。変動性インデックスは、どの程度信号を受け取り又は送出するかについて示し、又は、デバイス、ループ、ユニット等と関連する他の若干のパラメータは、この信号又はパラメータがどの程度変化すると期待されるかということに対して比較されるに伴って変化する。この変動性インデックスを作成するために必要なデータは、資産活用エキスパート50によって集められることができ、何れかの所望の又は都合の良い時間に、インデックス生成ルーチン51に提供される。もちろん、信号又はパラメータの変化の通常の量は、製造業者、エンジニア、オペレータ又はエンティティに精通している保守要員によって、又はそれ若しくはプラント内の他の同様のエンティティに関連する統計処置(例えば平均、標準偏差、その他)に基づいてセットされ得、そしてこの通常の又は予想される変化は、インデックス生成ルーチン51によって格納され若しくはその中でアップデートされる。
【0068】
利用性インデックスは、どのような形にせよ、個々のデバイス、ユニット、ループ又は他のエンティティの利用を追跡し又は反映し、そして、先に決定されたベンチマーク又は動作の目標に基づいて、これらのエンティティが使用され過ぎているかあまり使用されていないかに関するいくらかの指標を提供する。利用性インデックスは、実際のデバイスの測定された使用に基づいて生成され得る。例えば、デバイスは、しばしばプロセス内で使用されているか又はアイドル状態であるか、そして、このインデックスが、そのエンティティに対して使用され過ぎているかあまり使用されていないかを決定する所望の利用性と比較され得る。利用性インデックスは、デバイス、ユニット、ループ等が、そうあることができるか又はそうであるべきであるほどしばしば利用されていないか、他方、あまりに多く利用されていて、そして、使用され過ぎているかについて識別を行う。
【0069】
幾つかの事例では、利用性インデックスは、特定のデバイスの適切又は所望の使用に関して行われたビジネス決定に基づいて決定されるかもしれない。例えば、多くの処理又は精練プラントは、コークス化の問題に専念し、その結果、周期的に掃除されなければならない炉を使用する。一般的に言って、コークス化は、短時間に石油ベースの流体を加熱することが望ましい石油産業において使用される炉で起こる。このような炉は、チューブ内を進行している流体が急速に例えば1400゜Fのような高温まで加熱されるように、炉の内部を通過する入力チューブを有するかもしれない。幾つかの例では、チューブの中心をこのような高温にするためには、約1700゜Fまでチューブの外側を加熱する必要がある。しかし、チューブを介する流体の通過が石油をベースとしているので、いくつかの材料は、チューブの内面に付着するカーボン又は粘性若しくは粒子状の材料の他の種類を形成し、次に、時間とともに炉の熱転送効率を減少させる。この材料の堆積物は、一般的にコークス化と呼ばれる。チューブを通過する流体が多くなるほど、コークス化は多く現れ、そして、炉の効率はより低下する。幾つかの点で、炉の効率は、炉をオフラインにして洗浄が必要なので、低くなる。このクリーニング過程は時間を要し、多くの人的資源及び水蒸気クリーニング装置を含めて資源を必要とする。その結果、これらの炉のクリーニングは前もって人的資源及び必要な装置が利用できるよう確保して予定しておかなければならない。
【0070】
プラント10内の特定の炉にコークス化が生じているという事実を知っているビジネスマン又はプロセス制御オペレータは、コークス化が時間とともに各々の炉内でどのように起こるかについて特定することによって、それらの炉の最も効率的な利用を得ることを試み得る。従って、例えば、ビジネスマンは15日の期間の間の特定の炉を作動することに決め、15日の期間の終わりに炉をその最大のコークス化のレベルまで稼働させることによって、その時間期間にその炉から最大の使用を得ることを望む。その最大のコークス化のレベルがすぐに近づいてきたら、すなわち、炉が15日の期間の終わりの前に近づいてきたら、炉はオフラインにする必要があるが15日の期間の終わりまでまだ洗浄されることができない。なぜなら、それが洗浄の人的資源及び機械の洗浄に利用することができる(すなわち、予定されている)時だからである。炉のこの早めの除去は、プロセス操作に悪影響を与える。しかしながら、炉が15日の期間末までにその最大許容コークス化のレベルになっていない場合でも、炉をオフラインにして洗浄する必要がある。なぜなら、それが再び人的資源及び機械を利用できる唯一の時であるからである。しかし、炉は利用不足であると、それは機会を損失したことを意味する。なぜなら、十分に活用されていない炉と、効果的に完全に利用された炉とを掃除するのに要するコストは同じだからである。おそらく、過剰使用されている別の炉は、この炉の不十分な使用に基づいて必要とされるより、より多くのコークス化を受ける。
【0071】
上で議論される15日の期間のような、与えられた時間に亘って炉の最高の利用を計画するために、オペレータ又はビジネスマンは、時間とともに炉に対するコークス化の所望の量を定める基準線を描くかもしれない。時間対炉のコークス化のプロットの例示的な基準線200が、図6において例示されている。基準線200は、15日(この時以降炉が洗浄される)の期間にわたるコークス化に関して、ビジネスマン又はオペレータがどのようにして炉を使用することを望むかについて特定している。炉のコークス化は、直接炉の伝熱効率に関係する。図6から分かるように、15日の期間の終わりに、炉の使用が基準線200に従うなら、炉はその最大コークス化レベル(それは、炉の最小許容伝熱効率に相当する)に達する。もちろん、図6の基準線200は、多くの可能な基準線のうちの選択されたたったの1本であると理解されるであろう。
【0072】
残念なことに、特定の時間のいつでも炉のコークス化を測定することは、炉内の高温により不可能である。しかし、その代わりに、炉内のコークス化の計測は、上記で議論された原理に従って構築された炉に対する一つ以上のモデルを用いて為され得る。ここで、コークス化は、モデル内で他の変数、モデルへの入力及びモデルからの出力から、又は上記のような回帰分析を使用することにより決定されるモデルのパラメータであり得る。次に、資産活用エキスパート50は、仮想センサ測定値として又はモデルパラメータとして、炉におけるコークス化の量を周期的に得るために、このモデルを実行し得る。この決定のための方程式は、この技術分野では公知であり、ここでは議論されない。さらに、必要に応じて、最適化プログラムは、最適化として、図6の基準線200により定義されるコークス化の値(又はこの線の何れかの点に於ける傾きにより定義されるコークス化率)を使用し得、そして、この炉のモデルで測定されるにつれて、炉内でのコークス化が図6の基準線200をたどるように炉を稼働しようとして、プラントの操作された変数のセットが設定される。
【0073】
図6の実施態様に於いて、炉に対するモデルを実行して、資産活用エキスパート50が6日目で、炉のコークス化は実質的に6日目での基準線200によって定義される所望のコークス化量以下の点202にあることを決定すると仮定される。6日目での炉に対するコークス化の推定値が基準線200により定義されるそれの下にあるという事実は、炉が基準線200に従う不十分な利用以下であることを意味している。その結果、資産活用エキスパート50は、例えば幾つかの所望若しくは便利な方法で、炉が予め定義された利用性の基準に従って不十分な利用性にあることを識別する利用性インデックスを提供するなどにより、この事実を例えばオペレータ又はビジネスマンに知らせ得る。
【0074】
この利用性インデックスに基づいて、ビジネスマン又はオペレータは、15日の期間の後、コークス化の最大量が炉内で起こったかどうかのいずれにせよ炉は運転が停止されるので、炉を使用する機会を逃すことがあると認識できる。例えば7日目(それは、図6の点204としてマークされる)までに、特定の期間以内の基準線200に、コークス化パラメータを得るために、そして、炉からの最高の利用性を得るために、オペレータ又は資産活用エキスパート50は、点202及び204間の線を定義する。この傾きは、6日目及び6日目の基準線200により許容されるコークス化の速度を決定する。オペレータ又は最適化ルーチンは、次に、点202及び204間の線の傾きによって定義されるコークス化の速度を得るために、炉を実行し得る。プラント10の又は炉の操作を制御する最適化ルーチン内で、コークス化のより速い速度が、例えば、制約として又は最適化パラメータとしてさえ使用され得る。例えば、周知のように、コークス化の量又は率は、例えば材料が炉を介して供給される速度(速度がより高速であるほど、コークス化が少ない)、炉からの材料の出口温度(出口温度が高いほど、コークス化はより多く生ずる)及び炉を介して送られる流体に注入される水蒸気の量(典型的には、蒸気の量が多いほど、コークス化が少ない)等、炉と関連する多くのパラメータのいずれかを調整することにより調整され得る。最適化プログラムは、これらのパラメータの一つ以上を調整するように使用して、新たなコークス化の速度を得る。いずれにしても、炉の実際のコークス化に基づく炉の利用性の測定は、この例では、炉が十分に利用されておらず及び炉がより使用されるならプラント10のより大きな最適化が起こりえる炉のインデックスの所望のコークス化と比較される。
【0075】
図7を参照すれば、他方、6日目での炉のコークス化が測定され又は基準線200より上の例えば点206で炉のモデルによって決定され、次に、炉が過剰に使用され及び炉の使用率が、最近15日炉を有効にすることができるように減少させるべきである。この場合、オンラインにし、又はすでに炉の使用の減少を補償するために使用され得るオンラインにし得る他の炉があってもよい。図6の実施態様と同様に、オペレータ又はビジネスマンは、例えば、実際のコークス化と所望のコークス化との差のいくつかの指標を反映した利用性インデックスを使用して、炉の過剰使用の情報を知らされ得る。その後、オペレータ又はビジネスマンは、炉のコークス化の値がすでに7日目又は8日目に許容される値より既に大きいので、10日目の基準線に戻って炉のコークス化パラメータを得ることが好ましいことを決定する。点206と基準線上の10日目の点である点208との間に引かれた線と、この新しく描画された線の傾斜は、7日目及び10日目の間の使用が許容されるか又は所望されるコークス化の速度を定義している。もちろん、オペレータ、最適化プログラム又はその他制御ルーチンは、炉のコークス化の速度を、点206及び208の間の線の傾きによって定義される速度に強制するように制御戦略を実行し得る。
【0076】
他のビジネス決定は、炉の利用性インデックスを変更するという観点から、効果を示し始める得る。例えば、6日目に、たとえ炉がコークス化パラメータの観点から基準線の周りを通っている場合であっても、ビジネスマンは、炉の使用が更に5日必要であると決定し得、それによって炉の寿命が洗浄前20日に増加する。このことは、とにかく20日までクリーニング装置が利用できないので、これは行われ得る。この場合、6日目及び20日目の間の基準線は書き直されることができ、制御ルーチン又は最適化プログラムは、次に、新たな基準線を追跡するように試みるこ。しかし、基準線の全体が書き直されると、先に100%として定義されていたものが、又は15日の基準線に対する6日目での正確な利用性が、20日の基準線に対する過剰の利用性となり得る。この場合、資産活用エキスパート50は、利用性インデックスを100%に戻すことを試みるために、最適化プログラムに又はプロセス制御ルーチンに、最適化又は制約としてコークス化の新しい速度を提供し得る。同様に、例えば炉が12日の終わりに早く運転を停止されるべきである場合、炉は、12日の基準線に基づいてこの時点で不十分な利用となり得、そして、最適化プログラム又はプロセス制御ルーチンは、利用性インデックスを100%に戻すように試みて、新たなコークス化の速度を使用し得る。
【0077】
以下に記載するように、特定の時間に於いて炉のコークス化の量を計量又は推定する炉のモデルの使用と関連して特定の基準線上の炉を動かすというビジネス決定は、炉のような特定のエンティティ実際のプロセス実行の間に過剰に使用されているかあまり使用されていないかを指し示すために用いることができる。さらに、プロセスの制御に対する変更は、利用性インデックスに基づいて、その炉をより多く又はより少なく使用するようにすることができる。
【0078】
上記で与えられる炉の実施態様に対する利用性インデックスは、実際のコークス化の値と所望のコークス化の値との間の差、新しい許容コークス化速度、基準線と新しい許容されるコークス化の速度との差、又は他のいかなる利用性等の一つに基づいて、所望の方法で計算され又は表されることができる。もちろん、炉に対する利用性インデックスを決定する1つのプロセスがここに記載されているが、炉に対する利用性インデックスを決定し又は定める多くの他の方法が、プラント内の他のデバイス、ユニット、ループ等についてと同様に存在する。特に、異なるエンティティに対する利用性インデックスは、所望の方法及び異なるタイプのエンティティに対して異なる方法で測定され得る。一つの実施態様においては、利用性インデックスは、パーセントとして表されることができ、100%はエンティティが適正で望ましい量で使用されていることを表し、100%を超える数値は、エンティティが過剰に使用されていることを表し、及び100%より低い数値は、不十分に利用されてることを表している。もちろん、利用性を測定し及び表す他の方法もまた、異なるタイプのデバイスの状況の範囲内で使用され得る。
【0079】
図1のシステムの1つの重要な態様は、資産活用エキスパート50により提供される様々な資産活用能力とのユーザーの相互作用を容易にするために、ここに記載されている資産活用エキスパート50に統合されるグラフィカルユーザインタフェース(GUI)を提供するユーザインタフェースルーチン58である。しかし、更に詳細にGUIを議論する前に、GUIがいかなる適切なプログラミング言語及び技術をも使用して実行される一つ以上のソフトウェアルーチンを含み得ることを認識すべきである。更に、GUIを作り上げているソフトウェアルーチンは、例えば、プラント10内のワークステーション、コントローラ等の単一の処理ステーション又はユニット内に格納及び処理され、あるいは、GUIのソフトウェアルーチンは、資産活用システム内で互いに通信可能に結合された複数の処理ユニットを使用して分散の方法で格納され及び実行され得る。
【0080】
好ましくは、しかし必ずではなく、GUIは、よく知られているグラフィックウィンドウベースの構造及び外観を使用して実行され得、そこにおいては、複数の相互結合されたグラフィカル画面又はページは、特定のタイプの情報を見て及び/又は読み出すための所望の方法で、ユーザーがページの操作をすることを可能にする一つ以上のプルダウンメニューを含んでいる。上記した資産活用エキスパート50の特徴及び/又は能力は、一つ以上の対応するページ、画面又はGUIのディスプレイを介して表示され、アクセスされ、呼び出され得る。さらに、GUIを作り上げている様々なディスプレイは、情報の特定のタイプを読み出しすために、又は資産活用エキスパート50の特定の能力にアクセスし及び/又は呼び出すために、ディスプレイにユーザーの速くて直観的なナビゲーションを容易にする論理的な方法で相互連結され得る。
【0081】
一般的に言って、ここに記載されているGUIは、プロセス制御領域、ユニット、ループ、デバイス等の直観的なグラフィック描写又は表示を提供する。これらのグラフィカルディスプレイのそれぞれは、GUIにより表示されている特定の画面に関連する能力インデックス(そのいくつか又は全ては、上記したインデックス生成ルーチン51により生成され得る)を含み得る。例えば、プロセス制御領域を表している表示は、その領域の状況及び能力を反映している一組のインデックス(すなわち、装置階層の特定のレベルでのプロセス制御システムの特定の部分)を提供し得る。他方、ループを表している表示は、その特定のループに関連する一組の状況及び能力インデックスを提供し得る。いずれにしても、ユーザーは、そのディスプレイ内で示されるデバイス、ループ等の何れか内に問題が存在するかどうかに速やかにアクセスするために、いずれの画面、ページ又は表示内で示されるインデックスをも使用することができる。
【0082】
加えて、ここに記載されているGUIは、自動的に又はユーザーによる要求に応答して、そのユーザーに対する保守情報を提供する。その保守情報は、資産活用エキスパート50のいずれの部分にもよって提供され得る。同様に、GUIは、アラーム情報、プロセス制御情報等を表示でき、それはまた、資産活用エキスパート50により提供され得る。また更に、GUIは、生じた又はプラント10内で生じようとしている問題に関連して、ユーザーにメッセージを提供し得る。これらのメッセージは、問題を記述するグラフィカル及び/又はテキストの情報を含み得、現在の問題を軽減するために実行され得るような又は潜在的な問題を避けるために実行され得るような可能なシステムの変更を提案し、問題を避け若しくは修正するために実行すべき行動方針を記載する、等を行い得る。
【0083】
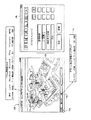
図8は、GUIにより表示され得るプロセス制御システム内のユニット500を表す画面の例示的な描写である。図8に図示したように、ユニット500は、例えばバルブ、ポンプ、温度トランスミッタなどのような複数の装置を含み、これらの全ては、視覚的に示されている。加えて、その表示は、ライン矢印と様々なデバイス間の論理的及び物理的な相互接続を表すための他の印とを含み得る。もちろん、プロセス制御システム(又はプロセス制御システムの一部)のこのようなグラフィカル表示は、この技術分野で公知であり、従って、これらのグラフィカル表示又はディスプレイは、ここでは更に詳細には記載しない。
【0084】
重要なことに、図8に示されているGUIディスプレイは、また、複数のインデックス名及び値550を含んでいる。特に、インデックス名及び値550は、能力インデックス、健全性インデックス、変動性インデックス及び利用性インデックスを含み、これらの全ては、資産活用エキスパート50及びインデックス生成ルーチン51に関連して、上記で手短に議論された。インデックス名及び値550は、示されているように又は他の所望の形式で、表の形式で表示され得る。インデックス名及び値550は、ユニット500の能力及び状態を表し、従って、示されているインデックスは適切であり、しかし、ユニット500を構成する各サブユニット及び/又はデバイスに関連するインデックス値からなる必要はない。
【0085】
資産情報、プロセス制御情報、保守情報、診断情報又は他タイプの情報がユーザーに表示されるGUI及びプロセスを議論する前に、能力及び状況インデックスが生成される方法の短い議論が以下で提供される。また、能力インデックス、健全性インデックス、変動性インデックス及び利用性インデックスがGUIの様々な表示と関連してここで詳述されるが、本発明の範囲を逸脱することなく、付加的及び/又は異なるインデックスが資産活用エキスパート50により生成され、GUIを介して表示され得ることが認識されなければならない。
【0086】
一般に、インデックス生成ルーチン51によって生成され及びGUIによって表示されるインデックスのそれぞれは、個々のデバイスに対して、論理的及び/又は物理的なグループに対して、論理的プロセス(例えば制御ループ)に対して、ユニット及び領域等のデバイスの論理的グループに対して、計算され得る。換言すれば、インデックスは、原理的には、装置及びプロセス制御システムの論理的階層での各々のレベル、又は、より一般的にいえば、一つ以上のプロセス制御システムを含む資産活用システムで計算されることができる。しかし、特定のインデックスの意味は、インデックスが生成され表示され及びそれが表示されている階層のレベルに依存する状況(すなわちそのインデックスが、デバイス及び/又はパラメータの論理的ばグループか物理的なグループの何れに相当するか)に依存する。例えば、装置の階層の最も低いレベルでは、インデックスは、バルブ、温度センサ、アクチュエータ等のような物理的なデバイスに対応する。このように、各々のデバイスは、デバイス内で又はその時にデバイス内に格納された情報に基づいてデバイスについて生成されるインデックスの唯一の組を有することができる。したがって、各々のデバイスは、必要に応じて階層のより高いレベルに、及び資産活用エキスパート50にそのインデックスを生成し提供し得る。
【0087】
同様に、いずれも1以上のデバイス又は機能ブロックを有するユニット又はループは、それぞれインデックスの唯一の組を有している。しかし、各々のユニット又はループに対するインデックス値は、そのユニット又はループ内で個々のデバイス又は機能ブロックに対するインデックス値を数学的に結合することにより生成され得る。従って、もし、ユニット又はループが圧力トランスミッタ、バルブ及びポンプ(又はこれらのデバイスの操作に関連する機能ブロック)から成るとすると、ユニット又はループに対するインデックス値は、ユニット又はループを構成しているこれらのデバイス又は機能ブロックに対して又はそのそれぞれに対して生成されるインデックス値の様々な数学的組合せに基づいている。同様に、階層のサブユニット及びユニットレベルは一つ以上のループから成り、同様にデバイスから成るので、各々のサブユニット及びユニットに対するインデックス値は、ループ又はデバイスのインデックス値の数学的に組み合わせにより生成され得る。また更に、領域インデックスは、領域内のユニット、ループ、デバイス、その他の結合として決定され得ることができる。
【0088】
以下に詳述するように、ループ、サブユニット、ユニット及び階層の領域レベルに対するインデックス値を形成するためのデバイスインデックス値の数学的結合は、加重合計若しくは平均、又は、他のいかなる適切な数学的結合も、使用することができる。もちろん、能力、健全性、変動性及び利用性インデックスの一つ以上の算出は、論理的及び装置階層のすべてのレベルについて、適当でないか、必要でないか又は役には立たないかもしれない。図9は、能力インデックス(PI)、健全性インデックス(HI)、変動性インデックス(VI)及び利用性インデックス(UI)が、デバイス、ループ、サブユニット及びシステム階層のユニットレベルに対して生成され又は生成されない1つの方法を示す例示的なテーブルである。図9に示すように、PIはユニット及びサブユニットのレベルに対して生成され得る。ユニット及びサブユニットレベルでは、PIは、ユニット又はサブユニットのモデル(例えばモデル56の一つ)を、ユニット又はサブユニットの実際の能力に対して、いずれかの所望の方法によって比較することにより、計算され得る。特にこの状況(すなわち、階層のユニット及びサブユニットレベル)でのPIは、例えば、理論上の最大に関する、又は実際のシステム能力に基づく経験的に由来する最大効率に関する効率であってもよい。また、図9に示されているテーブルは、PIが個々のデバイス又はループについて計算される必要がないことを示している。しかし、幾つかのアプリケーションに於いては、ループ及びデバイスに対するPIを計算することは好ましい。例えば、デバイスに対するPIの計算の場合、デバイスメーカーは、理論的な最大デバイス効率を含む能力情報を格納するために、操作の間、デバイスがPIを実際の能力(例えば、オペレータ効率など)との比較に基づいて算出できるように、デバイス内の能力情報を格納する。もちろん、インデックス生成ルーチン51もまた、この機能を実行できる。ループに対するPIの算出の場合、システムは、例えば、最大又は平均ループエラー(すなわち定常状態エラー信号)を、理想的にはゼロである予め定められた幾つかの最小のエラー値と比較できる。このように、小さいループエラーは、良好な能力を表すPI値に相当している。
【0089】
図9はまた、VIが階層のループ及びデバイスのレベルで算出され得ることを示している。デバイスレベルでは、デバイスの変化又は逸脱を、変化又は変動の予期される若しくは所望の量と比較することにより、VIが算出され得る。極端に高い又は極端に低VI値は、デバイスの故障又は機能不全を示し、又はおそらく切迫した失敗又は機能不全であり得る。同様に、ループレベルでは、ループの出力に於ける極端に頻繁な又は大きい規模の変化は、問題を表している。いずれにせよ、ループ及びデバイスに対するVIは、予想されるパラメータの変動性に対する実際のパラメータの変動性との比較に基づいており、それは理論的に又は経験的に決定される得る。図9はVIがユニット及びサブユニットレベルに対しては算出され得ないことを示しているが、幾つかのアプリケーションでは、それにもかかわらず、これらのレベルに対してVIを生成することが望ましい。
【0090】
更に、図9は、HIがデバイス、ループ、サブユニット及びユニットレベルに対して算出されることを示している。デバイスに対するHIは、デバイスの履歴的な使用に基づいている。特に、デバイスメーカーはデバイス内でデバイスのライフサイクルに関する情報を格納し得、そして、デバイスの使用とその操作(例えば、温度バリエーション、ショック、その等)の間にデバイスに与えられた環境の影響とに基づいて、デバイスはそのライフサイクルカーブ(すなわち、老年の)に沿って移動したかについて決定し得る。製造業者は、デバイスがデバイスのライフサイクルの現状を表すHI値を提供するようにプログラムすることができる。例えば、ストロークタイプバルブは、250,000回のフルストロークサイクルの予想される有用な動作ライフサイクルを有し、そして典型的にはコンピュータ化したフィールドデバイスであるストロークタイプバルブの製造業者は、バルブが有する現時点でのストローク数に沿った寿命動作ストロークの予期される数をそのメモリに格納する。このように、HI値が0及び10の間で(ここではゼロは不健全性及び10が完全な健全性を表す)変動し得る場合には、ストローク数がゼロから250,000まで上がるにつれて、バルブにより生成されるHI値はゼロから10まで変動し得る。もちろん、HI値及びライフサイクルの特性(例えばストローク)との正確な関係は、線形であるとは限らない。反対に、多くのライフサイクル特徴は、指数特性に従い、それによって時間が経つにつれて、ストロークが完了するにつれて等、デバイスの検出された現在の状態と、それがどのように良好に動作しているかとに基づいて、デバイスに対するHIを定義し及び計算する多くの方法が存在する。例えば、デバイスが2つの検出された重要でない問題を抱えている場合、そのHIは減少し得る。
【0091】
他方、ループに対するHIは、ループを作り上げる個々のデバイス又は機能ブロックに対するHI値の数学的組合せ(例えば、加重合計又は平均)であることが好ましく、しかし、必ずしもその必要はない。同様に、サブユニット及びユニットレベルに対するHI値は、また、ループ及びサブユニットに対するHI値の基礎となる数学的組合せであり得る。このように、最終的に、デバイスレベルより上のレベルに対するHI値の階層は、複合値を形成するデバイスに対する一つ以上のHI値に基づいている。
【0092】
また、図9に示されているように、UIは、ループ、サブユニット及びユニットレベルに対して算出され得るが、デバイスレベルに対して必ずしも算出される必要はない。一般的に言って、UIは、特定の資産(例えばループ、サブユニット又はユニット)がその能力又は所望の利用性と比較して活用されている程度を表している。例えば、UI値は、ユニット、サブユニット又はループが制御を実行し又は出力を生成するために用いられている時間の量に基づき得る。それに加えて又はその代わりに、UI値は、そのループ、サブユニット、ユニット等により処理され得る最大量と比較して、ループ、サブユニット及び/又はユニットにより処理されている材料の量に基づいてもよい。
【0093】
図10は、図8に示されているユニット500に対するPIが計算される1つの方法を示す例示的なチャートである。図10に示すように、ユニット500を構成する複数のループ575の各々は、ユーザーによって又はその特定のループのユニット500の全体の動作に対する相対的な重要性に基づいて選択され定められるそれ自身のPIと加重係数とを有している。ループ575に対するインデックス及び重量は、次に、加重平均を使用して数学的に結合されて、ユニット500に対するPI値83.2の値を得る。
【0094】
これと同様の方法で、ユニット500に対するHIは、ユニット500を構成するデバイス(及び/又はループ)の全てに対するHI値の加重平均として算出され得る。図11に示されるそのようなテーブルは、値が加重平均に含まれることを表すために使用され得る。また、図11に示されているように、状況の記述は特定のデバイス及びインデックス値に関連している。これらの状況の記述は、HI値及びそのHI値に関連する特定の装置に基づいて、診断情報、保守情報等を提供し得る。
【0095】
図12は、VIが図8に示されるユニット500のようなユニットに対して算出される1つの方法を示す例示的なテーブルである。HIの場合と同様に、図8のユニット500に対して算出されるVIは、ユニット500を構成する個々のデバイス、ループ及び/又はサブユニットに対するVI値の加重平均に基づいている。もちろん、GUIはユーザーに、図10−12において例示され、ユーザーが重量を変えることを可能にするように、加重平均データを見る能力を提供し得る。
【0096】
図13は、デバイス及び/又はループに関連する過剰なVI値に応答して、GUIにより提供され得る例示的な表示である。図13に示すように、表示は、特定のデバイスに関連する極端に高い又は極端に低VI値に対する一つ以上の可能な説明を提供し得る。特に、表示は、自動的に又はユーザーの依頼により、接続されるようになったデバイスに関連するインパルスライン、プロセスが変更されていること、キャビテーションが上流のポンプに存在すること等を示し得る。これらの状況を検出したデータ解析ツールに基づいて、この情報は、資産活用エキスパート50によって、GUIに利用し得るようにされる。同様に、図14に示すように、バルブに対するVIは、ユーザーが使用するデータのグラフ図の表示にそのバルブに対するVIは、ユーザがそのバルブに対するVIを生成することを要求することを可能にすることによって、GUIを介して更に探査され得る。加えて、GUIは、図14に示されるようなグラフィック表示内又はGUIの他の表示内の何れかに、一つ以上の極端に高い(又は、もしかすると極端に低い)VI値のあり得そうな原因を示す原文のメッセージを表示し得る。このような原因は、データソース及びデータ解析ツールの全てからそれを利用できるデータに基づいて、資産活用エキスパート50によって再び提供される。例えば、極端に高VI値を示しているバルブの場合、GUIは、そのバルブが焼き付いていること、バルブ内でキャビテーションを起こしていること等の原文のメッセージを介して示し得る。
【0097】
図15は、プラント10内のユニット、サブユニット、ループ、デバイス等の能力をモニタすることを可能にするためにGUIによりユーザに提供され得る表示の例示的なグラフィック描写図である。図15に示すように、様々なインデックスの値が時間の関数としてプロットされており、それによって、ユーザーが、問題を表す傾向又は他の時間に基づく変化もより直観的に分析することを可能にする。更に、このようなグラフィック描写図は、また、様々なインデックスの変化の間の重要な相関、又は関係を明らかにすることができる。例えば、ユーザーは減少又は低いHI値及び増加又は極端に高VI値との関係をより容易に識別することができる。
【0098】
また更に、GUIは、図15に示されているグラフィック表示内又は、又はユーザーに現在又は潜在的な問題を示す他のいくつかの表示若しくはページにおいて、原文のメッセージを提供し、それは、表示されたインデックスの値又はその変化に関連があり得る。これらの原文のメッセージは、識別された問題の可能な解決を識別できる。図15内で表されるグラフィック情報は、インデックスがパーセントとして表され、時間軸が月を単位にしてラベルをつけられるように目盛が付けられているけれど、これに代えて、他のいかなる単位及び表示解像度も使うことができる。例えば、インデックスが急に変化するか又は変化することができる場合には、GUIはユーザーに必要に応じて時間ごとの基準、分ごと、二、三秒ごとに又はそれ以上(すなわち、より高い時間解像度で)インデックス値を表示することを可能にし得る。
【0099】
図16は、プラント10内のプロセス領域の動作中の状況及び能力をユーザーが素早く解析することを可能にするためにGUIにより提供され得る例示的なグラフィック表示である。図16に示すように、GUIはプロセス領域600内の物理的な装置(及びその間の相互接続)を視覚的に表し得る。もちろん、プロセス領域が図16に示されるGUIディスプレイ内で表示されるが、プラント10の例えばユニット、サブユニット、ループ、デバイス等の他の部分が、その代わりに同じか同様の結果を成し遂げることを示すことができると認識されるべきである。いずれにしても、プロセス領域600は、一対のタンク、複数の温度トランスミッタ、圧力トランスミッタ、流れトランスミッタ等及びパイプを有することとして描かれ、その全てが図16に示すように相互接続され得る。更に、物理的デバイスのそれぞれは、プラント10内のそのデバイスを一意に識別する関連する英数字の識別子(例えばTT−394)とともに表示され、また、ユーザーが手早くそのデバイスに関連する検知パラメータの状況を決定することを可能にするグラフィックのメータ又はゲージ(すなわち部分的に陰影をつけられた半円形特徴)とともに表示されることができる。例えば、GUIは、温度トランスミッタに関連するグラフィックのメータ又はゲージを表示することができ、温度トランスミッタによって現在検出されている温度に基づいて、メーターのより多くの又はより少ない部分に陰影をつける。重要なことは、VI、HI、UI及びPIの一つ以上は、領域600内に示されるデバイスの一つ以上に対して表示され得る。ほんの一例として、領域600内のタンク610に接続されているデバイスのいくつかに対するHI値が表示される。しかし、所望ならより多い又はより少ないHI値が表示され得る。加えて、異なるインデックス値又はインデックス値のグループは、要求に応じて領域600内に現れるデバイスのいずれかに対して表示され得る。図16に示される表示から認められ得るように、ユーザーは領域が適切に実行しているか、及び適切に実行し続けるであろうかについて、手早く確認することができる。更に、ユーザーはまた、それらのデバイス、ユニット、サブユニット等を識別でき、それは注意を必要とし及び/又はどれが特定の問題が生じているかについて注意を必要とする。
【0100】
ユーザーがプラント内の連続してより低くより低くするエンティティを見ること、及びこれらの異なるエンティティ又は表示のそれぞれと関連するインデックスについての情報が提供されることが理解されるであろう。このように、例えば、ユーザーはプラントの表示に注目することができ、プラントに対するインデックスの特定の組を見得る。ユーザーは、次に、プラント表示内の領域のうちの1つの上でクリックする等によって、1つの領域に集中することができ、その領域と関連するインデックスを見る。同様に、表示されている領域の中でユニットをクリックすることによって、異なるユニットに対するインデックスを見ることが可能となる。同様に、ループ、サブユニット、デバイス等に対するインデックスは、これらのエンティティが位置するエンティティの表示と異なるこれらのエンティティ上で注目することによって、見ることが可能となる。このように、ユーザーは、ポイントの何れのポイント又はレベルに於いても、予期されるインデックスより低い(又は高い)原因を手早く発見できる。
【0101】
図17は、ユーザーが領域600内で使用される何れかのデバイスに関連して追跡監査情報を見ることを可能にするためにGUIにより提供され得る表示の例示的な描写図である。一例として、ユーザーは、与えられたデバイス又はその英数字の識別子のクリックするマウスを使用するか、又はキーボードを介して識別子を入力して、そのデバイスに対するポップアップ追跡監査ウィンドウ650を要請する。このように、不適当であるか容認できないインデックス値が適切に又はタイムリな方法でデバイスを調整することの不履行に関連があるかどうか、又は、デバイスが全部適切に又は全く構成されたかどうかを決定するために、ユーザーは追跡監査情報を使用し得る。
【0102】
図18は、ユーザーが、領域600内の特定のデバイスに対するインデックスの一つ以上を生成するのに使用することができるデータのより詳細な解析を実行すること、又は状況の監視を実行することを可能にするために、GUIにより提供され得る表示の例示的な描写図である。一例として、モーター675に対する振動解析は、ポップアップウインドウ680に表示され得る。ユーザーは、モーター675によって影響を受けているユニットに対する異常に高い又は異常に低いインデックス値に応答するこのようなポップアップウインドウを要請でき、及び/又はそのモーターに関連するインデックス値が可能な問題を表しているなら、そのウィンドウを要請できる。さらに、必要に応じて、GUIは、自動的にそれらのデバイス、ユニット等のための詳細なデータ分析を含んでいるこのようなポップアップウインドウにそれを自動的に提供できる。同様に、図19はユーザーが領域600内のデバイスの能力特性をグラフィカルに見又はモニタすることを可能にするために、GUIにより提供され得る表示の例示的な描写図である。一例として、モーター675の効率のグラフを含んでいるポップアップ・ウインドウ690は、ユーザー要求に応答して、又はそれに代えて資産活用エキスパート50による自動的な要求に応答して提供される。610により実行されているプロセスの部分に関連する一つ以上のインデックス値が異常な場合、このようなポップアップウインドウが要請され得るか又は必要であり得る。特に、この例では、ユーザーは、モーター675が少ないPI値及び/又はその領域600が有する少ないPI値を有していることを認識できる。その結果、ユーザーは、問題がモーター675に存在するかどうかを決定するためにポップアップ・ウインドウ690内に含まれるより多くの詳細情報を要請できる。また、この例では、時間に対するモーター675の効率のグラフを含み、そこでは、実際の効率データ700は、理論的又は経験的に導かれた最高の効率データ710に対してグラフで示される。上で議論したように、これらの2つの効率データの組は、また、例えば、実際の効率と理論上の最大効率との比を使用するにより、モーター675について時間に対するPI値を算出するために用いることができる。
【0103】
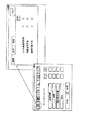
図20は、プラント10内のアラーム情報、状況等をユーザーが素早くを調査することを可能にするGUIにより提供され得る表示の更なる例示的な他の描写図である。プラント10の高水準グラフ図750は、一つ以上の未解決のアラームを有するアラームバナー760を含み得る。アラームバナー内の各々のアラームは、アラーム又はイベントを生成したデバイスに一意に関連する英数字インジケータを使用して表され得る。加えて、バナー760内の各々のアラームは、また、情報ボタン770を含み得、それは、その特定のアラームに関するより詳細な情報を含んでいるポップアップウインドウ775を生成するためにユーザーによって選択され得る。更に、ユーザーはまた、特定のアラームにそのアラームのあり得そうな理由を調査させるデバイスに対して英数字インジケータを選択し得る。英数字インジケータが選択されるときに、ポップアップウインドウ780はGUIにより提供され得る。ポップアップウインドウ780は、一つ以上の応答カテゴリ785を提供し、それは、特定のアラームがどのように対象にされ、そして、アラームがどんな時間枠内で対象にされなけれるべきかについてユーザーが理解するのを容易にし得る。一例として、ポップアップウインドウ780は、特定のデバイスがもはや通信していないこと、そのデバイスが不良となったこと、デバイスが直ちに保守を必要としていること、又はデバイスがすぐに保守又は他の注意を必要としていること、等を示すことができる。もちろん、より多くの若しくはより少ない及び/又は異なる応答カテゴリが、その代わりに使用され得る。GUIにより生成されるアラーム表示は、引用によりここに明確に取り入れられる米国特許出願番号09/707580(2000年11月7日に出願)において開示される統合表示であり得る。一般的には、このアラーム表示は、保守アラーム及び警報のような他のタイプのアラームと同様に、プロセスアラーム及び警報を示し得る。さらに、アラームバナーのフィールド775に提供される特定情報のようなアラームに関する情報は、GUIに又はアラームと共に資産活用エキスパート50に送られ得る。
【0104】
図21〜24は、アラーム、警報又は例えばデバイスに関連する他のイベントのユーザーによる更なる調査に応答して、GUIにより提供され得るディスプレイの例示的な描写図である。一般的に言って、ユーザーは、図20に示されるポップアップウインドウ780のようなポップアップウインドウから、デバイスの状態の情報を要求し得る。この詳細な状態情報は、アラーム状態の原因(すなわち故障した通信、欠陥のある装置、現在保守が必要、忠告等)となり得る問題の一つ以上の可能な診断を提供できる。さらに、図24に示すように、ユーザーは何れの状況ウィンドウからも詳細なヘルプを要求することができる。この詳細なヘルプは、段階的にシステムにより診断される問題を整理して、ユーザー又は他の人を導くようにステップ式の指示を提供し得る。この情報は、資産活用エキスパート50及び/又は、デバイス自身から、プロセス制御診断エキスパート65から、他の解析ツールから、GUIが利用できるようにされ得る。
【0105】
図25は、ユーザーがループ関連の問題を診断することを可能にするためにGUIにより提供され得る表示の例示的な描写図である。図25に示されるそれのような表示は、異常なインデックス値のユーザーの更なる調査に応答して、GUIにより提供され得る。例えば、特定のループに対するPI値が以上に低く、これに応答してポップアップウインドウ800を提供することをユーザーが認識し、及び/又はシステムが自動的に認識し得る。ユーザーは、次に、そのデバイスの一以上をクリック又は選択して、ウィンドウ800内に表示されるデバイスの診断の調査に集中し、それによって、より詳細な状態デバイス状況及び能力情報を提供するような付加的なポップアップウインドウを生成する。加えて、資産活用エキスパート50は、ウィンドウ800内のGUIによって、テキストとして表示される様々の可能な診断解答を提供し得る。また、資産活用エキスパート50は、潜在的問題又は現在の問題を避けるのに使用される表示800を介して、予言の診断情報を提供できる。
【0106】
図26は、ユーザが一つ以上のプロセス制御ループの能力及び/又は状況を解析するのを可能とするGUIにより提供され得る表示の例示的な更にもう一つの描写図である。一つ以上のループの様々なパラメータ及び特性が監視され得る。例えば、ループの動作モード、ループの制御が制限されるか否か、ループ入力がどの程度不確実か、ループの変化等が、同時に全て監視され得る。その上、能力指標及び利用性指標を提供する制御の概要は、同様に提供され得る。しかし、図26に示される表示に対し、性能指標及び利用性指標は、必ずしもではないが、監視されているループに対するPI及びUI値と同じであり得る。図26の表示は、先に記載した米国特許出願番号09/256585及び09/499445に開示されているような診断制御ルーチンによって生成され得る。
【0107】
図27は、作業命令生成ルーチン54によって自動的に生成された作業命令をユーザが遂行することを可能にするGUIによって提供され得る表示の例示的なさらなる別の描写図である。資産活用エキスパート50は、資産活用エキスパート50及び/又はその資産活用エキスパート50を使用して作業するユーザーによって発見され又は認識された問題又は潜在的な問題に応答して、そのルーチンに自動的に作業命令を生成させる作業命令生成ルーチン54に、データを提供する。例えば、資産活用エキスパート50は、診断情報、保守要求等を受領し、それに応答して、保守システムに保守要員がその診断情報に関連して一つ以上の問題に対応するように要求する作業命令を生成させ得る。もちろん、生成される作業命令の仕様は、検出される問題又は状況のタイプに依存し、部品、供給等のような問題を修正するために、標準のフォームが使用される。
【0108】
更に、作業命令生成ルーチン54は、検出された実際の又は予測されたプラント10の問題に基づいて、オペレータ又は保守要員の介入により又は介入なしに、部品、供給品等の供給者又は庶務と自動的に通信するビジネス間通信を含むことができる。より詳しくは、ルーチン54は、デバイスに関する現在の問題又は予測される将来の問題の通知、又は資産活用エキスパート50により提供され若しくは予測されるデータ又は回転装置解析ツールのようなデータ解析ツールの何れかに基づく他の資産を受け取ることができる。ルーチン54は、次に、例えばインターネット、電話又は他の通信接続を介して自動的に供給者にコンタクトし、デバイスが交換される必要がある前に、プラント10に分配されるべき部品、装置又は供給品を発注する。このように、作業命令生成ルーチン54は、故障時間を低減するか、又はそれが実際に生じたときに問題を調整するために、部品、装置又は供給品を待つのに要する故障時間をほとんど又は全く無くしてしまうことを確実にするのを補助する。この事実は、プラント10をより効率的にする。
【0109】
図28〜31を参照すれば、GUIは、現在又は予測された問題のような将来の問題をユーザーに示すために他のスクリーンを提供でき、それはプラント10内の資産活用エキスパート50又はデータ解析ツールのいずれかにより検出され得る。特に、図28−31は、図1の振動解析プログラム23により実行される回転装置内の軸のような要素の振動のスペクトルのプロットを示してい表示と、これらのプロットに基づいて解析ツールによって検出される条件又は問題とを例示している。例えば、図28は、検出されたアンバランス状態を例示し、図29は、検出された不整合状態を例示し、図30は、検出された緩み状態を例示し、及び図31は、検出されたベアリング摩耗状態を例示している。もちろん、データ解析ツールの結果に基づいて回転又は他のデバイスに対する他の状態も、表示され得る。また更に、これらのツールの結果は、作業命令生成ルーチン54に、自動的に交換部品を発注させるのに使用され得る。
【0110】
図32を参照すれば、モデル、最適化プログラム及び一つ以上のプロセスプラントのための能力監視ツールのような他のデータ解析ツールへのアクセスを遠隔で提供する方法が記載されているであろう。図32に示したように、一つ以上のプロセスプラント900、901、902及び903は、独立して動作する。各々のプラント900〜903は、周期的にそのプラントに関連するデータを集め、次に、データ処理設備又は遠隔モニタ設備910にそのデータを送る。この機能を達成するために、各々のプラント900〜903は、ユーザインタフェース又はサーバ900A〜903Aを有し、これらのサーバは遠隔モニタ設備910に、インターネット又はワールドワイドウェブ等の所望の通信ネットワークを介して接続されている。
【0111】
図33に図示したように、遠隔モニタ設備910は、プロセス900〜903が遠隔モニタ設備910と通信を行うウェブサーバ912を含んでいる。また、遠隔モニタ設備910は、多くのプロセス監視アプリケーション又はツールをを格納し及び実行する関連するデータベースを有する一つ以上のプロセッサ914を含んでいる。特に、各々のプロセッサ914は、ここに記載されている構成モデルのような、一つ以上のプラント900〜903又はこれらのプラント内のエンティティをモデルに生成されたモデル916にアクセスし実行し得る。モデル916は、各々の異なるプラント900〜903に対する異なる構成モデルを含み得、これらのモデル916は、プロット内の人間によって、例えばプラント900〜903内で変更を反映するために、設備910との通信を介して変化又は変更され得る。また、プロセッサ914は、プロセス900〜903からのデータを使用して、図1及び2に関してここで記載されているように実行され得る最適化プログラム918のリアルタイム最適化プログラム又は他のいかなる種類の最適化プログラム918も、格納し実行し得る。また更に、プロセッサ914は、例えばプロセス制御ツール、プロセス監視ツール、装置若しくはデバイス監視ツール、インデックス生成ツール、作業命令生成ツール、ここに記載されているビジネス若しくは他のツール若しくはアプリケーションのような図1のコンピュータシステム内のアプリケーション又はツールの何れかを含むツール920を監視している他のデータにアクセスし実行し得る。一つの実施態様において、米国特許出願09/256585号及び09/499445号に記載されているプロセス監視ツールは、プロセスパラメータを監視するために使用され得る。
【0112】
動作の間、プロセス900〜903のいずれかは、プロセスに関連する入力及び出力データを都合のいい時間に集め、このようなデータを、サーバ900A〜903Aのうちの1つ及びワールドワイド・ウェブ、インターネット又はサーバ912に接続している他の通信ネットワークを介して、遠隔モニタ設備910に提供する。プラントからのデータを受けると、その収集したデータに基づいてプラント内の状況、問題を検出し、そのプラントについての条件、プラント若しくはプロセス監視を提供し、又はそのプラントに対する最適化を実行するために、プロセッサ914の適当な一つは、そのデータにアクセスし、そのプラントに対して、適当なプロセス監視及び状態監視ツールを実行する。もちろん、プラントで集められて遠隔モニタ設備910に送られるデータは、所望のモデル916、最適化プログラム918又は他のデータ解析ツール920を実行するのに必要であるとしてすでに決定され、集められ、実行されているツール又はモデルに適切な周期的又は非周期的な速度で設備910に送られる。このように、最適化プログラムにとって、データは、モデルに対するもの、又は能力、プロセス若しくは資産モニタリングツールにたいするものとは異なる速度で集められ及び送られることを必要とする。もちろん、最適化又は性能、状況又はプロセス監視の課題の一部として、適当なモデル又は他のツールが実行され、これらのモデル又は他のツールの実行は、一般に、図1のプラント10のこれらの同じツールに関して上記で議論した原理に従う。
【0113】
いずれにしても、モデル、データ解析又は最適化ツールを実行した後、プロセッサ914はその結果をサーバ912に戻し、そこでは、これらの結果は所望の時間にプラント900〜903の適当な一つによって、採りあげられる。その代わりに又はそれに加えて、これらの結果は、サーバ912によって、直接プラント900〜903の適当な一つに送られることが可能である。解析から導かれるデータは、所望の能力モデリングデータ、プロット又はチャートであり得、例えば、ユーザインターフェイスルーチン又はGUIルーチン58に関連して記載したものを含み得る。その結果は、また、例えば、プラントに変化を与えるための最適化プログラム、プラントに対するインデックス又はツールのこれらのタイプにより提供され得る他の結果によって示唆されるものであってもよい。
【0114】
一実施態様において、上記のようなリアルタイム最適化プログラムは、この最適化プログラムの適切な実施を可能とするために、プラント900〜903が充分なデータをタイムリで周期的な方法で提供すると仮定すれば、真の時間を基準に実行され得る。所望ならば、サーバ900A〜903Aは、最適化プログラムの適当な動作を可能にするために、適当なデータを自動的に集めて送ることができる。一実施態様においては、プラントは、適当なデータがタイムリに又は定期的な方法で遠隔モニタ設備910に送られることを保証するのに使用するために、ここに記載した資産活用エキスパート50又は他のいかなるエキスパートのデータ収集ツールをも含み得る。
【0115】
このように、遠隔モニタ設備910は、異なるプラントに対する一つ以上の最適化プログラムを実行するのと同様に、資産、能力、状態及びプロセス監視のためのソフトウェアを実行することができる。言い換えると、これは、プラント900〜903がこれらの目的のための処理電源又はアプリケーションを含む必要はないことを意味し、それはプラントを高価なものとしない。もちろん、プラントは、使用基準、又は遠隔モニタ設備910の使用に対する予め決められた他の料金計画に基づいて支払われる。所望ならば、遠隔モニタ設備910は、設備910のツールの使用及びそれらのツールの結果の遂行に基づいて、一部の利益及び/又はプラントの損失を得ることを契約し得る。
【0116】
所望ならば、各々のプラント900〜903は、新規な又は更新されたモデルを、XML、HTMLのような所望の通信フォーマットを使用しているサーバ912に送信することによって、それらのプラントに適用できるように、遠隔モニタ設備910に格納されるモデル916を更新し得る。また更に、遠隔モニタ設備910は、異なるプロセスプラント、領域、ユニット、デバイス、ループ等のための、サーバ912を介してプラント900−903にダウンロードされ得る一般的なテンプレートを含むことができ、これらのテンプレートは、これらのプラントの実際の動作を反映するために、プラント900〜903に於いて変更され得る。更新されたモデルは、次に、資産、状態又はプロセス監視において又はプラントの最適化プログラムにおいて実装されるべきモデルとして、遠隔モニタ設備910に送り返され得る。このように、プラント900〜903に対する変化は、遠隔モニタ設備910内で適切に又は正確に反映され得る。
【0117】
資産活用エキスパート50及び他のプロセス要素は、好ましくはソフトウェアに実装されているとして記載されている一方、それらはハードウェア、ファームウェア等において実装され、及びプロセス制御システム10に関連する他のいかなるプロセッサによって実行され得る。このように、ここに記載されている要素は、標準の多目的CPUにおいて、又は特定用途向け集積回路(ASIC)又は所望の他の配線デバイスのような特に設計されたハードウェア若しくはファームウェア上に実装され得る。ソフトウェアで実装される場合、そのソフトウェアは、コンピュータ読みとり可能な磁気ディスク、レーザーディスク(R)又は他の格納媒体に、又はコンピュータ若しくはプロセッサのRAM又はROMに、又は、データベース等に格納され得る。同様に、このソフトウェアは、ユーザー又はプロセスプラントに、例えば、コンピュータ読み取り可能なディスク若しくは他の可搬のコンピュータ格納メカニズム上、又は電話回線、インターネット等のような通信チャンネル上を含む公知又は所望の配信方法を介して配信され得る(これらは、可搬の格納媒体を介してこのようなソフトウェア提供することと同じ又は置き換え可能であるとして見られている)。また、エキスパート50は、規則に基づくエキスパートであり得るとして記述される一方、他のタイプのエキスパートエンジンも同様に使用され得、他の公知のデータマイニング技術を使用するものも含まれる。
【0118】
このように、本発明は特定の実施形態を参照して記述されているが、これらは例示のみを意図し、本発明を限定するものではなく、変形、追加又は削除が本発明の精神及び範囲から逸脱することなく開示された実施態様になされることができることは、当業者に明らかであろう。
【図面の簡単な説明】
【0119】
【図1】図1は、プラント内の多くの機能領域の間のデータ転送を受信し及び調整するように構成された資産活用エキスパートを有するプロセスプラントのブロック図である。
【図2】図2は、図1のプラント内の資産活用エキスパートに関するデータ及び情報のダイヤグラムである。
【図3】図3は、プラント内である領域の動作をシミュレートするために用いられるモデルのブロック図である。
【図4】図4は、図3の領域モデル内のユニットの動作をシミュレートするのに使用されるモデルのブロック図である。
【図5】図5は、二次元の能力監視図である。
【図6】加熱炉に於いて使用するために選択した例示の標準的なラインと、この標準的なラインに基づくコークス比の速度とを示すグラフである。
【図7】図7は、図6の標準ラインに基づいた新たなコークス比の速度の発現を例示しているグラフである。
【図8】図8は、グラフィカルユーザインターフェイスによって表示されるプロセス制御システム内のユニットを表す表示の例示的な描写である。
【図9】図9は、インデックスがシステム階層の異なるレベルのために生成され得る1つの方法を例示する例示的な表である。
【図10】図10は、ユニットに対する能力インデックスが算出され得る1つの方法を表している例示的なチャートである。
【図11】図11は、インデックス値の加重平均としての新規なインデックス値を算出するために用いられ得る1つの方法を例示する例示的な表である。
【図12】図12は、変動性インデックスがユニットに対して算出される1つの方法を例示する例示的な表である。
【図13】図13は、異常な変動性インデックスに応答してグラフィカルユーザーインタフェースにより提供され得る例示的な表示である。
【図14】図14は、変動性インデックスを生成するために使用されるデータの例示的な表示である。
【図15】図15は、グラフィカルユーザーインタフェースにより提供され得るディスプレイの例示的な図示である。
【図16】図16は、グラフィックユーザインターフェイスにより提供され得る例示的な図示である。
【図17】図17は、ユーザが監査証跡情報を見ることができるようにグラフィカルユーザーインタフェースにより提供され得る表示の例示的な描写である。
【図18】図18は、ユーザが一つ以上のデバイスのためのインデックスを生成するために用いるデータのより詳細な解析を実行し得るようにグラフィカルユーザーインタフェースにより提供され得る表示の例示的な描写である。
【図19】図19は、ユーザが視覚的にデバイスの能力特性を見るか又は監視できるようにグラフィカルユーザインターフェイスにより提供され得る表示の例示的な描写である。
【図20】図20は、ユーザがプラント内で早急に情報を調査できるようにグラフィカルユーザーインタフェースにより提供され得る表示の例示的な更なる描写である。
【図21】図21−23は、デバイスステータス情報を提供するためにグラフィカルユーザーインタフェースにより表示され得る例示的なポップアップウィンドウである。
【図22】図21−23は、デバイスステータス情報を提供するためにグラフィカルユーザーインタフェースにより表示され得る例示的なポップアップウィンドウである。
【図23】図21−23は、デバイスステータス情報を提供するためにグラフィカルユーザーインタフェースにより表示され得る例示的なポップアップウィンドウである。
【図24】図24は、ユーザに詳細なヘルプ情報を与えるためにグラフィカルユーザーインタフェースにより提供され得る例示的な表示である。
【図25】図25は、ユーザがループ関連の問題を診断できるようにグラフィカルユーザーインタフェースにより提供され得る表示の例示的な描写である
【図26】図26は、ユーザが一つ以上のプロセス制御ループの能力及び/又はステータスを分析することを可能にするグラフィカルユーザーインタフェースによって提供され得るディスプレイの更なる例示的な他の描写である。
【図27】図27は、ユーザが作業命令を追跡又は生成し得るようにグラフィカルユーザーインタフェースにより提供され得る表示の例示的な更に別の描写である。
【図28】図28−31は、回転デバイス内で要素の振動のスペクトルプロットを例示する表示である。
【図29】図28−31は、回転デバイス内で要素の振動のスペクトルプロットを例示する表示である。
【図30】図28−31は、回転デバイス内で要素の振動のスペクトルプロットを例示する表示である。
【図31】図28−31は、回転デバイス内で要素の振動のスペクトルプロットを例示する表示である。
【図32】図32は、通信ネットワークを介する複数のプロセスプラントに接続している遠隔モニタ機能のブロック図である。そして、
【図33】図33は、図32の遠隔モニタ機能のより詳細なブロック図である。【Technical field】
[0001]
This application claims priority to US Provisional Application No. 60 / 273,164, filed March 1, 2001. This document is also a continuation-in-part of U.S. Patent Application Serial No. 09 / 953,811 filed September 17, 2001, entitled "Integrating Process Capability Monitoring with Process Equipment Monitoring and Control," which is expressly incorporated by reference. Is captured here.
[0002]
This disclosure relates generally to process control and maintenance systems in a process plant, and more particularly, to the use of a coordinated expert system to collect and redistribute data from multiple data sources within the process plant. .
[Background Art]
[0003]
Process control systems used in chemicals, petroleum or other processes include an analog, digital or combined analog / digital bus for at least one host or operator workstation and process control and measurement devices such as field devices. And typically includes one or more centralized or decentralized process controllers communicatively coupled via a. Field devices, such as valve positioners, switches, transmitters, and sensors (eg, temperature, pressure, and flow sensors) perform functions in the process, such as opening and closing valves, measuring process parameters, and the like. The process controller receives signals representing or related to process measurements or process variables created by or associated with the field device and / or information about the field device, uses this information to execute control routines, and then uses the information in the process routine. Generate control signals that are sent over one or more of the buses to the field device to control operation. Information from field devices and controllers is executed by an operator workstation to enable the operator to perform desired functions for the process, such as viewing the current status of the process and changing the operation of the process. Is typically made available to one or more applications.
[0004]
A typical process control system includes a number of process control and measurement devices connected to one or more process controllers, such as valves, transmitters, sensors, etc., that execute software that controls these devices during operation of the process. Although having, there are many other support devices that are necessary or relevant for the process operation. These additional devices include, for example, power supplies, generators and distributors, and rotating devices such as turbines, which are located at many locations in a typical plant. This additional device does not necessarily create or use process variables, and in many instances is not controlled or even connected to affect process operation, but nevertheless This equipment is important and also necessary for the proper operation of the process. However, in the past, the process controller did not necessarily need to know these other devices or process controllers, simply assuming that these devices were operating properly when performing process control.
[0005]
In addition, many process plants have other computers associated therewith that execute other applications related to business or maintenance functions. For example, some plant computers execute applications related to raw materials for ordering, replacement parts or devices for the plant, sales forecasting and production needs, and the like. Similarly, many process plants, and especially those that use computerized field devices, will not be able to integrate devices within the plant, regardless of whether these devices are process control and instrumentation devices or other types of devices. Includes applications that help monitor and maintain. For example, an Asset Management Solutions (AMS) application, sold by Fisher-Rosemount Systems, enables communication, stores data related to field devices, and verifies and tracks the operational status of field devices. An example of such a system is disclosed in U.S. Pat. No. 5,960,214 entitled "Integrated Communication Network for Use in Field Device Management Systems." In some examples, the AMS application communicates with the device to change parameters within the device, causing the device to execute an application such as a self-calibration routine or a self-diagnosis routine on its own. To obtain information about the status or health of the device. This information is stored and used by maintenance personnel to monitor and maintain these devices. Similarly, there are other types of applications used to monitor other types of devices, such as rotating equipment and power generation and supply devices. These other applications are typically available to maintenance personnel and are used to monitor and maintain devices within a process plant. However, in many cases, external service agencies perform services related to monitoring process capabilities and equipment. In these cases, external service agencies execute the typical proprietary application to obtain the data they need, analyze that data, and simply provide process plant personnel with results and recommendations. While useful, plant personnel have little or no ability to view the measured raw data or use the data analyzed in any way.
[0006]
However, in a typical plant or process, the functions associated with process control activities, device and equipment maintenance and monitoring activities, and business activities depend on where these activities occur and, typically, on the personnel performing those activities. Both exist separately. Further, different people associated with these different functions are executing different tools, such as different applications, on different computers to perform different functions. In many instances, these different tools collect or use different types of data associated with or collected from different devices in the process, and to collect the data they need. Set up separately. For example, a process control operator who generally oversees the day-to-day operation of a process, and is primarily responsible for generally ensuring the quality and continuity of process operation, sets and sets settings within a process tuning loop. Changing, typically scheduling a process operation, such as a batch operation, typically affects the process. These process control operators may use tools available for diagnosing and diagnosing and correcting process control problems within process control systems, including auto tuners, loop analyzers, neural network systems, etc. . The process control operator also receives process variable information from the process, including alarms generated within the process, via one or more process controllers that provide information to the operator about the operation. This information may be provided to the process control operator via a standard user interface.
[0007]
In addition, the operating state of control routines or functional blocks or functional blocks or modules associated with the process control routine to properly detect operating loops and provide the operator with information about the course of action being proposed to correct the problem. It is known to provide an expert engine that uses process control variables and limited information about Such an expert engine was described in U.S. application Ser. No. 09/256585, filed Feb. 22, 1999, entitled "Diagnostics in Process Control Systems," and entitled "Diagnostic Expert Process Control Systems." No. 09/499445, filed Feb. 7, 2000, both of which are expressly incorporated herein by reference. Similarly, it is known to execute a control optimization program within the plant, such as a real-time optimization program, to optimize the control activity of the process plant. Some optimization programs, for example, with respect to some desired optimization variables, such as profits, may require complexities of the plant to predict how inputs will be changed to optimize the operation of the plant. Model is used.
[0008]
On the other hand, maintenance personnel mainly responsible for ensuring that the actual equipment in the process is operating efficiently and for repairing and replacing faulty equipment are, for example, discussed above. In addition to the customized maintenance interface, AMS application tools, many other diagnostic tools that provide information about the operating status of the device in the process are used. Maintenance personnel also schedule maintenance activities that may require shutting down parts of the plant. For many newer types of process devices and equipment, commonly referred to as smart field devices, other problems with the operation of the device are automatically detected and maintenance personnel are provided through standard maintenance interfaces. Detection and diagnostic tools that automatically report these issues may be included. For example, the AMS software reports device status and diagnostic information to maintenance personnel, determines what is happening at the device, and allows communication and other information to access the device information provided by the device. Provide tools.
[0009]
Typically, the maintenance interface and maintenance personnel are, but not always, located remotely from the process control operator. For example, in some process plants, a process control operator may perform maintenance personnel or duties, and vice versa, or different persons responsible for these functions may use the same interface.
[0010]
Also, make strategic business decisions such as ordering parts, supplies, raw materials, etc., selecting which products should be manufactured and which variables should be optimized in the plant, etc. Responsible people and applications used in business applications, such as those that may be implemented, are typically located in plant offices away from both the process control interface and the maintenance interface. Similarly, an administrator or other person may use the process plant to monitor plant operation and use it to make long-term strategic decisions from a remote location or other computer system associated with the process plant. You may want to access certain information within.
[0011]
Furthermore, some tasks, such as monitoring equipment, testing device operation, and ensuring that the plant is operating in an optimal way, often measure and analyze the required data and provide plant personnel with To an external consultant or service company that provides only the results of the analysis. In these cases, the data is typically collected and stored in its own way, and is rarely made available to plant personnel for other reasons.
[0012]
For the most part, very different applications used to perform different functions in the plant, such as process control operations, maintenance operations and sales activities, are separated, so different applications used for these different tasks are There is no integration, and therefore no sharing of data or information. In fact, many plants include some, but not all, of these different types of applications. Furthermore, even if all of the applications are located in the plant, because different personnel use these different applications and analysis tools and these tools, these tools are generally different hardware in the plant. , There is little flow of information from one functional area of the plant, even if this information is useful for other functions within the plant. For example, tools such as rotating equipment data analysis tools are used by maintenance personnel to detect poorly functioning power generators or some rotating equipment (based on non-process variable data). Can be done. This tool may detect problems and alert maintenance personnel to the need for the device to be adjusted and repaired or replaced. However, even if a poorly performing device is causing a problem affecting a loop or some other component being monitored by the process control operation, the process control operator (human or software Neither expert) has the benefit of this information. Similarly, businessmen are unaware of this fact, even if the failing device is critical and may hinder the optimization of the plant in the way he wants. Since the process control expert is aware of the device problem that is ultimately causing the low performance of the loop or unit in the process control system, and the process control operator or expert has this equipment fully operational The process control expert would misdiagnose the problem it detected in the process control loop or try to apply a tool such as a loop tuner, which would never solve the problem. Can not. Similarly, a businessman makes a business decision to operate a plant in such a way that the failure of a device can never achieve the desired business effect (such as optimizing profits).
[0013]
With the large amount of data analysis and other decisions and other detection and diagnostic tools available in the process control environment, much information is available to process operators and businessmen about the health and capabilities of devices that are useful to maintenance personnel. is there. Similarly, there is a lot of information useful to the process operator about the current operator state of the process control loop and other routines. Similarly, there is information useful to maintenance personnel or process control operators in optimizing the operation of a process that is generated or used in the course of performing a business function. However, in the past, due to the segregation of these functions, the information generated or collected in functional areas is not used at all or not fully used in other functional areas, which means that It is a sub-optimal use of the entire assets in the plant.
DISCLOSURE OF THE INVENTION
[Means for Solving the Problems]
[0014]
Process plants use asset utilization experts to collect data or information related to process plant assets, for example, from various sources or functional areas of the plant, maintenance functional areas, and business system functional areas. This data and information is then sent out and processed in a coordinated manner by tools such as, for example, optimization and modeling tools, and is used to achieve better or more optimal control, maintenance and business activities. Redistributed to other areas or tools used. For example, information or data may be gathered by health, variables, devices, loops, units, or other maintenance functions related to capabilities or availability. This information is then sent out and displayed to the process operator or maintenance personnel to inform him or her of a current or future problem. This same information can be used by the process operator to correct the current problem in the loop, or to change the control plan of the system to capture or correct the misbehaving device.
[0015]
In one embodiment, a data communication system in a process plant includes a database configured to store a plurality of different types of data, and a plurality of applications communicatively connected to the database via different communication networks. The plurality of applications includes two or more process control applications, a process quality monitoring application such as an optimization application, a process device monitoring application, and a business application. In this case, each of the plurality of applications sends data to be stored in the database to the database, and at least one of the plurality of applications receives data from the database sent to the database via another of the applications. Is configured to access the data. If desired, one or more of the plurality of applications may be provided or implemented by a service provider associated with the process plant.
BEST MODE FOR CARRYING OUT THE INVENTION
[0016]
Referring to FIG. 1, a
[0017]
Still further, a maintenance system, such as a computer running an AMS application or other device monitoring or communication application, is connected to the
[0018]
The
[0019]
Similarly, a power generation and
[0020]
In the past, the various
[0021]
To solve this problem, a computer including maintenance functions and business functions as implemented in the
[0022]
As shown in FIG. 1, the
[0023]
In one embodiment, communication over
[0024]
Generally speaking,
[0025]
In particular, the
[0026]
In one embodiment, the
[0027]
In addition, the
[0028]
Moreover, the
[0029]
Also, generally speaking, one or more
[0030]
Referring now to FIG. 2, a data flow diagram is provided that illustrates some data flows between the
[0031]
In addition, the
[0032]
In one embodiment, the
[0033]
The
[0034]
The
[0035]
In addition, the control expert 65 (which may include a predictive process controller) may control the device being controlled, although it was thought in the past that it would cause the device to function properly or not at all. For example, the availability, variability, health or other information related to the status or health of devices, loops, etc. that are considered when attempting to control the process. You can receive. Like the
[0036]
Still further, the
[0037]
The
[0038]
In addition, one or more tailored
[0039]
Thus, as will be appreciated, once the data is received at the central database and converted, for example, into a common format, the data is stored in the database in some accessible manner and stored in the asset management Within the
[0040]
In one embodiment, a conventional process control service provider that has collected and generated data using a proprietary application away from the process control network in the past provides the collected and generated data to the
[0041]
As noted above, the
[0042]
While highly mathematically accurate or theoretical models (eg, third or fourth order models) can be used for the entire plant or for any or all of the component models, individual models are mathematically It need not be as accurate as possible, for example a primary or secondary or other type of model. These simpler models can generally be run faster in software, and the model's inputs and outputs match the actual measurements of the inputs and outputs made in the plant in the manner described here. By doing so, it can be made more accurate. In other words, individual models can adjust or fine tune the plant or entities within the plant to more accurate models based on actual feedback from the plant.
[0043]
The use of a hierarchical software model is now described with reference to FIGS. FIG. 3 illustrates a model of
[0044]
Referring now to FIG. 4, a constitutive model of the
[0045]
As described above, a constitutive model for the
[0046]
If desired, any particular model or component model may be run to determine the values of the parameters associated with that model. These parameters, such as some or all of the efficiency parameters, may mean something to the engineer in the context of the model, but are generally not measurable within the
[0047]
Similarly, a regression analysis may be performed to determine if the sensor making the measurement in
[0048]
In any case, using these constituent models,
[0049]
It will be appreciated from this discussion that the configuration model may be performed at different times for different purposes and, in many cases, may be performed periodically to perform the performance monitoring activities described above. Of course, the
[0050]
As noted above, parameters, inputs, outputs or other variables associated with any particular model are stored to provide capacity monitoring for devices, units, loops, regions or other entities of the process or plant. Can be done. If desired, two or more of these variables are tracked or monitored to provide a multi-dimensional plot or provide a measure of an entity's capabilities. As part of this capability modeling, the location of the parameters or other variables in the multi-dimensional plot are within the area where the entity is desired or accepted, as defined by the adjusted parameters being monitored. Or alternatively, it can be compared to a threshold to see if it is outside the region. Thus, the capabilities of an entity may be based on one or more parameters or other variables associated with the entity. FIG. 5 illustrates a two-dimensional plot of the operating area of an entity, such as the distillation column of FIG. 4, defined by the values of parameters P1 and P2 for this entity. Here, the parameters P1 and P2 (which may be determined using the model regression analysis described above or by any other desired method) are plotted in a two-dimensional manner and the points on the plot (the value of P1 and the value of P1, respectively) (Defined by the value of P2) is determined for different times exemplified as T1-T10. Thus, position XT1 represents a point defined by values for parameters P1 and P2 at time T1. The position XT1 relative to XT10 on the plot of FIG. 5 indicates that the entity operates in the preferred region (region 1) between times T1 and T6 and enters the less desirable but acceptable region (region 2) at time T7, At T10, an unacceptable or failed area (area 3) is entered. Of course, the boundaries of these different areas are, for example, measured in advance by an expert and stored in the
[0051]
The
[0052]
If desired, the
[0053]
Thus, for example, the capabilities of the entity may be determined using a constitutive model that estimates the parameters of the entity (one of which may be efficiency) based on the regression analysis described above. At the same time, the model of the entity is implemented using parameters that result according to the design criteria of the entity, but are based on inputs to and outputs to the entity. Thus, for example, if different ingredients are being input to the entity, the design model will be run using the efficiencies resulting from the changes in ingredients. In either case, the capabilities of the entities can be compared to determine a capability index that indicates how far the actual entity is operating from possible or designed operations. This capability index can then be reported and used to a user or application of the application or system, such as process control, maintenance or business people.
[0054]
The
[0055]
In one embodiment, the RTO + real-time optimization routine provided by MDC can be used as a real-time optimization program, such as every 3-5 minutes, every 10-15 minutes during operation of the
[0056]
The RTO + optimizer performs three general phases each time it is run to perform real-time optimization. The RTO + optimization routine is shown earlier in the design of the optimizer, which is a variable that can be manipulated by the optimizer to perform the optimization, such as target values or other inputs for various devices, units, etc. The input phase is performed first while checking to determine whether the variable being manipulated can actually be manipulated at this time. This information is available to the optimization program from the
[0057]
As part of the input phase, the real-time optimizer also presents from the last run of the optimizer, during the last run of the optimizer, the variables that support changing are actually changed or Actually changing or approaching the calculated values, i.e. the values that support them being changed. If for any reason a variable that is supported to change to a particular value does not approach that value, the optimizer can prevent the change from occurring, and in effect, Recognizes the problem of removing the option to change this variable to its value during execution. Detecting that a variable has failed to reach the value it should theoretically have may also cause the optimizer to notify the operator that there is a problem in the system to address.
[0058]
Next, during the input phase, the optimizer performs a fast execution of each individual component model that builds an overall model using, for example, actual inputs and outputs measured from the
[0059]
Assuming that each constituent model can be executed, the optimizer can look for inconsistencies in the model that can affect the optimizer's ability to optimize. For example, the optimizer may determine whether the measurements made by the true device are similar to those predicted by a configuration model using the actual inputs to the device. The model (using the most recently calculated model parameters) shows that the model shows a flow rate of 18 and that the flow meter has a flow rate of 20, and then the optimization program uses two more than the previously defined constraints. Predict output that deviates from the actual measurement of output, such as resetting the constraint on only low flow rates. Thus, if the constraint on the flow rate is initially set to 25, the optimizer will use the 23 constraints, since the optimizer will recognize that the model has 2 errors with respect to this variable. it can. Of course, the optimizer may find other discrepancies or deviations between the model and the actual measurements of the plant in order to reset, update or adjust constraints or other variables in the optimization routine. it can.
[0060]
In the next phase, commonly known as the optimization phase, the output from one component model is used as input to one or more of the other component models forming the overall model. The optimization program executes the individual models in a predetermined order. Using the entire model, the constraints provided by the user, and the new constraints determined by the input phase as well as the optimization criteria, the optimizer determines the changes to be made to the inputs, or Manipulate variables that are detected as capable of optimizing the plant over the time window in which the optimizer is running. This time window can be 3-4 minutes, 3-4 hours, etc., and is generally the periodic rate at which the optimization program runs. The use of optimization software is well known, and any desired optimization software can be used for this purpose. Thus, in one embodiment, the refinery plant has a C value determined by the number of products associated with the market value and their possible output. Two Based on the possible output products that can be produced by the crackers, C Two It can be optimized to operate a cracker. However, the constraint is that no matter what the current price of the product encounters, there is a business contract that provides the amount of the product that must be met, Two It may be that the cracker has to produce some single product. In another example, the optimization and criteria may be to optimize the use of one particular ingredient. This is because the cost of maintaining an excess of the feedstock in the plant diminishes other cost or price concerns, such as the product holding the highest market value.
[0061]
Ultimately, it can be seen that the determination of optimization criteria commonly performed by business people or business applications is a very important criteria for the optimization program and, therefore, ultimately the operation of the
[0062]
Next, the optimization routine enters an output phase in which realization of the results of the optimization program can be achieved. In particular, after calculating the proposed change to the manipulated variable, the optimizer determines whether the variable or input to be changed is still available. This is because one or more devices that were available when the optimizer initiated the optimization phase optimization may be offline or otherwise unavailable. Will prevent the proposed change of the input variable from being implemented. However, if all manipulated variables to be changed can still be changed, the proposed change can be provided to the operator via, for example, a user interface (eg, a graphical user interface). The operator can simply press a button and manipulate the manipulated variables, such as changing set points, which are initiated or automatically downloaded to the process control routine, in a manner predetermined by the optimization program. , You can make changes. In other embodiments, or at a later stage, for example, when the process is operating properly, if the operator does not prevent implementation of these changes within a particular time window, the optimization program The proposed changes can be made automatically. In this way, the output of the optimizer may be used at any time the optimizer is run, unless the operator intervenes to prevent changes from the optimizer from being used. As part of this operation, one or more of the
[0063]
Real-time optimizers such as those described above can be run relatively frequently compared to most optimizers for a number of reasons. First, real-time optimization programs use fitness for the target component model, which typically runs much faster than the highly theoretical models typically used to design plants. However, these constituent models are accurate because one or more parameters of the model are adjusted or modified based on the actual inputs and outputs of the plant 10 (using regression analysis described above). That is, the real-time optimization program uses the model parameters provided by the last run of regression analysis on the model to match the model with the actual operation of the
[0064]
While a real-time optimizer was discussed above while using a closed loop, other types of
[0065]
Other optimization programs, such as a selection optimization program, may determine whether changes in the process configuration that need to be performed by an operator or maintenance personnel have been able to better optimize the process. For example, in some cases, the selection optimizer may be able to use certain units or other manipulated inputs for which the real-time optimizer is believed to be available, for example, in association with these inputs, for some reason. It may recognize that it is no longer available, for example because the device is down or offline. The selection optimizer performs one or more optimization tests, assuming that one or more of these devices, units, etc. are available, and if these entities are returned to operation, Determine whether the
[0066]
As a result of the above discussion, it can be seen that the use of models provides new types of data or information for business applications, process control applications, and asset maintenance and monitoring applications. In particular, the model may be used to perform capacity monitoring and to generate a capacity index that indicates the relative capacity of devices, units, regions, etc. within the plant. This capability index may be a measure of the entity's capabilities with respect to the entity's possible capabilities. In addition, while device and unit models are discussed above, similar models for process control entities such as loops, units, etc., to provide capability measurements and optimization criteria for these types of entities as well. Can be created and executed. Also, as described above, models may in some cases be used to measure or indicate the health of particular devices or other entities, or to provide a health index that represents these entities. For example, error measurements for certain input and output sensors as determined by the regression analysis used for a particular model can be used or translated into an indication of the health of those devices. Also, other information not available to the process controller, such as model parameters and virtual sensor measurements based on the model, may be provided to the process controller or to a business person used in a number of ways.
[0067]
In addition to the performance and health indexes, the
[0068]
The availability index tracks or reflects the use of individual devices, units, loops or other entities in any way, and based on previously determined benchmarks or operational goals, these Provides some indication of whether an entity is overused or underused. The availability index may be generated based on the measured usage of the actual device. For example, the device is often used or idle in the process, and the index is used to determine whether this index is overused or underused for that entity. Can be compared. The availability index indicates whether devices, units, loops, etc. are underused as often as they should or should be, while they are used too much and are used too much Is identified.
[0069]
In some cases, the availability index may be determined based on business decisions made regarding the proper or desired use of a particular device. For example, many processing or refining plants are dedicated to coking problems and, as a result, use furnaces that must be periodically cleaned. Generally speaking, coking occurs in furnaces used in the petroleum industry where it is desirable to heat a petroleum-based fluid in a short time. Such a furnace may have an input tube passing through the interior of the furnace so that the fluid traveling in the tube is rapidly heated to a high temperature, for example, 1400 ° F. In some instances, heating the center of the tube to such high temperatures requires heating the outside of the tube to about 1700 ° F. However, since the passage of fluid through the tube is based on petroleum, some materials form carbon or other types of viscous or particulate materials that adhere to the inner surface of the tube, and then the furnace over time. Reduce heat transfer efficiency. This deposit of material is commonly referred to as coking. The more fluid that passes through the tube, the more coking will appear and the more efficient the furnace will be. In some respects, the efficiency of the furnace is reduced because the furnace needs to be taken offline and cleaned. This cleaning process is time consuming and requires many human resources and resources, including a water vapor cleaning device. As a result, cleaning of these furnaces must be reserved and available in advance for human resources and the necessary equipment.
[0070]
Businessmen or process control operators who are aware of the fact that coking is occurring in particular furnaces within the
[0071]
To plan the maximum utilization of the furnace over a given time, such as the 15-day period discussed above, the operator or business man must determine the desired amount of coking for the furnace over time. May draw a line. An exemplary baseline 200 of a plot of time versus furnace coking is illustrated in FIG. Baseline 200 specifies how a businessman or operator wants to use the furnace with respect to coking over a period of 15 days (from which time the furnace is cleaned). Furnace coking is directly related to the heat transfer efficiency of the furnace. As can be seen from FIG. 6, at the end of the 15-day period, if furnace use follows the baseline 200, the furnace will reach its maximum coking level, which corresponds to the minimum allowable heat transfer efficiency of the furnace. Of course, it will be understood that the reference line 200 of FIG. 6 is only one of many possible reference lines.
[0072]
Unfortunately, measuring furnace coking at any given time is not possible due to the high temperatures in the furnace. However, alternatively, the measurement of coking in the furnace may be made using one or more models for the furnace constructed in accordance with the principles discussed above. Here, coking may be a parameter of the model determined from other variables in the model, inputs to the model and outputs from the model, or by using regression analysis as described above. The
[0073]
In the embodiment of FIG. 6, running the model for the furnace, the
[0074]
Based on this availability index, a businessman or operator uses the furnace because after a period of 15 days, the furnace is shut down, whether or not the maximum amount of coking has occurred in the furnace. Recognize that you may miss an opportunity. For example, by day 7 (which is marked as
[0075]
Referring to FIG. 7, on the other hand, the coking of the furnace at
[0076]
Other business decisions may begin to take effect in terms of changing the furnace availability index. For example, on
[0077]
As described below, a business decision to move a furnace on a particular baseline in connection with the use of a furnace model to measure or estimate the amount of coking in the furnace at a particular time is a A particular entity can be used to indicate whether it is overused or underused during the actual process execution. Further, changes to the control of the process may cause the furnace to be used more or less based on the availability index.
[0078]
The availability index for the furnace embodiment given above is the difference between the actual and desired coking values, the new allowed coking rate, the baseline and the new allowed coking rate. , Or any other use, etc., can be calculated or represented in any desired manner. Of course, although one process for determining an availability index for a furnace is described herein, many other methods for determining or determining an availability index for a furnace include other devices, units, loops, etc., in a plant. Exists as well. In particular, the availability index for different entities may be measured differently for desired and different types of entities. In one embodiment, the availability index may be expressed as a percentage, where 100% indicates that the entity is being used in a reasonable and desirable amount, and a number greater than 100% indicates that the entity has been overused. It indicates that it is being used, and numbers below 100% indicate that it is underutilized. Of course, other ways of measuring and representing availability can also be used within the context of different types of devices.
[0079]
One important aspect of the system of FIG. 1 is integrated with the
[0080]
Preferably, but not necessarily, the GUI may be implemented using well-known graphic window-based structures and appearances, wherein a plurality of interconnected graphical screens or pages are displayed on a particular type. Includes one or more pull-down menus that allow the user to interact with the page in a desired way to view and / or retrieve information from the page. The features and / or capabilities of the
[0081]
Generally speaking, the GUIs described herein provide intuitive graphical depictions or displays of process control areas, units, loops, devices, and the like. Each of these graphical displays may include a capability index (some or all of which may be generated by the
[0082]
In addition, the GUI described herein provides maintenance information for that user, either automatically or in response to a request by the user. The maintenance information may be provided by any part of the
[0083]
FIG. 8 is an exemplary depiction of a screen representing a
[0084]
Importantly, the GUI display shown in FIG. 8 also includes a plurality of index names and values 550. In particular, index names and
[0085]
Before discussing the GUI and processes in which asset information, process control information, maintenance information, diagnostic information or other types of information are displayed to the user, a brief discussion of how the capabilities and status indexes are generated is provided below. . Also, the performance index, the health index, the volatility index and the availability index are described in detail herein in connection with various indications of the GUI, but may be additional and / or different without departing from the scope of the present invention. It should be recognized that the index can be generated by the
[0086]
In general, each of the indices generated by the
[0087]
Similarly, units or loops, each having one or more devices or functional blocks, each have a unique set of indices. However, the index value for each unit or loop can be generated by mathematically combining the index values for individual devices or functional blocks within that unit or loop. Thus, if a unit or loop consists of pressure transmitters, valves and pumps (or functional blocks related to the operation of these devices), the index values for the unit or loop will be those index values that make up the unit or loop. It is based on various mathematical combinations of index values generated for a device or functional block or for each. Similarly, since the subunit and unit levels of the hierarchy consist of one or more loops and similarly devices, the index value for each subunit and unit is generated by a mathematical combination of the loop or device index values. Can be done. Still further, the region index can be determined as a unit, loop, device, or other combination within the region.
[0088]
As described in more detail below, the mathematical combination of device index values to form index values for loops, subunits, units, and domain levels of the hierarchy may be weighted sum or average, or any other suitable mathematical Coupling can also be used. Of course, the calculation of one or more of the capacity, health, variability and availability indices may not be appropriate, necessary or useful for all levels of the logical and device hierarchy. FIG. 9 shows that a capability index (PI), a health index (HI), a variability index (VI) and a utilization index (UI) are generated for device, loop, subunit and unit levels of the system hierarchy or 5 is an exemplary table showing one method that is not generated. As shown in FIG. 9, PIs can be generated for unit and subunit levels. At the unit and subunit level, the PI compares the model of the unit or subunit (eg, one of the models 56) against the actual capabilities of the unit or subunit in any desired manner, Can be calculated. In particular, the PI in this situation (ie, unit and subunit levels of the hierarchy) may be, for example, an efficiency with respect to a theoretical maximum or an empirically derived maximum efficiency based on actual system capabilities. Also, the table shown in FIG. 9 shows that PI need not be calculated for individual devices or loops. However, in some applications it is preferable to calculate the PI for loops and devices. For example, in the case of calculating a PI for a device, the device manufacturer may require that the device, during operation, compare the PI with the actual capabilities (eg, operator efficiency, etc.) to store capability information including the theoretical maximum device efficiency. The capability information in the device is stored so that it can be calculated based on the comparison. Of course, the
[0089]
FIG. 9 also shows that VIs can be calculated at the level of loops and devices in the hierarchy. At the device level, a VI may be calculated by comparing the change or deviation of the device with the expected or desired amount of change or variation. An extremely high or extremely low VI value indicates a device failure or malfunction, or may be an impending failure or malfunction. Similarly, at the loop level, extremely frequent or large-scale changes in the output of the loop are indicative of a problem. In any case, the VI for loops and devices is based on a comparison of the actual parameter variability to the expected parameter variability, which can be determined theoretically or empirically. Although FIG. 9 shows that VIs cannot be calculated for unit and subunit levels, in some applications it is nevertheless desirable to generate VIs for these levels.
[0090]
Further, FIG. 9 shows that HI is calculated for device, loop, subunit and unit levels. The HI for a device is based on the historical usage of the device. In particular, the device manufacturer may store information about the life cycle of the device within the device, and the effects of the environment on the device during its use and its operation (eg, temperature variations, shocks, etc.) , The device may determine if it has moved along its life cycle curve (ie, old age). The manufacturer can program the device to provide an HI value that represents the current state of the device's life cycle. For example, a stroke-type valve has an expected useful operating life cycle of 250,000 full-stroke cycles, and the manufacturer of the stroke-type valve, typically a computerized field device, claims that The expected number of life strokes along with the current number of strokes having is stored in its memory. Thus, if the HI value can fluctuate between 0 and 10 (where zero represents unhealthy and 10 is perfect), as the number of strokes rises from zero to 250,000, The HI value generated by the valve can vary from zero to ten. Of course, the exact relationship between the HI value and life cycle characteristics (eg, stroke) is not always linear. Conversely, many life cycle features follow an exponential property, whereby over time, as the stroke is completed, etc., and the current detected state of the device and how well it is performing. There are many ways to define and calculate the HI for a device based on For example, if a device has two detected minor issues, its HI may be reduced.
[0091]
On the other hand, the HI for a loop is preferably, but not necessarily, a mathematical combination of HI values (eg, weighted sum or average) for the individual devices or functional blocks that make up the loop. Similarly, the HI values for subunits and unit levels may also be the underlying mathematical combination of HI values for loops and subunits. Thus, ultimately, the hierarchy of HI values for levels above the device level is based on one or more HI values for the devices forming the composite value.
[0092]
Also, as shown in FIG. 9, the UI can be calculated for the loop, subunit and unit levels, but need not necessarily be calculated for the device level. Generally speaking, a UI represents the degree to which a particular asset (eg, a loop, subunit or unit) is being utilized relative to its capabilities or desired availability. For example, the UI value may be based on the amount of time that a unit, subunit, or loop has been used to perform control or generate output. Additionally or alternatively, the UI value may be based on the amount of material being processed by the loop, subunit, and / or unit, as compared to the maximum amount that can be processed by the loop, subunit, unit, etc. Is also good.
[0093]
FIG. 10 is an exemplary chart illustrating one way the PI is calculated for the
[0094]
In a similar manner, the HI for
[0095]
FIG. 12 is an exemplary table showing one way in which VIs are calculated for units such as
[0096]
FIG. 13 is an exemplary display that may be provided by the GUI in response to excessive VI values associated with a device and / or loop. As shown in FIG. 13, the display may provide one or more possible explanations for extremely high or extremely low VI values associated with a particular device. In particular, the display may indicate, automatically or at the request of the user, the impulse line associated with the device that has become connected, that the process has been modified, that cavitation is present in the upstream pump, etc. Based on the data analysis tools that have detected these situations, this information is made available to the GUI by the
[0097]
FIG. 15 is an exemplary graphic depiction of a display that may be provided to a user by a GUI to enable monitoring of the capabilities of units, subunits, loops, devices, etc. within the
[0098]
Still further, the GUI may provide a textual message in the graphical display shown in FIG. 15 or in some other display or page that indicates a current or potential problem to the user, which may be displayed. Index values or changes thereof. These text messages can identify possible solutions to the identified problem. The graphical information represented in FIG. 15 is scaled so that the index is expressed as a percentage and the time axis is labeled in months, but instead of any other units and Display resolution can also be used. For example, if the index changes or can change abruptly, the GUI may prompt the user for an hourly basis, every minute, every few seconds, or more (ie, higher time periods). It may be possible to display index values (at resolution).
[0099]
FIG. 16 is an exemplary graphical display that may be provided by a GUI to allow a user to quickly analyze the operational status and capabilities of a process area within the
[0100]
It will be appreciated that the user sees successively lower and lower entities in the plant, and information about the index associated with each of these different entities or displays is provided. Thus, for example, a user can focus on the display of the plant and see a particular set of indices for the plant. The user can then focus on one region, such as by clicking on one of the regions in the plant display, and view the index associated with that region. Similarly, by clicking on a unit in the displayed area, it is possible to see the index for a different unit. Similarly, indices for loops, subunits, devices, etc., can be viewed by looking at these entities that are different from the representation of the entity where they are located. In this way, the user can quickly find a cause at any point or level of points that is lower (or higher) than the expected index.
[0101]
FIG. 17 is an exemplary pictorial representation of a display that may be provided by a GUI to allow a user to view tracking audit information in connection with any device used in
[0102]
FIG. 18 illustrates that the user can perform a more detailed analysis of the data that can be used to generate one or more of the indices for a particular device within
[0103]
FIG. 20 is a further illustrative other pictorial representation of a display that may be provided by a GUI that allows a user to quickly review alarm information, conditions, etc. within the
[0104]
21-24 are exemplary pictorial illustrations of a display that may be provided by a GUI in response to further investigation by a user of alarms, alerts or other events related to the device, for example. Generally speaking, a user may request device status information from a pop-up window, such as pop-up
[0105]
FIG. 25 is an exemplary depiction of a display that may be provided by a GUI to allow a user to diagnose loop-related problems. A display such as that shown in FIG. 25 may be provided by the GUI in response to the user's further investigation of the abnormal index value. For example, the user may recognize that the PI value for a particular loop is much lower and provide a pop-up
[0106]
FIG. 26 is another exemplary depiction of a display that may be provided by a GUI that allows a user to analyze the capabilities and / or status of one or more process control loops. Various parameters and characteristics of one or more loops can be monitored. For example, the operating mode of the loop, whether control of the loop is restricted, how uncertain the loop input is, the changes in the loop, etc. can all be monitored simultaneously. Moreover, an overview of the controls providing the performance indicators and the availability indicators may be provided as well. However, for the display shown in FIG. 26, the performance and availability indicators may, but need not, be the same as the PI and UI values for the loop being monitored. The display of FIG. 26 may be generated by a diagnostic control routine such as that disclosed in the aforementioned U.S. patent application Ser. Nos. 09 / 256,585 and 09 / 499,445.
[0107]
FIG. 27 is an exemplary yet another depiction of a display that may be provided by a GUI that allows a user to perform a work order automatically generated by the work order generation routine 54. The
[0108]
In addition, the work order generation routine 54 may automatically and automatically determine the supplier or general affairs of parts, supplies, etc., with or without operator or maintenance personnel intervention, based on the detected actual or predicted
[0109]
Referring to FIGS. 28-31, the GUI may provide other screens to indicate to the user a future problem, such as a current or predicted problem, which may be an
[0110]
Referring to FIG. 32, a method for remotely providing access to models, optimization programs, and other data analysis tools such as capacity monitoring tools for one or more process plants will be described. . As shown in FIG. 32, one or
[0111]
As shown in FIG. 33,
[0112]
During operation, any of processes 900-903 collects the input and output data associated with the process at a convenient time and collects such data into one of
[0113]
In any event, after executing the model, data analysis, or optimization tool,
[0114]
In one embodiment, the real-time optimization program as described above assumes that the plants 900-903 provide sufficient data in a timely and periodic manner to enable proper implementation of the optimization program. It can be performed on a true time basis. If desired, the
[0115]
In this manner, the
[0116]
If desired, each plant 900-903 can apply the new or updated model to those plants by sending it to
[0117]
While the
[0118]
Thus, while the present invention has been described with reference to particular embodiments, they are intended to be illustrative only and not limiting, the modifications, additions, or omissions of which are intended to be within the spirit and scope of the invention. It will be apparent to those skilled in the art that the disclosed embodiments can be made without departing from the invention.
[Brief description of the drawings]
[0119]
FIG. 1 is a block diagram of a process plant having an asset utilization expert configured to receive and coordinate data transfers between many functional areas within the plant.
FIG. 2 is a diagram of data and information relating to an asset utilization expert in the plant of FIG. 1;
FIG. 3 is a block diagram of a model used to simulate the operation of an area within a plant.
FIG. 4 is a block diagram of a model used to simulate the operation of units in the domain model of FIG.
FIG. 5 is a two-dimensional performance monitoring diagram.
FIG. 6 is a graph showing an exemplary standard line selected for use in a furnace and the rate of coke ratio based on the standard line.
FIG. 7 is a graph illustrating the onset of a new coke ratio rate based on the standard line of FIG. 6;
FIG. 8 is an exemplary depiction of a display representing a unit in a process control system displayed by a graphical user interface.
FIG. 9 is an exemplary table illustrating one way in which indices may be generated for different levels of a system hierarchy.
FIG. 10 is an exemplary chart illustrating one way in which a capability index for a unit may be calculated.
FIG. 11 is an exemplary table illustrating one method that may be used to calculate a new index value as a weighted average of index values.
FIG. 12 is an exemplary table illustrating one way in which a variability index is calculated for a unit.
FIG. 13 is an exemplary display that may be provided by a graphical user interface in response to an abnormal variability index.
FIG. 14 is an exemplary display of data used to generate a variability index.
FIG. 15 is an exemplary illustration of a display that may be provided by a graphical user interface.
FIG. 16 is an exemplary illustration that may be provided by a graphic user interface.
FIG. 17 is an exemplary depiction of a display that may be provided by a graphical user interface so that a user can view audit trail information.
FIG. 18 is an exemplary depiction of a display that may be provided by a graphical user interface so that a user may perform a more detailed analysis of data used to generate an index for one or more devices. It is.
FIG. 19 is an exemplary depiction of a display that may be provided by a graphical user interface to allow a user to visually view or monitor the performance characteristics of the device.
FIG. 20 is an exemplary further depiction of a display that may be provided by a graphical user interface to allow a user to quickly explore information within the plant.
FIGS. 21-23 are exemplary pop-up windows that may be displayed by a graphical user interface to provide device status information.
FIGS. 21-23 are exemplary pop-up windows that may be displayed by a graphical user interface to provide device status information.
FIGS. 21-23 are exemplary pop-up windows that may be displayed by a graphical user interface to provide device status information.
FIG. 24 is an exemplary display that may be provided by a graphical user interface to provide detailed help information to a user.
FIG. 25 is an exemplary depiction of a display that may be provided by a graphical user interface so that a user may diagnose a loop-related problem.
FIG. 26 is a further exemplary other depiction of a display that may be provided by a graphical user interface that allows a user to analyze the capabilities and / or status of one or more process control loops. .
FIG. 27 is another exemplary depiction of a display that may be provided by a graphical user interface so that a user may track or generate work orders.
FIGS. 28-31 are displays illustrating a spectral plot of the vibration of an element in a rotating device.
FIGS. 28-31 are displays that illustrate spectral plots of component vibrations in a rotating device.
FIGS. 28-31 are displays that illustrate spectral plots of vibrations of elements within a rotating device.
FIGS. 28-31 are displays that illustrate spectral plots of element vibrations in a rotating device.
FIG. 32 is a block diagram of a remote monitoring function connected to a plurality of process plants via a communication network. And
FIG. 33 is a more detailed block diagram of the remote monitor function of FIG. 32.
Claims (47)
サービス提供者によってプロセスプラントに実装されたサービスアプリケーションを含むプロセスプラント内の複数のデータソースからデータを集めること、
前記集められたデータをデータベースに格納すること、
前記格納されたデータをプロセスプラント内で一つ以上のプロセス制御アプリケーション又は保守アプリケーションに対しアクセス可能にすること、及び、
前記格納されたデータを前記サービスアプリケーション対しアクセス可能にすること
を含む方法。A method for collecting and using data in a process plant, the method comprising:
Collecting data from multiple data sources in the process plant, including service applications implemented in the process plant by the service provider;
Storing the collected data in a database;
Making the stored data accessible to one or more process control or maintenance applications within a process plant; and
A method comprising making said stored data accessible to said service application.
前記プロセスプラントにおいて用いられているように、前記第1のアプリケーションから第1のデータを集めること、
前記第1のデータをメモリに格納すること、
前記プロセスプラントに関連するサービス提供者により実行される第2のアプリケーションから第2のデータ集めること、
前記メモリに前記第2のデータを提供すること、
前記メモリに前記第2のデータを格納すること、及び
前記第2のデータを前記メモリから前記第1のアプリケーションに利用可能とすること
を含む方法。A method for performing an operation for a process plant having a controller, a plurality of devices, and a first computer executing a first application that is a process control or maintenance application used by plant personnel, the method comprising: Is
Collecting first data from the first application as used in the process plant;
Storing the first data in a memory;
Collecting second data from a second application executed by a service provider associated with the process plant;
Providing the second data to the memory;
A method comprising: storing the second data in the memory; and making the second data available from the memory to the first application.
第1の通信プロトコルを使用する前記プロセスプラントに関連する第1の通信ネットワークと、
前記第1の通信ネットワークを介して通信するように適合した第1のアプリケーションと、
第2の通信プロトコルを使用するプロセスプラントに関連する第2の通信ネットワークと、
前記第2の通信ネットワークを介して通信するように適合した第2のアプリケーションと、
前記第1の通信ネットワーク及び前記第2の通信ネットワークに通信可能に接続したデータベースとを備え、前記データベースは、前記第1のアプリケーションからの第1のデータ及び第2のアプリケーションからの第2のデータを受け取り、前記第1のデータ及び前記第2のデータを格納し、並びに前記第1のデータを前記第2の通信ネットワークを介して前記第2のアプリケーションに提供し及び前記第2のデータを前記第1の通信ネットワークを介して前記第1のアプリケーションに提供するように適合しているシステム。A data communication system in a process plant,
A first communication network associated with the process plant using a first communication protocol;
A first application adapted to communicate via the first communication network;
A second communication network associated with a process plant using a second communication protocol;
A second application adapted to communicate via the second communication network;
A database communicably connected to the first communication network and the second communication network, wherein the database includes first data from the first application and second data from a second application. Receiving the first data and the second data, and providing the first data to the second application via the second communication network, and storing the second data in the second application. A system adapted to provide the first application via a first communication network.
複数の異なるタイプのデータを格納するように適合したデータベースと、
異なる通信ネットワークを介して前記データベースに通信可能に接続した複数のアプリケーションとを備え、前記複数のアプリケーションは、プロセス制御アプリケーション、プロセス能力監視アプリケーション、プロセスデバイス監視アプリケーション、及びビジネスアプリケーションのうちの2つ以上を含み、
前記複数のアプリケーションの各々は、格納されるべきデータベースにデータを送り出すように適合しており、前記複数のアプリケーションの少なくとも1つは、もう一つのアプリケーションを介して前記データベースに送られた前記データベースからのデータにアクセスするように適合しているシステム。A data communication system in a process plant,
A database adapted to store multiple different types of data,
A plurality of applications communicatively connected to the database via different communication networks, wherein the plurality of applications are two or more of a process control application, a process capability monitoring application, a process device monitoring application, and a business application Including
Each of the plurality of applications is adapted to send data to a database to be stored, and at least one of the plurality of applications is from the database sent to the database via another application. A system that is adapted to access data from
Applications Claiming Priority (3)
| Application Number | Priority Date | Filing Date | Title |
|---|---|---|---|
| US27316401P | 2001-03-01 | 2001-03-01 | |
| US09/953,811 US7206646B2 (en) | 1999-02-22 | 2001-09-17 | Method and apparatus for performing a function in a plant using process performance monitoring with process equipment monitoring and control |
| PCT/US2002/006577 WO2002071173A2 (en) | 2001-03-01 | 2002-03-01 | Data sharing in a process plant |
Related Child Applications (1)
| Application Number | Title | Priority Date | Filing Date |
|---|---|---|---|
| JP2008203144A Division JP2009020896A (en) | 2001-03-01 | 2008-08-06 | Data sharing in process plant |
Publications (1)
| Publication Number | Publication Date |
|---|---|
| JP2004533036A true JP2004533036A (en) | 2004-10-28 |
Family
ID=26955983
Family Applications (2)
| Application Number | Title | Priority Date | Filing Date |
|---|---|---|---|
| JP2002570030A Pending JP2004533036A (en) | 2001-03-01 | 2002-03-01 | Data sharing in process plants |
| JP2008203144A Pending JP2009020896A (en) | 2001-03-01 | 2008-08-06 | Data sharing in process plant |
Family Applications After (1)
| Application Number | Title | Priority Date | Filing Date |
|---|---|---|---|
| JP2008203144A Pending JP2009020896A (en) | 2001-03-01 | 2008-08-06 | Data sharing in process plant |
Country Status (6)
| Country | Link |
|---|---|
| US (1) | US7346404B2 (en) |
| EP (1) | EP1364263B1 (en) |
| JP (2) | JP2004533036A (en) |
| CN (1) | CN1324420C (en) |
| DE (1) | DE60206884T2 (en) |
| WO (1) | WO2002071173A2 (en) |
Families Citing this family (160)
| Publication number | Priority date | Publication date | Assignee | Title |
|---|---|---|---|---|
| US7206646B2 (en) * | 1999-02-22 | 2007-04-17 | Fisher-Rosemount Systems, Inc. | Method and apparatus for performing a function in a plant using process performance monitoring with process equipment monitoring and control |
| US7562135B2 (en) * | 2000-05-23 | 2009-07-14 | Fisher-Rosemount Systems, Inc. | Enhanced fieldbus device alerts in a process control system |
| US6975219B2 (en) * | 2001-03-01 | 2005-12-13 | Fisher-Rosemount Systems, Inc. | Enhanced hart device alerts in a process control system |
| US8044793B2 (en) * | 2001-03-01 | 2011-10-25 | Fisher-Rosemount Systems, Inc. | Integrated device alerts in a process control system |
| US8073967B2 (en) * | 2002-04-15 | 2011-12-06 | Fisher-Rosemount Systems, Inc. | Web services-based communications for use with process control systems |
| WO2002071171A2 (en) * | 2001-03-01 | 2002-09-12 | Fisher-Rosemount Systems, Inc. | Automatic work order/parts order generation and tracking |
| US7720727B2 (en) * | 2001-03-01 | 2010-05-18 | Fisher-Rosemount Systems, Inc. | Economic calculations in process control system |
| US6795799B2 (en) * | 2001-03-07 | 2004-09-21 | Qualtech Systems, Inc. | Remote diagnosis server |
| US20020191102A1 (en) * | 2001-05-31 | 2002-12-19 | Casio Computer Co., Ltd. | Light emitting device, camera with light emitting device, and image pickup method |
| JP2003271232A (en) * | 2002-03-12 | 2003-09-26 | Tokyo Electron Ltd | Method and system for collecting data for remote maintenance and diagnosis of production apparatus |
| DE10243781A1 (en) * | 2002-09-20 | 2004-03-25 | Sick Ag | Electronic device for a bus system |
| US7367018B2 (en) * | 2002-10-25 | 2008-04-29 | Aspen Technology, Inc. | System and method for organizing and sharing of process plant design and operations data |
| US7493310B2 (en) * | 2002-12-30 | 2009-02-17 | Fisher-Rosemount Systems, Inc. | Data visualization within an integrated asset data system for a process plant |
| US8935298B2 (en) | 2002-12-30 | 2015-01-13 | Fisher-Rosemount Systems, Inc. | Integrated navigational tree importation and generation in a process plant |
| US20050027656A1 (en) * | 2003-02-11 | 2005-02-03 | Tyson Foods, Inc. | A system and method for monitoring facility data |
| US6915235B2 (en) * | 2003-03-13 | 2005-07-05 | Csi Technology, Inc. | Generation of data indicative of machine operational condition |
| US7634384B2 (en) * | 2003-03-18 | 2009-12-15 | Fisher-Rosemount Systems, Inc. | Asset optimization reporting in a process plant |
| US20040230328A1 (en) * | 2003-03-21 | 2004-11-18 | Steve Armstrong | Remote data visualization within an asset data system for a process plant |
| JP4869062B2 (en) * | 2003-03-21 | 2012-02-01 | フィッシャー−ローズマウント システムズ, インコーポレイテッド | Remote data browsing system and method for browsing entity data |
| US20040204913A1 (en) * | 2003-04-09 | 2004-10-14 | Peter Mueller | Optimizing service system |
| US7516043B2 (en) * | 2003-07-31 | 2009-04-07 | Fisher Controls International Llc | Triggered field device data collection in a process control system |
| US20070299800A1 (en) * | 2003-10-31 | 2007-12-27 | Bayoumi Deia S | Industrial Information Technology (It) On-line Intelligent Control of Machines in Discrete Manufacturing Factory |
| US20050096759A1 (en) * | 2003-10-31 | 2005-05-05 | General Electric Company | Distributed power generation plant automated event assessment and mitigation plan determination process |
| US7515977B2 (en) * | 2004-03-30 | 2009-04-07 | Fisher-Rosemount Systems, Inc. | Integrated configuration system for use in a process plant |
| JP2005309077A (en) * | 2004-04-21 | 2005-11-04 | Fuji Xerox Co Ltd | Fault diagnostic method, fault diagnostic system, transporting device, and image forming apparatus, and program and storage medium |
| JP2007536634A (en) * | 2004-05-04 | 2007-12-13 | フィッシャー−ローズマウント・システムズ・インコーポレーテッド | Service-oriented architecture for process control systems |
| US7580867B2 (en) | 2004-05-04 | 2009-08-25 | Paul Nykamp | Methods for interactively displaying product information and for collaborative product design |
| US7561200B2 (en) * | 2004-07-26 | 2009-07-14 | Csi Technology, Inc. | Apparatus and method for automation of imaging and dynamic signal analyses |
| US7173539B2 (en) * | 2004-09-30 | 2007-02-06 | Florida Power And Light Company | Condition assessment system and method |
| US8645092B2 (en) * | 2004-10-22 | 2014-02-04 | Fisher-Rosemount Systems, Inc. | Quality control system and method for construction, commissioning, and other initiation of a process plant |
| US8005647B2 (en) | 2005-04-08 | 2011-08-23 | Rosemount, Inc. | Method and apparatus for monitoring and performing corrective measures in a process plant using monitoring data with corrective measures data |
| US9201420B2 (en) | 2005-04-08 | 2015-12-01 | Rosemount, Inc. | Method and apparatus for performing a function in a process plant using monitoring data with criticality evaluation data |
| US8464168B2 (en) * | 2005-10-05 | 2013-06-11 | Invensys Systems, Inc. | Device home page for use in a device type manager providing graphical user interfaces for viewing and specifying field device parameters |
| US8799793B2 (en) * | 2005-10-05 | 2014-08-05 | Invensys Systems, Inc. | Tool for creating customized user interface definitions for a generic utility supporting on-demand creation of field device editor graphical user interfaces |
| US20070156835A1 (en) * | 2005-12-30 | 2007-07-05 | Sebastian Pulkowski | Exchanging data between enterprise computing systems and service provider systems |
| CA2636819A1 (en) | 2006-01-13 | 2007-07-19 | Diginiche Inc. | System and method for collaborative information display and markup |
| US20070244975A1 (en) * | 2006-04-18 | 2007-10-18 | The Southern Company | System and methods for processing operating experience data |
| US7856280B2 (en) * | 2006-08-02 | 2010-12-21 | Emerson Process Management Power & Water Solutions, Inc. | Process control and optimization technique using immunological concepts |
| US7698242B2 (en) * | 2006-08-16 | 2010-04-13 | Fisher-Rosemount Systems, Inc. | Systems and methods to maintain process control systems using information retrieved from a database storing general-type information and specific-type information |
| EP2087433A4 (en) * | 2006-11-14 | 2017-11-29 | ABB, Inc. | System for storing and presenting sensor and spectral data for batch processes |
| US10410145B2 (en) | 2007-05-15 | 2019-09-10 | Fisher-Rosemount Systems, Inc. | Automatic maintenance estimation in a plant environment |
| DE102007039170A1 (en) * | 2007-08-20 | 2009-02-26 | Siemens Ag | Converter control panel for use in drive, has functional keys arranged for multiline display, where numbers of faults and/or warnings are visible as plain text and two of navigation fields are provided with close and list functionalities |
| US8301676B2 (en) * | 2007-08-23 | 2012-10-30 | Fisher-Rosemount Systems, Inc. | Field device with capability of calculating digital filter coefficients |
| US8392845B2 (en) * | 2007-09-04 | 2013-03-05 | Fisher-Rosemount Systems, Inc. | Methods and apparatus to control information presented to process plant operators |
| US7702401B2 (en) | 2007-09-05 | 2010-04-20 | Fisher-Rosemount Systems, Inc. | System for preserving and displaying process control data associated with an abnormal situation |
| US9323247B2 (en) | 2007-09-14 | 2016-04-26 | Fisher-Rosemount Systems, Inc. | Personalized plant asset data representation and search system |
| US8055479B2 (en) | 2007-10-10 | 2011-11-08 | Fisher-Rosemount Systems, Inc. | Simplified algorithm for abnormal situation prevention in load following applications including plugged line diagnostics in a dynamic process |
| US8165705B2 (en) * | 2008-07-10 | 2012-04-24 | Palo Alto Research Center Incorporated | Methods and systems for continuously estimating persistent and intermittent failure probabilities for production resources |
| US8145334B2 (en) * | 2008-07-10 | 2012-03-27 | Palo Alto Research Center Incorporated | Methods and systems for active diagnosis through logic-based planning |
| US8266092B2 (en) * | 2008-07-10 | 2012-09-11 | Palo Alto Research Center Incorporated | Methods and systems for target value path identification |
| US8219437B2 (en) * | 2008-07-10 | 2012-07-10 | Palo Alto Research Center Incorporated | Methods and systems for constructing production plans |
| US9141105B2 (en) * | 2008-07-23 | 2015-09-22 | Hurco Companies, Inc. | Method and apparatus for monitoring or controlling a machine tool system |
| DE102008036968A1 (en) | 2008-08-08 | 2010-02-11 | Endress + Hauser Gmbh + Co. Kg | Diagnostic procedure of a process automation system |
| SG159417A1 (en) * | 2008-08-29 | 2010-03-30 | Yokogawa Electric Corp | A method and system for monitoring plant assets |
| US8600559B2 (en) | 2008-10-27 | 2013-12-03 | Lennox Industries Inc. | Method of controlling equipment in a heating, ventilation and air conditioning network |
| US8615326B2 (en) | 2008-10-27 | 2013-12-24 | Lennox Industries Inc. | System and method of use for a user interface dashboard of a heating, ventilation and air conditioning network |
| US9152155B2 (en) | 2008-10-27 | 2015-10-06 | Lennox Industries Inc. | Device abstraction system and method for a distributed-architecture heating, ventilation and air conditioning system |
| US8255086B2 (en) | 2008-10-27 | 2012-08-28 | Lennox Industries Inc. | System recovery in a heating, ventilation and air conditioning network |
| US8239066B2 (en) | 2008-10-27 | 2012-08-07 | Lennox Industries Inc. | System and method of use for a user interface dashboard of a heating, ventilation and air conditioning network |
| US9651925B2 (en) | 2008-10-27 | 2017-05-16 | Lennox Industries Inc. | System and method for zoning a distributed-architecture heating, ventilation and air conditioning network |
| US8442693B2 (en) | 2008-10-27 | 2013-05-14 | Lennox Industries, Inc. | System and method of use for a user interface dashboard of a heating, ventilation and air conditioning network |
| US8295981B2 (en) | 2008-10-27 | 2012-10-23 | Lennox Industries Inc. | Device commissioning in a heating, ventilation and air conditioning network |
| US8543243B2 (en) | 2008-10-27 | 2013-09-24 | Lennox Industries, Inc. | System and method of use for a user interface dashboard of a heating, ventilation and air conditioning network |
| US8433446B2 (en) | 2008-10-27 | 2013-04-30 | Lennox Industries, Inc. | Alarm and diagnostics system and method for a distributed-architecture heating, ventilation and air conditioning network |
| US8452906B2 (en) | 2008-10-27 | 2013-05-28 | Lennox Industries, Inc. | Communication protocol system and method for a distributed-architecture heating, ventilation and air conditioning network |
| US9678486B2 (en) | 2008-10-27 | 2017-06-13 | Lennox Industries Inc. | Device abstraction system and method for a distributed-architecture heating, ventilation and air conditioning system |
| US8352081B2 (en) | 2008-10-27 | 2013-01-08 | Lennox Industries Inc. | Communication protocol system and method for a distributed-architecture heating, ventilation and air conditioning network |
| US8564400B2 (en) | 2008-10-27 | 2013-10-22 | Lennox Industries, Inc. | Communication protocol system and method for a distributed-architecture heating, ventilation and air conditioning network |
| US8600558B2 (en) | 2008-10-27 | 2013-12-03 | Lennox Industries Inc. | System recovery in a heating, ventilation and air conditioning network |
| US8437878B2 (en) | 2008-10-27 | 2013-05-07 | Lennox Industries Inc. | Alarm and diagnostics system and method for a distributed architecture heating, ventilation and air conditioning network |
| US9268345B2 (en) | 2008-10-27 | 2016-02-23 | Lennox Industries Inc. | System and method of use for a user interface dashboard of a heating, ventilation and air conditioning network |
| US8560125B2 (en) | 2008-10-27 | 2013-10-15 | Lennox Industries | Communication protocol system and method for a distributed-architecture heating, ventilation and air conditioning network |
| US8744629B2 (en) | 2008-10-27 | 2014-06-03 | Lennox Industries Inc. | System and method of use for a user interface dashboard of a heating, ventilation and air conditioning network |
| US8437877B2 (en) | 2008-10-27 | 2013-05-07 | Lennox Industries Inc. | System recovery in a heating, ventilation and air conditioning network |
| US8694164B2 (en) | 2008-10-27 | 2014-04-08 | Lennox Industries, Inc. | Interactive user guidance interface for a heating, ventilation and air conditioning system |
| US8725298B2 (en) | 2008-10-27 | 2014-05-13 | Lennox Industries, Inc. | Alarm and diagnostics system and method for a distributed architecture heating, ventilation and conditioning network |
| US9261888B2 (en) | 2008-10-27 | 2016-02-16 | Lennox Industries Inc. | System and method of use for a user interface dashboard of a heating, ventilation and air conditioning network |
| US8463442B2 (en) | 2008-10-27 | 2013-06-11 | Lennox Industries, Inc. | Alarm and diagnostics system and method for a distributed architecture heating, ventilation and air conditioning network |
| US8802981B2 (en) | 2008-10-27 | 2014-08-12 | Lennox Industries Inc. | Flush wall mount thermostat and in-set mounting plate for a heating, ventilation and air conditioning system |
| US8977794B2 (en) | 2008-10-27 | 2015-03-10 | Lennox Industries, Inc. | Communication protocol system and method for a distributed-architecture heating, ventilation and air conditioning network |
| US8788100B2 (en) | 2008-10-27 | 2014-07-22 | Lennox Industries Inc. | System and method for zoning a distributed-architecture heating, ventilation and air conditioning network |
| US8548630B2 (en) | 2008-10-27 | 2013-10-01 | Lennox Industries, Inc. | Alarm and diagnostics system and method for a distributed-architecture heating, ventilation and air conditioning network |
| US8655491B2 (en) | 2008-10-27 | 2014-02-18 | Lennox Industries Inc. | Alarm and diagnostics system and method for a distributed architecture heating, ventilation and air conditioning network |
| US9377768B2 (en) | 2008-10-27 | 2016-06-28 | Lennox Industries Inc. | Memory recovery scheme and data structure in a heating, ventilation and air conditioning network |
| US8661165B2 (en) | 2008-10-27 | 2014-02-25 | Lennox Industries, Inc. | Device abstraction system and method for a distributed architecture heating, ventilation and air conditioning system |
| US8352080B2 (en) | 2008-10-27 | 2013-01-08 | Lennox Industries Inc. | Communication protocol system and method for a distributed-architecture heating, ventilation and air conditioning network |
| US9632490B2 (en) | 2008-10-27 | 2017-04-25 | Lennox Industries Inc. | System and method for zoning a distributed architecture heating, ventilation and air conditioning network |
| US8892797B2 (en) | 2008-10-27 | 2014-11-18 | Lennox Industries Inc. | Communication protocol system and method for a distributed-architecture heating, ventilation and air conditioning network |
| US9325517B2 (en) | 2008-10-27 | 2016-04-26 | Lennox Industries Inc. | Device abstraction system and method for a distributed-architecture heating, ventilation and air conditioning system |
| US8463443B2 (en) | 2008-10-27 | 2013-06-11 | Lennox Industries, Inc. | Memory recovery scheme and data structure in a heating, ventilation and air conditioning network |
| US8874815B2 (en) | 2008-10-27 | 2014-10-28 | Lennox Industries, Inc. | Communication protocol system and method for a distributed architecture heating, ventilation and air conditioning network |
| US8452456B2 (en) | 2008-10-27 | 2013-05-28 | Lennox Industries Inc. | System and method of use for a user interface dashboard of a heating, ventilation and air conditioning network |
| US8655490B2 (en) | 2008-10-27 | 2014-02-18 | Lennox Industries, Inc. | System and method of use for a user interface dashboard of a heating, ventilation and air conditioning network |
| US8855825B2 (en) | 2008-10-27 | 2014-10-07 | Lennox Industries Inc. | Device abstraction system and method for a distributed-architecture heating, ventilation and air conditioning system |
| US8798796B2 (en) | 2008-10-27 | 2014-08-05 | Lennox Industries Inc. | General control techniques in a heating, ventilation and air conditioning network |
| US8762666B2 (en) | 2008-10-27 | 2014-06-24 | Lennox Industries, Inc. | Backup and restoration of operation control data in a heating, ventilation and air conditioning network |
| US8994539B2 (en) | 2008-10-27 | 2015-03-31 | Lennox Industries, Inc. | Alarm and diagnostics system and method for a distributed-architecture heating, ventilation and air conditioning network |
| US8774210B2 (en) | 2008-10-27 | 2014-07-08 | Lennox Industries, Inc. | Communication protocol system and method for a distributed-architecture heating, ventilation and air conditioning network |
| US9432208B2 (en) | 2008-10-27 | 2016-08-30 | Lennox Industries Inc. | Device abstraction system and method for a distributed architecture heating, ventilation and air conditioning system |
| EP2187571B1 (en) * | 2008-11-12 | 2011-06-15 | VEGA Grieshaber KG | Generating a device description for a measuring device |
| US8898660B2 (en) * | 2008-11-25 | 2014-11-25 | Fisher-Rosemount Systems, Inc. | Systems and methods to provide customized release notes during a software system upgrade of a process control system |
| US8914783B2 (en) | 2008-11-25 | 2014-12-16 | Fisher-Rosemount Systems, Inc. | Software deployment manager integration within a process control system |
| DE102009010795A1 (en) * | 2009-02-27 | 2010-09-02 | Siemens Aktiengesellschaft | Coupling of ERP systems with process control systems for the automated transmission of plant structures and plant data |
| US8359110B2 (en) * | 2009-03-23 | 2013-01-22 | Kuhn Lukas D | Methods and systems for fault diagnosis in observation rich systems |
| US9164501B2 (en) * | 2009-10-05 | 2015-10-20 | Fisher-Rosemount Systems, Inc. | Methods and apparatus to manage data uploading in a process control environment |
| USD648641S1 (en) | 2009-10-21 | 2011-11-15 | Lennox Industries Inc. | Thin cover plate for an electronic system controller |
| USD648642S1 (en) | 2009-10-21 | 2011-11-15 | Lennox Industries Inc. | Thin cover plate for an electronic system controller |
| US9557735B2 (en) * | 2009-12-10 | 2017-01-31 | Fisher-Rosemount Systems, Inc. | Methods and apparatus to manage process control status rollups |
| US8260444B2 (en) | 2010-02-17 | 2012-09-04 | Lennox Industries Inc. | Auxiliary controller of a HVAC system |
| US8437880B2 (en) * | 2010-05-17 | 2013-05-07 | General Electric Company | System and method for enhancement of power generation facilities |
| US9760073B2 (en) * | 2010-05-21 | 2017-09-12 | Honeywell International Inc. | Technique and tool for efficient testing of controllers in development |
| US9268326B2 (en) | 2010-08-18 | 2016-02-23 | Manufacturing Technology Network Inc. | Computer apparatus and method for real-time multi-unit optimization |
| US8630728B2 (en) * | 2011-01-28 | 2014-01-14 | Abb Technology Ag | System and method for generating indices to quantify operating transition performance of a continuous process |
| JP5771426B2 (en) * | 2011-03-29 | 2015-08-26 | 東京エレクトロン株式会社 | Information processing apparatus, processing system, processing method, and program |
| CN103620512B (en) * | 2011-04-15 | 2016-11-23 | Abb技术有限公司 | Dynamic evaluation system for high-voltage electrical apparatus parts |
| WO2012142353A1 (en) * | 2011-04-15 | 2012-10-18 | Abb Technology Ag | Monitoring process control system |
| US9927788B2 (en) | 2011-05-19 | 2018-03-27 | Fisher-Rosemount Systems, Inc. | Software lockout coordination between a process control system and an asset management system |
| AU2016265997B2 (en) * | 2011-05-23 | 2018-09-27 | Honeywell International Inc. | Large-scale comprehensive real-time monitoring framework for industrial facilities |
| US9310790B2 (en) * | 2011-05-23 | 2016-04-12 | Honeywell International Inc. | Large-scale comprehensive real-time monitoring framework for industrial facilities |
| US9092124B2 (en) | 2012-07-19 | 2015-07-28 | Saudi Arabian Oil Company | System and method for effective plant performance monitoring in gas oil separation plant (GOSP) |
| TWI580771B (en) * | 2012-07-25 | 2017-05-01 | 奈寇公司 | Design development and implementation of analyzer based control system and algorithm |
| US10678225B2 (en) | 2013-03-04 | 2020-06-09 | Fisher-Rosemount Systems, Inc. | Data analytic services for distributed industrial performance monitoring |
| US9558220B2 (en) | 2013-03-04 | 2017-01-31 | Fisher-Rosemount Systems, Inc. | Big data in process control systems |
| US10649449B2 (en) | 2013-03-04 | 2020-05-12 | Fisher-Rosemount Systems, Inc. | Distributed industrial performance monitoring and analytics |
| US10282676B2 (en) | 2014-10-06 | 2019-05-07 | Fisher-Rosemount Systems, Inc. | Automatic signal processing-based learning in a process plant |
| US9665088B2 (en) | 2014-01-31 | 2017-05-30 | Fisher-Rosemount Systems, Inc. | Managing big data in process control systems |
| US10866952B2 (en) | 2013-03-04 | 2020-12-15 | Fisher-Rosemount Systems, Inc. | Source-independent queries in distributed industrial system |
| US10223327B2 (en) | 2013-03-14 | 2019-03-05 | Fisher-Rosemount Systems, Inc. | Collecting and delivering data to a big data machine in a process control system |
| US10909137B2 (en) | 2014-10-06 | 2021-02-02 | Fisher-Rosemount Systems, Inc. | Streaming data for analytics in process control systems |
| US9804588B2 (en) | 2014-03-14 | 2017-10-31 | Fisher-Rosemount Systems, Inc. | Determining associations and alignments of process elements and measurements in a process |
| US9823626B2 (en) | 2014-10-06 | 2017-11-21 | Fisher-Rosemount Systems, Inc. | Regional big data in process control systems |
| US10386827B2 (en) | 2013-03-04 | 2019-08-20 | Fisher-Rosemount Systems, Inc. | Distributed industrial performance monitoring and analytics platform |
| US9397836B2 (en) | 2014-08-11 | 2016-07-19 | Fisher-Rosemount Systems, Inc. | Securing devices to process control systems |
| US10649424B2 (en) | 2013-03-04 | 2020-05-12 | Fisher-Rosemount Systems, Inc. | Distributed industrial performance monitoring and analytics |
| CN107885494B (en) | 2013-03-15 | 2021-09-10 | 费希尔-罗斯蒙特系统公司 | Method and computer system for analyzing process control data |
| US9983575B2 (en) * | 2013-04-09 | 2018-05-29 | Fisher-Rosemount Systems, Inc. | Systems and methods to graphically display process control system information |
| US10013149B2 (en) | 2013-03-15 | 2018-07-03 | Fisher-Rosemount Systems, Inc. | Graphical process variable trend monitoring for a process control system |
| US10514668B2 (en) | 2013-03-15 | 2019-12-24 | Fisher-Rosemount Systems, Inc. | Graphical process variable trend monitoring in a process control system using a navigation pane |
| US10803636B2 (en) | 2013-03-15 | 2020-10-13 | Fisher-Rosemount Systems, Inc. | Graphical process variable trend monitoring, predictive analytics and fault detection in a process control system |
| US10649412B2 (en) | 2013-03-15 | 2020-05-12 | Fisher-Rosemount Systems, Inc. | Method and apparatus for seamless state transfer between user interface devices in a mobile control room |
| US10180681B2 (en) | 2013-03-15 | 2019-01-15 | Fisher-Rosemount Systems, Inc. | Graphical process variable trend monitoring with zoom features for use in a process control system |
| US20150066163A1 (en) * | 2013-08-28 | 2015-03-05 | Honeywell International Inc. | System and method for multi-domain structural analysis across applications in industrial control and automation system |
| US20160055434A1 (en) * | 2014-08-21 | 2016-02-25 | Lenovo Enterprise Solutions (Singapore) Pte. Ltd. | Dynamic risk assessment based product sampling |
| US10168691B2 (en) | 2014-10-06 | 2019-01-01 | Fisher-Rosemount Systems, Inc. | Data pipeline for process control system analytics |
| US10291732B2 (en) | 2015-09-17 | 2019-05-14 | Uptake Technologies, Inc. | Computer systems and methods for sharing asset-related information between data platforms over a network |
| US10481595B2 (en) | 2015-10-05 | 2019-11-19 | Fisher-Rosemount Systems, Inc. | Method and apparatus for assessing the collective health of multiple process control systems |
| US10438144B2 (en) | 2015-10-05 | 2019-10-08 | Fisher-Rosemount Systems, Inc. | Method and apparatus for negating effects of continuous introduction of risk factors in determining the health of a process control system |
| US10503483B2 (en) | 2016-02-12 | 2019-12-10 | Fisher-Rosemount Systems, Inc. | Rule builder in a process control network |
| US20180284758A1 (en) | 2016-05-09 | 2018-10-04 | StrongForce IoT Portfolio 2016, LLC | Methods and systems for industrial internet of things data collection for equipment analysis in an upstream oil and gas environment |
| US11327475B2 (en) | 2016-05-09 | 2022-05-10 | Strong Force Iot Portfolio 2016, Llc | Methods and systems for intelligent collection and analysis of vehicle data |
| US11774944B2 (en) | 2016-05-09 | 2023-10-03 | Strong Force Iot Portfolio 2016, Llc | Methods and systems for the industrial internet of things |
| JP6648641B2 (en) | 2016-06-06 | 2020-02-14 | 株式会社Ihi | Distortion estimation device, diagnosis device, and distortion estimation method |
| US11237546B2 (en) | 2016-06-15 | 2022-02-01 | Strong Force loT Portfolio 2016, LLC | Method and system of modifying a data collection trajectory for vehicles |
| DE102017102992A1 (en) | 2017-02-15 | 2018-08-16 | Sig Technology Ag | A graph associated with a packaging facility |
| US10678224B2 (en) * | 2017-06-21 | 2020-06-09 | Fisher-Rosemount Systems, Inc. | Loop interface |
| US10921801B2 (en) | 2017-08-02 | 2021-02-16 | Strong Force loT Portfolio 2016, LLC | Data collection systems and methods for updating sensed parameter groups based on pattern recognition |
| WO2020263257A1 (en) * | 2019-06-27 | 2020-12-30 | Conocophillips Company | Managing assets by process variable mapping |
| US11953889B2 (en) * | 2020-05-08 | 2024-04-09 | Rockwell Automation Technologies, Inc. | Adapting data models for data communication to external platforms |
| US11928081B2 (en) * | 2021-06-30 | 2024-03-12 | Fischer Controls International Llc | Event logging for valves and other flow control devices |
| CN113568390B (en) * | 2021-09-22 | 2021-12-14 | 中国核动力研究设计院 | DCS (distributed control system) dynamic layered communication method and system based on multi-level processor |
Citations (11)
| Publication number | Priority date | Publication date | Assignee | Title |
|---|---|---|---|---|
| US5311562A (en) * | 1992-12-01 | 1994-05-10 | Westinghouse Electric Corp. | Plant maintenance with predictive diagnostics |
| JPH06331507A (en) * | 1993-05-21 | 1994-12-02 | Hitachi Ltd | Supervisory diagnostic method and system for plant and plant equipped therewith |
| JPH08261886A (en) * | 1995-03-22 | 1996-10-11 | Yokogawa Electric Corp | Equipment management system |
| JPH1039728A (en) * | 1996-07-19 | 1998-02-13 | Mitsubishi Electric Corp | Plant simulator |
| JPH10283224A (en) * | 1997-04-03 | 1998-10-23 | Yokogawa Electric Corp | State display device for device |
| JPH10320039A (en) * | 1997-05-22 | 1998-12-04 | Mitsubishi Electric Corp | Plant control system |
| JPH11231924A (en) * | 1998-02-10 | 1999-08-27 | Yaskawa Electric Corp | Command generating and monitoring device for different controllers |
| EP0965897A1 (en) * | 1998-06-17 | 1999-12-22 | Neles Controls Oy | Field device management system |
| WO2000042587A1 (en) * | 1999-01-09 | 2000-07-20 | Heat Timer Corporation | Electronic message delivery system utilizable in the monitoring of equipment and method of same |
| JP2000305620A (en) * | 1999-02-22 | 2000-11-02 | Fisher Rosemount Syst Inc | Diagnostic tool to be used for process control system |
| JP2001016662A (en) * | 1999-06-29 | 2001-01-19 | Digital Electronics Corp | Data collection system, data collection method, and recording medium recording program for data collection |
Family Cites Families (185)
| Publication number | Priority date | Publication date | Assignee | Title |
|---|---|---|---|---|
| US3096434A (en) | 1961-11-28 | 1963-07-02 | Daniel Orifice Fitting Company | Multiple integration flow computer |
| US3981836A (en) | 1964-10-29 | 1976-09-21 | Dan River Inc. | Yarn sizes, sizing treatments and resulting sized yarns |
| US3404264A (en) | 1965-07-19 | 1968-10-01 | American Meter Co | Telemetering system for determining rate of flow |
| US3701280A (en) | 1970-03-18 | 1972-10-31 | Daniel Ind Inc | Method and apparatus for determining the supercompressibility factor of natural gas |
| US4058275A (en) | 1970-12-28 | 1977-11-15 | The United States Of America As Represented By The Secretary Of The Navy | Low frequency passive guidance method |
| US3705516A (en) | 1971-09-30 | 1972-12-12 | Northrop Corp | Method and apparatus for testing the condition of a machine |
| USRE29383E (en) | 1974-01-10 | 1977-09-06 | Process Systems, Inc. | Digital fluid flow rate measurement or control system |
| US4099413A (en) | 1976-06-25 | 1978-07-11 | Yokogawa Electric Works, Ltd. | Thermal noise thermometer |
| JPS55138616A (en) | 1979-04-16 | 1980-10-29 | Kansai Electric Power Co Inc:The | Bearing fault discriminating device |
| JPS56130634A (en) | 1980-03-19 | 1981-10-13 | Hitachi Ltd | Method and device for monitoring oscillation of rotary machine |
| EP0055297A4 (en) | 1980-03-26 | 1982-07-13 | Kawasaki Steel Co | Monitoring device for a rotary machine. |
| US4322976A (en) | 1980-04-04 | 1982-04-06 | Ird Mechanalysis, Inc. | Mechanical vibration analyzer |
| US4337516A (en) | 1980-06-26 | 1982-06-29 | United Technologies Corporation | Sensor fault detection by activity monitoring |
| US4408285A (en) | 1981-02-02 | 1983-10-04 | Ird Mechanalysis, Inc. | Vibration analyzing apparatus and method |
| US4607325A (en) | 1981-10-21 | 1986-08-19 | Honeywell Inc. | Discontinuous optimization procedure modelling the run-idle status of plural process components |
| US4527271A (en) | 1982-08-17 | 1985-07-02 | The Foxboro Company | Process control system with improved fault isolation |
| US5399494A (en) * | 1983-03-04 | 1995-03-21 | The University Of Maryland System | Vibrio cholerae strain CVD103Hgr, method of making same, and vaccines derived therefrom |
| US4644749A (en) | 1983-03-21 | 1987-02-24 | Sperry Corporation | Phase locked looped controller for motordrivers |
| JPH0619666B2 (en) | 1983-06-30 | 1994-03-16 | 富士通株式会社 | Failure diagnosis processing method |
| US4530234A (en) | 1983-06-30 | 1985-07-23 | Mobil Oil Corporation | Method and system for measuring properties of fluids |
| JPS6021423A (en) | 1983-07-15 | 1985-02-02 | Mitsubishi Electric Corp | Vibration monitoring apparatus |
| US4644478A (en) | 1983-09-13 | 1987-02-17 | International Business Machines Corp. | Monitoring and alarm system for custom applications |
| US4707796A (en) | 1983-10-19 | 1987-11-17 | Calabro Salvatore R | Reliability and maintainability indicator |
| US4734873A (en) | 1984-02-02 | 1988-03-29 | Honeywell Inc. | Method of digital process variable transmitter calibration and a process variable transmitter system utilizing the same |
| US4649515A (en) | 1984-04-30 | 1987-03-10 | Westinghouse Electric Corp. | Methods and apparatus for system fault diagnosis and control |
| US4517468A (en) | 1984-04-30 | 1985-05-14 | Westinghouse Electric Corp. | Diagnostic system and method |
| US4763243A (en) | 1984-06-21 | 1988-08-09 | Honeywell Bull Inc. | Resilient bus system |
| US4642782A (en) | 1984-07-31 | 1987-02-10 | Westinghouse Electric Corp. | Rule based diagnostic system with dynamic alteration capability |
| US4657179A (en) | 1984-12-26 | 1987-04-14 | Honeywell Inc. | Distributed environmental/load control system |
| JPH0734162B2 (en) | 1985-02-06 | 1995-04-12 | 株式会社日立製作所 | Analogical control method |
| DE3515061A1 (en) | 1985-04-26 | 1986-10-30 | Fried. Krupp Gmbh, 4300 Essen | METHOD AND DEVICE FOR MONITORING MACHINE PARTS |
| US5179540A (en) | 1985-11-08 | 1993-01-12 | Harris Corporation | Programmable chip enable logic function |
| JPS62161037A (en) | 1986-01-09 | 1987-07-17 | Nippon Denso Co Ltd | Synthetic diagnostic apparatus mounted on vehicle |
| US4922412A (en) | 1986-10-09 | 1990-05-01 | The Babcock & Wilcox Company | Apparatus and method using adaptive gain scheduling |
| US4908746A (en) * | 1986-10-15 | 1990-03-13 | United States Data Corporation | Industrial control system |
| US5005142A (en) | 1987-01-30 | 1991-04-02 | Westinghouse Electric Corp. | Smart sensor system for diagnostic monitoring |
| US4885707A (en) | 1987-02-19 | 1989-12-05 | Dli Corporation | Vibration data collecting and processing apparatus and method |
| US5043863A (en) | 1987-03-30 | 1991-08-27 | The Foxboro Company | Multivariable adaptive feedforward controller |
| EP0308455B1 (en) | 1987-04-02 | 1993-01-27 | Eftag Entstaubungs- Und Fördertechnik Ag | Circuit arrangement for evaluating a signal produced by a semiconductor sensor |
| US4819233A (en) | 1987-04-08 | 1989-04-04 | Westinghouse Electric Corp. | Verification of computer software |
| US4885694A (en) | 1987-04-29 | 1989-12-05 | Honeywell Inc. | Automated building control design system |
| US4873655A (en) | 1987-08-21 | 1989-10-10 | Board Of Regents, The University Of Texas System | Sensor conditioning method and apparatus |
| US5006992A (en) | 1987-09-30 | 1991-04-09 | Du Pont De Nemours And Company | Process control system with reconfigurable expert rules and control modules |
| US4907167A (en) | 1987-09-30 | 1990-03-06 | E. I. Du Pont De Nemours And Company | Process control system with action logging |
| US4965742A (en) | 1987-09-30 | 1990-10-23 | E. I. Du Pont De Nemours And Company | Process control system with on-line reconfigurable modules |
| US4910691A (en) | 1987-09-30 | 1990-03-20 | E.I. Du Pont De Nemours & Co. | Process control system with multiple module sequence options |
| US4831564A (en) | 1987-10-22 | 1989-05-16 | Suga Test Instruments Co., Ltd. | Apparatus for estimating and displaying remainder of lifetime of xenon lamps |
| US4942514A (en) | 1987-11-17 | 1990-07-17 | Hitachi, Ltd. | Process monitoring and control system and method of process monitoring and control |
| US5274572A (en) | 1987-12-02 | 1993-12-28 | Schlumberger Technology Corporation | Method and apparatus for knowledge-based signal monitoring and analysis |
| US5193143A (en) | 1988-01-12 | 1993-03-09 | Honeywell Inc. | Problem state monitoring |
| US4924418A (en) | 1988-02-10 | 1990-05-08 | Dickey-John Corporation | Universal monitor |
| JPH0774961B2 (en) | 1988-04-07 | 1995-08-09 | 株式会社日立製作所 | Auto tuning PID controller |
| US5251151A (en) | 1988-05-27 | 1993-10-05 | Research Foundation Of State Univ. Of N.Y. | Method and apparatus for diagnosing the state of a machine |
| US4980844A (en) | 1988-05-27 | 1990-12-25 | Victor Demjanenko | Method and apparatus for diagnosing the state of a machine |
| US5050095A (en) | 1988-05-31 | 1991-09-17 | Honeywell Inc. | Neural network auto-associative memory with two rules for varying the weights |
| US4956793A (en) | 1988-06-24 | 1990-09-11 | Honeywell Inc. | Method and apparatus for measuring the density of fluids |
| US4944035A (en) | 1988-06-24 | 1990-07-24 | Honeywell Inc. | Measurement of thermal conductivity and specific heat |
| US4964125A (en) | 1988-08-19 | 1990-10-16 | Hughes Aircraft Company | Method and apparatus for diagnosing faults |
| US5197328A (en) | 1988-08-25 | 1993-03-30 | Fisher Controls International, Inc. | Diagnostic apparatus and method for fluid control valves |
| US5008810A (en) | 1988-09-29 | 1991-04-16 | Process Modeling Investment Corp. | System for displaying different subsets of screen views, entering different amount of information, and determining correctness of input dependent upon current user input |
| US5099436A (en) | 1988-11-03 | 1992-03-24 | Allied-Signal Inc. | Methods and apparatus for performing system fault diagnosis |
| EP0369489A3 (en) | 1988-11-18 | 1991-11-27 | Omron Corporation | Sensor controller system |
| EP0375282B1 (en) * | 1988-12-20 | 1996-04-17 | Nippon Steel Corporation | Blast furnace operation management method and apparatus |
| JP2714091B2 (en) | 1989-01-09 | 1998-02-16 | 株式会社日立製作所 | Field instrument |
| US5098197A (en) | 1989-01-30 | 1992-03-24 | The United States Of America As Represented By The United States Department Of Energy | Optical Johnson noise thermometry |
| US5081598A (en) | 1989-02-21 | 1992-01-14 | Westinghouse Electric Corp. | Method for associating text in automatic diagnostic system to produce recommended actions automatically |
| US5140530A (en) | 1989-03-28 | 1992-08-18 | Honeywell Inc. | Genetic algorithm synthesis of neural networks |
| US5070458A (en) | 1989-03-31 | 1991-12-03 | Honeywell Inc. | Method of analyzing and predicting both airplane and engine performance characteristics |
| US5390287A (en) * | 1989-04-26 | 1995-02-14 | Obata; Takashi | Deduction inference system for solving complex propositional logic problems in response to signals from a plurality of system sensors |
| US5400246A (en) * | 1989-05-09 | 1995-03-21 | Ansan Industries, Ltd. | Peripheral data acquisition, monitor, and adaptive control system via personal computer |
| US5089984A (en) | 1989-05-15 | 1992-02-18 | Allen-Bradley Company, Inc. | Adaptive alarm controller changes multiple inputs to industrial controller in order for state word to conform with stored state word |
| US4934196A (en) | 1989-06-02 | 1990-06-19 | Micro Motion, Inc. | Coriolis mass flow rate meter having a substantially increased noise immunity |
| US5293585A (en) | 1989-08-31 | 1994-03-08 | Kabushiki Kaisha Toshiba | Industrial expert system |
| US5015934A (en) | 1989-09-25 | 1991-05-14 | Honeywell Inc. | Apparatus and method for minimizing limit cycle using complementary filtering techniques |
| JP2656637B2 (en) * | 1989-11-22 | 1997-09-24 | 株式会社日立製作所 | Process control system and power plant process control system |
| JPH03166601A (en) | 1989-11-27 | 1991-07-18 | Hitachi Ltd | Symbolizing device and process controller and control supporting device using the symbolizing device |
| CA2031765C (en) * | 1989-12-08 | 1996-02-20 | Masahide Nomura | Method and system for performing control conforming with characteristics of controlled system |
| US5187674A (en) | 1989-12-28 | 1993-02-16 | Honeywell Inc. | Versatile, overpressure proof, absolute pressure sensor |
| US5111531A (en) | 1990-01-08 | 1992-05-05 | Automation Technology, Inc. | Process control using neural network |
| US5089978A (en) | 1990-02-09 | 1992-02-18 | Westinghouse Electric Corp. | Automatic plant state diagnosis system including a display selection system for selecting displays responsive to the diagnosis |
| US5235527A (en) | 1990-02-09 | 1993-08-10 | Toyota Jidosha Kabushiki Kaisha | Method for diagnosing abnormality of sensor |
| US5134574A (en) | 1990-02-27 | 1992-07-28 | The Foxboro Company | Performance control apparatus and method in a processing plant |
| US5122976A (en) | 1990-03-12 | 1992-06-16 | Westinghouse Electric Corp. | Method and apparatus for remotely controlling sensor processing algorithms to expert sensor diagnoses |
| US5018215A (en) | 1990-03-23 | 1991-05-21 | Honeywell Inc. | Knowledge and model based adaptive signal processor |
| US5053815A (en) | 1990-04-09 | 1991-10-01 | Eastman Kodak Company | Reproduction apparatus having real time statistical process control |
| DE69122313T2 (en) | 1990-06-21 | 1997-03-20 | Honeywell Inc | Adaptive control based on a variable horizon with means for minimizing operating costs |
| US5282261A (en) | 1990-08-03 | 1994-01-25 | E. I. Du Pont De Nemours And Co., Inc. | Neural network process measurement and control |
| US5224203A (en) | 1990-08-03 | 1993-06-29 | E. I. Du Pont De Nemours & Co., Inc. | On-line process control neural network using data pointers |
| US5197114A (en) | 1990-08-03 | 1993-03-23 | E. I. Du Pont De Nemours & Co., Inc. | Computer neural network regulatory process control system and method |
| US5212765A (en) | 1990-08-03 | 1993-05-18 | E. I. Du Pont De Nemours & Co., Inc. | On-line training neural network system for process control |
| US5121467A (en) | 1990-08-03 | 1992-06-09 | E.I. Du Pont De Nemours & Co., Inc. | Neural network/expert system process control system and method |
| US5167009A (en) | 1990-08-03 | 1992-11-24 | E. I. Du Pont De Nemours & Co. (Inc.) | On-line process control neural network using data pointers |
| US5142612A (en) | 1990-08-03 | 1992-08-25 | E. I. Du Pont De Nemours & Co. (Inc.) | Computer neural network supervisory process control system and method |
| JP3127454B2 (en) | 1990-08-08 | 2001-01-22 | ソニー株式会社 | Etching method of silicon-based material to be etched |
| US5175678A (en) | 1990-08-15 | 1992-12-29 | Elsag International B.V. | Method and procedure for neural control of dynamic processes |
| US5094107A (en) | 1990-08-21 | 1992-03-10 | The Minster Machine Company | Press vibration severity/reliability monitoring system and method |
| US5130936A (en) | 1990-09-14 | 1992-07-14 | Arinc Research Corporation | Method and apparatus for diagnostic testing including a neural network for determining testing sufficiency |
| US5200958A (en) | 1990-09-28 | 1993-04-06 | Xerox Corporation | Method and apparatus for recording and diagnosing faults in an electronic reprographic printing system |
| US5210704A (en) | 1990-10-02 | 1993-05-11 | Technology International Incorporated | System for prognosis and diagnostics of failure and wearout monitoring and for prediction of life expectancy of helicopter gearboxes and other rotating equipment |
| US5265031A (en) | 1990-11-26 | 1993-11-23 | Praxair Technology, Inc. | Diagnostic gas monitoring process utilizing an expert system |
| US5214582C1 (en) | 1991-01-30 | 2001-06-26 | Edge Diagnostic Systems | Interactive diagnostic system for an automobile vehicle and method |
| EP0570505B1 (en) * | 1991-02-05 | 1999-03-31 | Storage Technology Corporation | Knowledge based machine initiated maintenance system and method |
| US5291190A (en) | 1991-03-28 | 1994-03-01 | Combustion Engineering, Inc. | Operator interface for plant component control system |
| US5161013A (en) | 1991-04-08 | 1992-11-03 | Honeywell Inc. | Data projection system with compensation for nonplanar screen |
| US5317520A (en) * | 1991-07-01 | 1994-05-31 | Moore Industries International Inc. | Computerized remote resistance measurement system with fault detection |
| JP2658633B2 (en) * | 1991-07-10 | 1997-09-30 | 三菱電機株式会社 | Communication device |
| US5414645A (en) * | 1991-10-25 | 1995-05-09 | Mazda Motor Corporation | Method of fault diagnosis in an apparatus having sensors |
| DE69210041T2 (en) * | 1991-12-13 | 1996-10-31 | Honeywell Inc | DESIGN OF PIEZORESISTIVE PRESSURE SENSOR MADE FROM SILICON |
| US5282131A (en) | 1992-01-21 | 1994-01-25 | Brown And Root Industrial Services, Inc. | Control system for controlling a pulp washing system using a neural network controller |
| JP3100757B2 (en) * | 1992-06-02 | 2000-10-23 | 三菱電機株式会社 | Monitoring and diagnostic equipment |
| FR2692037B1 (en) * | 1992-06-03 | 1997-08-08 | Thomson Csf | DIAGNOSTIC PROCESS OF AN EVOLVING PROCESS. |
| CA2097558C (en) * | 1992-06-16 | 2001-08-21 | William B. Kilgore | Directly connected display of process control system in an open systems windows environment |
| US5315521A (en) * | 1992-07-29 | 1994-05-24 | Praxair Technology, Inc. | Chemical process optimization method |
| US5384699A (en) * | 1992-08-24 | 1995-01-24 | Associated Universities, Inc. | Preventive maintenance system for the photomultiplier detector blocks of pet scanners |
| US5228780A (en) | 1992-10-30 | 1993-07-20 | Martin Marietta Energy Systems, Inc. | Dual-mode self-validating resistance/Johnson noise thermometer system |
| CA2149913A1 (en) * | 1992-11-24 | 1994-06-09 | James David Keeler | Method and apparatus for operating a neural network with missing and/or incomplete data |
| EP0674780B1 (en) * | 1992-12-14 | 1998-10-21 | Honeywell Inc. | A flexible method for building a recipe in a process control system |
| US5394341A (en) * | 1993-03-25 | 1995-02-28 | Ford Motor Company | Apparatus for detecting the failure of a sensor |
| CA2118885C (en) * | 1993-04-29 | 2005-05-24 | Conrad K. Teran | Process control system |
| US5917405A (en) * | 1993-06-08 | 1999-06-29 | Joao; Raymond Anthony | Control apparatus and methods for vehicles |
| US5386373A (en) * | 1993-08-05 | 1995-01-31 | Pavilion Technologies, Inc. | Virtual continuous emission monitoring system with sensor validation |
| EP0643345B1 (en) * | 1993-09-02 | 1998-10-21 | Siemens Aktiengesellschaft | Data processing device for the monitoring of the operating states of a technical plant |
| US5404064A (en) * | 1993-09-02 | 1995-04-04 | The United States Of America As Represented By The Secretary Of The Navy | Low-frequency electrostrictive ceramic plate voltage sensor |
| US5489831A (en) * | 1993-09-16 | 1996-02-06 | Honeywell Inc. | Pulse width modulating motor controller |
| US5631825A (en) * | 1993-09-29 | 1997-05-20 | Dow Benelux N.V. | Operator station for manufacturing process control system |
| US5602761A (en) * | 1993-12-30 | 1997-02-11 | Caterpillar Inc. | Machine performance monitoring and fault classification using an exponentially weighted moving average scheme |
| US5533413A (en) * | 1994-06-30 | 1996-07-09 | Yokogawa Electric Corporation | Equipment diagnosis system |
| US5500941A (en) * | 1994-07-06 | 1996-03-19 | Ericsson, S.A. | Optimum functional test method to determine the quality of a software system embedded in a large electronic system |
| US5483387A (en) * | 1994-07-22 | 1996-01-09 | Honeywell, Inc. | High pass optical filter |
| US5511442A (en) * | 1994-09-02 | 1996-04-30 | Atoma International, Inc. | Control system with bowden wire assembly end clip |
| US5602757A (en) * | 1994-10-20 | 1997-02-11 | Ingersoll-Rand Company | Vibration monitoring system |
| US5610339A (en) * | 1994-10-20 | 1997-03-11 | Ingersoll-Rand Company | Method for collecting machine vibration data |
| US5623598A (en) * | 1994-11-22 | 1997-04-22 | Hewlett-Packard Company | Method for identifying ways to improve performance in computer data storage systems |
| EP0717344B1 (en) * | 1994-12-13 | 2001-10-31 | Microsoft Corporation | Taskbar with start menu |
| US5600148A (en) * | 1994-12-30 | 1997-02-04 | Honeywell Inc. | Low power infrared scene projector array and method of manufacture |
| JPH08285277A (en) * | 1995-04-18 | 1996-11-01 | Tokyo Gas Co Ltd | Repair work supporting system for gas appliance |
| US6197480B1 (en) * | 1995-06-12 | 2001-03-06 | Toray Industries, Inc. | Photosensitive paste, a plasma display, and a method for the production thereof |
| US5940290A (en) * | 1995-12-06 | 1999-08-17 | Honeywell Inc. | Method of predictive maintenance of a process control system having fluid movement |
| US5691895A (en) * | 1995-12-18 | 1997-11-25 | International Business Machines Corporation | Mechanism and architecture for manufacturing control and optimization |
| JP3406760B2 (en) * | 1996-01-26 | 2003-05-12 | 株式会社東芝 | Monitoring and control equipment |
| US6094600A (en) * | 1996-02-06 | 2000-07-25 | Fisher-Rosemount Systems, Inc. | System and method for managing a transaction database of records of changes to field device configurations |
| FR2745271B1 (en) * | 1996-02-23 | 1998-04-30 | Oreal | PACKAGING ALLOWING THE STORAGE AND APPLICATION ON A SUPPORT OF A LIQUID OR PASTE PRODUCT, ESPECIALLY FOR MAKE-UP |
| US5855791A (en) * | 1996-02-29 | 1999-01-05 | Ashland Chemical Company | Performance-based control system |
| US5754451A (en) * | 1996-02-29 | 1998-05-19 | Raytheon Company | Preventative maintenance and diagonstic system |
| US6907383B2 (en) * | 1996-03-28 | 2005-06-14 | Rosemount Inc. | Flow diagnostic system |
| US6017143A (en) * | 1996-03-28 | 2000-01-25 | Rosemount Inc. | Device in a process system for detecting events |
| US5995916A (en) * | 1996-04-12 | 1999-11-30 | Fisher-Rosemount Systems, Inc. | Process control system for monitoring and displaying diagnostic information of multiple distributed devices |
| EP0825506B1 (en) * | 1996-08-20 | 2013-03-06 | Invensys Systems, Inc. | Methods and apparatus for remote process control |
| CN1214352C (en) * | 1996-09-04 | 2005-08-10 | 英特托拉斯技术公司 | Trusted infrastructure support system, method and techniques for secure electronic commerce, electronic transactions, commerce process control and automation distributted computing and rights manageme |
| US5970430A (en) * | 1996-10-04 | 1999-10-19 | Fisher Controls International, Inc. | Local device and process diagnostics in a process control network having distributed control functions |
| US5859885A (en) * | 1996-11-27 | 1999-01-12 | Westinghouse Electric Coporation | Information display system |
| US5905989A (en) * | 1996-11-27 | 1999-05-18 | Bently Nevada Corporation | Knowledge manager relying on a hierarchical default expert system: apparatus and method |
| JPH10161707A (en) * | 1996-11-29 | 1998-06-19 | Sukiyan Technol:Kk | Control method of fa system |
| US6035339A (en) * | 1997-03-13 | 2000-03-07 | At&T Corporation | Network information delivery system for delivering information based on end user terminal requirements |
| JPH10260866A (en) * | 1997-03-18 | 1998-09-29 | Matsushita Electric Ind Co Ltd | Electronic appliance product service system and electronic appliance product |
| DE19715503A1 (en) * | 1997-04-14 | 1998-10-15 | Siemens Ag | Integrated computer and communication system for the plant area |
| US5875420A (en) * | 1997-06-13 | 1999-02-23 | Csi Technology, Inc. | Determining machine operating conditioning based on severity of vibration spectra deviation from an acceptable state |
| JP2001512863A (en) * | 1997-07-29 | 2001-08-28 | ネットアドバンテイジ・コーポレイション | Method and system for processing e-commerce transactions |
| US6732191B1 (en) * | 1997-09-10 | 2004-05-04 | Schneider Automation Inc. | Web interface to an input/output device |
| US6014612A (en) * | 1997-10-02 | 2000-01-11 | Fisher Controls International, Inc. | Remote diagnostics in a process control network having distributed control functions |
| JP3744661B2 (en) * | 1997-10-17 | 2006-02-15 | 中村留精密工業株式会社 | NC machine tool failure diagnosis method and apparatus |
| US6185470B1 (en) * | 1997-11-07 | 2001-02-06 | Mcdonnell Douglas Corporation | Neural network predictive control method and system |
| US6690274B1 (en) * | 1998-05-01 | 2004-02-10 | Invensys Systems, Inc. | Alarm analysis tools method and apparatus |
| FI114745B (en) * | 1998-06-01 | 2004-12-15 | Metso Automation Oy | Control systems for field devices |
| US6571273B1 (en) * | 1998-07-13 | 2003-05-27 | Yokogawa Electric Corporation | Process control system |
| JP2000035888A (en) * | 1998-07-17 | 2000-02-02 | Yamaha Corp | Communication terminal and communication system |
| US6437691B1 (en) * | 1999-01-09 | 2002-08-20 | Heat-Timer Corporation | Electronic message delivery system utilizable in the monitoring of remote equipment and method of same |
| JP4160193B2 (en) * | 1999-01-18 | 2008-10-01 | 横河電機株式会社 | Remote maintenance system |
| US8044793B2 (en) * | 2001-03-01 | 2011-10-25 | Fisher-Rosemount Systems, Inc. | Integrated device alerts in a process control system |
| US7562135B2 (en) * | 2000-05-23 | 2009-07-14 | Fisher-Rosemount Systems, Inc. | Enhanced fieldbus device alerts in a process control system |
| US6633782B1 (en) * | 1999-02-22 | 2003-10-14 | Fisher-Rosemount Systems, Inc. | Diagnostic expert in a process control system |
| US6389331B1 (en) * | 1999-03-11 | 2002-05-14 | Johnson Controls Technology Company | Technique for monitoring performance of a facility management system |
| SG74705A1 (en) * | 1999-03-12 | 2001-06-19 | Sony Electronics Singapore Pte | A monitoring system for monitoring processing equipment |
| US6704689B1 (en) * | 2000-01-20 | 2004-03-09 | Camco International, Inc. | Complexity index methodology for the analysis of run life performance |
| US6421571B1 (en) * | 2000-02-29 | 2002-07-16 | Bently Nevada Corporation | Industrial plant asset management system: apparatus and method |
| US6507797B1 (en) * | 2000-05-30 | 2003-01-14 | General Electric Company | Direct current machine monitoring system and method |
| US6721609B1 (en) * | 2000-06-14 | 2004-04-13 | Fisher-Rosemount Systems, Inc. | Integrated optimal model predictive control in a process control system |
| US6567718B1 (en) * | 2000-07-28 | 2003-05-20 | Advanced Micro Devices, Inc. | Method and apparatus for monitoring consumable performance |
| US6628994B1 (en) * | 2000-08-31 | 2003-09-30 | Hewlett-Packard Development Company, L.P. | Method to obtain improved performance by automatic adjustment of computer system parameters |
| US7728838B2 (en) * | 2000-09-15 | 2010-06-01 | Invensys Systems, Inc. | Method and system for animating graphical user interface elements via a manufacturing/process control portal server |
| JP3689767B2 (en) * | 2000-09-22 | 2005-08-31 | 株式会社日立製作所 | Thermal power plant maintenance service provision method |
| US20020156542A1 (en) * | 2001-02-23 | 2002-10-24 | Nandi Hill K. | Methods, devices and systems for monitoring, controlling and optimizing processes |
| US7134831B2 (en) * | 2001-07-02 | 2006-11-14 | Transol Corporation | Low headroom telescoping bridge crane system |
| DE10138710A1 (en) * | 2001-08-07 | 2003-02-20 | Siemens Ag | Extension of the OPC protocol |
| US7146231B2 (en) * | 2002-10-22 | 2006-12-05 | Fisher-Rosemount Systems, Inc.. | Smart process modules and objects in process plants |
-
2002
- 2002-03-01 EP EP02723319A patent/EP1364263B1/en not_active Expired - Fee Related
- 2002-03-01 US US10/087,308 patent/US7346404B2/en not_active Expired - Lifetime
- 2002-03-01 DE DE60206884T patent/DE60206884T2/en not_active Expired - Lifetime
- 2002-03-01 WO PCT/US2002/006577 patent/WO2002071173A2/en active IP Right Grant
- 2002-03-01 JP JP2002570030A patent/JP2004533036A/en active Pending
- 2002-03-01 CN CNB028058542A patent/CN1324420C/en not_active Expired - Lifetime
-
2008
- 2008-08-06 JP JP2008203144A patent/JP2009020896A/en active Pending
Patent Citations (11)
| Publication number | Priority date | Publication date | Assignee | Title |
|---|---|---|---|---|
| US5311562A (en) * | 1992-12-01 | 1994-05-10 | Westinghouse Electric Corp. | Plant maintenance with predictive diagnostics |
| JPH06331507A (en) * | 1993-05-21 | 1994-12-02 | Hitachi Ltd | Supervisory diagnostic method and system for plant and plant equipped therewith |
| JPH08261886A (en) * | 1995-03-22 | 1996-10-11 | Yokogawa Electric Corp | Equipment management system |
| JPH1039728A (en) * | 1996-07-19 | 1998-02-13 | Mitsubishi Electric Corp | Plant simulator |
| JPH10283224A (en) * | 1997-04-03 | 1998-10-23 | Yokogawa Electric Corp | State display device for device |
| JPH10320039A (en) * | 1997-05-22 | 1998-12-04 | Mitsubishi Electric Corp | Plant control system |
| JPH11231924A (en) * | 1998-02-10 | 1999-08-27 | Yaskawa Electric Corp | Command generating and monitoring device for different controllers |
| EP0965897A1 (en) * | 1998-06-17 | 1999-12-22 | Neles Controls Oy | Field device management system |
| WO2000042587A1 (en) * | 1999-01-09 | 2000-07-20 | Heat Timer Corporation | Electronic message delivery system utilizable in the monitoring of equipment and method of same |
| JP2000305620A (en) * | 1999-02-22 | 2000-11-02 | Fisher Rosemount Syst Inc | Diagnostic tool to be used for process control system |
| JP2001016662A (en) * | 1999-06-29 | 2001-01-19 | Digital Electronics Corp | Data collection system, data collection method, and recording medium recording program for data collection |
Also Published As
| Publication number | Publication date |
|---|---|
| JP2009020896A (en) | 2009-01-29 |
| US20030028268A1 (en) | 2003-02-06 |
| WO2002071173A3 (en) | 2003-01-09 |
| WO2002071173A2 (en) | 2002-09-12 |
| CN1324420C (en) | 2007-07-04 |
| EP1364263B1 (en) | 2005-10-26 |
| CN1494671A (en) | 2004-05-05 |
| DE60206884D1 (en) | 2005-12-01 |
| US7346404B2 (en) | 2008-03-18 |
| DE60206884T2 (en) | 2006-07-27 |
| EP1364263A2 (en) | 2003-11-26 |
Similar Documents
| Publication | Publication Date | Title |
|---|---|---|
| EP1364263B1 (en) | Data sharing in a process plant | |
| EP1366400B1 (en) | Fiducial technique for estimating and using degradation levels in a process plant | |
| US6795798B2 (en) | Remote analysis of process control plant data | |
| JP4808359B2 (en) | Integration into process performance monitoring and process equipment monitoring and control | |
| JP5264828B2 (en) | How to generate integrated warnings in process plants | |
| US9201420B2 (en) | Method and apparatus for performing a function in a process plant using monitoring data with criticality evaluation data | |
| US20060229848A1 (en) | Method and apparatus for monitoring and performing corrective measures in a process plant using monitoring data with corrective measures data |
Legal Events
| Date | Code | Title | Description |
|---|---|---|---|
| A621 | Written request for application examination |
Free format text: JAPANESE INTERMEDIATE CODE: A621 Effective date: 20050203 |
|
| A131 | Notification of reasons for refusal |
Free format text: JAPANESE INTERMEDIATE CODE: A131 Effective date: 20070619 |
|
| A601 | Written request for extension of time |
Free format text: JAPANESE INTERMEDIATE CODE: A601 Effective date: 20070914 |
|
| A602 | Written permission of extension of time |
Free format text: JAPANESE INTERMEDIATE CODE: A602 Effective date: 20070925 |
|
| A521 | Written amendment |
Free format text: JAPANESE INTERMEDIATE CODE: A523 Effective date: 20071219 |
|
| A02 | Decision of refusal |
Free format text: JAPANESE INTERMEDIATE CODE: A02 Effective date: 20080415 |
|
| A601 | Written request for extension of time |
Free format text: JAPANESE INTERMEDIATE CODE: A601 Effective date: 20100614 |
|
| A602 | Written permission of extension of time |
Free format text: JAPANESE INTERMEDIATE CODE: A602 Effective date: 20100617 |
|
| A521 | Written amendment |
Free format text: JAPANESE INTERMEDIATE CODE: A523 Effective date: 20100916 |