JP4869062B2 - Remote data browsing system and method for browsing entity data - Google Patents
Remote data browsing system and method for browsing entity data Download PDFInfo
- Publication number
- JP4869062B2 JP4869062B2 JP2006507357A JP2006507357A JP4869062B2 JP 4869062 B2 JP4869062 B2 JP 4869062B2 JP 2006507357 A JP2006507357 A JP 2006507357A JP 2006507357 A JP2006507357 A JP 2006507357A JP 4869062 B2 JP4869062 B2 JP 4869062B2
- Authority
- JP
- Japan
- Prior art keywords
- data
- navigation tree
- remote
- entity data
- entity
- Prior art date
- Legal status (The legal status is an assumption and is not a legal conclusion. Google has not performed a legal analysis and makes no representation as to the accuracy of the status listed.)
- Expired - Lifetime
Links
- 238000000034 method Methods 0.000 title claims description 162
- 230000008569 process Effects 0.000 claims description 117
- 238000013480 data collection Methods 0.000 claims description 31
- 238000013474 audit trail Methods 0.000 claims description 23
- 230000004044 response Effects 0.000 claims description 8
- 230000000007 visual effect Effects 0.000 claims 10
- 241000276498 Pollachius virens Species 0.000 claims 1
- 230000000977 initiatory effect Effects 0.000 claims 1
- 241000196324 Embryophyta Species 0.000 description 129
- 238000012423 maintenance Methods 0.000 description 58
- 238000005457 optimization Methods 0.000 description 49
- 238000004891 communication Methods 0.000 description 48
- 238000013079 data visualisation Methods 0.000 description 41
- 230000010354 integration Effects 0.000 description 37
- 230000006870 function Effects 0.000 description 32
- 238000012544 monitoring process Methods 0.000 description 32
- 238000004886 process control Methods 0.000 description 30
- 238000013507 mapping Methods 0.000 description 14
- 238000012800 visualization Methods 0.000 description 14
- 230000000694 effects Effects 0.000 description 11
- 230000008520 organization Effects 0.000 description 11
- 238000012360 testing method Methods 0.000 description 9
- 238000010248 power generation Methods 0.000 description 8
- 238000009826 distribution Methods 0.000 description 7
- 238000011112 process operation Methods 0.000 description 7
- 238000004458 analytical method Methods 0.000 description 5
- 238000010586 diagram Methods 0.000 description 5
- 238000007726 management method Methods 0.000 description 5
- 238000013439 planning Methods 0.000 description 5
- 230000008859 change Effects 0.000 description 4
- 230000007246 mechanism Effects 0.000 description 4
- 238000003860 storage Methods 0.000 description 4
- 238000004519 manufacturing process Methods 0.000 description 3
- 239000002994 raw material Substances 0.000 description 3
- 101150001149 CSI1 gene Proteins 0.000 description 2
- 238000013528 artificial neural network Methods 0.000 description 2
- 238000012545 processing Methods 0.000 description 2
- 239000000047 product Substances 0.000 description 2
- 238000007792 addition Methods 0.000 description 1
- 230000009286 beneficial effect Effects 0.000 description 1
- 230000005540 biological transmission Effects 0.000 description 1
- 238000006243 chemical reaction Methods 0.000 description 1
- 238000012937 correction Methods 0.000 description 1
- 238000007405 data analysis Methods 0.000 description 1
- 238000007418 data mining Methods 0.000 description 1
- 230000003247 decreasing effect Effects 0.000 description 1
- 238000012217 deletion Methods 0.000 description 1
- 230000037430 deletion Effects 0.000 description 1
- 238000001514 detection method Methods 0.000 description 1
- 238000005516 engineering process Methods 0.000 description 1
- 239000000284 extract Substances 0.000 description 1
- 239000012530 fluid Substances 0.000 description 1
- 230000036541 health Effects 0.000 description 1
- 238000011065 in-situ storage Methods 0.000 description 1
- 239000000463 material Substances 0.000 description 1
- 238000005259 measurement Methods 0.000 description 1
- 230000003278 mimic effect Effects 0.000 description 1
- 238000012806 monitoring device Methods 0.000 description 1
- 238000013386 optimize process Methods 0.000 description 1
- 239000003208 petroleum Substances 0.000 description 1
- 238000004092 self-diagnosis Methods 0.000 description 1
- 239000000126 substance Substances 0.000 description 1
- 239000013589 supplement Substances 0.000 description 1
- 230000009897 systematic effect Effects 0.000 description 1
- 238000012795 verification Methods 0.000 description 1
Images


Classifications
-
- G—PHYSICS
- G05—CONTROLLING; REGULATING
- G05B—CONTROL OR REGULATING SYSTEMS IN GENERAL; FUNCTIONAL ELEMENTS OF SUCH SYSTEMS; MONITORING OR TESTING ARRANGEMENTS FOR SUCH SYSTEMS OR ELEMENTS
- G05B19/00—Programme-control systems
- G05B19/02—Programme-control systems electric
- G05B19/418—Total factory control, i.e. centrally controlling a plurality of machines, e.g. direct or distributed numerical control [DNC], flexible manufacturing systems [FMS], integrated manufacturing systems [IMS], computer integrated manufacturing [CIM]
-
- G—PHYSICS
- G05—CONTROLLING; REGULATING
- G05B—CONTROL OR REGULATING SYSTEMS IN GENERAL; FUNCTIONAL ELEMENTS OF SUCH SYSTEMS; MONITORING OR TESTING ARRANGEMENTS FOR SUCH SYSTEMS OR ELEMENTS
- G05B23/00—Testing or monitoring of control systems or parts thereof
- G05B23/02—Electric testing or monitoring
- G05B23/0205—Electric testing or monitoring by means of a monitoring system capable of detecting and responding to faults
- G05B23/0208—Electric testing or monitoring by means of a monitoring system capable of detecting and responding to faults characterized by the configuration of the monitoring system
- G05B23/0216—Human interface functionality, e.g. monitoring system providing help to the user in the selection of tests or in its configuration
-
- G—PHYSICS
- G05—CONTROLLING; REGULATING
- G05B—CONTROL OR REGULATING SYSTEMS IN GENERAL; FUNCTIONAL ELEMENTS OF SUCH SYSTEMS; MONITORING OR TESTING ARRANGEMENTS FOR SUCH SYSTEMS OR ELEMENTS
- G05B23/00—Testing or monitoring of control systems or parts thereof
- G05B23/02—Electric testing or monitoring
- G05B23/0205—Electric testing or monitoring by means of a monitoring system capable of detecting and responding to faults
- G05B23/0259—Electric testing or monitoring by means of a monitoring system capable of detecting and responding to faults characterized by the response to fault detection
- G05B23/0267—Fault communication, e.g. human machine interface [HMI]
-
- G—PHYSICS
- G05—CONTROLLING; REGULATING
- G05B—CONTROL OR REGULATING SYSTEMS IN GENERAL; FUNCTIONAL ELEMENTS OF SUCH SYSTEMS; MONITORING OR TESTING ARRANGEMENTS FOR SUCH SYSTEMS OR ELEMENTS
- G05B2219/00—Program-control systems
- G05B2219/30—Nc systems
- G05B2219/31—From computer integrated manufacturing till monitoring
- G05B2219/31334—Database with devices, configuration, of plant
-
- G—PHYSICS
- G05—CONTROLLING; REGULATING
- G05B—CONTROL OR REGULATING SYSTEMS IN GENERAL; FUNCTIONAL ELEMENTS OF SUCH SYSTEMS; MONITORING OR TESTING ARRANGEMENTS FOR SUCH SYSTEMS OR ELEMENTS
- G05B2219/00—Program-control systems
- G05B2219/30—Nc systems
- G05B2219/36—Nc in input of data, input key till input tape
- G05B2219/36121—Tree oriented menu, go to root, scroll up down, select mode
-
- Y—GENERAL TAGGING OF NEW TECHNOLOGICAL DEVELOPMENTS; GENERAL TAGGING OF CROSS-SECTIONAL TECHNOLOGIES SPANNING OVER SEVERAL SECTIONS OF THE IPC; TECHNICAL SUBJECTS COVERED BY FORMER USPC CROSS-REFERENCE ART COLLECTIONS [XRACs] AND DIGESTS
- Y02—TECHNOLOGIES OR APPLICATIONS FOR MITIGATION OR ADAPTATION AGAINST CLIMATE CHANGE
- Y02P—CLIMATE CHANGE MITIGATION TECHNOLOGIES IN THE PRODUCTION OR PROCESSING OF GOODS
- Y02P90/00—Enabling technologies with a potential contribution to greenhouse gas [GHG] emissions mitigation
- Y02P90/02—Total factory control, e.g. smart factories, flexible manufacturing systems [FMS] or integrated manufacturing systems [IMS]
Description
本発明は、一般的にプロセスプラントの保全アプリケーション、制御アプリケーション、および閲覧アプリケーションに関するものであり、さらに詳細にいえば、プロセスプラント内の一または複数のデータ供給源に関連するデータを収集するために用いられる資産データシステムに格納されたまたは関連づけされた情報の遠隔可視化に関するものである。 The present invention relates generally to process plant maintenance, control, and browsing applications, and more particularly, to collect data relating to one or more data sources within a process plant. It relates to remote visualization of information stored or associated with the asset data system used.
本出願は、2003年3月21日に出願された、表題が「プロセスプラント用の統合型資産データシステム内におけるデータの可視化(Data Visualization Within an Integrated Asset Data System for a Process Plant)」という米国特許出願第10/394,683号の一部継続出願であり、その開示内容は、本明細書においてこれらを参照することにより明確に援用するものとする。
This application is a U.S. patent filed on March 21, 2003, titled "Data Visualization With An Integrated Data System for a Process Plant". This is a continuation-in-part of
化学産業、石油産業、または他の産業において利用されるようなプロセスプラントは、アナログバス、デジタルバス、またはアナログ/デジタルを組み合わせたバスを介して、少なくとも一つのホストワークステーションもしくはオペレータワークステーションと、フィールドデバイスの如き一または複数のプロセス制御・計装デバイスとに通信可能に接続されている一または複数の集中型もしくは非集中型のプロセスコントローラを備えているのが普通である。フィールドデバイスは、たとえば、バルブ、バルブポジショナ、スイッチ、トランスミッタ、およびセンサ(たとえば、温度センサ、圧力センサ、および流量センサ)などであってもよいが、流体流量の増減およびプロセスパラメータの測定の如きプロセス内の機能を実行する。プロセスコントローラは、フィールドデバイスにより作成されるかまたはフィールドデバイスに関連するプロセス測定値もしくはプロセス変数および/またはこれらのフィールドデバイスに関連する他の情報を表す信号を受信し、この情報を利用して制御ルーチンを実行し、次いで、制御信号を生成する。この制御信号は、プロセスの動作を制御すべく、上述のバスのうちの一または複数のバスを通じてフィールドデバイスに送信される。通常、これらのフィールドデバイスおよびコントローラからの情報は、オペレータワークステーションにより実行される一または複数のアプリケーションによる利用が可能となっており、これにより、オペレータは、プロセスの現在の状況の閲覧、プロセス動作の修正などの如きプロセスに対する所望の操作を実行することができる。 A process plant, such as used in the chemical, petroleum, or other industries, has at least one host workstation or operator workstation via an analog bus, a digital bus, or a combined analog / digital bus, It is common to have one or more centralized or non-centralized process controllers communicatively connected to one or more process control and instrumentation devices such as field devices. Field devices may be, for example, valves, valve positioners, switches, transmitters, and sensors (eg, temperature sensors, pressure sensors, and flow sensors), but processes such as increasing and decreasing fluid flow rates and measuring process parameters. Perform the functions in The process controller receives signals representing process measurements or process variables created by or associated with field devices and / or other information associated with these field devices and uses this information to control A routine is executed and then a control signal is generated. This control signal is sent to the field device through one or more of the buses described above to control the operation of the process. Typically, information from these field devices and controllers is made available by one or more applications executed by an operator workstation, which allows the operator to view the current status of the process, process operation Desired operations on the process, such as corrections, can be performed.
通常のプロセスプラントは、一または複数のプロセスコントローラに接続されるバルブ、トランスミッタ、センサなどの如きプロセス制御・計装デバイスを多く備えており、これらのデバイスを制御するために、プロセスコントローラは、プロセスの動作中にソフトウェアを実行する。しかしながらこれらの他にも、プロセス動作に必要なまたはプロセス動作に関連する支援デバイスは多く存在する。たとえば、これら追加のデバイスとしては、電力供給装置、電力発生・分配装置、タービンの如き回転装置などが挙げられる。これらのデバイスは、通常、プラント内の複数の場所に設置されている。これらの追加の装置は、プロセス変数を作成または使用しなければならないというわけでもないし、またほとんどの場合、プロセスオペレーションを実行するためにプロセスコントローラによって制御されたりプロセスコントローラに対して接続されたりすることもない。にもかかわらず、これらの装置は、プロセスの適切な運転にとって重要かつ必要なものである。 A typical process plant is equipped with many process control and instrumentation devices such as valves, transmitters, sensors, etc. connected to one or more process controllers. Run the software during the operation. However, besides these, there are many assistive devices that are necessary for or related to the process operation. For example, these additional devices include a power supply device, a power generation / distribution device, and a rotating device such as a turbine. These devices are usually installed at a plurality of locations in the plant. These additional devices do not require process variables to be created or used, and in most cases are controlled by or connected to the process controller to perform process operations. Nor. Nevertheless, these devices are important and necessary for the proper operation of the process.
したがって、ほとんどのプロセスプラント、とくにスマートフィールドデバイスを利用するプロセスプラントには、これらのデバイスがプロセス制御・計装デバイスであるかまたは他のタイプのデバイスであるかに関係なく、プラント内でこれらのデバイスの監視および保全を補助するために用いられるアプリケーションが備えられている。たとえば、エマソンプロセスマネージメント社(Emerson Process Management)により販売されている資産管理ソリューション(AMS)アプリケーションを用いると、フィールドデバイスとの通信およびフィールドデバイスに関連するデータの格納が可能となり、これにより、これらのフィールドデバイスの動作状態の確認および追跡が可能となる。このようなシステムの一例が、「フィールドデバイス管理システムにおいて用いられる統合型通信ネットワーク(Integrated Communication Network for use in a Field Device Management System)」という表題の米国特許第5,960,214号に開示されている。場合によっては、AMSアプリケーションが、デバイスと通信してこのデバイス内のパラメータを変更する目的で、デバイスそれ自体に対して自己校正ルーチンまたは自己診断ルーチンの如きアプリケーションをデバイスに実行させる目的で、デバイスのステータスまたは調子に関する情報を取得する目的などで用いられることもある。これらの情報は、これらのデバイスを監視、保全するために保全要員により格納、利用されてもよい。同様に、回転装置、電力発生・供給デバイスの如き他のタイプのデバイスを監視するために用いられる他のタイプのアプリケーションもある。これらの他のアプリケーションは、通常保全要員による利用が可能となっており、プロセスプラント内のデバイスを監視、保全するために用いられる。しかしながら、ほとんどの場合、外部サービス組織が、プロセス性能および装置の監視に関連するサービスを実行しうる。これらの場合、外部サービス組織は、必要なデータを取得し、通常メーカ独自のアプリケーションを実行してデータを解析し、結果および提案をプロセスプラントの作業員に提供するだけである。 Therefore, most process plants, especially those that utilize smart field devices, have these within the plant, regardless of whether they are process control and instrumentation devices or other types of devices. Applications are provided that are used to assist in device monitoring and maintenance. For example, an asset management solution (AMS) application sold by Emerson Process Management enables communication with field devices and storage of data associated with field devices, which It is possible to check and track the operational status of the field device. An example of such a system is disclosed in US Pat. No. 5,960,214 entitled “Integrated Communication Network for Field Device Management System” used in field device management systems. In some cases, the AMS application communicates with the device to change the parameters in the device, and for the purpose of causing the device to execute an application, such as a self-calibration routine or a self-diagnosis routine, on the device itself. It may be used for the purpose of acquiring information on status or tone. These information may be stored and used by maintenance personnel to monitor and maintain these devices. Similarly, there are other types of applications that are used to monitor other types of devices such as rotating equipment, power generation and supply devices. These other applications are usually available to maintenance personnel and are used to monitor and maintain devices in the process plant. However, in most cases, an external service organization may perform services related to process performance and device monitoring. In these cases, the external service organization simply obtains the necessary data, typically runs the manufacturer's own application to analyze the data and provide the results and suggestions to the process plant workers.
さらに、ほとんどのプロセスプラントは、ビジネス機能または保全機能に関連するアプリケーションを実行する他のコンピュータを備えている。たとえば、一部のプラントは、プラントの原材料発注、部品またはデバイスの交換、売上高および必要生産量の予測に関連するアプリケーションなどを実行するコンピュータを備えている。 In addition, most process plants include other computers that execute applications related to business or maintenance functions. For example, some plants include computers that run applications related to plant raw material ordering, part or device replacement, sales and production forecasts, and the like.
通常、プロセス制御活動に関連する機能と、デバイス・装置の保全・監視活動に関連する機能と、ビジネス活動に関連する機能とは、これらの活動が行われる場所およびこれらの活動を通常実行する作業員の観点において分離されている。さらに、これらの異なる役割に関与する異なる人達は、これら異なる役割を果たすために異なるコンピュータで実行される異なるアプリケーションの如き異なるツールを利用することが一般的である。ほとんどの場合、これら異なるツールは、プロセス内の異なるデバイスと関連するまたはプロセス内の異なるデバイスから収集する異なるタイプのデータを収集または使用するようになっており、また、必要なデータを収集するために異なって設定されている。たとえば、プロセスの日毎の動作を通常監視し、このプロセス動作の品質と連続性とを担保することが主な責務であるプロセス制御オペレータは、プロセス内の設定値の設定・変更、プロセスループの調整、バッチオペレーションの如きプロセスオペレーションの計画などを行うことによりプロセスを運転しているのが一般的である。これらのプロセス制御オペレータは、プロセス制御システムにおいて、たとえば自動調整器、ループ解析器、ニューラルネットワークシステムなどを含む、プロセス制御システム内のプロセス制御問題を診断、訂正するために入手可能なツールを利用しうる。また、プロセス制御オペレータは、プロセス内で生成されるアラームを含む、プロセス動作に関する情報をオペレータへ提供する一または複数のプロセスコントローラを通じて、プロセスからプロセス変数情報を受信する。さらに、プロセスプラントの制御活動を最適化するために、プラント内にリアルタイムオプチマイザの如き制御オプチマイザを提供することが一般的である。このようなオプチマイザは、収益などの如き所望の最適化変数に対してプラントの運転を最適化するために入力値をどのように変更しうるかを予測するため、通常、複雑なプラントモデルを用いる。この情報は、標準的なユーザインターフェイスを通じてプロセス制御オペレータに提供されうるが、通常、プロセス制御オペレータは、制御の見地からプロセスプラントがどのように組み立てられて設定されているかという点に関するアプリケーション内の情報の閲覧およびアクセスに関心を有している。 Typically, functions related to process control activities, functions related to device / equipment maintenance and monitoring activities, and functions related to business activities are the places where these activities take place and the tasks that normally perform these activities. Are separated from the perspective of employees. Furthermore, different people involved in these different roles typically utilize different tools such as different applications running on different computers to perform these different roles. In most cases, these different tools are designed to collect or use different types of data that are associated with or collected from different devices in the process, and to collect the necessary data Are set differently. For example, the process control operator whose main responsibility is to monitor the daily operation of the process and to ensure the quality and continuity of the process operation, sets and changes the setting values in the process, adjusts the process loop In general, a process is operated by planning a process operation such as a batch operation. These process control operators use tools available in the process control system to diagnose and correct process control problems within the process control system, including, for example, automatic regulators, loop analyzers, neural network systems, etc. sell. The process control operator also receives process variable information from the process through one or more process controllers that provide information regarding process operation to the operator, including alarms generated within the process. In addition, it is common to provide a control optimizer, such as a real-time optimizer, in the plant to optimize process plant control activities. Such optimizers typically use complex plant models to predict how input values can be changed to optimize plant operation for a desired optimization variable such as revenue. This information can be provided to the process control operator through a standard user interface, but the process control operator typically has information in the application regarding how the process plant is assembled and configured from a control standpoint. Interested in browsing and accessing.
その一方で、プロセス内における実際の装置の効率的な動作を担保することと機能不良の装置の修理および交換とに対して主たる責務を有する保全要員は、保全インターフェイス、上述のAMSアプリケーションの如きツールのみならず、プロセス内のデバイスの動作ステータスに関する情報を提供する他の多くの診断ツールを利用する。また、保全要員は、プラントの一部を停止する必要がありうるような保全活動の計画を立てる。スマートフィールドデバイスと一般的に呼ばれる多くの新しいタイプのプロセスデバイスおよび装置の場合には、デバイス自体が検出・診断ツールを備えている。これらのツールにより、標準的保全インターフェイスを通じてデバイス動作の問題が自動的に検出され、これらの検出された問題が保全要員に自動的に報告されうる。たとえば、AMSソフトウェアは、保全要員にデバイスステータスおよび診断情報を報告することに加えて、デバイス内で何が発生しているかを保全要員が判断することを可能とするとともにデバイスにより提供されるデバイス情報にアクセスすることを可能とする通信ツールおよび他のツールを提供する。保全インターフェイスと保全要員とはプロセス制御オペレータから離れた位置に存在しているのが一般的であるが、必ずしもこれに限定されるわけではない。たとえば、プロセスプラントによっては、プロセス制御オペレータが保全要員の責務を実行することもあればこの逆もありうるし、または、これらの機能に責務のある異なる人員が同一のインターフェイスを使用する場合もある。それにもかかわらず、保全要員は、通常、プラント内で装置がどのように組み立てられているのかもしくは装置の所在確認をどのようにするのかを基にした情報またはプラント内の装置に関連する他の論理を基にした情報を、利用可能なアプリケーションから閲覧およびアクセスすることに関心を有している。通常、この編成は、制御用の編成とは異なる。 On the other hand, maintenance personnel who are primarily responsible for ensuring the efficient operation of the actual equipment in the process and repairing and replacing malfunctioning equipment are the maintenance interface, tools such as the AMS application described above. As well as utilizing many other diagnostic tools that provide information about the operational status of devices in the process. Maintenance personnel also plan maintenance activities that may require part of the plant to be shut down. In the case of many new types of process devices and apparatus commonly referred to as smart field devices, the devices themselves are equipped with detection and diagnostic tools. These tools can automatically detect problems with device operation through a standard maintenance interface and can automatically report these detected problems to maintenance personnel. For example, in addition to reporting device status and diagnostic information to maintenance personnel, the AMS software allows maintenance personnel to determine what is occurring in the device and device information provided by the device. Provide communication tools and other tools that allow access to The maintenance interface and maintenance personnel are generally located at a distance from the process control operator, but are not necessarily limited thereto. For example, depending on the process plant, a process control operator may perform maintenance personnel duties and vice versa, or different personnel responsible for these functions may use the same interface. Nonetheless, maintenance personnel are usually responsible for information based on how the equipment is assembled in the plant or how the equipment is located or other information related to equipment in the plant. He is interested in viewing and accessing logic-based information from available applications. This organization is usually different from the control organization.
さらに、一部のタスク、たとえば装置の監視、デバイスの動作試験、プラント運転が最適か否かの決定などは、外部のコンサルタントまたはサービス会社により実行される。このような外部のコンサルタントまたはサービス会社は、必要なデータを測定し、解析を行い、次いで、この解析の結果のみをプラント作業員に提出する。これらの場合、通常、データは、メーカ独自の方法で収集、格納される。これらのデータは、さらに異なる方法で編成される場合もある。というのは、データの編成は、そのデータを収集、生成、使用する個々のアプリケーションに合わせて調整されるからである。 In addition, some tasks, such as monitoring equipment, testing device operation, determining whether plant operation is optimal, are performed by an external consultant or service company. Such an external consultant or service company measures and analyzes the necessary data and then submits only the results of this analysis to the plant worker. In these cases, data is usually collected and stored by a manufacturer's own method. These data may be further organized in different ways. This is because the organization of the data is tailored to the individual application that collects, generates and uses the data.
上述の異なるアプリケーションの多くでは、そのアプリケーション内のまたはそのアプリケーションが利用可能なさまざまなデータまたは情報を編成し、そのアプリケーションのユーザがこれらのデータまたは情報を閲覧およびアクセスすることを可能とするためのナビゲーションツリーまたは他の同等の構造が用いられている。ほとんどの場合、これらのナビゲーションツリー構造は、Microsoft Outlook(登録商標)、Windows(登録商標)などで用いられているナビゲーションツリー構造と実質的に同等であって、ユーザがプラントの該当する領域、副領域などにアクセスするかまたはそれらの階層を次々と掘り下げていきアプリケーションを用いた機能を実行することを可能とするためにアプリケーション内に提供されている。いつもとはいわないまでもほとんどの場合、これらのアプリケーションは、S88標準規格により定められた命名法を用いてナビゲーションツリーを使用している。S88標準規格では、プロセスプラントは、高レベルエンティティから始まり、エンタープライズから、サイト、領域、プロセス、セル、ユニット、装置、モジュール、制御モジュールへと次から次に小さなエンティティに分類される。S88標準規格に基づいたナビゲーションツリー構造を用いるアプリケーションは、ナビゲーションツリー内にこれらの見出しの一部または全部を掲示することにより、ユーザがプロセスプラントに関連する情報にアクセスすることまたはプロセスプラントに関連する機能を実行することを可能としている。 Many of the different applications described above organize the various data or information within or available to the application and allow the user of the application to view and access the data or information. A navigation tree or other equivalent structure is used. In most cases, these navigation tree structures are substantially equivalent to the navigation tree structures used in Microsoft Outlook®, Windows®, etc., where the user can select the appropriate area, It is provided in the application in order to access a region or the like or to dig down those hierarchies one after another and execute a function using the application. In most, if not always, cases, these applications use a navigation tree using the nomenclature defined by the S88 standard. In the S88 standard, process plants are categorized into small entities starting with high-level entities, from enterprises to sites, regions, processes, cells, units, equipment, modules, and control modules. Applications using a navigation tree structure based on the S88 standard allow users to access information related to a process plant or to be related to a process plant by posting some or all of these headings in the navigation tree. It is possible to execute the function.
今日、プラント内で部品、補充品、原材料の注文または生産品、最適化変数などの選択の如き戦略的な企業意志決定において補佐をする社員のようなビジネスアプリケーションに対して責務を有する人達の如きユーザの一部から、上述のアプリケーションのうちの複数からのデータにアクセスし、プラント内のアプリケーションのうちのいずれかから提供される高いレベルからプラントの稼働の理解または閲覧をする必要性が出てきている。従来、このような人達は、異なるアプリケーションによりプラント内で生成された実際のデータにアクセスすることは余りなかったが、本明細書において参照することによりその開示内容を明確に援用するとともに表題が「プロセスプラントにおけるデータの共有化(Data Sharing in a Process Plant)」であるところの2002年3月1日に出願され、本明細書の譲受人に譲渡されている米国特許出願第10/087,308号には、中央データベースにおいてさまざまな異なるデータ供給源からのデータを組み合わせ、プロセスプラント内において、ビジネスパーソンのみならず個別のユーザおよびアプリケーションがそのデータをより汎用性のある形態で利用することができるようにするための方法が開示されている。 Today, such as those responsible for business applications such as employees who assist in strategic corporate decision making such as selecting parts, replenishments, raw material orders or products, optimization variables, etc. within the plant Some users need to access data from more than one of the above applications and understand or view plant operation from the high level provided by any of the applications in the plant. ing. Traditionally, these people have rarely accessed the actual data generated in the plant by different applications, but the disclosure is expressly incorporated by reference herein and the title is " No. 10 / 087,308, filed Mar. 1, 2002, which is “Data Sharing in a Process Plant” and assigned to the assignee of the present specification. Combines data from a variety of different data sources in a central database so that business users as well as individual users and applications can use the data in a more versatile form within the process plant A method for doing so is disclosed
しかしながら、上述のように、このデータを収集する異なるアプリケーションは、プラント内のデバイスまたは装置の通常一部に対して非常に異なる機能を実行するためにプロセスプラント内で用いるように設計されている。したがって、これらのアプリケーションは、収集・生成されたデータの編成・表示が僅かしか異ならない場合もあれば大きく異なる場合もあるように作成されている。したがって、これらのアプリケーションは、相互におよび中央データベースとデータを共有することができるものの、異なるアプリケーションからのデータをすべて閲覧する人またはすべてアクセスする人が理解できるようにまたは容易に用いることができるように共有データを編成する簡単な技術もなければ、系統的かつ容易に理解可能な方法で共有データをユーザに対して提示する方法もない。米国特許出願第10/394,683号には、データを共通形式で可視化することにより異なるデバイスおよびアプリケーションからのデータを一貫した形式で閲覧することを容易にする方法が開示されているが、さらに、さまざまなユーザにより上述のデータがより幅広くまたはより全面的に用いられることを可能とするために、ウェブ接続を利用して中央データ統合サイトに接続されたサイトの如きさまざまな遠隔サイトから上述のデータにアクセス・閲覧できることが望ましい。 However, as mentioned above, the different applications that collect this data are designed to be used within a process plant to perform very different functions on a normal part of a device or apparatus within the plant. Therefore, these applications are created so that the organization and display of the collected and generated data may be slightly different or may differ greatly. Thus, while these applications can share data with each other and with a central database, they can be easily or easily used by those who view or access all data from different applications. There is no simple technique for organizing shared data, nor is there a way to present shared data to users in a systematic and easily understandable manner. US patent application Ser. No. 10 / 394,683 discloses a method that facilitates browsing data from different devices and applications in a consistent format by visualizing the data in a common format. In order to allow the above data to be used more widely or more fully by a complete user, the above data can be transferred from various remote sites, such as sites connected to a central data integration site using a web connection. It is desirable to be able to access and browse.
プロセスプラントデータ収集・閲覧システムは、複数の異なるデータアプリケーションまたはデータ供給源からの実際のデータが異なるデータ供給源により異なる方法で収集、編成されている場合であっても、ユーザが任意の所望の統合レベルでプロセスプラント内の異なるアプリケーションまたはデータ供給源から取得される情報を同様かつ一貫性のある方法で閲覧することを可能とするために、共通のまたは統合型のナビゲーションツリー構造と一または複数の共通表示形式とを用いる。これに加えて、中央データ収集・統合供給源からのデータにアクセスするために一または複数の遠隔接続部または遠隔サイトが構築され、これにより、ユーザは、たとえばウェブ接続を利用して、プロセスプラントの内側またはプロセスプラントの外側にあるさまざまな場所において統合データに容易にかつ迅速にアクセスすることができる。情報の共用を目的としてさまざまな情報統合レベルにおいて遠隔から情報が可視化されるので、ユーザは、同一のタイプのデータに対して複数の閲覧形式と格闘または戦うことなく高いデータ統合レベルでまたは低いデータ統合レベルで、データベースに格納されているまたは異なるデータ供給源により収集されたデータを容易に検索することができる。これに加えて、ユーザは、ユーザプロファイルを設定してプロセスプラントデータを閲覧し、前もって構築されたまたは前もって設定されたレポートを遠隔サイトから取得、出力し、遠隔サイトからデータ統合プログラムを読み込んで実行することなく、一部のタイプのデータに容易にかつ迅速にアクセスすることができる。これにより、遠隔から統合プロセスデータへ迅速かつ容易にアクセスすることが可能となる。 Process plant data collection and browsing systems allow users to create any desired data, even when actual data from different data applications or data sources are collected and organized in different ways by different data sources. Common or integrated navigation tree structure and / or multiple to allow information obtained from different applications or data sources in the process plant at the integration level to be viewed in a similar and consistent manner Common display format. In addition, one or more remote connections or sites are built to access data from a central data collection and integration source so that users can use, for example, web connections to process plant Integrated data can be easily and quickly accessed at various locations inside or outside the process plant. Information is visualized remotely at various information integration levels for information sharing purposes, so users can use high or low data integration levels without struggling or fighting multiple viewing formats for the same type of data. At the integration level, data stored in a database or collected by different data sources can be easily retrieved. In addition, users can set up user profiles to view process plant data, retrieve and output pre-built or pre-configured reports from remote sites, and load and execute data integration programs from remote sites. Without having to access some types of data easily and quickly. This allows quick and easy access to integrated process data from a remote location.
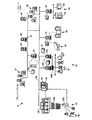
図1を参照すると、(単一の地理的場所または複数の地理的場所に設けられうる)プロセスプラント10は、一または複数の通信ネットワークにより複数の制御システムおよび保全システムと相互接続される、複数のビジネスコンピュータシステムおよび他のコンピュータシステムを備えている。具体的にいえば、プロセスプラント10は、一または複数のプロセス制御システム12、14を備えている。プロセス制御システム12は、PROVOXシステムまたはRS3システムの如き従来のプロセス制御システムまたはその他のDCSであってもよい。このDCSは、オペレータインターフェイス12Aを備え、このオペレータインターフェイス12Aはコントローラ12Bに接続され、次いで、コントローラ12Bは入力/出力(I/O)カード12Cに接続され、次いで、この入力/出力(I/O)カード12Cはアナログ型フィールドデバイスおよび高速アドレス可能遠隔トランスミッタ(HART)フィールドデバイス15の如きさまざまなフィールドデバイスに接続されている。プロセス制御システム14は、分散型プロセス制御システムであってもよいが、イーサネット(登録商標)バスの如きバスを介して一または複数の分散したコントローラ14Bに接続される一または複数のオペレータインターフェイス14Aを備えている。コントローラ14Bは、たとえばテキサス州オースチンにあるフィシャーローズマウントシステムズ社(Fisher−Rosemount Systems Inc.)により販売されているDeltaV(登録商標)コントローラであってもよいしその他のタイプのコントローラであってもよい。コントローラ14Bは、I/Oデバイスを介して、一または複数のフィールドデバイスに接続される。これらのフィールドデバイスは、たとえば、HARTフィールドデバイス、Fieldbusフィルールドデバイス、または、PROFIBUS(登録商標)プロトコル、WORLDFIP(登録商標)プロトコル、Device−Net(登録商標)プロトコル,AS−InterfaceプロトコルおよびCANプロトコルのうちのいずれかを用いるフィールドデバイスを含むその他のスマートフィールドデバイスもしくは非スマートフィールドデバイスである。公知のように、フィールドデバイス16は、プロセス変数および他のデバイス情報に関連するアナログ情報またはデジタル情報をコントローラ14Bに提供しうる。オペレータインターフェイス14Aは、たとえば制御オプチマイザ、診断エキスパート、ニューラルネットワーク、調整器などを含む、プロセス動作を制御するためにプロセス制御オペレータにより利用可能なっているツールを格納、実行しうる。
Referring to FIG. 1, a process plant 10 (which may be located at a single geographic location or multiple geographic locations) is interconnected with multiple control and maintenance systems by one or more communication networks. Business computer systems and other computer systems. Specifically, the
さらに、AMSアプリケーションまたはその他のデバイス監視・通信アプリケーションを実行するコンピュータの如き保全システム18は、保全活動および監視活動を実行するために、プロセス制御システム12、14またはこれらのプロセス制御システム内の個々のデバイスに接続されうる。たとえば、保全コンピュータ18は、デバイス15と通信すべく、場合によっては、デバイス15を再設定すべく、またはデバイス15に対して他の保全活動を実行すべく、(無線ネットワークまたは携帯デバイスネットワークを含む)任意の所望の通信回線またはネットワークを介してコントローラ12Bおよび/またはデバイス15に接続されうる。同様に、AMSアプリケーションの如き保全アプリケーション19は、デバイス16の動作ステータスに関するデータの収集を含む保全・監視機能を実行するために、分散型プロセス制御システム14に関連付けされているユーザインターフェイス14Aのうちの一または複数の中に実装され、これらにより実行されうる。
In addition, a
また、プロセスプラント10は、タービン、モータなどの如きさまざまな回転装置20をさらに備えている。これらの装置は、ある恒久的通信リンクまたは一時的通信リンク(たとえば、バス、無線通信システム、または、回転装置20に接続され、読み取りを行い、そして取り外される携帯デバイス)を介して、保全コンピュータ22に接続されている。この保全コンピュータ22は、たとえばCSiシステムズ社により提供される公知の監視・診断アプリケーション23または回転装置20の動作状態の診断、監視、および最適化を行うために用いられるその他の公知のアプリケーションを格納、実行しうる。保全要員は、プラント10内の回転装置20の性能を維持・監視するために、回転装置20の問題を把握するために、および回転装置20の修理または交換しなければならないか否かまたはその時期を把握するために、アプリケーション23を利用することが多い。場合によっては、外部コンサルタントまたは外部サービス組織は、一時的に装置20に関するデータを取得または測定し、このデータを用いて装置20に対する分析を実行し、問題、不良性能、または装置20に影響を与える他の問題を検出する。このような場合、分析を行っているコンピュータは、システム10のその他の部分と通信回線で接続されていないこともあれば一時的に接続されていることもある。
The
同様に、プラント10に関連づけされている電力発生・分配装置25を有する電力発生・分配システム24は、たとえばバスを介して、他のコンピュータ26に接続されている。このコンピュータ26は、プラント10内において電力発生・分配装置25を実行し、その動作を監視する。また、コンピュータ26は、電力発生・分配装置25を制御、維持するために、たとえばLiebertおよびASCOまたは他の会社により提供されるアプリケーションの如き公知の電力制御・診断アプリケーション27を実行しうる。ほとんどの場合、外部コンサルタントまたは外部サービス組織は、一時的に装置20に関するデータを取得または測定し、このデータを用いて装置20に対する分析を実行し、問題、不良性能、または装置20に影響を与える他の問題を検出する。このような場合、分析を行っている(コンピュータ26の如き)コンピュータは、システム10のその他の部分と通信回線で接続されていないこともあれば一時的にのみ接続されていることもある。
Similarly, a power generation /
(たとえばサーバでありうる)コンピュータシステム30は、通信ネットワーク32を通じて、プロセス制御機能12、14、コンピュータ18、14A、22、26に実装されている保全機能、およびビジネス機能を含む、プラント10内のさまざまな機能システムと関連づけされているコンピュータまたはインターフェイスに、通信可能に接続されている。所望の場合には、通信相互接続器32は、任意のローカルエリアネットワーク(LAN)、ワイドエリアネットワーク(WAN)、インターネットなどを含むウェブインターフェイスまたはその他の種類の通信構造を用いて実現されてもよい。いずれの場合であっても、コンピュータシステム30は、従来のプロセス制御システム12およびこの制御システムに関連づけされている保全インターフェイス18に通信可能に接続され、分散型プロセス制御システム14のプロセス制御および/または保全インターフェイス14Aに接続され、回転装置保全コンピュータ22および電力発生・分配コンピュータ26に接続されている。これらの接続はすべてバス32を通じて行われている。バス32は、通信のために、いかなる所望なまたは適切なLANプロトコルまたはWANプロトコルを用いてもよい。通信ネットワーク32は、所望に応じて、恒久的であってもよいし一時的(断続的)であってもよい。
A computer system 30 (which may be a server, for example) includes a maintenance function implemented in the process control functions 12, 14,
図1に示すように、コンピュータ30は、ワールドワイドウェブ接続のような異なるイントラネット接続またはインターネット接続の如き異なるまたは同一のネットワークバス33を通じて、ビジネスシステムコンピュータと保全計画コンピュータ35、36とにさらに接続されている。これらのコンピュータ35、36は、たとえば統合基幹業務計画(ERP)、資材調達計画(MRP)、アカウンティング、生産・顧客発注システム、保全計画システム、またはパーツ・補充品・原材料発注アプリケーション、生産計画アプリケーションなどの如きその他所望のビジネスアプリケーションを実行しうる。また、コンピュータ30は、たとえばバス32を通じて、プラントワイドLAN37、コーポレートWAN38、および、遠隔の位置からのプラント10の遠隔監視またはプラント10との通信を可能とする一または複数のコンピュータシステム40にさらに接続されうる。コンピュータシステム30、または通信ネットワーク32、33に接続されているその他のコンピュータは、コンフィギュレーションアプリケーションと、プロセスプラント10ならびに当該プロセスプラント10内のデバイスおよびエレメントの設定に関する設定データを生成、格納するコンフィギュレーションデータベースとを備えうる。
As shown in FIG. 1,
一つの実施形態では、通信ネットワーク32、33を通じた通信はXMLプロトコルを利用して行われる。ここで、コンピュータ12A、18、14A、22、26、35、36などのコンピュータの各々からのデータは、XMLラッパーでラッピングされ、たとえばコンピュータ30に実装されうるXMLデータサーバに送信される。XMLは記述言語なので、このサーバはどのようなタイプのデータでも処理することができる。このサーバでは、必要ならば、データは新しいXMLラッパーでカプセル化される。すなわち、データは、一つのXMLスキーマから他の一または複数のXMLスキーマにマッピングされる。また、これら他方のスキーマは受信側アプリケーションのそれぞれに対して作成される。したがって、データ発信側の各々は、該発信側のデバイスまたはアプリケーションが理解しやすいまたは利用しやすいスキーマを用いてデータをラッピングすることができ、受信側のアプリケーションの各々は、該受信側のアプリケーションに用いられるまたは該受信側のアプリケーションが理解しやすい別のスキーマでこのデータを受信することができる。サーバは、データの送信元と送信先とに応じて一方のスキーマから他方のスキーマにマッピングするように構成されている。所望の場合には、サーバは、データの受信に基づいて、あるデータ処理機能または他の機能をさらに実行しうる。マッピングおよび処理機能のルールは、本明細書記載のシステムが動作するまえに、サーバにおいて設定、格納される。このようにして、データは、任意の一つのアプリケーションから一または複数の他のアプリケーションへ送信されうる。
In one embodiment, communication through the
一般的にいえば、(従来のサーバであってもよいし従来のサーバを含んでいてもよい)コンピュータ30は、資産活用データベース50(および付属するデータ収集アプリケーション)を備えている。この資産活用エキスパート50は、たとえばプロセス制御システム12、14、保全システム18、22、26、およびビジネスシステム35、36により生成されるデータおよび他の情報ならびにこれらのシステムのそれぞれにおいて実行されるデータ解析ツールにより生成される情報を収集し、これらの情報をデータベースに格納する。資産活用エキスパート50は、たとえばNEXUSにより現在提供されているOZエキスパートシステムに基づきうるエキスパートエンジンまたはたとえば任意のタイプのデータマイニングシステムを含むその他所望のタイプのエキスパートシステムに基づきうるエキスパートエンジン51を備えてもよい。この資産活用エキスパート51が、資産最適化データベース50内で必要に応じてデータを分析、分布するように動作する。
Generally speaking, the computer 30 (which may be a conventional server or may include a conventional server) includes an asset utilization database 50 (and an associated data collection application). This
従来、さまざまなプロセス制御システム12、14および電力発生・維持システム22、26は、有益な方法でこれらのシステムの各々において生成されるまたは各々により収集されるデータを共有することを可能とするような方法では相互に接続されなかった。その結果、データを編集しユーザによるデータの閲覧を可能にする方法はアプリケーション毎に異なっていた。しかしながら、図1のプラント10では、アプリケーション17、19、23、27が、資産最適化データベース50を通じて通信可能に接続され、資産最適化データベース50とデータを共有している。それにもかかわらず、アプリケーション17、19、23、27の各々は、通常収集または生成したデータを、依然として異なる編成ツリーまたはナビゲーショナルツリーおよび閲覧ソフトウェアを用いた異なる方法で提供または編成している。このようなデータを異なるアプリケーションから一貫した方法で閲覧することを可能とするために、資産最適化データベース50は、一または複数のナビゲーションツリーアプリケーションおよびナビゲーションツリーデータベース52を含んでいる。これらのナビゲーションツリーアプリケーションおよびナビゲーションツリーデータベース52は、統合ナビゲーションツリー構造を用いて、プロセスプラント10内のさまざまなアプリケーションから受信したデータを編成し、ユーザが単一のナビゲーションツリーを用いて一貫した方法でコンピュータ30からまたは遠隔サイト40からデータを閲覧またはアクセスすることを可能としうる。
Traditionally, the various
具体的にいえば、ナビゲーションツリーアプリケーション52により、データがたとえ異なる供給源から受信されかつ異なる供給源において異なる方法で編成されてあるとしても、資産最適化データベース50内でそのデータを閲覧、アクセスするために、システム内のユーザすべてによりたとえばウェブ環境において用いられるナビゲーションツリーを生成する自動的な方法が提供される。事実、ナビゲーションツリーアプリケーション52は、資産最適化データベース50と一緒になって、資産最適化サーバの形態をなす高レベル統合型プラットホームを提供している。この高レベル統合型プラットホームは、複数の情報供給源(たとえば、制御アプリケーション、保全アプリケーション、装置監視アプリケーション、効率監視アプリケーションなど)から、たとえ異なる情報供給源の各々が異なる方法で提供データを編成しているとしても、情報を受信、編集する。
Specifically, the
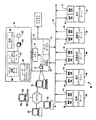
図2には、プロセスプラント内の一組のアプリケーション60を示すブロック図が示されている。この一組のアプリケーション60は、ウェブ接続部61を通じて、(図1のコンピュータ30でありうる、本明細書において主要データ統合・閲覧プラットホームとも呼ばれる)資産最適化サーバ62と通信可能に相互接続されている。この相互接続は、資産最適化サーバ62により一貫性および統合牲のある編成を有するナビゲーションツリー構造が提供されるように形成される。このナビゲーションツリー構造は、主要データ統合プラットホームまたは中央データ統合プラットホーム62においてまたはたとえばインターネット通信接続部を通じて主要データ統合プラットホーム62に接続される遠隔のプラットホームまたはコンピュータ63において、さまざまなアプリケーション60の中で生成されるデータまたはさまざまなアプリケーション60により収集されるデータに対して共通の閲覧プラットホームを提供するために用いられうる。具体的にいえば、制御アプリケーションサーバ64、保全アプリケーションサーバ66、回転装置アプリケーションサーバ68、最適化アプリケーションサーバ70、および他のアプリケーション用のさらなるサーバは、通信ネットワーク61を通じて資産最適化サーバ62に通信可能に接続されている。もちろん、図2において、いかなる他のタイプのアプリケーションおよびいかなる数のアプリケーション(データ供給源とも呼ばれる)が接続されてもよい。通信ネットワーク61は、ワイドエリアネットワーク、World Wide Web、またはその他所望のタイプのウェブネットワークの如きいかなる所望の通信ネットワークであってもよい。所望の場合には、通信ネットワーク61は、HTMLなどの如き任意の所望の通信プロトコルを用いたハードワイヤードネットワークまたは無線ネットワークであってもよい。サーバ62〜72の各々は、公知のようにウェブ接続部61を用いた通信およびユーザインターフェイスに対する情報の可視化を可能とする任意の所望のウェブサービスアプリケーション(web services application)74と、ウェブ可視化アプリケーション(web visualization application)76とを備えている。一般的にいえば、異なるサーバ64〜72で実行されるまたは異なるサーバ64〜72に関連づけされる異なるアプリケーション60は、異なるナビゲーションツリーの如きデータの編成、ナビゲーション、および閲覧のための異なる仕組みを用いうる。さらに、資産最適化サーバ62は、ウェブ接続部61またはその他所望の通信ネットワークを通じて、ビジネスシステムアプリケーションまたはその他のアプリケーションに通信可能に接続されうる。所望の場合には、資産最適化サーバ62は、プロセスプラント内のフィールドデバイスおよび他のデバイスからのデータおよびそれらについてのデータを収集するために、メーカ独自のバス、イーサネット(登録商標)バス、またはそれらを組み合わせたものを通じて、一または複数のプロセスコントローラまたはフィールドデバイスに直接接続されてもよい。
FIG. 2 shows a block diagram illustrating a set of
図2に示されているように、資産最適化サーバ62は、マイクロプロセッサ77と、ユーザインターフェイス78と、メモリ79とを備えている。このメモリ79は、異なるアプリケーション60およびこれらのアプリケーション60に関連するナビゲーションツリー構造を統合して統合ナビゲーションツリー構造を形成するように動作し、また、異なるデータ供給源からのデータのための共通閲覧スキームを提供するように動作する複数のアプリケーションおよびデータベースを格納する。一つの実施形態では、資産最適化サーバ62は、当該資産最適化サーバ62に通信可能に接続されている異なるデータ供給源であるアプリケーションからのデータを格納するプラント情報データベース80と、異なるアプリケーション60の各々に関連するナビゲーションツリー83aおよび異なるアプリケーション60のナビゲーションツリーを連携させるまたは統合させる統合ナビゲーションツリー83bを格納するナビゲーションツリーデータベース82とを備えている。また、資産最適化サーバ62は、プラント情報データベース80内に格納されているデータに関する情報を統合ナビゲーションツリー83bを用いてユーザにユーザインターフェイス78を介して提供するユーザインターフェイスアプリケーション84をさらに備えている。
As shown in FIG. 2, the
さらに、所望ならば、異なるアプリケーション60からのデータを統合ナビゲーションツリー83bを用いてプラント情報データベース80内へ統合するために、データ統合アプリケーション84が設けられてもよい。場合によっては、このデータ統合アプリケーション86により、アプリケーション60のためのナビゲーションツリー構造83aを統合ナビゲーションツリー83bへマッピングする機能がユーザに提供されることもある。一つの実施形態では、統合アプリケーション86は、アプリケーション60のナビゲーションツリー構造の各々の中のデータを統合するために用いられうるデフォルトナビゲーションツリー構造を備えうる。このデフォルトナビゲーションツリー構造は、たとえばS88標準規格において用いられているプラント階層に基づいたものであってもよい。しかしながら、統合アプリケーション86は、あるユーザまたはさまざまなユーザが異なるアプリケーション60のナビゲーションツリーを異なる方法で統合するために用いられうるナビゲーションツリー構造をさらに作成することを可能としてもよい。もちろん、所望ならば、デフォルトナビゲーションツリー構造は、データ統合アプリケーション86および/またはユーザインターフェイスアプリケーション84を用いてユーザにより作成されてもよい。
Further, if desired, a
一般的に、資産最適化サーバ62は、異なるアプリケーション60の異なるナビゲーションツリー構造83aの各々を格納し、これらのナビゲーションツリー内のデータを、資産最適化データベース80内のデータを閲覧、アクセスするために用いられうる単一統合ナビゲーションツリー構造83bに関連づけするかまたはマッピングする。このマッピングの指定または完了のあと、異なるアプリケーションの異なるツリー構造の各々に関連するデータは、統合ナビゲーションツリー内で編成され、これらのアプリケーションをサーバ62〜72において用いるユーザまたはビジネスシステムのユーザの如きサーバ62に対してアクセスを有するその他のユーザを含む任意のユーザにより閲覧される。所望ならば、単一ナビゲーションツリー構造は、たとえばコンフィギュレーションアプリケーションにより用いられてもよい。また、この単一ナビゲーションツリー構造は、各ユーザがプラントからのデータを同一の方法で閲覧できるように、プロセスプラントまたは当該プロセスプラントに関連するエンタープライズシステムの中のすべてのユーザによりアクセスされ、用いられてもよい。所望ならば、各ユーザは、異なるユーザをコンフィギュレーションアプリケーションへ接続するウェブまたはその他の通信ネットワークを用いて単一ナビゲーションツリー構造にアクセスしてもよい。
In general, the
動作中、異なるアプリケーション60は、これらのアプリケーションにおいて用いられているそれぞれ対応するナビゲーションツリー構造を資産最適化サーバ62へ送信しうる。この資産最適化サーバ62では、これらのツリー構造は、データベース82の中へ格納されうる。統合アプリケーション86は、異なるアプリケーションのうちの一つに関連づけされるナビゲーションツリーの異なるカテゴリと単一統合ナビゲーションツリー構造83bのカテゴリとの間の対応関係を自動的に特定しうる。場合によっては、ユーザは、あるアプリケーション60のナビゲーションツリーのカテゴリと単一統合ナビゲーションツリーまたはデフォルトナビゲーションツリー83b内のカテゴリとの対応関係を手動により特定することもある。アプリケーション60のカテゴリがS88標準規格の如きなんらかの標準規格となんらかの関係で対応していることが知られている場合、統合アプリケーション86はこの対応関係を自動的に特定しうる。一方、ユーザは、ユーザの好みのナビゲーションツリーを作成し、アプリケーション60のうちの一つのナビゲーションツリーおよびユーザが作成した統合ナビゲーションツリーの異なるカテゴリの間の対応関係を特定しうる。もちろん、いうまでもなく、デフォルトナビゲーションツリー構造または統合ナビゲーションツリー構造は、データがアプリケーション60からサーバ62へと流れるので、データ送信元のアプリケーションのうちの一部に現れていないまたは存在していないカテゴリを有していてもよい。しかしながら、デフォルトナビゲーションツリーまたは統合ナビゲーションツリーは、異なるアプリケーション60のナビゲーションツリーのカテゴリの各々に関連するまたは関連しうるカテゴリまたはレベルを有している必要がある。
In operation,
もちろん、統合アプリケーション86は、(データを資産最適化サーバ62へ送信する)アプリケーション60の各々のナビゲーションツリーと統合ナビゲーションツリー83bとの間のマッピングを提供すべくなっており、このマッピングは、プロセスプラント10の資産最適化機能内においてたとえばアプリケーションがオンライン状態になるときまたは他の方法で統合されるときに実行される。そのあと、アプリケーション60の各々は、サーバ62がデータの送信元であるアプリケーション60のナビゲーションツリー構造に従ってデータを分類することを可能とするための十分な情報とともにデータをサーバ62に送信する。サーバ62およびとくに統合アプリケーション86は、統合ビューを提供するために用いられている統合ナビゲーションツリー構造83bの適切なナビゲーションツリーカテゴリに関連づけされた形式でデータを格納しうる。もちろん、データそれ自体は、将来のアクセス用にプラント情報データベース80内に格納される。そのあと、ユーザインターフェイスアプリケーション84は、ユーザまたはオペレータが、参照される異なるアプリケーションからのデータを有する統合ナビゲーションツリー構造83bにアクセスすることにより、一貫性および統合性のある方法でプラント情報データベース80内に格納されているデータにアクセスすることを可能としうる。
Of course, the
一つの実施形態では、統合ナビゲーションツリー構造83bは、計装領域、機械領域、および性能領域の如きロジカル領域またはプラントの領域の如き物理領域に従って編成されうる。もちろん、いかなる他の所望の編成を統合ナビゲーションツリー構造83b内において用いてもよい。統合ナビゲーションツリー構造83bがロジカルユニットに従って構築される場合、(異なるロジカルグループに通常分類される)異なるアプリケーションからの異なるデータは、当該ツリー下の異なる小見出しまたはカテゴリに分類されうる。これらの小見出しまたはカテゴリは標準的なナビゲーションツリー見出しであるかまたは異なるアプリケーションに関連する実際のナビゲーションツリーを模倣したものである。一つの実施形態では、情報サーバ64〜72の各々はそのプラントツリーおよびコンポーネント(見出しを含む)を要求アプリケーション(すなわち、資産最適化サーバ62)に提供する。次いで、統合アプリケーション86は、取得した情報を用いて、さまざまなプラントツリーのコンポーネントを融合させる。所望ならば、アプリケーションの元のナビゲーションツリーコンポーネントが元の情報サーバ(たとえば、保全サーバ64)により追跡調査されなんらかの変更が加えられた場合、資産最適化サーバ62は、プッシュ技術を用いて更新されてもよい。これに代えて、資産最適化サーバ62は、サーバ64〜72を周期的にポーリングし、これらのサーバ(または、これらのサーバで実行されるもしくはこれらのサーバに関連するアプリケーション)のナビゲーションツリー内の変更を受信、追跡記録してもよい。このようにして、アプリケーション60に追加されたデータ、アプリケーション60から削除されたデータ、またはアプリケーション60内で変更されたデータは、資産最適化サーバ62へ反映または送信されて、格納される。さらに、これらのアプリケーションのナビゲーションツリー内のデバイスまたは他のエンティティの説明または記述は、資産最適化サーバ62へ送信され、統合ナビゲーションツリー構造83bへ反映されるかまたはマッピングされ、これにより、これらのデータは、資産最適化データベース50のユーザによる統合ナビゲーションツリー構造83bを通じた利用および閲覧が可能となる。
In one embodiment, the integrated
資産データがデータベース80内に収集されると、当該データは、遠隔サイト63から容易にアクセス、閲覧されうる。具体的にいえば、遠隔サイトの各々は、プロセッサ63aと、閲覧スクリーンの如きユーザインターフェイス63bと、メモリ63cとを備えている。通常のインターネットブラウザの如きインターネットアクセスアプリケーションは、メモリ63c内に格納されうるし、また、通常プロセッサ63aにより実行されて主要データ可視化プラットホーム62と通信しうる。さらに、遠隔サイト63は、一または複数の遠隔データアクセスアプリケーションを格納している。これらのデータアクセスアプリケーションは、インターネットを用いて、主要データ可視化プラットホーム62から特定のデータ形式で特定の情報またはデータを求めてポーリングし、このデータを遠隔サイト63のユーザに提示する。これにより、主要データ可視化サイト62内に存在するすべてのデータ収集・統合アプリケーションを遠隔サイト63に読み込むことまたはそこで実行することを必要とせずに、インターネット接続を通じてデータを容易に取得およびアクセスすることが可能となる。以下でさらに詳細に説明するように、これらの遠隔データアクセスアプリケーションは、主要データ可視化プラットホーム63から異なるデータ形式で異なる種類のデータを取得することに関連する一または複数のモジュールを備えうる。
Once asset data is collected in the
図3には、図2の遠隔データ可視化プラットホーム63と主要データ収集・可視化プラットホームまたは中央データ収集・可視化プラットホーム62との間の通信接続が示されている。これにより、遠隔データ可視化プラットホーム63は、主要データ収集・可視化プラットホーム62内に格納されているまたはそれにより収集されたデータを容易にアクセス・表示することが可能となる。遠隔データ可視化プラットホーム63は、デスクトップコンピュータ、ラップトップコンピュータ、携帯情報端末(PDA)などを含むいかなるタイプのコンピューティングデバイスであってもよい。また、遠隔データ可視化プラットホーム63は、たとえばインターネット通信接続器88を通じて、ウェブサーバ87に接続されている。遠隔データ可視化プラットホーム63は、無線接続、ダイアルアップ接続、ブロードバンド接続、T−1回線などを含む任意の所望の接続用のハードウェアおよびソフトウェアを用いてインターネット88に接続されうる。次いで、ウェブサーバ87は、主要サーバ62に関連する通信インターフェイス89に接続され、XMLファイルを用いてまたはXML形式で、通信インターフェイス89と通信しうる。この通信インターフェイス89は、標準的な通信機能を実行するために、接続サーバ(connection server)や、汎用エクスポートサーバ(general export server)などを備えうる。
FIG. 3 shows a communication connection between the remote
図3に示されているように、主要データ収集・可視化プラットホーム62は、データベース90に接続されており、このデータベース90は、サーバ62により収集されるプラントデータを格納する。データベース90は、たとえばSQLサーバ/データベースであってもよいし、図2のデータベース80の機能を充足してもよい。一般的にいえば、主要データ収集・可視化プラットホーム62は、ウェブサーバ87と通信し、当該ウェブサーバ87からポーリングにより求められているデータを、所定の形式でセットアップまたは準備されるXMLファイルで用意することにより、迅速にかつ容易にデータを当該ウェブサーバ87に対して提示する。
As shown in FIG. 3, the main data collection /
主要データ収集・可視化プラットホーム62から取得された情報またはデータは、HTTPプロトコルを用いてサーバ87に送信され、HTMLページの形式をとっている。図3に示されているように、Active Server Page(ASP)ドキュメントは、ウェブサーバ87の中に設けられて、実行される。ASPドキュメントは、.NETコンポーネントを用いて、主要データ収集・可視化プラットホーム62に対して特定のタイプのデータを求める問い合わせを行いうるし、このデータを、ストリーム(格納されない)XMLデータとして受信しうる。次いで、このXMLデータは、たとえばXSLT言語を用いて直ぐに処理され、HTMLデータに変換され、Microsoft InternetExplorerの如き標準的ブラウザで表示される。
Information or data acquired from the main data collection /
遠隔データ可視化プラットホーム63は、オブジェクトモジュール92a〜92hとして図3において特定されているさまざまなオブジェクトを用いてウェブサーバ87と通信する。通常、これらのオブジェクトモジュール92a〜92hは、あるタイプのデータが求められた場合にサーバ87を呼び出しそのデータを求めるようになっているエレメントを通常備えており、これらのエレメントは、遠隔データ可視化プラットホーム63に格納されている。次いで、サーバ87は、これらの呼び出しに応答しASPドキュメントを通じて主要データ収集・可視化プラットホーム62から特定の書式で(これらの呼出しに関連する)特定のタイプのデータを取得すべくなしてあるアプリケーションを用いる。このようにして、オブジェクトモジュール92a〜92hは、サーバ87を呼び出し、特定のタイプの情報を求め、この情報は、XML形式でまたはXMLファイルでウェブサーバ87に送信され、格納されることなくウェブページに変換され、遠隔サイト63へ返信され、遠隔サイト63のユーザにより閲覧される。オブジェクトモジュール92a〜92hが特定のタイプのデータを求める呼び出し行い、このデータのプロファイルが、実際上、ウェブサーバ87の中に格納されていてもよいしまたは主要サーバ62の中に格納されていてもよいので、全データベース90が、遠隔コンピュータ63の中に読み込まれる必要もなければ遠隔コンピュータ63へ送信される必要もない。その代わりに、呼び出しにより要求されているデータのみが、公知のXMLファイルにラッピングされて、サーバ67から遠隔サイト63まで送信される。したがって、インターネットを用いた通信およびデータ呼び出しは、遠隔サイト63までへ送信される必要のあるデータの量が減少させられ遠隔サイト63にデータを送信するスピードが上昇させられるように行われる。
The remote
以上のように、ウェブサーバ87は、ウェブページを作成しVBNET、XML,Web servicesなどの如き標準的な.NETコンポーネント(.NET components)を用いた従来のウェブサービスを提供すべくなしてあるASP.NETフレームワークなどを実装しうる。ウェブサーバ87がXMLファイルを用いてインターフェイス89と通信するので、サーバ62およびデータベース90から求められる情報は、有利に、遠隔プラットホーム63へ容易に配信されるようサーバ87内にXMLドキュメントとして保存されうる。さらに、オブジェクトモジュール92a〜92hの各々がそれと関連する一または複数の所定の表示形式を有しているので、XMLドキュメント内のデータは、個々のオブジェクト所定の要件に基づいて容易に、格納およびウェブページへの変換がなされうる。
As described above, the
以上のように、サーバ87は、インターフェイス89と一緒に、核となる.NETコンポーネントが、(サーバ87内の)ウェブアプリケーションとコムインターフェイス(com interface)との間の通信を取り持つべくなしてあるデータ交換層を形成し、次いで、これらのコムインターフェイスが主要サーバ62において相互に作用することにより、要求されたデータを取得する。したがって、ウェブモジュール92の全部が、サービスのために.NETコンポーネントと実質的に通信し、.NETコンポーネントが、適切なXMLストリームを戻すインターフェイス89と通信する。データ交換層は、要求されたデータをXMLストリームから抽出し、このデータを発呼オブジェクトにウェブページ形式で戻す。また、このデータ交換層は、アドミニストレータ用ファイルをサーバ87の中に保存する機能をさらに実行する。もちろん、すべてのモジュール92が、サーバ87(すなわち、データ交換層)内のウェブアプリケーションに関連する方法に対する呼び出しを実行し、サーバ62からのまたはサーバ62への所定のタイプのデータの送受信を行うべくなしてある。
As described above, the
いうまでもなく、サーバ87は、エンドユーザが.NETと相互作用するための手段であるXMLウェブサービスおよび.NETエクスピアリエンス(.NET experiences)を作成、開発、管理、および結合することを可能とする一組のプログラミングツールおよび基盤施設を備えるように、Microsoft.NET構造上に構築されてもよい。この製品の特徴の一部は、標準的なインターネットブラウザのルック&フィールを実現するためにサーバアプリケーションと共存すると共に補完するウェブをベースにした読み取り専用アプリケーションを備えていることもある。一つの実施形態では、このアプリケーションは、要求されたデータをサーバ62から抽出するために既存のCOM/DCOMコンポーネントのXMLデータアクセスサービスを用いうるし、また、レベル認証用の組込書式を用いたイントラネット多重ウェブアクセス(multiple web access through the intranet with Built−in Form)機能を備えうる。
Needless to say, the
図3のハードウェア構成には、遠隔アプリケーションモジュール92とデータベースとの間の通信を取り持つ上で用いられる二つの別個のサーバが示されている。第一のサーバは、データベース90を備える主要データ可視化アプリケーション62に用いられ、第二のサーバ87は、遠隔サイト63への通信を提供するためのウェブアプリケーションを実行しうる。これに代えて、単一のサーバを通信の実行に用いてもよい。この単一サーバ方式では、ウェブサーバソフトウェア、遠隔呼び出しアプリケーション、およびデータベース90へのアクセス用のデータベースサーバの如き基本サーバのすべてが一つのサーバに搭載、実行される。この実施形態では、すべてのアプリケーションが同一のサーバに搭載されているので特別な構成を必要とすることなく、遠隔サイト63は、直接プラントワイドイントラネット、ローカルエリアネットワーク、World Wide Webなどを通じて、直接この単一サーバと通信する。
The hardware configuration of FIG. 3 shows two separate servers that are used to handle communication between the
以上のように、さまざまな遠隔データ可視化プラットホーム63は、主要データ可視化プラットホーム62(および最終的にはデータベース90)からのデータをアクセスするために前もって設定されているウェブモジュール92を通常用いる。これらのウェブモジュール92は、たとえばデータベース90内にデータが格納されているさまざまなデバイス間の検索(navigation)を可能または許可しうるデバイスナビゲーションモジュール91aと、プロセスプラント内のフィールドデバイスおよび他のデバイスに関して生成されている現在のアラートまたは過去のアラート(アラームを含む)の検索および閲覧を可能および許可しうるアラート監視器92bと、遠隔ユーザにデータベース90内に格納されている監査トレイルデータの閲覧を可能とする監査トレイルモジュール92cと、遠隔ユーザにデバイスコンフィギュレーションデータの閲覧を可能とするデバイスコンフィギュレーションリストモジュール92dと、遠隔ユーザに校正試験の実行およびデータベース90内に格納されているデバイスによりまたはデバイスのために格納される校正データの閲覧を可能とする校正試験モジュール92eと、遠隔ユーザにプロセスプラント内のさまざまなフィールドデバイスまたは他のデバイスのための校正スケジュールの閲覧および必要な変更を可能とする校正スケジュールモジュール92fと、遠隔ユーザにプロセスプラントに関連するデバイスのリストの閲覧および検索を可能とするデバイスリストモジュールと、遠隔サイト63のユーザにより以前に設定または定義された個人データまたはデータページをアクセスしうる個人化モジュール92hとを含みうる。もちろん、迅速かつ容易な方法でデータベース90内に格納されている他のタイプのデータをアクセスし、閲覧するために、他のウェブモジュールが遠隔データ可視化プラットホーム63において用いられても格納されてもよい。以上のように、これらのモジュール92は、サーバ87を呼び出して、当該サーバ87にサーバ62と相互作用させることにより、遠隔サイト63で必要なまたは要求されるデータを共通のまたは一貫性のある形式で取得すべくなしてある。
As described above, various remote
図4には、遠隔データ可視化サイト63で図3のモジュール92に関連するさまざまなタイプのデータを提示するために用いられうる包括的閲覧スクリーンが示されている。具体的にいえば、遠隔データ可視化プラットホーム63のうちのいずれかの表示スクリーン93は、オブジェクトブラウザ領域94とオブジェクト閲覧領域95とを含む二つの共通領域または共通ペインを有するように設定されうる。表示スクリーン93のオブジェクトブラウザ領域94は一または複数のブラウザ構造94a〜94gを通常備えている。これらのブラウザ構造は、ユーザに表示したいオブジェクトの選択を可能とするように作られたたとえばナビゲーションツリー構造または他のブラウザ構造でありうる。ブラウザセクション94a〜94bは、ブラウジングされうるし、内部のアイテムは、主要データ可視化プラットホーム62からさらなる情報を取得するために選択されうる。ブラウザセクション94a〜94b内での選択により、図3のモジュール92のうちの一つを通じて、ある形式であるデータを表示するための呼び出しを起動させる。
FIG. 4 shows a comprehensive browsing screen that can be used at the remote
その一方、オブジェクト閲覧領域95は、参照番号95a〜95fにより示されている一組の一般化された表示形式のうちの一つを用いて、オブジェクトブラウザ領域94内で選択されたアイテムまたはオブジェクトについての情報を表示すべくなっている。これらのデータ形式は、データにアクセスして表示するためにも用いられるべきASPドキュメントを指定する。図4に示されているように、(モジュール92と通信しうる)アプリケーションプレゼンテーション層(application presentation layer)96は、遠隔サイトと主要データ可視化サーバ62内のインターフェイス89との間を結合させ、ブラウザオブジェクト94のうちの一つを選択することにより指定された情報を取得し、その情報を所定の表示形式でオブジェクト閲覧領域95内に提示する。この表示形式を有するウェブページは、内部に適切な情報を備えてウェブサーバ87(図3)で生成されうる。これにより、インターネット接続88を用いて送信されるデータの量が削減される。
On the other hand, the
図4に示されているように、オブジェクトブラウザ領域94は、主要データ可視化プラットホーム62(および最終的にデータベース90)内の情報をブラウジングしこれらから情報を取得するためにさまざまな所定の選択項目または見出しを提供する。たとえば、ユーザは、プラントロケーション階層ブラウザ94aを用いることにより、たとえばArea、Unit、Equipment、Control Moduleなどを含むS88標準規格のカテゴリに準拠したプラントロケーションに基づいてブラウジングしうる。ユーザは、ブラウザ94aを用いてプラントデータベース階層(Area/Unit/Equipment/Control Module)を検索し、オブジェクト閲覧領域95上で関連するデバイスをたとえばこれらのデバイスに関連するタグリスト形式を用いて検査することができる。このタグリスト形式は、ブラウザ94のうちの選択されたセクションに関連する情報を、デバイスのタグのリストとしておよび当該タグの各々に対する適切な情報として基本的に表示する。このような表示の一例が図5に示されている。この図では、ブラウザセクション94aがプラントロケーション(plant location)セクション下で展開され、複数の個別のエレメントが示されている。これらのエレメントのうちの一つ、すなわちSatishエレメントが選択され、タグにより記載されてSatishエレメントに関連するデバイスがオブジェクト閲覧領域95内に示されている。図5から分かるように、各タグの情報には、デバイスタグ、製造業者、デバイスタイプ、更新、支持する通信プロトコル、整理番号、ステータス、およびデバイスが設けられているプラント領域が含まれる。しかしながら、これに代えてまたはこれに加えて、その他所望の情報が示されてもよい。また、ユーザは、選択されたタグに関連するデバイスについてのさらに詳細な情報を閲覧するために、マウスをクリックすることにより単一のまたは複数のタグをさらに選択してもよい。
As shown in FIG. 4, the
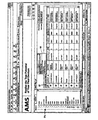
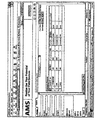
いうまでもなく、ブラウザ94またはオブジェクト閲覧領域95の中のエレメントのうちの一つを選択すると、図3の関連するウェブモジュール92は、そのエレメントに関連するデータを求めて呼び出しを行う。この呼び出しは、図3のウェブサーバ87へルーチングされ、当該ウェブサーバ87内のアプリケーションに、主要データ閲覧プラットホーム62からのデータを取得させ、このデータを適切な所定のウェブページ形式にセットさせる。図4の形式セクション95aにより示されているように、タグリストの表示画面は、これらのタグのうちの一または複数についての監査トレイル情報(audit trail)、コンフィギュレーション要約(configuration summary)、コンフィギュレーション(configuration)情報、および校正試験イベント(calibration test events)に関する情報を提供しうる。図6に示されているように、ユーザは、ドロップダウンメニュー98を用いてオブジェクト閲覧スクリーン95の右欄上の選択ボックスセクション内で選択されるタグについての監査トレイル情報、コンフィギュレーション情報、および校正情報を取得しうる。一例では、図7は、図6のスクリーン内の選択されたタグの監査トレイル情報を示しており、図8は、図6内の選択されたタグのうちの複数のタグのコンフィギュレーション要約スクリーンを示しており、図9は、図6のスクリーン内のあるタグに関する詳細なまたは完全なコンフィギュレーション情報スクリーンの一例を示しており、図10は、図6のスクリーン内の選択されたデバイスの校正試験イベント要約スクリーンの一例であり、選択されたタグに対する最近の校正結果を表している。
Of course, when one of the elements in the
同様に、ユーザは、(図4の)ブラウザ94bを用いて、プロセスプラントの物理通信ネットワークに関連するサーバおよび当該サーバ内で用いられるデータ構造体の如き物理ネットワークをブラウジングしうる。さらに詳細にいえば、ナビゲーションツリー94内の物理ネットワークレベル94bから、ユーザは、システムに物理的に接続されたデバイスをオブジェクト閲覧領域95上のタグリストページとして閲覧することができる。この物理ネットワークは、プロセスプラント内のノードのうちのいずれかに取り付けられるいかなるハードウェアを備えてもよい。ユーザは、図6〜図10に関連して上述された方法で、タグリストページから、監査トレイル情報、コンフィギュレーションパラメータ情報、校正情報などのようなさらに詳細なページを取得しうる。
Similarly, a user may use the
プロセスプラント内のアラートを閲覧するために、図4のアラート監視ブラウザセクション94cを用いうる。具体的にいえば、アラート監視ブラウザセクション94cは、ユーザにより機能不全であるかまたは不良データを報告していると疑われうるHARTデバイスなどをユーザが観察するために使用可能な診断ツールを実行する。ユーザは、アラート監視(alert monitor)ブラウザセクション94cを用いて、デバイスのポーリング、デバイスの故障または訂正する必要のあるパターンの監視などを行いうる。上述のデバイスをポーリングするためのアラート監視スクリーンが図11に示されている。ブラウザセクション94cのうちのアクティブアラート(active alert)部は、最近の観察によりアラート状態にあると考えられているデバイスすべてを記載し、デバイスポーリングリスト(device poll list)部は、アラート監視ツールによりポーリングされるデバイスすべてを記載する。いうまでもなく、アラート監視ツールは、主要サーバ62の中にまたは当該主要サーバ62へ接続されているコントローラの如き他のデバイスの中に格納されそれらによって実行されてもよい。さらに、いったん実行されると、図11のアラート監視ビューおよびそれに関連するアラートモジュール92bは、アラート情報を求めてポーリングし続け、この更新アラート情報を遠隔プラットホーム63におけるユーザに送信しうる。このようにして、遠隔プラットホームにおけるユーザは、プラント内で変化していくアラートデータを示すライブスクリーンを閲覧しうる。
The alert
さらに、プロセスプラント内で監査トレイル情報を閲覧するために、ブラウザセクション94dが用いられうる。この監査トレイル(audit trail)情報は、図12に示されているが、データベース90内に格納されるイベントとも呼ばれる履歴記録を含んでいる。所望ならば、これらのイベントは、デバイスタグに応じて表示されてもよいし、または、デバイスタグにより、物理デバイスにより、もしくは、システム全体に対して編成されてもよい。図4に例示された形式95dでは、イベントは、ALL、Application、Calibration、Configuration、Status Alerts、およびSystem Maintenanceを含む6つのタブに監査トレイル枠内でグループ化されている。これらの異なるタブは、これらのカテゴリの各々によりグループ化される監査トレイル情報の閲覧のために、選択または使用されうる。しかしながら、図4に記載されたものに代えてまたは加えて、監査トレイル情報の閲覧のために、他のグループまたは前もって決められたカテゴリを用いてもよい。
In addition, a
図13に例示されているスクリーンに示されているように、プロセスプラント内のいずこにデバイスが設けられていたとしても、これらのデバイスのデバイスタグリスト(device tag lists)およびそれに関連する情報を直接閲覧するために、ブラウザセクション94eが用いられうる。具体的にいえば、ブラウザセクション94eは、主要データ閲覧プラットホーム62によりデータが収集されるデバイスに関するさまざまなレポートを提供しうる。このデータは、製造業者、デバイスプロトコル、デバイスタイプ、およびデバイス更新により編成されるプラント内のデバイスの在庫品目すべてを記載するAll Devices、プラントデータベース90内の制御モジュールに割り当てられているデバイスを記載するAssigned Devices、プラントデータベース90から取り除かれプラントデータベース90への割り当てに利用可能でないデバイスを記載するDecommissioned Devices、およびプラントデータベース90内の制御モジュールに現在割り当てられているデバイスを記載するSpare Devicesのカテゴリを用いてアクセスされてもよいしまたは報告されてもよい。さらに、これらのデバイスに関するさまざまなタイプの情報(たとえば、監査トレイル情報、コンフィギュレーション情報、および校正情報)がプルダウンメニューを用いて閲覧されうる。いうまでもなく、ブラウザ領域94のセクション94eにより、ユーザは、関連するデバイスが設けられているプラントロケーションまたは物理ネットワークに関係なく、直接タグリスト形式で情報を閲覧することができる。したがって、セクション94a、94b、94e内のデータの閲覧に同一のタグリスト形式が用いられうるが、これらの異なるナビゲーションツリーセクションを通じて、異なるデータグループがアクセスされてもよい。
As shown in the screen illustrated in FIG. 13, even if devices are provided anywhere in the process plant, device tag lists of these devices and related information. The
校正ルート(calibration routes)、校正スケジュール(calibration schedules)などを含む校正情報の閲覧またはブラウジングに、ブラウザセクション94fが用いられうる。ブラウザ94のこのセクション94fは、(たとえばサーバ62に格納、実行されうる)校正保全方法と関連づけされている。この校正保全方法は、デバイスの性能を決定するためにデバイスを試験することと、仕様範囲内での実行させるためにデバイスを調整することとを含んでいる。この校正管理機能を支援するデバイスに対して校正履歴が利用可能である。Calibration Routesセクションは、データベース90と校正器との間で情報を交換するための手段を提供する。校正ルート情報スクリーンの一例が図14に示されている。この図には、Route1と呼ばれるある校正ルートに関連する情報がタグリスト形式を用いて示されている。ルートは、ドキュメント校正器または標準試験装置とともに用いられうる。いうまでもなく、ユーザは、ツリー94fのルートレベルから、システムにおいて定義された校正ルートを閲覧することができる。ツリービュー94fのあるルートを選択すると、関連するデバイスがタグリスト形式を用いてオブジェクト閲覧セクション95内に表示される。もちろん、実際に表示される情報は、たとえば(校正ルートに関連する)監査トレイル情報、校正ルートに関連するコンフィギュレーション情報、および校正ルートに関連する校正情報を含むように、ドロップダウンメニュー98を用いて変更されてもよい。
Browser section 94f may be used for browsing or browsing calibration information, including calibration routes, calibration schedules, and the like. This section 94f of the
ツリー94fのCalibration Schedule部では、プラントデータベース90内に格納されているデバイスの場所、前回校正日および次回校正日、校正が重篤(critical)か否かなどを含むデバイスの校正スケジュールの詳細が示されている。図15には、タグ(tag)によりデバイスを列記するとともに次回校正日時に基づいて、校正スケジュールスクリーンの一例が示されている。このスクリーン上のデータビューに掲載されている校正情報を変更するために、検索基準フィールド99が用いられうる。この検索基準フィールドを用いることにより、ユーザは、一または複数のデバイスに実行される前回校正または次回校正を閲覧することが可能となるとともに、ある年月日よりも以前(On or Before)、ある年月日から以後(On or After)、二つの年月日の間(Between)などの如き、校正情報を検索する時間枠を選択することが可能となる。これに加えて、検索基準フィールド99を用いることにより、ユーザは、すべての校正イベント、重篤な校正イベント、重篤でない校正イベントなどを検索することが可能となる。
In the Calibration Schedule section of the tree 94f, details of the device calibration schedule including the location of the device stored in the
さらに、ブラウザセクション94gを用いることにより、ユーザは、前もってセットアップまたは設定してある情報をブラウジングすることが可能となる。この情報は、ユーザが閲覧を希望するとともに各ユーザ特有の(すなわち、ユーザによって異なる)情報としてユーザによりセットアップされるいかなる情報であってもよい。ブラウザ94のこのセクションは、特定の興味に基づいて生成される問い合わせの結果を特定のファイル名を付けて保存する機能をユーザに提供し、これにより、ユーザは、同一のレポートをあとで閲覧することができる。
Furthermore, by using the
図4には詳細に示されていないが、ブラウザセクション94は、Help情報と、(ユーザおよびユーザの資格に対して割り当てられるセキュリティにアクセスする)Security and Administrationアクセスと、(プラントネットワーク全体を通じてデータベース90に対して遠隔から同時にアクセスするユーザの数を制限する機構を提供する)ライセンス検証とをさらに備えうる。もちろん、所望ならば、図16に示されているような選択メニューが、上記のデータ情報スクリーンのうちの一または複数に関連する表示画面パラメータおよびデータ取得パラメータを指定するためにセットアップされ、設定されてもよい。もちろん、ある遠隔サイトにおける表示にあたって、どのデータをどれだけサーバ62から取得するかの決定をその遠隔サイトのユーザの選択項目に基づいて行うために、この選択データが、ウェブモジュール92により用いられてもよい。
Although not shown in detail in FIG. 4, the
さらに、オブジェクトブラウザ94のSearchタブからアクセスされうるサーチエンジンは、タグ詳細、製造業者、整理番号などのごとき任意の所望の基準に基づいてデータベース90を検索することができる。この検索の結果はオブジェクト閲覧領域95上に表示されうる。図17には、サーチ(search)エンジンおよびサーチ表示スクリーンの一例が示されている。この図では、デバイスタイプ、製造業者、更新、タグ名、整理番号、対応通信プロトコル、デバイス割当の有無、予備品、廃棄などに基づいた検索機能が示されている。もちろん、主要データ可視化プラットホーム62を通じてデータベース90の検索を実行するにあたって、いかなる他のサーチスクリーンおよび検索基準ならびにいかなる適切なタイプのサーチエンジンが提供されて用いられてもよい。
Further, a search engine that can be accessed from the Search tab of the
いうまでもなく、オブジェクト閲覧領域95内のデータは、複数の形式のうちのいずれか一つの形式で表示されうる。上述のタグリスト形式は、データが属するデバイスに関連するタグに基づいてデータを表示する最も汎用な形式のうちの一つである。このタグリスト形式は、いずれかのArea/Unit/Control module/Equipment stringに関連するタグリストを提供するためにオブジェクトブラウザ(object browser)領域94から用いられてもよいし、あるルートまたは選択されたルートのタグが列記されるRoutesノードから用いられてもよいし、サーチ基準を充足するタグを列記するサーチスクリーンまたはサーチツールから用いられてもよいし、いずれかの物理階層構造に関連するタグリストを表示する、ブラウザ領域94の物理ネットワークセクション94bから用いられてもよい。一般的にいえば、タグリスト表示形式から、ユーザは、選択ボックスセクション(たとえば、図6の選択ボックス97)を用いて一または複数のタグを選択し、その選択されたタグに関連する監査トレイル情報、コンフィギュレーション詳細、コンフィギュレーション要約、校正試験イベントなどについてのさらに詳細な情報を取得することができる。
Needless to say, the data in the
他の閲覧形式としては、閲覧中のアクティブアラートまたはデバイスポーリングが実行中か否かに基づいて情報を表示するAlert Monitor形式および上述の6つのカテゴリのうちの一つに基づいてデータを表示しうる監査トレイル形式が挙げられる。 Other viewing formats may include displaying data based on an Alert Monitor format that displays information based on whether active alerts being browsed or device polling is in progress and one of the six categories described above. Audit trail format.
したがって、上述の遠隔データのアクセスおよび閲覧方法により、使い方が簡便となるとともに、主要データ収集・可視化プラットホーム62により収集されたデータを一または複数の遠隔サイト63から当該遠隔サイト63において主要データ収集ソフトウェアをフルに搭載することなく簡単にアクセス可能となる。また、このようなアクセスにより、ユーザは、所定のタイプのデータを所定のタイプの閲覧形式で取得することによりインターネットエクスプローラの如き標準型ウェブブラウザを通じたプラント資産の管理を行うことが可能となる。
Therefore, the above-described remote data access and browsing method makes it easy to use, and collects data collected by the main data collection /
具体的にいえば、以上のように、遠隔サイトアクセス方法により、マウスの右側ボタンおよび左側ボタンを選択し簡単なナビゲーションツリーを制御することにより、履歴データがプラントデータベース内に格納されているデバイスのリストにアクセスする機能、簡単なナビゲーションツリー制御画面上のアイコンを選択することにより、物理接続により編成されているデバイスのリストにアクセスする機能、およびプラットホームのデータベースに接続されうるまたはその中に履歴データが格納されうるデバイスについての問い合わせを主要データ収集・可視化プラットホームに対して行うためにサーチスクリーンにアクセスする機能が使用可能となる。さらに、本明細書記載の遠隔サイトアクセス方法により、簡単なナビゲーションツリー制御画面内のアイコンを選択することにより、フィールドデバイスの特定レポートにアクセスする機能、簡単なナビゲーションツリー制御画面内のアイコンを選択することにより、現在アラート状態にあるデバイスを遠隔から閲覧する機能が使用可能となる。同様に、このアラート閲覧ウインドウにより、どのデバイスのステータス変更情報のビューであっても絶えず更新されるので、当該デバイスのステータスを遠隔サイトからリアルタイムで閲覧することが可能となる。 Specifically, as described above, by using the remote site access method, the right and left buttons of the mouse are selected to control a simple navigation tree, so that the history data of the device stored in the plant database is controlled. The ability to access the list, the ability to access the list of devices organized by physical connection by selecting an icon on the simple navigation tree control screen, and the historical data that can be connected to or within the platform database The ability to access the search screen to query the primary data collection and visualization platform for devices that can be stored. Further, by the remote site access method described in this specification, by selecting an icon in a simple navigation tree control screen, a function for accessing a specific report of a field device, an icon in a simple navigation tree control screen is selected. This makes it possible to use a function for remotely browsing a device that is currently in an alert state. Similarly, since this alert browsing window is constantly updated in any status change information view of any device, the status of the device can be browsed in real time from a remote site.
さらに、デバイスのリストを示す表示画面から、ユーザは、選択されたフィールドデバイスに関するデバイス履歴情報(監査トレイル)のページを検索する資格を有している。同様に、遠隔サイトにおいて、遠隔ユーザが権限を有するユーザである場合、当該ユーザは、デバイスのリストを示す表示画面からデバイス情報に変更を加える資格を有する。また、ユーザは、閲覧中のデバイスが従来型の(非スマート)デバイスであるかまたは(HARTプロトコル、Fieldbusプロトコル、もしくはProfibusプロトコルの如きデジタル通信プロトコルを用いて通信される)スマートフィールドデバイスであるかに関係なく、監査トレイルとして格納されるそのデバイスの情報の履歴を取得する資格を有している。同様に、ユーザは、いずれのフィールドデバイスの格納設定パラメータに対してもアクセスすることができる。設定データの形式は、前もって定義された共通形式であってもよいし、またはデバイスのタイプに特有の形式であってもよい。さらに、ユーザは、主要データベース内に格納されている校正情報および校正記録にアクセスしうる。これに加えて、デバイス履歴情報のページから、ユーザは、特定のデバイス記録に目を通し、主要データベース内に格納されているイベントに関する詳細を理解する資格を有する。特定の詳細スクリーン内において、ユーザは、要約情報を求めて選択したデバイスの時間枠を前後に移動する資格を有しうる。また、ユーザは、デバイス情報記録を求める年月日をさらに特定する範囲を入力し、その選択機銃で選択されたデバイスのリストを調整する資格を有する。 Further, the user is entitled to search a device history information (audit trail) page related to the selected field device from the display screen showing the list of devices. Similarly, if a remote user is an authorized user at a remote site, the user is eligible to make changes to device information from a display screen showing a list of devices. Whether the user is a traditional (non-smart) device or a smart field device (communicated using a digital communication protocol such as the HART protocol, Fieldbus protocol, or Profibus protocol) Regardless of the device, it is eligible to obtain a history of the device information stored as an audit trail. Similarly, the user can access the stored configuration parameters of any field device. The format of the setting data may be a common format defined in advance, or may be a format specific to the type of device. In addition, the user can access calibration information and calibration records stored in the main database. In addition, from the device history information page, the user is entitled to read specific device records and understand details about events stored in the main database. Within a particular detail screen, the user may be eligible to move back and forth through the time frame of the selected device for summary information. The user is also entitled to enter a range that further specifies the date for which device information is sought and to adjust the list of devices selected with the selected machine gun.
図10および図15の校正スクリーンに関連して示されているように、ユーザは、フィールドデバイスに対して実施された校正イベントの高いレベルの要約情報を検索する資格を有する。要約情報画面から、ユーザは、一または複数の特定の校正レポートを選択し、所望ならばこれらのレポートをその場のプリンタで印刷することができる。同様に、簡単なツリー制御画面から、ユーザは、期限の切れのまたは将来の特定時間内に期限が切れる校正情報を検索し、その校正情報のレポートを印刷することができる。 As shown in connection with the calibration screens of FIGS. 10 and 15, the user is eligible to retrieve high level summary information of calibration events performed on the field device. From the summary information screen, the user can select one or more specific calibration reports and print these reports on an in-situ printer if desired. Similarly, from a simple tree control screen, the user can search for calibration information that has expired or will expire within a specific time in the future, and print a report of that calibration information.
以上のように、主要データ収集・可視化プラットホーム62から取得されうるデータは、複数の異なるデータ供給源からのデータからなりうる。これらの異なるデータ供給源からのデータを容易に閲覧・アクセスする目的で、これらのデータを主要サイト62および遠隔サイト63におけるブラウザに統合するために統合ナビゲーションツリーが用いられうる。したがって、図5から図15に示されているもの以外に他のナビゲーションツリー構造をブラウザセクション94内で用いることにより、複数の異なるデータ供給源からのデータを遠隔から閲覧することが可能となる。図18には、データ供給源に応じて設定されている3つの異なるアプリケーション、すなわちAMSSUITEインテリジェントデバイスマネジャーでありうる保全アプリケーション(AMS)と、AMSSUITEマシン調子マネジャーでありうる電源装置監視・診断アプリケーション(RBM)と、AMSSUITE装置性能監視器でありうるプラント効率監視アプリケーション(e−fficiency)とからのデータにアクセスし、閲覧するために構築された統合ナビゲーションツリー100の一例が示されている。いうまでもなく、この統合ナビゲーションツリー100は、データ供給アプリケーション60(図2)の各々からのアプリケーションデータを分類するカテゴリと、これらのカテゴリに関連するプロセスプラント内のエンティティを表す表記記号とを備えている。
As described above, the data that can be acquired from the main data collection /
いうまでもなく、統合ナビゲーションツリー100は、Enterprise(または、最高位)の真下に異なるアプリケーション(図2のアプリケーション60)の各々に対して高位カテゴリを有し、また、異なるアプリケーション(60)の各々のナビゲーションツリーに依存しかつ事実反映する、高位カテゴリ下にあるサブカテゴリのデータを有している。したがって、AMS Plant Structuresのタイトルを有するフォルダと、その下にあるフォルダまたはカテゴリ102は、保全(AMS)アプリケーションからのデータと関連している。同様に、RBM Plant Structuresのタイトルを有するフォルダと、その下にあるフォルダまたはカテゴリ104は、電力装置監視(RBM)アプリケーションからのデータと関連している。さらに、e−fficiency Plant Structuresのタイトルを有するフォルダと、その下にあるフォルダまたはカテゴリ106は、効率監視(e−fficiency)アプリケーションからのデータと関連している。もちろん、制御アプリケーション、回転装置監視アプリケーションなどの如き他のアプリケーションからのデータを反映するために、さらなるフォルダおよびサブセクションが設けられてもよい。
Needless to say, the
図18では、サブセクション102、104、106の各々は、データの供給源であるアプリケーションのナビゲーションツリーの階層構造を反映させる階層構造に構成されたサブフォルダまたはアイテムを備えている。したがって、サブセクション102は、保全アプリケーション(主要データ収集・可視化プラットホーム62内で用いられるデータ収集アプリケーションでありうるAMSアプリケーション)がこれらのカテゴリを有するナビゲーションツリー構造を用いているので、Area(Area1)、Units、Equipmnent Modules,およびControl Modulesのためのフォルダを備えている。さらに、保全アプリケーションから受信されたデータは、それが実際の保全アプリケーション内で編成されるので、サブセクション102内のサブカテゴリに伝送される。たとえば、データが存在するControl Modules(TT−111、TT−222、etc)はサブセクション102内のControl Moduleフォルダ下に示されている。
In FIG. 18, each of the
同様に、電力装置監視アプリケーションに関連するデータは、関連するアプリケーションのナビゲーションツリー構造を用いて示されている。このナビゲーションツリー構造には、デバイス(たとえば、ポンプ、送風機、モータ、およびドライヤー)が搭載されている領域のみの記号表記を有している。したがって、電力装置監視アプリケーションによりプラント内でデータが収集される複数の電力装置の各々は、サブセクション104のうちのArea1の部分に記載されている。同様に、e−fficiencyアプリケーションがS88の階層カテゴリにナビゲーションツリーを用いないので、このアプリケーションにより監視されているポンプ(pump)、コンプレッサ(compressor)、熱交換機(heat exchanger)などは、効率監視のロジカル機能に関連づけされて、e−fficiencyPlantStructure106のラベルを有する一般フォルダ下に示されているにすぎない。いうまでもなく、Pump#3の如き同一の装置が、異なるアプリケーションにより監視されてもよいので、統合ナビゲーションツリー構造100内に複数回示されてもよい。さらに、同一のデバイスまたは他のプラントのエンティティの同一のデータまたは異なるデータ(たとえば、異なるアプリケーションにより収集または生成される異なるデータ)が、統合ナビゲーションツリー100の異なる場所においてアクセス可能である。もちろん、いうまでもなく、他のデバイスがこれらのセクションに関連するアプリケーションにより認識、監視される場合、サブセクション102の各々に関連する他のエンティティまたはフォルダが存在してもよい。したがって、サブセクション102、104、106のうちのいずれかのサブセクション内のデバイス説明の如き実際のデータは、実際のアプリケーションにより監視されているデバイスまたは他のエンティティに依存する。さらに、ナビゲーションツリー100を通じてアクセスしうるこれらのデバイスに関するデータタイプは、実際のアプリケーション60により収集または生成されるこれらのデバイスについてのデータに依存する。
Similarly, data related to the power device monitoring application is shown using the navigation tree structure of the related application. This navigation tree structure has a symbol notation only for areas where devices (for example, pumps, blowers, motors, and dryers) are mounted. Accordingly, each of the plurality of power devices for which data is collected within the plant by the power device monitoring application is described in the
図19には、主要データ収集・可視化プラットホーム62に対してデータを送信する異なるアプリケーションのナビゲーションツリー構造の各々から統合アプリケーション86(図2)により自動的に生成されうる統合ナビゲーションツリー120の他の一例が示されている。この場合、異なるアプリケーションからのデータは、機械装置122、フィールド装置124、および性能監視装置126の如きロジカル領域に分かれている。これらの副領域に関連する異なるアプリケーションからのデータは、たとえばデフォルトS88階層構造またはデータの発生源であるアプリケーションの階層構造に従って副領域へマッピングされる。したがって、たとえば電力装置監視アプリケーションから通常受信されるメカニカルデータは、そのアプリケーションの階層構造に従ってマッピングされ、フィールド計装装置124は、データを提供する保全アプリケーションまたは制御アプリケーションの階層構造、この場合には、S88階層構造に従ってマッピングされる。同様に、効率データは、効率アプリケーション階層構造に従ってマッピングされる。もちろん、この場合、異なるアプリケーションからのデータは、ある程度、異なるロジカルな見出しまたは装置ベースの見出しの下に融合されてもよい。したがって、制御アプリケーションおよび保全アプリケーションにより測定されるバルブ、トランスミッタなどに関するデータの如き制御アプリケーションおよび保全アプリケーションからのデータは、フィールド計装装置カテゴリ124およびこのカテゴリに付随するサブカテゴリの下に統合されうる。
FIG. 19 illustrates another example of an
以上のように、統合アプリケーション86は、統合ナビゲーションツリー83bと異なるアプリケーション60の各々のナビゲーションツリー83aとの間のマッピング方法の作成に用いられうる。統合アプリケーション86は、このマッピングを自動的に実行してもよいし、または、ユーザに、アプリケーション60のナビゲーションツリー83aの異なるコンポーネントと統合ナビゲーションツリー83bとの間のマッピングの指定を可能としてもよい。図20には、ユーザに、主要データ収集・可視化プラットホーム62にデータを伝達すべくなしてある異なるアプリケーションの各々に対してあるタイプのマッピングの指定を可能とするように、統合アプリケーション86によりユーザへ提示されうるスクリーン表示画面140の一例が示されている。
As described above, the
図20のスクリーン表示画面140の左側には、異なるデータ供給源からのデータのアクセスを可能にするために主要データ収集・可視化プラットホーム62により用いられる統合ナビゲーションツリー142が示されている。いうまでもなく、この統合ナビゲーションツリー142は、S88標準規格により定義されているカテゴリを用いている。しかしながら、所望ならば、ユーザは、上記のツリー142内に表示されているフォルダの改名、フォルダの追加、フォルダの削除などの如き任意の所望の方法を用いて統合ナビゲーションツリーに対して他のカテゴリまたは異なる階層構造を指定してもよい。スクリーン表示画面140の右側には、プラント10内の異なるアプリケーションに関連し、必要に応じて、プラント10内の異なるアプリケーションから取得されるナビゲーションツリー構造が示されている。いうまでもなく、これらのナビゲーションツリーには、一般カテゴリのみならずデバイスの如きプロセスエンティティが表示されうる。図20には、保全アプリケーション(AMSアプリケーション)用のナビゲーションツリー構造144および電力装置監視アプリケーション(RBM)用のナビゲーションツリー構造146が示されている。興味深いことには、保全アプリケーションのナビゲーションツリー構造144ではS88標準規格のカテゴリが用いられ、電力装置監視アプリケーションのナビゲーションツリー146ではS88標準規格のカテゴリが用いられない。
On the left side of the
いずれの場合であっても、ユーザは、ツリー144のコンポーネントの表示画像を選択し、マッピング先のツリー142のコンポーネントの表示画像上にドラッグ・アンド・ドロップすることにより、ツリー144の如きナビゲーションツリーのコンポーネントを統合ナビゲーションツリー142上にマッピングしうる。もちろん、これに加えてまたはこれに代えて、ナビゲーションツリーのコンポーネント間の関係を選択・指定するための他の方法が用いられてもよい。このあと、統合アプリケーション86は、ツルー144内で選択されてドラッギングされているエレメントおよびサブエレメントをドロッピング先の統合ツリー142の部分と関連づけする。もちろん、ユーザは、いかなる所望のマッピングを行ってもよく、たとえば保全ツリー144の領域を統合ツリー142の領域へ移動させることに限定されない。同様に、ユーザは、電力装置監視ツリー144のコンポーネントを統合ツリー142のコンポーネントのうちのいずれか上にマッピングしうる。あるマッピングを選択、指定すると、統合アプリケーション86は、マッピングの指示情報を格納し、このマッピングを用いて、アプリケーションからのデータをデータベース80に統合し、統合ナビゲーションツリー142を通じたそのデータの閲覧を可能とする。
In any case, the user selects the display image of the component in the
図21には、統合アプリケーション86により、自動的に、または、ユーザが図20のスクリーン表示画面140を用いて異なるアプリケーション60の異なるナビゲーションツリーからのデータを統合する方法を指定することにより作成されうる統合ツリー150の一例が示されている。図21に示されているように、ナビゲーションツリー150の制御モジュール部または制御モジュール部門152には、保全アプリケーションからのバルブ(TT−111、TT−222など)、電力装置監視アプリケーションからの送風機、ポンプ、モータ、ドライヤー(Recrec Pump#5、Exhaust Fan#1など)、ならびにプラント効率監視アプリケーションからのコンプレッサおよび熱交換機(Compressor#1、Heat Exchanger#1など)を含む、複数の異なるアプリケーションの各々からのデバイスまたは他のエレメントが含まれている。もちろん、異なるアプリケーションからの他のプラントエンティティが統合ツリー150の異なるセクションまたはサブセクションの下で一緒の所に分けられてもよい。一例としては、Areaセクション下における異なるアプリケーションの領域が挙げられる。もちろん、これらの異なるアプリケーションの各々に関連するデバイスデータがツリー150の制御モジュールセクション下で統合されるべきであることを指定するために、図20のスクリーン140に類似するスクリーンを用いることができた。同様に、これらの異なるアプリケーションからの領域データが統合ツリー150の領域の表記記号の下で統合されうることを示すために、スクリーン140に類似するスクリーンが用いられてもよい。
21 can be created by the
図22には、異なるアプリケーション60からのデータを統合するために統合アプリケーション86により作成されうるとともにウェブ通信ネットワークを通じてアクセス可能な統合ナビゲーションツリー162を備えたさらなるスクリーン表示画面160が示されている。このナビゲーションツリー162は、複数のシステムユーザによるウェブブラウザを通じた内部データの利用を可能とするコンフィギュレーションシステムに関連づけされてもよいし、または、それにより作成されてもよい。ナビゲーションツリー162の一例は、資産データベースフォルダ166と、データ供給源フォルダ168と、関連リンクフォルダ170とを有するブラウザコンフィギュレーションセクション164を備えている。資産データベースフォルダ166は、プロセスプラント内の一または複数の資産に関するデータを格納または包含しうるし、データ供給源フォルダ168は、プロセスプラント内の異なるデータ供給源から収集されるデータを包含または格納しうる。図22のコンフィギュレーションツリー162がアクセスするデータ供給源は、「Cool」、「dasdasd」、「fdasdasd」、「MDC」、および「pppp」の符号がふされている。資産データベースフォルダ166およびデータ供給源フォルダ168は、図2に関連して先に記載されたように、異なるアプリケーションまたは資産からデータを収集し、このデータを、たとえばウェブ接続を通じてコンフィギュレーションスクリーン表示画面160にアクセス可能なユーザが当該データを利用できるような方法で異なるサブフォルダ内に加える。
FIG. 22 shows a further
関連リンクフォルダ170は、プロセスプラント内のデータもしくは資産のうちのいずれかに関連する、または、上記のデータもしくは、ナビゲーションツリー162によりデータが格納あるいは収集される資産のうちのいずれかに関連する他のアプリケーション、ドキュメンテーション、またはシステムへのウェブリンクの如きリンクを格納しうる。具体的にいえば、関連リンクフォルダ170は、ナビゲーションツリー162内に格納されるまたはそれを通じてアクセス可能なデータまたは他の情報になんらかの方法で関連づけされうる他のデータ、他のアプリケーション、ドキュメンテーションなどに対して容易にアクセスできるようにするためにシステムユーザにより入力されるリンクを格納しうる。もちろん、権限を有するユーザまたはコンフィギュレーションエキスパートは、ナビゲーションツリー162内にリンクを加えてもよいし、また、これらのリンクは、何時、追加されてもよいしまたは削除されてもよい。
The
異なるデータ供給源からデータを収集するためにナビゲーションツリー162をセットアップする場合、ユーザは、データ供給源から収集されるべき複数のデータタイプならびにこれらの供給源から収集されるべきデータの量および頻度を指定しうる。
When setting up the
統合ナビゲーションツリーが資産最適化データベースのために構築されている場合、図2のプログラムまたはアプリケーション84の如きユーザインターフェイスプログラムまたはユーザインターフェイスアプリケーションは、資産データベース内に格納されているまたは統合されかつ一貫性のある方法で主要プラットホーム62もしくは遠隔プラットホーム63のうちの一つにおいて異なるアプリケーションからユーザに提供されるプロセスプラントに関連する資産についての情報を提供するので、ユーザは、そのデータまたはそのデータの一部を分かりやすい方法で閲覧することができる。異なる資産に関連するデータの量が非常に多い場合があるので、ある時間にすべてのデータを閲覧するのではなく、ユーザが調査または使用を希望するデータのみを閲覧または検索することができるということが重要である。しかしながら、ユーザが異なるデータ供給源により収集されるまたは異なる資産について収集される異なるデータを、データの閲覧する部分とは関係なく、一貫性のある形式で閲覧できるということが望ましい。しかしながら、依然として、ユーザが異なるデータ供給源により収集されたまたは異なる資産について収集された異なるデータをデータの閲覧部分とは関係なく一貫性のある形式で閲覧できるということが望ましい。したがって、インターフェイスアプリケーションまたは表示画面アプリケーション84では、興味のあるデータのみを閲覧および検索することを可能とするためにナビゲーションツリー階層構造が用いられる。このようにして、プラント内の資産の全部のまたは一部のサブセットについての情報、たとえばこれらの資産が設置されているところ、アラート、またはこれらの資産に関連するイベント履歴がユーザに提供されうる。しかしながら、ユーザアプリケーション84では、ユーザがどの部分のデータを閲覧しているかに関係なく、共通のかつ一貫性のある表示画面および検索形式が用いられる。
If the integrated navigation tree is built for an asset optimization database, a user interface program or user interface application, such as the program or
図23には、資産最適化データベースからのデータを統合的に閲覧するためにユーザインターフェイスアプリケーション84によりユーザに対して提示されうるスクリーン表示画面200の一例が示されている。さらに、所望ならば、このスクリーンが遠隔サイト63において用いられてもよい。具体的にいえば、スクリーン表示画面200は、3つの主要小見出し(すなわち、「Asset Database(資産データベース)」、「Data Sources(データ供給源)」、および「Favorites(お気に入り)」)を含むナビゲーションツリーを有するナビゲーションツリーセクション202と、ナビゲーションツリーセクション202内の選択されたエレメントの資産についての情報を提供する情報セクション204とを備えている。
FIG. 23 shows an example of a
たとえば図23に例示されているスクリーン200では、全データベースに関連する最高位のカテゴリ(すなわち、「Asset Optimization(資産最適化)」)が選択されているので、3つのサブカテゴリの各々からのデータのすべてが情報セクション204の中に含まれている。しかしながら、情報セクション204は、このデータを、「Assets(資産)」、「Active Alert(アクティブアラート)」、および「Event History(イベント履歴)」のタイトルが付与された3つのタブに分けている。これらのタブでは、資産データベースに格納されているデータが異なる形式またはビューで表示される。スクリーン200ではAssetsタブが選択されているので、情報ビュー204は、ナビゲーションツリー202の選択されたエレメント内の資産(assets)の各々に対するAssetsデータを表示している。この場合、図23の情報ビュー204に示されている資産ビューは、資産最適化システムに関連する資産すべてについての情報を含んでいる。具体的にいえば、資産の総数(2743)が、これらの資産の各々の名称、タイプ、調子指標、説明、および場所とともに表示されている。基本的に、この名称は、資産に付けられる(データが収集されるプラントまたはプラント群の中において固有の)名称である。調子指標は、資産それ自体によりまたは資産最適化システム内で測定される資産の調子についての指標または他の数的な情報を提供する。各資産のタイプ情報、説明情報、および場所情報も表示される。もちろん、資産のすべてが同一のスクリーンに納まるわけではないので、情報ビュー204の下方部で数値1,数値2,数値3などにより示されているように、資産情報を表示するためにさらなるスクリーンが提供されうる。
For example, in the
図24には、資産最適化データベース内の資産のすべてに対するActive Alertタブを示す情報ビュー208を有するスクリーン206が示されている。図24に示されているように、アクティブアラートは表を用いて表示されている。この表の最上方部には、アラートの数(22)が表示され、また、各アラートに対して、年月日/時間、資産名、(アラートの重篤度またはアラートのタイプを示す)重篤度指標、アラートの説明、およびプロセスプラント内のアラートの発生場所が表示されている。もちろん、これらのアラートは、年月日/時間の順、重篤度の順、発生場所の順などの如きいかなる順番で提示されてもよい。所望ならば、ユーザインターフェイスアプリケーション84は、アラームまたはその他のアラートでありうる各アクティブアラートの隣に欄(図24に図示せず)を設け、ユーザに、そのアラームまたは他のタイプのアラートに対して受信了承応答することを可能としてもよい。また他の方法として、ユーザインターフェイスアプリケーション84は、ユーザがあるアラームまたはアラートを選択したときにポップアップウインドウまたはポップアップ表示画面を提示することにより、ユーザに、このポップアップウインドウを通じてそのアラームまたはアラートに対して受信了承応答することを可能とするが如き、その他の方法で情報フィールドに表示されたアラームおよびアラートに対して受信了承応答する機能を、ユーザに提供してもよい。ユーザがアラームまたはアラートに対して受信了承応答をすると、ユーザインターフェイスアプリケーション84内の通信アプリケーションは、通信ネットワーク61を通じて受信了承応答信号をデータ収集エンティティまたはそのアラームもしくはアラートを作成または送信したデータ供給源へ送信することにより、そのアラームまたはアラートに対する受信了承応答をする。このような受信了承応答信号は、受信了承応答信号のために今日用いられている公知の形式のうちのいずれの形式を用いてもよいが、メッセージに同封されて図2の通信ネットワークを通じて送信される。
FIG. 24 shows a
同様に、図25には、資産最適化データベース内の資産のすべてに対して生成されるイベントについての情報をこの場合には提供しているEvent Historyタブビューを示す情報ビューを有するスクリーン210が示されている。情報ビュー212に示されているように、イベント履歴形式には、(イベント履歴データベースに格納されている)各イベントに対する、イベントの年月日/時間、イベントに関連する資産名、イベントのタイプ、イベントの説明、およびイベントの発生場所が含まれる。いうまでもなく、このビューに表示されるイベントは、ステータスもしくはアラートの生成、資産の設定の変更、プラント内で行われる同期、校正、もしくはその他の活動、プロセスプラントに関連するたとえばコンフィギュレーションデータベースもしくは他のデータベースの内に格納されるまたはそれらにより収集されるその他のイベントの如きプロセスプラント内の一または複数の資産に関連するいかなるイベントであってもよい。もちろん、その他のタブと同様に、イベント履歴タブ情報は、年月日/時間、資産、イベントのタイプ、イベントの発生場所、またはイベントのその他所望の属性に従うことを含むいかなる所望の方法で編成または表形式にされてもよい。
Similarly, FIG. 25 shows a
図26には、資産最適化データベースに関連する資産の一部に関する資産情報のような低いデータ統合レベルの資産情報をユーザに提供するさらなるスクリーンが示されている。具体的にいえば、ナビゲーションツリー202の資産データのフォルダが展開されて、データが収集されるプラントの3つの領域のとして資産データベース下に3つの資産サブカテゴリの存在を示している。これらの3つの領域は、「Northeast Area」、「Northwest Area」、および「Southwest Area」のタイトルが付されている。Northeast Areaのフォルダが選択されているので、情報ビュー218には、Northeast Areaに関連する資産からのデータを含むAssetsタブビューが表示されている。図11から明らかなように、Northeast Areaには、各々がフィールド装置であるmotor1、motor2、およびTT−3044Cの名称が付けられた3つの資産が含まれている。もちろん、情報ビュー218においてActive AlertタブまたはEvents Historyタブを選択すると、Northeast Area内のみの資産のアクティブアラートデータまたはイベント履歴データが表示される。というのは、それが、ナビゲーションツリー202において選択されているサブセット情報の(すなわち、データ統合レベル)だからである。同様に、ナビゲーションツリー202内のNorthwest AreaのフォルダまたはSouthwest Areaのフォルダを選択すると、これらの二つの領域のみに関する資産情報が表示される。
FIG. 26 shows a further screen that provides a user with low data integration level asset information, such as asset information for some of the assets associated with the asset optimization database. Specifically, the asset data folder in the
もちろん、図26に表示されている情報は、この情報が異なるデータ供給源により収集されうるにもかかわらず、資産データベース内に実際に格納されている情報である。この結果、図23から図26の情報ビューにより、ユーザは、資産データベースに格納されている資産情報を閲覧することができる。 Of course, the information displayed in FIG. 26 is the information actually stored in the asset database even though this information can be collected by different data sources. As a result, the user can view the asset information stored in the asset database using the information views of FIGS.
あるいは、ユーザは、資産に関するデータを、このデータが収集される方法に従って、すなわちこのデータを収集するデータ供給源に従って閲覧しうる。そうするために、ユーザは、ナビゲーションツリー202内のData Sourceフォルダを選択しうる。図27に示されているように、Data Sourceフォルダが選択されると、ユーザに対して表示される情報は、資産情報を提供または収集するデータ供給源に関連づけて編成される。したがって、図27のスクリーン表示画面220では、データがデータ供給源すべてに関連づけされてAssetsタブビューが示されている。
Alternatively, the user may view the data regarding the asset according to the way in which this data is collected, i.e. according to the data source collecting this data. To do so, the user can select a Data Source folder in the
図27に示されているように、ナビゲーションツリー202は、AMS Area1データ供給源、AMS Area2データ供給源、CSI1データ供給源、およびE−fficiencyデータ供給源の名称が付与された4つのデータ供給源を備えており、これらのデータ供給源は、資産データベースへデータを提供する図2のデータ供給源とは異なりうる。したがって、いうまでもなく、CSI1データ供給源の如き異なるデータ供給源をナビゲーションツリー202において選択すると、選択されたデータ供給源に関連する資産情報のみが表示される。一例として、図28には、データ供給源のうちのAMS Area1の部分に関するAssetタブビュー226を有するスクリーン224が示され、そこには、AMS Area1データ供給源により収集された資産情報のみが含まれている。この場合、Assetsタブビュー226は、MV−3095の名称が付与されたある資産についての詳細を含んでいる。もちろん、ここで、AMS Area1に関連するその他の資産またはAMS Area1データ供給源内のAMSにより収集される資産についての資産情報が提供されてもよい。さらに、Active AlertタブまたはEvent Historyタブを選択すると、AMS Area1データ供給源により収集されたアクティブアラートおよびイベント履歴の詳細が提供される。さらに、図27および図28のAssetタブビュー、Active Alertタブビュー、およびEvent Historyタブビューが図23〜図26の同一のビューのデータとは異なるデータを示しているにもかかわらず、これらのビューは、そのデータを、共通のまたは一貫性のある形式で表示する。このことは、ユーザによるデータの理解およびデータの検索を容易なものとする。
As shown in FIG. 27, the
もちろん、ナビゲーションツリー202のその他のフォルダまたはその他の部分を選択すると、ナビゲーションツリー202のそのフォルダまたは部分に関連する資産情報が示される。図29には、データ供給源のうちのいずれかからの提供されるお気に入り情報にアクセスするためにユーザにより構築されるフォルダであるお気に入りフォルダがそのサブカテゴリを示すために展開されている表示スクリーン230が示されている。この場合、Favoritesフォルダには、Maintenanceフォルダと、Newsフォルダと、Weatherフォルダとが含まれている。Maintenanceフォルダには、AMSアプリケーション(データ供給源)に関連する一または複数のウェブページを示すAMSwebフォルダが含まれている。AMSwebフォルダが選択されると、それに関連するウェブページが情報ビュー232に表示される。このようにして、他のウェブページまたは情報へのリンクが、資産データベースに格納されている資産情報またはデータ供給源により収集される資産情報と同一のスクリーン構造でユーザに提供されうる。同様に、資産最適化システムのユーザにとって役に立つ情報を提供するウェブサイトへの接続情報の如き他の情報供給源を、お気に入りフォルダの中に保存して、資産最適化システムまたは資産最適化スクリーンを通じてこれらの供給源への接続を可能としうる。
Of course, selecting another folder or other portion of the
いうまでもなく、図23〜図29のナビゲーションツリー202は、共通のかつ一貫性のある方法で異なるデータ供給源により収集される異なるデータおよび異なる資産についての異なる情報を閲覧するために、Assetsタブデータ形式、Active Alertsタブデータ形式、Event Historyタブデータ形式、またはその他のデータ形式とともに用いられうる。したがって、ユーザは、共通のかつ一貫性のある形式で(Assetタブを用いて)資産に基づいて、(Active Alertsタブを用いて)アクティブアラートに基づいて、(Event Historyタブを用いて)イベント履歴に基づいて、いかなる所望のタイプの資産データであっても閲覧することができ、それと同時に、ナビゲーションツリーを用いてビュー中に含まれるべきデータ量またはデータ統合レベルを制御することができる。ユーザは、ナビゲーションツリー内の高位のフォルダ(たとえば、資産データベースフォルダまたはデータ供給源フォルダ)を選択することにより高いデータ統合レベルでデータを閲覧し、その高いレベルのカテゴリに関連するデータすべてを一貫性のある方法で閲覧することができる。あるいは、ユーザは、資産データベースフォルダまたはデータ供給源フォルダのサブフォルダの如きナビゲーションツリー内の下位フォルダ(したがって、低いデータ統合レベル)を選択することにより、閲覧すべきデータ量を少なく、すなわちデータ統合レベルを低くできる上に、依然として、共通のかつ一貫性のある形式、すなわち高いデータ統合レベルに用いられる同一の形式で関連するデータを閲覧することができる。したがって、ユーザは、(Assetsタブビュー、Active Alertsタブビュー、またはEvent Historyタブビューを用いて)同じようにデータを閲覧することができるので、ユーザが閲覧を望むデータの統合レベルに関係なくデータを一貫性のある方法で閲覧することができる。この特徴により、資産データベース内での移動がユーザにとって容易かつ分かりやすいものとなる。
Needless to say, the
いうまでもなく、(アクセスされる情報がプロセスプラント10内の異なるアプリケーションにより提供されるデータである場合、)先に記載された統合ツリーまたはその他の形式の統合ナビゲーションツリーは、そのツリー内に記載されるデバイスまたはプラントエンティティのうちのいずれかについての情報またはデータにアクセスするために用いられてもよい。もちろん、上述の統合ナビゲーションツリーは、その内部に示されるエンティティについての情報の閲覧、その内部に示されたエンティティのデータの供給源の決定、その内部に示された異なるエンティティのためのアプリケーションの駆動、またはそのデータに対する他の活動の実行に用いられてもよい。同様に、本明細書に記載のAssets形式、Active Alerts形式、およびEvent History形式に加えて、他のデータ閲覧形式も同様に用いてもよい。
Needless to say, if the information being accessed is data provided by a different application in the
上述のように、本明細書記載の統合ナビゲーションツリーは、異なる統合レベルでプロセスプラント10内の異なるデータ供給源またはアプリケーションからのデータを統合するために任意の数の方法により構成されうる。したがって、一つの場合には、統合ナビゲーションツリーの異なるセクションは、資産最適化データベースに対してデータを提供する異なるアプリケーションまたはデータ供給源のために主に用いられるかまたは関連づけされる。しかしながら、統合ナビゲーションツリーの異なるセクションが制御機能、保全機能、回転装置機能、効率機能などに対して統合ナビゲーションツリーに異なるセクションが存在するように、統合ナビゲーションツリーの異なるセクションがプラントの異なるロジカル部分もしくはロジカル機能に関連づけされてもよいし、または、(保全アプリケーションまたは回転装置アプリケーションにより通常測定される)回転装置と(制御アプリケーションおよび保全アプリケーションにより通常測定される)バルブとがナビゲーションツリーの一つのセクションもしくはカテゴリに統合されるように、プラントの異なる部地理領域に関連するとともに存在するデバイスもしくはユニットが単一のセクションに統合されてもよい。同様に、異なるアプリケーションからの領域データ、ユニットデータ、装置データなどが、統合ナビゲーションツリーの同一のセクションまたはサブセクションに統合されてもよい。
As described above, the integrated navigation tree described herein can be configured in any number of ways to integrate data from different data sources or applications within the
本明細書の図2に示されている実施形態には異なるアプリケーションの各々に対して単一のサーバが示されているが、いうまでもなく、一つのアプリケーションに対して複数のサーバが提供されてもよいし、これらの異なるサーバすべてが、異なるブランチとして、一つのアプリケーションに関するデータを資産最適化サーバ62に提供してもよい。同様に、一つのアプリケーションに関連するデータベースまたはプラントが複数あってもよいし、また、資産最適化サーバ62がこれらの異なるデータベースからのデータをいかなる方法で受信して統合してもよい。
Although the embodiment shown in FIG. 2 of this specification shows a single server for each of the different applications, it will be appreciated that multiple servers are provided for a single application. Alternatively, all of these different servers may provide the
本明細書記載の主要データ収集・視覚化プラットホーム62の統合アプリケーション86およびその他のアプリケーションはソフトウェアで実現されることが好ましいが、これらのアプリケーションが、ハードウェア、ファームウェアなどで実現されてもよく、また、プロセス制御システム10に関連するいかなる他のプロセッサにより実行されてもよい。したがって、本明細書に記載されるエレメントは、標準型多目的CPUまたは、所望ならば、特定用途集積回路(ASIC)もしくは他のハードワイヤードデバイスの如き特別に設計されたハードウェアまたはファームウェアにより実現されてもよい。ソフトウェアにより実現される場合、そのソフトウェアルーチンは、磁気ディスク、レーザディスク(たとえば、CDもしくはDVD)、または他の格納媒体の如き任意のコンピュータ読取り可能メモリ内、コンピュータまたはプロセッサのRAMまたはROMの内、任意のデータベース内などに格納されうる。同様に、このソフトウェアは、たとえば、コンピュータ読み取り可能ディスクもしくは他の伝送可能なコンピュータ格納メカニズム、または電話回線、インターネットなどの如き通信チャネルを含む、いかなる公知のまたは所望の伝送方法を用いてユーザまたはプロセス制御プラントに伝送されてもよい(電話回線、インターネットなどの如き通信チャネルの利用は、伝送可能な格納媒体を介してこのソフトウェアを提供することと同一または互換性があるとみなされる)。
The
以上のように、本発明は特定の例を参照して記載したが、これらの例は説明のみを意図し、本発明を限定することを意図したものではなく、本発明の精神および範疇から逸脱することなく、開示された実施形態に変更、追加、または削除を加えうることは当業者にとって明らかである。 As described above, the present invention has been described with reference to particular examples, which are intended to be illustrative only and are not intended to limit the present invention, and depart from the spirit and scope of the present invention. It will be apparent to those skilled in the art that changes, additions, or deletions can be made to the disclosed embodiments without having to do so.
Claims (44)
前記複数のデータ供給アプリケーションの二以上が、異なるビジュアルユーザインターフェイス表示の形式(表示形態の形式)で、各々前記エンティティデータを提供するものであり、前記プロセスプラント内の前記一または複数の異なるエンティティに関するエンティティデータであって、前記異なるビジュアルユーザインターフェイス表示の形式のエンティティデータを含むエンティティデータを、前記データ供給アプリケーションから提供されて収集するように構成される、主要データ収集プラットホームと、
前記主要データ収集プラットホームにより収集された前記プロセスプラント内の前記一または複数の異なるエンティティに関するエンティティデータを格納するように構成されるデータベースと、
前記主要データ収集プラットホームに結合されるとともに前記データベースに格納された前記エンティティデータに一または複数の遠隔プラットホームから遠隔アクセスを行うように構成されるウェブサーバと、
コンピュータ読み取り可能メモリに格納されるとともに前記エンティティデータのための表示画面を作成するために前記一または複数の遠隔プラットホームのうちの一つ内のプロセッサ上で実行するように構成される表示アプリケーションとを備えており、
前記表示画面が、前記データベース内のエンティティデータの異なるカテゴリを指定する複数のセクションを有するナビゲーションツリーと表示ビューとを含んでおり、
前記表示アプリケーションが、ユーザに、表示されるべき異なるエンティティデータを指定するために前記ナビゲーションツリーの前記セクションから異なるセクションを選択することを可能とし、前記ナビゲーションツリーの選択されたセクションに関連する前記エンティティデータを前記表示ビューに所定の閲覧形式で表示するように構成され、
前記所定の閲覧形式として、多数の異なるビジュアルユーザインターフェイス表示の形式で同じカテゴリのエンティティデータを表示することなく、同じビジュアルユーザインターフェイス表示の形式で、前記表示されるべき異なるエンティティデータを指定するために選択された前記複数のセクションのそれぞれに関連するエンティティデータを表示するための、一または複数の共通のビジュアルユーザインターフェイス表示の形式を用いる、遠隔データ閲覧システム。A remote data browsing system of a process plant in which each of a plurality of data supply applications collects or generates entity data for one or more different entities,
Two or more of the plurality of data supply applications each provide the entity data in different visual user interface display formats (display format formats), and relate to the one or more different entities in the process plant a entity data, and said different visual user interface display format entity data including entity data of the data configured to collect available from supply application, the main data collection platform,
A database configured to store entity data collected by the primary data collection platform for the one or more different entities in the process plant;
A web server coupled to the primary data collection platform and configured to remotely access the entity data stored in the database from one or more remote platforms;
A display application stored in a computer readable memory and configured to execute on a processor in one of the one or more remote platforms to create a display screen for the entity data. Has
The display screen includes a navigation tree having a plurality of sections that specify different categories of entity data in the database and a display view;
The entity associated with the selected section of the navigation tree, allowing the display application to select a different section from the section of the navigation tree to specify different entity data to be displayed; Configured to display data in a predetermined viewing format on the display view;
As the predetermined viewing format, without displaying the entity data of the same category in many different visual user interface display format, with the same visual user interface display format for specifying the different entity data to be the display A remote data browsing system using one or more common visual user interface display formats for displaying entity data associated with each of the selected sections.
前記複数のデータ供給アプリケーションの二以上が、異なるビジュアルユーザインターフェイス表示の形式(表示形態の形式)で、各々前記エンティティデータを提供するものであり、前記プロセスプラント内の前記一または複数の異なるエンティティに関するエンティティデータであって、前記異なるビジュアルユーザインターフェイス表示の形式のエンティティデータを含むエンティティデータを、主要データ収集プラットホームにおいて前記複数のデータ供給アプリケーションから提供されて収集することと、
前記エンティティデータを、前記主要データ収集プラットホームに関連するデータベース内に格納することと、
前記データベースに格納された前記エンティティデータのうちの少なくとも一部を取得するために、前記主要データ収集プラットホームから地理的に離れた遠隔サイトから前記データベースにアクセスすることと、
前記データベース内の前記エンティティデータのカテゴリを指定する複数のセクションを含むナビゲーションツリーを前記遠隔サイトで表示することと、
前記遠隔サイトで、前記ナビゲーションツリーとともに、前記ナビゲーションツリーのセクションのうちの一つの選択に応答して所定の閲覧形式でエンティティデータを表す表示ビューを表示することと、
を含み、
前記所定の閲覧形式として、多数の異なるビジュアルユーザインターフェイス表示の形式で同じカテゴリのエンティティデータを表示することなく、同じビジュアルユーザインターフェイス表示の形式で、前記表示されるべき異なるエンティティデータを指定するために選択された前記複数のセクションのそれぞれに関連するエンティティデータを表示するための、一または複数の共通のビジュアルユーザインターフェイス表示の形式を用いる、方法。A method of browsing entity data generated within a process plant in which each of a plurality of data supply applications collects or generates entity data for one or more different entities, comprising:
Two or more of the plurality of data supply applications each provide the entity data in different visual user interface display formats (display format formats), and relate to the one or more different entities in the process plant Collecting entity data comprising entity data in the form of the different visual user interface representations provided from the plurality of data supply applications at a main data collection platform;
Storing the entity data in a database associated with the primary data collection platform;
Accessing the database from a remote site geographically remote from the primary data collection platform to obtain at least a portion of the entity data stored in the database;
Displaying a navigation tree at the remote site including a plurality of sections specifying categories of the entity data in the database;
Displaying a display view representing entity data in a predetermined viewing format in response to selection of one of the sections of the navigation tree along with the navigation tree at the remote site;
Including
As the predetermined viewing format, without displaying the entity data of the same category in many different visual user interface display format, with the same visual user interface display format for specifying the different entity data to be the display A method using one or more common visual user interface display formats for displaying entity data associated with each of the selected sections.
Applications Claiming Priority (5)
| Application Number | Priority Date | Filing Date | Title |
|---|---|---|---|
| US10/394,683 US7493310B2 (en) | 2002-12-30 | 2003-03-21 | Data visualization within an integrated asset data system for a process plant |
| US10/394,683 | 2003-03-21 | ||
| US10/801,195 US20040230328A1 (en) | 2003-03-21 | 2004-03-16 | Remote data visualization within an asset data system for a process plant |
| US10/801,195 | 2004-03-16 | ||
| PCT/US2004/008413 WO2004086160A1 (en) | 2003-03-21 | 2004-03-19 | Remote data visualization within an asset data system for a process plant |
Publications (2)
| Publication Number | Publication Date |
|---|---|
| JP2006527426A JP2006527426A (en) | 2006-11-30 |
| JP4869062B2 true JP4869062B2 (en) | 2012-02-01 |
Family
ID=45782012
Family Applications (1)
| Application Number | Title | Priority Date | Filing Date |
|---|---|---|---|
| JP2006507357A Expired - Lifetime JP4869062B2 (en) | 2003-03-21 | 2004-03-19 | Remote data browsing system and method for browsing entity data |
Country Status (1)
| Country | Link |
|---|---|
| JP (1) | JP4869062B2 (en) |
Families Citing this family (23)
| Publication number | Priority date | Publication date | Assignee | Title |
|---|---|---|---|---|
| JP4710814B2 (en) * | 2006-12-13 | 2011-06-29 | 横河電機株式会社 | Operation reception device and operation reception method |
| JP5390424B2 (en) * | 2010-02-03 | 2014-01-15 | 三菱電機株式会社 | Plant monitoring device |
| US20110239109A1 (en) * | 2010-03-24 | 2011-09-29 | Mark Nixon | Methods and apparatus to display process data |
| US9122764B2 (en) | 2010-03-24 | 2015-09-01 | Fisher-Rosemount Systems, Inc. | Methods and apparatus to access process data stored on a server |
| JP5755125B2 (en) * | 2011-12-07 | 2015-07-29 | 三菱電機株式会社 | Web monitoring and control device |
| US10386827B2 (en) | 2013-03-04 | 2019-08-20 | Fisher-Rosemount Systems, Inc. | Distributed industrial performance monitoring and analytics platform |
| US10909137B2 (en) | 2014-10-06 | 2021-02-02 | Fisher-Rosemount Systems, Inc. | Streaming data for analytics in process control systems |
| US10223327B2 (en) | 2013-03-14 | 2019-03-05 | Fisher-Rosemount Systems, Inc. | Collecting and delivering data to a big data machine in a process control system |
| US9558220B2 (en) | 2013-03-04 | 2017-01-31 | Fisher-Rosemount Systems, Inc. | Big data in process control systems |
| US10282676B2 (en) | 2014-10-06 | 2019-05-07 | Fisher-Rosemount Systems, Inc. | Automatic signal processing-based learning in a process plant |
| US10866952B2 (en) | 2013-03-04 | 2020-12-15 | Fisher-Rosemount Systems, Inc. | Source-independent queries in distributed industrial system |
| US10649424B2 (en) | 2013-03-04 | 2020-05-12 | Fisher-Rosemount Systems, Inc. | Distributed industrial performance monitoring and analytics |
| US10678225B2 (en) | 2013-03-04 | 2020-06-09 | Fisher-Rosemount Systems, Inc. | Data analytic services for distributed industrial performance monitoring |
| US10649449B2 (en) | 2013-03-04 | 2020-05-12 | Fisher-Rosemount Systems, Inc. | Distributed industrial performance monitoring and analytics |
| US9665088B2 (en) | 2014-01-31 | 2017-05-30 | Fisher-Rosemount Systems, Inc. | Managing big data in process control systems |
| US10296668B2 (en) | 2013-03-15 | 2019-05-21 | Fisher-Rosemount Systems, Inc. | Data modeling studio |
| US10649413B2 (en) | 2013-03-15 | 2020-05-12 | Fisher-Rosemount Systems, Inc. | Method for initiating or resuming a mobile control session in a process plant |
| US10168691B2 (en) | 2014-10-06 | 2019-01-01 | Fisher-Rosemount Systems, Inc. | Data pipeline for process control system analytics |
| US10503483B2 (en) | 2016-02-12 | 2019-12-10 | Fisher-Rosemount Systems, Inc. | Rule builder in a process control network |
| JP6977265B2 (en) | 2017-01-27 | 2021-12-08 | オムロン株式会社 | Master-slave control system and master-slave control system control method |
| JP6411003B1 (en) * | 2017-11-06 | 2018-10-24 | 三菱電機株式会社 | Data collection device, data collection method, and program |
| JP7257833B2 (en) * | 2019-03-25 | 2023-04-14 | アズビル株式会社 | Display control device and display control method |
| CN117436054B (en) * | 2023-12-21 | 2024-03-12 | 四川正基岩土工程有限公司 | Geotechnical engineering big data sharing platform |
Citations (6)
| Publication number | Priority date | Publication date | Assignee | Title |
|---|---|---|---|---|
| JPH08171571A (en) * | 1994-12-16 | 1996-07-02 | Mitsubishi Electric Corp | Data base device |
| WO2001065322A1 (en) * | 2000-02-29 | 2001-09-07 | Bently Nevada Corporation | An industrial plant asset management system |
| JP2002099605A (en) * | 2000-09-26 | 2002-04-05 | Atom Engineering:Kk | Method for managing facility, equipment and the like |
| WO2002071173A2 (en) * | 2001-03-01 | 2002-09-12 | Fisher-Rosemount Systems, Inc. | Data sharing in a process plant |
| JP2003500744A (en) * | 1999-05-20 | 2003-01-07 | メドトロニック ミニメド インコーポレイテッド | Comprehensive medical information management system |
| JP2003029829A (en) * | 2001-07-18 | 2003-01-31 | Mitsubishi Electric Corp | Plant monitor controller |
-
2004
- 2004-03-19 JP JP2006507357A patent/JP4869062B2/en not_active Expired - Lifetime
Patent Citations (6)
| Publication number | Priority date | Publication date | Assignee | Title |
|---|---|---|---|---|
| JPH08171571A (en) * | 1994-12-16 | 1996-07-02 | Mitsubishi Electric Corp | Data base device |
| JP2003500744A (en) * | 1999-05-20 | 2003-01-07 | メドトロニック ミニメド インコーポレイテッド | Comprehensive medical information management system |
| WO2001065322A1 (en) * | 2000-02-29 | 2001-09-07 | Bently Nevada Corporation | An industrial plant asset management system |
| JP2002099605A (en) * | 2000-09-26 | 2002-04-05 | Atom Engineering:Kk | Method for managing facility, equipment and the like |
| WO2002071173A2 (en) * | 2001-03-01 | 2002-09-12 | Fisher-Rosemount Systems, Inc. | Data sharing in a process plant |
| JP2003029829A (en) * | 2001-07-18 | 2003-01-31 | Mitsubishi Electric Corp | Plant monitor controller |
Also Published As
| Publication number | Publication date |
|---|---|
| JP2006527426A (en) | 2006-11-30 |
Similar Documents
| Publication | Publication Date | Title |
|---|---|---|
| JP4869062B2 (en) | Remote data browsing system and method for browsing entity data | |
| JP4856951B2 (en) | Data integration system and method for process plant | |
| US20040230328A1 (en) | Remote data visualization within an asset data system for a process plant | |
| JP5965026B2 (en) | Entity monitoring method, process control system, and display system | |
| JP5468261B2 (en) | Corrective action monitoring method, correction device monitoring system, and display system | |
| JP4642748B2 (en) | Asset optimization report in process plant | |
| JP4808407B2 (en) | Data integration system and method in process plant | |
| JP2016154020A (en) | Method of monitoring entity within process plant and system for displaying total use index of process plant | |
| JP5876984B2 (en) | Personalized plant asset data display and retrieval system | |
| US7283914B2 (en) | System and method for vibration monitoring | |
| JP5124374B2 (en) | Integration into process performance monitoring and process equipment monitoring and control | |
| CN100592229C (en) | Remote data visualization within an asset data system for a process plant |
Legal Events
| Date | Code | Title | Description |
|---|---|---|---|
| A621 | Written request for application examination |
Free format text: JAPANESE INTERMEDIATE CODE: A621 Effective date: 20070220 |
|
| A131 | Notification of reasons for refusal |
Free format text: JAPANESE INTERMEDIATE CODE: A131 Effective date: 20090714 |
|
| A601 | Written request for extension of time |
Free format text: JAPANESE INTERMEDIATE CODE: A601 Effective date: 20091008 |
|
| A602 | Written permission of extension of time |
Free format text: JAPANESE INTERMEDIATE CODE: A602 Effective date: 20091016 |
|
| A521 | Request for written amendment filed |
Free format text: JAPANESE INTERMEDIATE CODE: A523 Effective date: 20100114 |
|
| A131 | Notification of reasons for refusal |
Free format text: JAPANESE INTERMEDIATE CODE: A131 Effective date: 20100525 |
|
| A601 | Written request for extension of time |
Free format text: JAPANESE INTERMEDIATE CODE: A601 Effective date: 20100820 |
|
| A602 | Written permission of extension of time |
Free format text: JAPANESE INTERMEDIATE CODE: A602 Effective date: 20100827 |
|
| A521 | Request for written amendment filed |
Free format text: JAPANESE INTERMEDIATE CODE: A523 Effective date: 20101125 |
|
| A131 | Notification of reasons for refusal |
Free format text: JAPANESE INTERMEDIATE CODE: A131 Effective date: 20110322 |
|
| A601 | Written request for extension of time |
Free format text: JAPANESE INTERMEDIATE CODE: A601 Effective date: 20110620 |
|
| A602 | Written permission of extension of time |
Free format text: JAPANESE INTERMEDIATE CODE: A602 Effective date: 20110627 |
|
| A521 | Request for written amendment filed |
Free format text: JAPANESE INTERMEDIATE CODE: A523 Effective date: 20110725 |
|
| TRDD | Decision of grant or rejection written | ||
| A01 | Written decision to grant a patent or to grant a registration (utility model) |
Free format text: JAPANESE INTERMEDIATE CODE: A01 Effective date: 20111018 |
|
| A01 | Written decision to grant a patent or to grant a registration (utility model) |
Free format text: JAPANESE INTERMEDIATE CODE: A01 |
|
| A61 | First payment of annual fees (during grant procedure) |
Free format text: JAPANESE INTERMEDIATE CODE: A61 Effective date: 20111115 |
|
| R150 | Certificate of patent or registration of utility model |
Ref document number: 4869062 Country of ref document: JP Free format text: JAPANESE INTERMEDIATE CODE: R150 Free format text: JAPANESE INTERMEDIATE CODE: R150 |
|
| FPAY | Renewal fee payment (event date is renewal date of database) |
Free format text: PAYMENT UNTIL: 20141125 Year of fee payment: 3 |
|
| R250 | Receipt of annual fees |
Free format text: JAPANESE INTERMEDIATE CODE: R250 |
|
| R250 | Receipt of annual fees |
Free format text: JAPANESE INTERMEDIATE CODE: R250 |
|
| R250 | Receipt of annual fees |
Free format text: JAPANESE INTERMEDIATE CODE: R250 |
|
| R250 | Receipt of annual fees |
Free format text: JAPANESE INTERMEDIATE CODE: R250 |
|
| R250 | Receipt of annual fees |
Free format text: JAPANESE INTERMEDIATE CODE: R250 |
|
| R250 | Receipt of annual fees |
Free format text: JAPANESE INTERMEDIATE CODE: R250 |
|
| R250 | Receipt of annual fees |
Free format text: JAPANESE INTERMEDIATE CODE: R250 |
|
| R250 | Receipt of annual fees |
Free format text: JAPANESE INTERMEDIATE CODE: R250 |
|
| R250 | Receipt of annual fees |
Free format text: JAPANESE INTERMEDIATE CODE: R250 |
|
| R250 | Receipt of annual fees |
Free format text: JAPANESE INTERMEDIATE CODE: R250 |