EP4174603B1 - Datenverarbeitungsvorrichtung, -verfahren und -programm - Google Patents
Datenverarbeitungsvorrichtung, -verfahren und -programm Download PDFInfo
- Publication number
- EP4174603B1 EP4174603B1 EP22195334.2A EP22195334A EP4174603B1 EP 4174603 B1 EP4174603 B1 EP 4174603B1 EP 22195334 A EP22195334 A EP 22195334A EP 4174603 B1 EP4174603 B1 EP 4174603B1
- Authority
- EP
- European Patent Office
- Prior art keywords
- time
- differential
- value
- period
- measurement
- Prior art date
- Legal status (The legal status is an assumption and is not a legal conclusion. Google has not performed a legal analysis and makes no representation as to the accuracy of the status listed.)
- Active
Links
Images


Classifications
-
- G—PHYSICS
- G05—CONTROLLING; REGULATING
- G05B—CONTROL OR REGULATING SYSTEMS IN GENERAL; FUNCTIONAL ELEMENTS OF SUCH SYSTEMS; MONITORING OR TESTING ARRANGEMENTS FOR SUCH SYSTEMS OR ELEMENTS
- G05B23/00—Testing or monitoring of control systems or parts thereof
- G05B23/02—Electric testing or monitoring
- G05B23/0205—Electric testing or monitoring by means of a monitoring system capable of detecting and responding to faults
- G05B23/0218—Electric testing or monitoring by means of a monitoring system capable of detecting and responding to faults characterised by the fault detection method dealing with either existing or incipient faults
- G05B23/0221—Preprocessing measurements, e.g. data collection rate adjustment; Standardization of measurements; Time series or signal analysis, e.g. frequency analysis or wavelets; Trustworthiness of measurements; Indexes therefor; Measurements using easily measured parameters to estimate parameters difficult to measure; Virtual sensor creation; De-noising; Sensor fusion; Unconventional preprocessing inherently present in specific fault detection methods like PCA-based methods
-
- G—PHYSICS
- G05—CONTROLLING; REGULATING
- G05B—CONTROL OR REGULATING SYSTEMS IN GENERAL; FUNCTIONAL ELEMENTS OF SUCH SYSTEMS; MONITORING OR TESTING ARRANGEMENTS FOR SUCH SYSTEMS OR ELEMENTS
- G05B19/00—Program-control systems
- G05B19/02—Program-control systems electric
- G05B19/418—Total factory control, i.e. centrally controlling a plurality of machines, e.g. direct or distributed numerical control [DNC], flexible manufacturing systems [FMS], integrated manufacturing systems [IMS] or computer integrated manufacturing [CIM]
-
- G—PHYSICS
- G06—COMPUTING OR CALCULATING; COUNTING
- G06N—COMPUTING ARRANGEMENTS BASED ON SPECIFIC COMPUTATIONAL MODELS
- G06N20/00—Machine learning
Definitions
- Embodiments described herein relate generally to a data processing apparatus, a method, and a program.
- a system such as a power plant, a water treatment plant, and a manufacturing apparatus includes a plurality of devices. If the system is a system used for an infrastructure, the stop of the system adversely affects a social function. Further, even if the system is not used for an infrastructure, stoppage of the system causes an economic loss. Accordingly, it is important to keep the system in a healthy state.
- one or more sensors are installed at various places in the system for monitoring the system.
- the state of the system can be monitored by using the measurement values of the one or more installed sensors.
- the system is large or complicated, the number of sensors required for monitoring increases. Therefore, it is difficult to monitor all the sensors simultaneously with a limited number of people.
- a monitoring apparatus that assists or automates monitoring of a system. For example, in a case where a deviation between a predicted value obtained by predicting a measured value of a sensor from a machine learning model and an actual measurement value is detected, there is a method of regarding that an anomaly is detected.
- a degree of deterioration of the machine learning model due to a change in environment or data is unknown, and it is difficult to determine the update timing.
- erroneous detection increases by continuously using the deteriorated machine learning model.
- a data processing apparatus includes a first acquisition unit (103), a second acquisition unit (104), a first differential unit (105), a second differential unit (106), a first distribution unit (107), a second distribution unit (108), a first output unit (119) and a second output unit (120).
- the first acquisition unit (103) is configured to acquire first measurement data that is a set of measurement values in a first period among time series data of measurement values of a sensor of interest.
- the second acquisition unit (104) is configured to acquire second measurement data that is a set of measurement values in a second period different from the first period among the time series data of the measurement values of the sensor of interest.
- the first differential unit (105) is configured to calculate, from the first measurement data, a first differential value set that is a set of first differential values in a time direction at a time included in the first period of the measurement values of the sensor of interest.
- the second differential unit (106) is configured to calculate, from the second measurement data, a second differential value set that is a set of second differential values in a time direction at a time included in the second period of the measurement values of the sensor of interest.
- the first distribution unit (107) is configured to generate a first differential value distribution using the first differential value set.
- the second distribution unit (108) is configured to generate a second differential value distribution using the second differential value set.
- the first output unit (119) is configured to output the first differential value distribution.
- the second output unit (120) is configured to output the second differential value distribution.
- the first and the second differential values represent time derivatives.
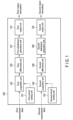
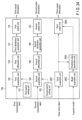
- FIG. 1 is a block diagram illustrating a data processing apparatus 100 according to a first embodiment.
- the data processing apparatus 100 includes a first period setting unit 101, a second period setting unit 102, a first acquisition unit 103, a second acquisition unit 104, a first differential unit 105, a second differential unit 106, a first distribution generation unit 107, a second distribution generation unit 108, a first output unit 119, and a second output unit 120.
- the first period setting unit 101 sets a predetermined first period, and sends the first predetermined period to the first acquisition unit 103.
- the second period setting unit 102 sets a predetermined second period different from the first period, and sends the second period to the second acquisition unit 104.
- the first acquisition unit 103 receives information regarding the first period from the first period setting unit 101, and acquires, from the outside, first measurement data that is a set of measurement values in the first period of a sensor of interest that is a sensor of interest among one or more sensors installed in a system.
- the first acquisition unit 103 sends the first measurement data to the first differential unit 105.
- the second acquisition unit 104 receives information regarding the second period from the second period setting unit 102, and acquires, from the outside, second measurement data that is a set of measurement values in the second period of the sensor of interest.
- the second acquisition unit 104 sends the second measurement data to the second differential unit 106.
- the first acquisition unit 103 and the second acquisition unit 104 may be synchronized with each other with respect to information of a sensor of interest for acquiring measurement data, and may acquire the first measurement data and the second measurement data from the same sensor of interest.
- information regarding sensor ID may be assigned to a measurement value, and the first measurement data and the second measurement data may be acquired based on the measurement value of each sensor.
- a data control unit may associate the first measurement data and the second measurement data related to the same sensor of interest, and send the first measurement data to the first differential unit 105 and the second measurement data to the second differential unit 106.
- the first differential unit 105 receives the first measurement data from the first acquisition unit 103, and calculates a first differential value in a time direction at a first time included in the first period of the measurement value of the first measurement data.
- the first differential unit 105 transmits, to the first distribution generation unit 107, a first differential value set that is a set of first differential values calculated by changing the first time in the first period.
- all the elements of the first differential value set may be collectively sent to the first distribution generation unit 107, or each element of the first differential value set may be sequentially sent to the first distribution generation unit 107.
- the first differential value in the time direction at the first time is calculated, for example, by calculating a difference between measurement values at a first attention time near the first time and at a first calculation target time separated from the first attention time by s unit time.
- "s" represents a value of a differential step, and is, for example, "1".
- the first attention time is a time to which attention is paid in order to calculate the first differential value at the first time.
- the first attention time may or may not coincide with the first time.
- the first calculation target time is, for example, ahead of the first attention time by s unit time.
- the first calculation target time may be after the first attention time by s unit time.
- the first differential value in the time direction of the measurement value of the sensor of interest represents a time derivative near the first time of the measurement value of the sensor of interest.
- the second differential unit 106 receives the second measurement data from the second acquisition unit 104, and calculates a second differential value in the time direction at a second time included in the second period of the measurement value of the second measurement data.
- the second differential unit 106 transmits, to the second distribution generation unit 108, a second differential value set that is a set of second differential values calculated by changing the second time in the second period.
- all the elements of the second differential value set may be collectively sent to the second distribution generation unit 108, or each element of the second differential value set may be sequentially sent to the second distribution generation unit 108.
- the second differential value in the time direction at the second time is calculated, for example, by calculating a difference between measurement values at a second attention time near the second time and at a second calculation target time separated from the second attention time by s unit time.
- the second attention time is a time to which attention is paid in order to calculate the second differential value at the second time.
- the second attention time may or may not coincide with the second time.
- the second calculation target time is, for example, ahead of the second attention time by s unit time.
- the second calculation target time may be after the second attention time by s unit time.
- the second differential value in the time direction of the measurement value of the sensor of interest represents a time derivative near the second time of the measurement value of the sensor of interest.
- the first distribution generation unit 107 receives the first differential value set from the first differential unit 105, generates a distribution or a cumulative distribution related to the differential value, and sends the distribution to the first output unit 119 as a first differential value distribution.
- the second distribution generation unit 108 receives the second differential value set from the second differential unit 106, generates a distribution or a cumulative distribution related to the differential value, and sends the distribution to the second output unit 120 as a second differential value distribution.
- each of the first differential value distribution and the second differential value distribution is assumed to be, for example, a histogram, but is not limited thereto, and may be a discrete probability distribution, a probability density function, a cumulative histogram, a discrete cumulative probability distribution, a cumulative probability density function, or the like.
- the first output unit 119 receives the first differential value distribution from the first distribution generation unit 107, and outputs first output information regarding the first differential value distribution to the outside of the data processing apparatus 100. Note that, when the first output unit 119 is a display apparatus such as a monitor, the first differential value distribution may be displayed as the first output information.
- the second output unit 120 receives the second differential value distribution from the second distribution generation unit 108, and outputs second output information representing the second differential value distribution to the outside of the data processing apparatus 100. Note that, when the second output unit 120 is a display apparatus such as a monitor, similarly to the first output unit 119, the second differential value distribution may be displayed as the second output information.
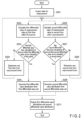
- step S201 the first acquisition unit 103 acquires the first measurement data, and the second acquisition unit 104 acquires the second measurement data.
- step S202 the first differential unit 105 calculates the first differential value of the measurement value at the first time within the first period.
- step S203 the first differential unit 105 determines whether or not the first differential value has been calculated at all times at which the first differential value can be calculated in the first period. In a case where the first differential value has been calculated at all times, the process proceeds to step S205. In a case where there is an unprocessed time, the process proceeds to step S204.
- step S204 the first differential unit 105 determines a new first time from the unprocessed times, returns to step S202, and repeats the same processing.
- step S205 the first distribution generation unit 107 generates the first differential value distribution from the first differential value set obtained in step S203.
- step S206 the second differential unit 106 calculates the second differential value of the measurement value at the second time within the second period.
- step S207 the second differential unit 106 determines whether or not the second differential value has been calculated at all times at which the second differential value can be calculated in the second period. In a case where the second differential value has been calculated at all times, the process proceeds to step S209. In a case where there is an unprocessed time, the process proceeds to step S208.
- step S208 the second differential unit 106 determines a new second time from the unprocessed times, returns to step S206, and repeats the same processing.
- step S209 the second distribution generation unit 108 generates the second differential value distribution from the second differential value set obtained in step S207.
- step S210 the first output unit 119 and the second output unit 120 output the first differential value distribution and the second differential value distribution.
- the first differential value distribution and the second differential value distribution may be displayed on separate monitors, or may be displayed as different graphs on the same monitor.
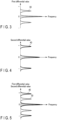
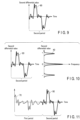
- FIG. 3 a display example of the first differential value distribution is illustrated in FIG. 3 .
- FIG. 3 is a graph of the first differential value distribution 30, where a horizontal axis represents a frequency and a vertical axis represents the first differential value in the time direction.
- the first differential value distribution 30 is a histogram of the first differential value in the time direction. Note that the vertical axis and the horizontal axis may be interchanged. As illustrated in FIG. 3 , three frequency peaks exist according to the first differential value. That is, when the first differential value is zero, it indicates that the sensor value does not substantially change, and thus the state is a steady state. When the first differential value is positive or negative, it indicates that the time rate of change is positive or negative.
- FIG. 4 is a graph of the second differential value distribution 40, and similarly to FIG. 3 , the horizontal axis represents a frequency, and the vertical axis represents the differential value in the time direction.
- the second differential value distribution 40 is a histogram of the second differential value in the time direction. Note that the vertical axis and the horizontal axis may be interchanged. Similarly to the first differential value distribution, three frequency peaks exist according to the second differential value. Here, it is assumed that an absolute value of the differential value is larger in the second differential value than in the first differential value.
- the drift of the time derivative will be described. For example, it is assumed that a measurement value of a device measured by a sensor changes from 1 to 10 by an operation of an operator. In this case, an amount of change per predetermined time, that is, a rate is different between the case where an operator A changes the measurement value by one step from 1, 2, 3, ..., 10 and the case where an operator B changes the measurement value from 1 to 10 at once. Therefore, comparing the operations of the operator A and the operator B, it can be said that the time derivative is drifting. Furthermore, regardless of the operator, for example, when closing an open valve installed in the system, if a frictional force, a pressure, and the like around the valve are different between the first period and the second period, the time taken until the valve is closed may be different. In this case, it can be said that the time derivative of a valve opening degree indicating how much the valve is opened is drifting.
- first differential value distribution 30 and the second differential value distribution 40 may be displayed as one graph.
- FIG. 5 illustrates a modification of a display example of the first differential value distribution and the second differential value distribution.
- the differential step is "1" has been assumed, but it is not limited thereto, and for example, the differential step may be designated by the user.
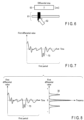
- FIG. 6 illustrates an example of a graphical user interface (GUI) for adjusting the differential step.
- GUI graphical user interface
- a slider 61 for determining the differential step is set.
- the user adjusts the differential step, for example, by moving a knob of the slider 61 with a mouse cursor 62 or a finger.
- the adjusted value is displayed in a text box 63.
- the user may directly input a value of the differential step to the text box 63 instead of setting the differential step by the slider 61.
- the value input by the user may be given to the first differential unit 105 and the second differential unit 106, and set as the value of the differential step.
- the differential step may be determined based on a machine learning model to be applied to the measurement value of the sensor, which determines whether or not an anomaly has occurred in the system by the sensor.
- a time window length may be set to a value smaller than the time window length of input time series data to a trained machine learning model (also referred to as a trained model).
- the differential step may be set to a value of "W-1" obtained by subtracting one unit time from "W”, or may be set to a value of 1 or more and less than "W”.
- a lower limit of the value that can be set as the differential step may be set to 1, and an upper limit may be set to "W-1".
- the first differential value distribution related to the measurement value of the sensor of interest in the first period and the second differential value distribution related to the measurement value of the sensor of interest in the second period are generated.
- the user can easily compare the time derivatives, and it is possible to easily detect that the drift regarding the time derivative has occurred. Further, in a case where the drift related to the time derivative occurs, the user can determine whether or not detection of the system in which the sensor of interest is installed is appropriate. As a result, usability can be improved.
- a trend graph of the first differential value and a trend graph of the second differential value are displayed.
- the trend graph of the differential value is a graph representing a temporal change (temporal transition) of the differential value.
- the first output unit 119 receives the first differential value set from the first differential unit 105, and further outputs a trend graph of the first differential value as the first output information.
- the second output unit 120 receives the second differential value set from the second differential unit 106, and further outputs a trend graph of the second differential value as the second output information.
- FIGS. 7 and 8 illustrate an example of the trend graph output from the first output unit 119 according to the second embodiment.
- a trend graph 70 in the first period is displayed.
- a vertical axis represents the first differential value
- a horizontal axis represents time.
- the trend graph 70 and the first differential value distribution 30 may be displayed in different display regions, or as illustrated in FIG. 8 , the trend graph 70 of the first differential value and the first differential value distribution 30 may be displayed side by side in one display region.
- the trend graph 70 and the first differential value distribution 30 are displayed side by side in one display region, it is easier for the user to see by aligning scales of common axes.
- FIGS. 9 and 10 an example of the trend graph output from the second output unit 120 according to the second embodiment is illustrated in FIGS. 9 and 10 .
- a trend graph 90 in the second period is displayed.
- a vertical axis represents the second differential value
- a horizontal axis represents time.
- the trend graph 90 of the second differential value and the second differential value distribution 40 may be displayed side by side.
- FIG. 11 illustrates a first modification of a display example of the trend graph.
- a trend graph 70 of the first differential value and a trend graph 90 of the second differential value may be displayed in one graph.
- By displaying the two trend graphs in one graph it is possible to grasp the trend of the first differential value and the second differential value along time series.
- FIG. 12 illustrates a second modification of a display example of the trend graph.
- FIG. 12 is an example in which both the trend graph illustrated in FIG. 11 and the differential value distribution illustrated in FIG. 5 are displayed in the same display area. Note that the trend graph illustrated in FIG. 11 and any one of the graphs in FIGS. 3 and 4 may be displayed on one screen.
- the trend graph of the first differential value and the second differential value is generated and output.
- a score for determining the drift of the time derivative is calculated.
- a data processing apparatus 100 according to the third embodiment will be described with reference to a block diagram of FIG. 13 .
- the data processing apparatus 100 further includes a score calculation unit 1301 and a score output unit 1302 as compared with FIG. 1 .
- the score calculation unit 1301 receives the first differential value distribution from a first distribution generation unit 107 and the second differential value distribution from a second distribution generation unit 108, and calculates a score regarding a distribution difference.
- a score for example, similarity or dissimilarity between the first differential value distribution and the second differential value distribution may be used.
- similarity for example, a histogram intersection and a cosine similarity may be used.
- the dissimilarity may be, for example, Kullback-Leibler divergence or Wasserstein distance, or may be a Euclidean distance, a difference between the maximum values, a difference between the minimum values, a difference between average values, a difference between median values, or a weighted sum of these criteria.
- the score output unit 1302 receives the score from the score calculation unit 1301, and outputs the score to the outside. If the score output unit 1302 is a display unit, the score is displayed.
- the score of the sensor of interest can be known by calculating the score.
- the score is the degree of similarity
- a smaller value of the score indicates a lower degree of similarity, so that the user can grasp that there is a high possibility that a drift regarding the time derivative of the sensor of interest has occurred.
- the score is the degree of dissimilarity
- the greater the value of the score the greater the degree of dissimilarity, so that the user can grasp that there is a high possibility that a drift regarding the time derivative of the sensor of interest has occurred.
- the occurrence of the drift of the time derivative is detected based on the score.
- a data processing apparatus 100 according to the fourth embodiment will be described with reference to a block diagram of FIG. 14 .
- the data processing apparatus 100 further includes a score calculation unit 1301, a drift detection unit 1401, and a drift information output unit 1402.
- the score calculation unit 1301 is similar to that of the third embodiment.
- the drift detection unit 1401 receives the score from the score calculation unit 1301, and detects whether or not the drift of the time derivative has occurred by determining a magnitude between the score and a threshold value. In a case where the score is the similarity, when the score is smaller than the threshold value, it is regarded that the drift of the time derivative has occurred and detected. In a case where the score is the degree of dissimilarity, in a case where the score is larger than the threshold value, it is regarded that the drift of the time derivative has occurred, and detection is performed. The drift detection unit 1401 generates a drift detection signal indicating whether the drift of the time derivative of the sensor of interest has been detected.
- the drift information output unit 1402 receives the drift detection signal from the drift detection unit 1401, and outputs drift information regarding detection of the drift of the time derivative of the sensor of interest to the outside of the data processing apparatus 100.
- the drift information for example, whether or not the drift of the time derivative of the sensor of interest has occurred in a certain display region on a monitor may be displayed as a text. Alternatively, a sound or an alert sound indicating that the drift of the time derivative has occurred may be output.
- the drift detection unit detects whether or not the drift of the time derivative has occurred based on the score, whereby the user can know whether or not the drift related to the time derivative of the sensor of interest has occurred.
- a data processing apparatus 100 according to the fifth embodiment may have the same configuration as the data processing apparatus 100 according to the fourth embodiment.
- the data processing apparatus 100 may execute the processing according to the fourth embodiment using one of the plurality of sensors as a sensor of interest.
- a first acquisition unit 103 or a second acquisition unit 104 sets an unprocessed sensor among the plurality of sensors as a new sensor of interest, and acquires the first measurement data and the second measurement data.
- the detection processing of the drift of the time derivative may be executed. Note that, when acquiring the first measurement data and the second measurement data, the first acquisition unit 103 and the second acquisition unit 104 acquire the first measurement data and the second measurement data in association with ID (also referred to as a sensor ID) for uniquely identifying the sensor.
- ID also referred to as a sensor ID
- a drift detection unit 1401 may send the drift detection signal related to the drift of the time derivative calculated for the sensor of interest to a drift information output unit 1402 each time the drift detection signal is generated, or may calculate the drift detection signals for all the plurality of sensors and then collectively send the plurality of drift detection signals to the drift information output unit 1402.
- the drift information output unit 1402 receives the drift detection signal calculated for each sensor from the drift detection unit 1401, generates a list of sensors in which the drift of the time derivative is detected, and outputs the list to the outside as drift information.
- the drift information the number of sensors in which the drift of the time derivative is detected may be output.
- the drift information output unit 1402 may count the number of sensors in which the drift of the time derivative is detected based on the drift detection signal, and output the number of the sensors to the outside.
- the drift information output unit outputs at least one of the list of the sensors in which the drift of the time derivative has occurred and the number of the sensors among the plurality of sensors. As a result, the user can easily grasp the sensor in which the drift of the time derivative is detected and the number of the sensors.
- a maximum value, a minimum value, an average value, and a median value of the measurement data in the first period and the second period may be displayed on the graph of the first differential value distribution and the second differential value distribution.
- a maximum value and the minimum value among the maximum value, the minimum value, the average value, and the median value will be described below.
- a configuration of a data processing apparatus 100 according to the sixth embodiment is similar to that of the above-described embodiments.
- a first differential unit 105 calculates the maximum value and the minimum value of the first measurement data.
- a first output unit 119 receives the maximum value and the minimum value from the first differential unit 105, and outputs the first differential value distribution, and the maximum value and the minimum value as first output information.
- the display unit of an output destination or the like can visualize the first differential value distribution while superimposing the maximum value and the minimum value of the first differential value on the first differential value distribution.
- a second differential unit 106 calculates the maximum value and the minimum value of the second measurement data.
- a second output unit 120 receives the maximum value and the minimum value from the second differential unit 106, and outputs the second differential value distribution, and the maximum value and the minimum value as second output information.
- the display unit of the output destination or the like can visualize the second differential value distribution while superimposing the maximum value and the minimum value of the second differential value on the second differential value distribution.
- first differential unit 105 and the second differential unit 106 are not limited to calculating the maximum value and the minimum value, respectively.
- the first output unit 119 may receive the first measurement data from the first differential unit 105, and calculate the maximum value and the minimum value of the first measurement data.
- the second output unit 120 may receive the second measurement data from the second differential unit 106, and calculate the maximum value and the minimum value of the second measurement data.
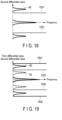
- FIG. 15 a first display example of the first output information according to the sixth embodiment is illustrated in FIG. 15 .
- FIG. 15 illustrates an example in which a maximum value 1501 and a minimum value 1502 of the first measurement data are indicated by broken lines in the first differential value distribution 30 illustrated in FIG. 3 .
- the maximum value and the minimum value of the measurement data are important in confirming the drift of the time derivative, it is possible to make it easy for the user to visually recognize the maximum value and the minimum value.
- the maximum value and the minimum value of the second measurement data may be displayed in the first differential value distribution.
- a second display example of the first output information according to the sixth embodiment is illustrated in FIG. 16 .
- FIG. 16 illustrates an example in which a maximum value 1601 and a minimum value 1602 of the second measurement data are displayed by solid lines in the first differential value distribution 30 illustrated in FIG. 3 .
- FIG. 15 it is possible to allow the user to easily visually recognize the maximum value and the minimum value.
- the first output unit 119 may acquire the maximum value and the minimum value of the second measurement data from the second differential unit 106.
- the second measurement data may be received from the second differential unit 106, and the first output unit 119 may calculate the maximum value and the minimum value of the second measurement data.
- FIG. 17 a first display example of the second output information according to the sixth embodiment is illustrated in FIG. 17 .
- FIG. 17 illustrates an example in which a maximum value 1601 and a minimum value 1602 of the second measurement data are displayed by solid lines in the second differential value distribution 40 illustrated in FIG. 4 .
- the maximum value and the minimum value of the first measurement data may be displayed in the second differential value distribution.
- FIG. 18 A second display example of the second output information according to the sixth embodiment is illustrated in FIG. 18 .
- FIG. 18 illustrates an example in which a maximum value 1501 and a minimum value 1502 of the first measurement data are indicated by broken lines in the second differential value distribution 40 illustrated in FIG. 4 .
- FIG. 17 it is possible to allow the user to easily visually recognize the maximum value and the minimum value.
- the second output unit 120 may acquire the maximum value and the minimum value of the first measurement data from the first differential unit 105.
- the first measurement data may be received from the first differential unit 105, and the second output unit 120 may calculate the maximum value and the minimum value of the first measurement data.
- FIG. 19 a third display example of the first output information and the second output information according to the sixth embodiment is illustrated in FIG. 19 .
- FIG. 19 is a graph in which a first differential value distribution 30, a second differential value distribution 40, a maximum value 1501 and a minimum value 1502 of the first measurement data, and a maximum value 1601 and a minimum value 1602 of the second measurement data are displayed in a superimposed manner.
- the maximum value 1501 and the maximum value 1601 are close to each other, but since the maximum value 1501 and the maximum value 1601 are separated as illustrated in FIG. 19 , it is possible to grasp a possibility that the drift of the time derivative occurs.
- the minimum value 1502 and the minimum value 1602 it is possible to similarly grasp a possibility that the drift of the time derivative occurs.
- the maximum value and the minimum value of the measurement data that cannot be confirmed only by the histogram or the probability density function of the differential value distribution are calculated and superimposed and displayed on the graph, so that the user can easily confirm the maximum value and the minimum value.
- a scatter diagram is created and output based on the differential value.
- a data processing apparatus according to the seventh embodiment will be described with reference to FIG. 20 .
- a data processing apparatus 100 according to the seventh embodiment illustrated in FIG. 20 further includes a scatter diagram creation unit 2001 and a scatter diagram output unit 2002.
- the scatter diagram creation unit 2001 receives the first measurement data from a first acquisition unit 103 and the second measurement data from a second acquisition unit 104, and creates scatter diagram data of the first measurement data and the second measurement data.
- the scatter diagram output unit 2002 outputs scatter diagram data from the scatter diagram creation unit 2001 to the outside.
- a vertical axis represents the measurement value at a time of interest
- a horizontal axis represents the measurement value at a time that is s unit time before the time of interest.
- a time of interest is set from among a plurality of times corresponding to measurement values included in measurement data, and a time of a combination of a measurement value at the time of interest and a measurement value at a time that is s unit time before the time of interest is plotted.
- black circles are plots relating to the first measurement data
- black triangles are plots relating to the second measurement data.
- plots of the first measurement data and the plots of the second measurement data are not limited to the black circle and the black triangle, and the plots of the first measurement data and the plots of the second measurement data may be displayed in any display mode as long as the plots of the first measurement data and the plots of the second measurement data are displayed in different display modes and can be distinguished from each other.
- a region 2101 indicates that the measurement value at the time of interest of the measurement data and the measurement value before the s unit time are close to each other, and indicates a steady state.
- the value obtained by differentiating the measured value in the time direction in the differential step s is close to zero, indicating a steady state in which the time derivative is close to zero, that is, no drift of the time derivative occurs.
- the measured value at the time of interest of the measurement data is larger than the measured value before the s unit time, and it is indicated that the measured value is in a transient state of increasing with time.
- it represents a transient state in which the value obtained by differentiating the measured value in the time direction in the differential step s is positive and the time derivative is positive.
- the measured value at the time of interest of the measurement data is smaller than the measured value before the s unit time, and it is indicated that the measured value is in a transient state of decreasing with time. In other words, it represents a transient state in which the value obtained by differentiating the measured value in the time direction in the differential step s is negative and the time derivative is negative.
- the scatter diagram illustrated in FIG. 21 it can be grasped from the scatter diagram that the drift of the time derivative occurs.
- FIG. 22 a second display example of scatter diagram data according to the seventh embodiment is illustrated in FIG. 22 .
- FIG. 22 is an example in which the scatter diagram illustrated in FIG. 21 and the differential value distribution illustrated in FIG. 5 are displayed side by side.
- a correspondence relationship is illustrated so as to connect corresponding data groups between the plot of the scatter diagram and the histogram of the differential value distribution.
- a vertical axis and a horizontal axis of the scatter diagram may be interchanged.
- the horizontal axes of the scatter diagrams in FIGS. 21 and 22 indicate the measurement value corresponding to the time that is s unit time before the time of interest, but the measurement value corresponding to the time that is s unit time after the time of interest may be used.
- the user can grasp the drift of the time derivative from both the scatter diagram and the histogram.
- a data processing apparatus 100 can monitor the number of sensors in which the drift of the time derivative is detected among the one or more sensors to be monitored in the period of the training data and the period after the period of the training data.
- FIG. 23 An example of a graph representing a change in the number of sensors in which the drift of the time derivative is detected is illustrated in FIG. 23 .
- a drift information output unit 1402 may generate, as the drift information, information regarding the time series change in the number of sensors in which the drift of the time derivative is detected, and output the information as a graph illustrated in FIG. 23 or as a list.
- a threshold value 2301 of the predetermined number of sensors is set, and in a case where the number of sensors is larger than or equal to the threshold value 2301 in the time series change in the number of sensors, the drift information output unit 1402 may output information prompting update of the machine learning model. This is because the generated machine learning model can be determined to be a model not suitable for the current sensor value in a case where the number of sensors in which the drift of the time derivative occurs is larger than or equal to the threshold value.
- the user can determine to update the trained model when the number of sensors in which the drift regarding the time derivative is detected exceeds the predetermined value.
- the drift information output unit 1402 may not output information prompting update of the trained model.
- the eighth embodiment described above it is possible to determine the necessity of updating the trained model in a case where the trained model based on the values of the plurality of sensors is designed by detecting whether or not the drift of the time derivative occurs for the plurality of sensors.
- a prediction value regarding a measurement value of a sensor is calculated using a machine learning model.
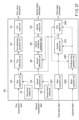
- a data processing apparatus 100 according to the ninth embodiment will be described with reference to a block diagram of FIG. 24 .
- the data processing apparatus 100 further includes a third acquisition unit 2401, a model acquisition unit 2402, a predicted value generation unit 2403, and a third output unit 2404.
- the third acquisition unit 2401 acquires time series data including measurement values at a plurality of times of one or more sensors installed in a system.
- the model acquisition unit 2402 acquires a machine learning model trained with training data whose data period is the first period.
- the machine learning model is, for example, a model or a regression model of a neural network including an auto encoder model.
- Machine learning models for monitoring a system often determine periods of training data excluding periods of anomaly state by the system.
- the period of the training data does not include a period in which the system is anomaly
- a value close to the measurement value of the time of interest of the one or more sensors when the system is in a normal state is output from the trained model as a predicted value.
- time series data including measurement values of one or more sensors at a plurality of times when the system is in an anomaly state is input to the machine learning model, it is expected that a value substantially different from a measurement value of a time of interest of one or more sensors when the system is in an anomaly state is output as a predicted value from the trained model.
- the predicted value generation unit 2403 receives time series data from the third acquisition unit 2401 and a machine learning model from the model acquisition unit 2402. The predicted value generation unit 2403 generates a predicted value of the one or more sensors installed in the system by inputting the time series data to the machine learning model.
- the third output unit 2404 outputs third output information related to the predicted value and the measurement value to the outside.
- the third output information is, for example, information indicating a trend graph of the measurement value and the predicted value regarding the one or more sensors.
- FIG. 25 is an example of a trend graph of the measurement value and the predicted value for a certain sensor of interest.
- a horizontal axis represents time and a vertical axis represents a value.
- a dashed line indicates a predicted value 2501 and a solid line indicates a measurement value 2502.
- FIG. 26 is an example of a graph in which the period of the training data and the trend graph of a period C in FIG. 25 are displayed in a superimposed manner for the measurement value of the sensor of interest.
- a horizontal axis represents relative time, and a vertical axis represents a value.
- a dashed line indicates a measurement value 2601 for the period of the training data, i.e., the first period, and a solid line indicates a measurement value 2602 for the period C.
- the sensor of interest takes a value around a value "A” or “B” in the steady state, and takes a value between the value "A” and the value "B” in the transient state.
- the time derivative of the measurement value in the transient state is faster in the period C than in the period of the training data, that is, the first period. Since the machine learning model has trained that the time derivative of the measurement value of the sensor of interest is similar to that of the training data, the time derivative of the predicted value of the period C tends to be similar to that of the training data. Therefore, a curve of the predicted value 2501 in the period C illustrated in FIG.
- the anomaly 25 has a shape delayed as compared with a curve of the measurement value 2502. In a case where an absolute value of the difference between the predicted value 2501 and the measurement value 2502 is larger than the threshold value, it is considered that the anomaly is easily detected in the transient state when the anomaly is detected as the anomaly (or the anomaly candidate).
- the sensor of interest may be displayed via a GUI that can be switched to a measurement value of another sensor.
- FIG. 25 By displaying FIG. 25 together with FIGS. 3 and 4 or by displaying FIG. 25 together with FIG. 5 , it can be easily grasped that the reason why the time derivative of the measurement value 2502 is faster than the predicted value 2501 is the drift of the time derivative. If the drift in the time derivative is not anomaly, the user can be aware that the deviation between the predicted value 2501 and the measurement value 2502 in the transient state is a false detection and the system is not anomaly.
- the user can grasp that the deviation of the transient state of the trend graph is caused by the drift of the time derivative.
- the user since the user can notice the cause without stopping the system and investigating the cause, it is possible to avoid a loss of cost and time due to the system stop.
- a predicted value regarding a measurement value of a sensor is calculated using a machine learning model.
- a data processing apparatus 100 according to the tenth embodiment will be described with reference to a block diagram of FIG. 27 .
- the data processing apparatus 100 according to the tenth embodiment illustrated in FIG. 27 further includes an anomaly detection unit 2701 as compared with FIG. 24 .
- the anomaly detection unit 2701 receives the time series data of the sensor of interest from a third acquisition unit 2401 and the predicted value from a predicted value generation unit 2403, and generates a detection signal that detects whether or not an absolute value of a difference between the predicted value and the measurement value at each time is larger than a threshold value. When an absolute value of the difference is larger than the threshold value, it is determined that there is an anomaly or an anomaly candidate.
- the detection signal is transmitted to a first acquisition unit 103, a second acquisition unit 104, and the third acquisition unit 2401.
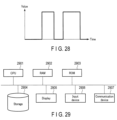
- FIG. 28 a display example of the detection signal according to the tenth embodiment is illustrated in FIG. 28 .
- a horizontal axis represents time and a vertical axis represents a value of the detection signal. For example, when a value of the detection signal is zero, it indicates that it has not been detected as an anomaly or an anomaly candidate, and when the value is not zero, it indicates that it has been detected as an anomaly or an anomaly candidate.
- the first acquisition unit 103 and the second acquisition unit 104 may receive an anomaly signal from the anomaly detection unit 2701, identify a sensor detected to be anomaly or an anomaly candidate, and set the sensor as a sensor of interest that acquires the first measurement data and the second measurement data.
- the first output information can correspond to the period of the training data of the machine learning model.
- the second output information can correspond to the period in which the predicted value is generated. Note that, in a case where the period for generating the predicted value of the sensor of interest is the second period, the second period is a period of the training data, that is, a period after the first period in the time direction.
- an anomaly or an anomaly candidate is detected by comparing the measurement value of the sensor of interest with the predicted value of the machine learning model, and the measurement value of the sensor is made to correspond to the first period corresponding to the period of the training data and the second period corresponding to the period in which the predicted value is generated.
- FIG. 29 An example of a hardware configuration of the data processing apparatus 100 according to the above-described embodiments is illustrated in a block diagram of FIG. 29 .
- the data processing apparatus 100 includes a central processing unit (CPU) 2901, a random access memory (RAM) 2902, a read only memory (ROM) 2903, a storage 2904, a display device 2905, an input device 2906, and a communication device 2907, which are each connected by a bus.
- CPU central processing unit
- RAM random access memory
- ROM read only memory
- storage 2904 a storage device
- display device 2905 an input device 2906
- communication device 2907 which are each connected by a bus.
- the CPU 2901 is a processor that executes arithmetic processing, control processing, and the like according to a program.
- the CPU 2901 uses a predetermined area of the RAM 2902 as a work area, and executes processing of each unit of the data processing apparatus 100 described above in cooperation with programs stored in the ROM 2903, the storage 2904, and the like.
- the RAM 2902 is a memory such as a synchronous dynamic random access memory (SDRAM).
- SDRAM synchronous dynamic random access memory
- the RAM 2902 functions as a work area of the CPU 2901.
- the ROM 2903 is a memory that stores programs and various types of information in a non-rewritable manner.
- the storage 2904 is an apparatus that writes and reads data in and from a magnetic recording medium such as a hard disc drive (HDD), a semiconductor storage medium such as a flash memory, an optically recordable storage medium, or the like.
- the storage 2904 writes and reads data to and from the storage medium under the control of the CPU 2901.
- the display device 2905 is a display device such as a liquid crystal display (LCD).
- the display device 2905 displays various types of information based on a display signal from the CPU 2901.
- the input device 2906 is an input device such as a mouse and a keyboard.
- the input device 2906 receives information input by operation from the user as an instruction signal, and outputs the instruction signal to the CPU 2901.
- the communication device 2907 communicates with an external device via a network in accordance with the control from the CPU 2901.
- the instruction illustrated in the processing procedure illustrated in the above-described embodiments can be executed based on a program that is software. By storing this program in advance and reading this program, a general-purpose computer system can obtain an effect similar to the effect of the control operation of the data processing apparatus described above.
- the instructions described in the above-described embodiments are recorded in a magnetic disk (flexible disk, hard disk, etc.), an optical disk (CD-ROM, CD-R, CD-RW, DVD-ROM, DVD ⁇ R, DVD ⁇ RW, Blu-ray (registered trademark) Disc, and the like), a semiconductor memory, or a recording medium similar thereto as a program that can be executed by a computer.
- a storage format may be any form as long as it is a recording medium readable by a computer or an embedded system.
- the computer reads a program from the recording medium and causes the CPU to execute instructions described in the program based on the program, it is possible to realize an operation similar to the control of the data processing apparatus of the above-described embodiment.
- the program may be acquired or read through a network.
- an operating system (OS) running on a computer database management software, middleware (MW) such as a network, or the like based on an instruction of a program installed from a recording medium to the computer or an embedded system may execute a part of each processing for realizing the present embodiments.
- OS operating system
- MW middleware
- the recording medium in the present embodiments is not limited to a medium independent of a computer or an embedded system, and includes a recording medium that downloads and stores or temporarily stores a program transmitted via a LAN, the Internet, or the like.
- the number of recording media is not limited to one, and a case where the processing in the present embodiments is executed from a plurality of media is also included in the recording media in the present embodiments, and the configuration of the media may be any configuration.
- the computer or the embedded system in the present embodiments is for executing each processing in the present embodiments based on a program stored in a recording medium, and may have any configuration such as an apparatus including one such as a personal computer or a microcomputer, or a system in which a plurality of apparatuses are connected to a network.
- the computer in the present embodiments is not limited to a personal computer, and includes an arithmetic processing apparatus, a microcomputer, and the like included in an information processing device, and collectively refers to a device and an apparatus capable of realizing a function in the present embodiments by a program.
Landscapes
- Engineering & Computer Science (AREA)
- Physics & Mathematics (AREA)
- General Physics & Mathematics (AREA)
- Automation & Control Theory (AREA)
- Software Systems (AREA)
- General Engineering & Computer Science (AREA)
- Theoretical Computer Science (AREA)
- Manufacturing & Machinery (AREA)
- Quality & Reliability (AREA)
- Artificial Intelligence (AREA)
- Computer Vision & Pattern Recognition (AREA)
- Data Mining & Analysis (AREA)
- Evolutionary Computation (AREA)
- Medical Informatics (AREA)
- Computing Systems (AREA)
- Mathematical Physics (AREA)
- Testing And Monitoring For Control Systems (AREA)
Claims (17)
- Datenverarbeitungseinrichtung (100), umfassend:eine erste Erfassungseinheit (103), die so konfiguriert ist, dass sie erste Messdaten erfasst, die ein Satz von Messwerten in einer ersten Periode sind, unter Zeitreihendaten von Messwerten eines interessierenden Sensors;eine zweite Erfassungseinheit (104), die so konfiguriert ist, dass sie zweite Messdaten erfasst, die ein Satz von Messwerten in einer zweiten Periode sind, die sich von der ersten Periode unterscheidet, unter den Zeitreihendaten der Messwerte des interessierenden Sensors;eine erste Differenzeinheit (105), die so konfiguriert ist, dass sie aus den ersten Messdaten einen ersten Differenzwertsatz berechnet, der ein Satz erster Differenzwerte in einer Zeitrichtung zu einem Zeitpunkt ist, der in der ersten Periode der Messwerte des interessierenden Sensors enthalten ist;eine zweite Differenzeinheit (106), die so konfiguriert ist, dass sie aus den zweiten Messdaten einen zweiten Differenzwertsatz berechnet, der ein Satz zweiter Differenzwerte in einer Zeitrichtung zu einem Zeitpunkt ist, der in der zweiten Periode der Messwerte des interessierenden Sensors enthalten ist;eine erste Verteilungseinheit (107), die so konfiguriert ist, dass sie eine erste Differenzwertverteilung unter Verwendung des ersten Differenzwertsatzes erzeugt;eine zweite Verteilungseinheit (108), die so konfiguriert ist, dass sie eine zweite Differenzwertverteilung unter Verwendung des zweiten Differenzwertsatzes erzeugteine erste Ausgabeeinheit (119), die zur Ausgabe der ersten Differenzwertverteilung konfiguriert ist; undeine zweite Ausgabeeinheit (120), die zur Ausgabe der zweiten Differenzwertverteilung konfiguriert ist,wobei der erste und der zweite Differenzwert Zeitableitungen darstellen.
- Einrichtung gemäß Anspruch 1, wobei die erste Differenzeinheit (105) jeden der ersten Differenzwerte berechnet, indem sie eine Differenz zwischen einem Messwert zu einem ersten Aufmerksamkeitszeitpunkt in der ersten Periode und einem Messwert zu einem ersten Berechnungszielzeitpunkt berechnet, der von dem ersten Aufmerksamkeitszeitpunkt um eine vorbestimmte Zeit getrennt ist, und
die zweite Differenzeinheit (106) jeden der zweiten Differenzwerte berechnet, indem sie eine Differenz zwischen einem Messwert zu einem zweiten Aufmerksamkeitszeitpunkt in der zweiten Periode und einem Messwert zu einem zweiten Berechnungszielzeitpunkt, der von dem zweiten Aufmerksamkeitszeitpunkt um die vorbestimmte Zeit getrennt ist, berechnet. - Einrichtung gemäß Anspruch 2, wobei die vorbestimmte Zeit kürzer ist als eine Zeitfensterlänge eines Teils der Zeitreihendaten, die in ein maschinelles Lernmodell eingegeben werden sollen, das auf die Zeitreihendaten der Messwerte des interessierenden Sensors angewendet wird.
- Einrichtung gemäß Anspruch 2, wobei die vorbestimmte Zeit eine Zeit ist, die durch Subtraktion einer Zeiteinheit von einer Zeit erhalten wird, die einer Zeitfensterlänge eines Teils von Zeitreihendaten entspricht, die eine Eingabe für ein maschinelles Lernmodell sein sollen, das auf die Zeitreihendaten von Messwerten des interessierenden Sensors angewendet wird.
- Einrichtung gemäß Anspruch 2, wobei die vorbestimmte Zeit eine durch eine Benutzeranweisung eingestellte Zeit ist.
- Einrichtung gemäß einem der Ansprüche 1 bis 5, wobei die erste Ausgabeeinheit (119) ein erstes Trenddiagramm anzeigt, das einen zeitlichen Übergang jedes der ersten Differenzwerte in der ersten Periode anzeigt, und/oder die zweite Ausgabeeinheit (120) ein zweites Trenddiagramm anzeigt, das einen zeitlichen Übergang jedes der zweiten Differenzwerte in der zweiten Periode anzeigt.
- Einrichtung gemäß einem der Ansprüche 1 bis 6, ferner umfassend eine Punktwertberechnungseinheit (1301), die so konfiguriert ist, dass sie einen Punktwert berechnet, der der Ähnlichkeit oder Unähnlichkeit zwischen der ersten Differenzwertverteilung und der zweiten Differenzwertverteilung entspricht.
- Einrichtung gemäß Anspruch 7, die ferner eine Driftdetektionseinheit (1401) umfasst, die so konfiguriert ist, dass sie eine Detektion durchführt, indem sie berücksichtigt, dass eine Drift einer zeitlichen Ableitung des Messwerts des interessierenden Sensors zwischen der ersten Periode und der zweiten Periode in einem Fall aufgetreten ist, in dem der Wert kleiner als ein Schwellenwert ist, wenn der Wert die Ähnlichkeit repräsentiert, und in einem Fall, in dem der Wert größer als der Schwellenwert ist, wenn der Wert die Unähnlichkeit repräsentiert.
- Einrichtung gemäß Anspruch 8, wobei die Driftdetektionseinheit (1401) die Verarbeitung der Detektion einer Drift der Zeitableitung für jeden der Messwerte einer Vielzahl der interessierenden Sensoren ausführt,
die Einrichtung ferner eine Driftinformations-Ausgabeeinheit (1402) umfasst, die so konfiguriert ist, dass sie Listeninformationen von einem oder mehreren der Sensoren ausgibt, in denen die Drift der Zeitableitung erfasst wird. - Einrichtung gemäß Anspruch 8 oder Anspruch 9, wobei die Driftdetektionseinheit (1401) die Verarbeitung der Detektion einer Drift der Zeitableitung für jeden der Messwerte einer Vielzahl der interessierenden Sensoren ausführt, und
die Driftinformations-Ausgabeeinheit (1402) mindestens eine Information bezüglich einer Anzahl der Sensoren, in denen die Drift der Zeitableitung durch die Driftdetektionseinheit detektiert wird, und eine Information bezüglich einer zeitlichen Änderung in der Anzahl der Sensoren ausgibt. - Einrichtung gemäß einem der Ansprüche 1 bis 10, wobei die Ausgabeeinheit (119) und die zweite Ausgabeeinheit (120) Informationen ausgeben, die mindestens einen von einem Maximalwert, einem Minimalwert, einem Durchschnittswert und einem Medianwert der Messwerte in der ersten Periode und/oder mindestens einen von einem Maximalwert, einem Minimalwert, einem Durchschnittswert und einem Medianwert der Messwerte in der zweiten Periode betreffen.
- Einrichtung gemäß einem der Ansprüche 1 bis 11, ferner umfassend:eine Streudiagrammerzeugungseinheit (2001), die so konfiguriert ist, dass sie ein Streudiagramm erzeugt, in dem die ersten Messdaten in einem ersten Anzeigemodus und die zweiten Messdaten in einem zweiten Anzeigemodus, der sich von dem ersten Anzeigemodus unterscheidet, in einem zweidimensionalen Bereich aufgetragen werden, wobei der zweidimensionale Bereich eine erste Achse, die die interessierende Zeit darstellt, und eine zweite Achse, die die Zeit darstellt, die eine vorbestimmte Zeit von der interessierenden Zeit entfernt ist, enthält, undeine Ausgabeeinheit (2002), die zur Ausgabe des Streudiagramms konfiguriert ist.
- Einrichtung gemäß einem der Ansprüche 1 bis 12, die ferner Folgendes umfasst:eine dritte Erfassungseinheit (2401), die so konfiguriert ist,dass sie jeden Teil der Zeitreihendaten von Messwerten von einem oder mehreren Sensoren erfasst;eine Modellerfassungseinheit (2402), die konfiguriert ist, ein trainiertes Modell zu erfassen, das durch Trainingsdaten trainiert wurde, bei denen eine Datenperiode die erste Periode ist;eine Vorhersagewert-Erzeugungseinheit (2403), die so konfiguriert ist, dass sie jeden Teil der von der dritten Erfassungseinheit erfassten Zeitreihendaten in das trainierte Modell eingibt und einen Vorhersagewert erzeugt; undeine dritte Ausgabeeinheit (2404), die so konfiguriert ist, dass sie Informationen bezüglich einer Trendkurve der Messwerte und des Vorhersagewerts ausgibt.
- Einrichtung gemäß Anspruch 13, die ferner eine Anomaliedetektionseinheit (2701) umfasst, die so konfiguriert ist, dass sie feststellt, dass eine Anomalie in dem Sensor vorliegt, der die Messwerte ausgegeben hat, wenn eine Differenz zwischen jedem der Messwerte und dem Vorhersagewert größer als oder gleich einem Schwellenwert ist,
wobei der interessierende Sensor ein Sensor ist, der von der Anomaliedetektionseinheit unter den ein oder mehreren Sensoren als anomal bestimmt wird. - Einrichtung gemäß Anspruch 1, wobei die erste Periode eine Periode ist, die Trainingsdaten zur Erzeugung eines maschinellen Lernmodells entspricht, das auf die Zeitreihendaten anzuwenden ist.
- Computer-implementiertes Datenverarbeitungsverfahren, das Folgendes umfasst:Erfassen erster Messdaten, die ein Satz von Messwerten in einer ersten Periode unter Zeitreihendaten von Messwerten eines interessierenden Sensors sind;Erfassen zweiter Messdaten, die ein Satz von Messwerten in einer zweiten Periode sind, die sich von der ersten Periode unterscheidet, unter den Zeitreihendaten der Messwerte des interessierenden Sensors;Berechnen eines ersten Differenzwertsatzes aus den ersten Messdaten, der ein Satz von ersten Differenzwerten in einer Zeitrichtung zu einem Zeitpunkt ist, der in der ersten Periode der Messwerte des interessierenden Sensors enthalten ist;Berechnen eines zweiten Differenzwertsatzes aus den zweiten Messdaten, der ein Satz von zweiten Differenzwerten in einer Zeitrichtung zu einem Zeitpunkt ist, der in der zweiten Periode der Messwerte des interessierenden Sensors enthalten ist;Erzeugung einer ersten Differenzwertverteilung unter Verwendung des ersten Differenzwertsatzes;Erzeugen einer zweiten Differenzwertverteilung unter Verwendung des zweiten Differenzwertsatzes; undAusgeben der ersten Differenzwertverteilung und der zweiten Differenzwertverteilung,
wobei der erste und der zweite Differenzwert Zeitableitungen darstellen. - Programm, das computerausführbare Anweisungen enthält, wobei die Anweisungen, wenn sie von einem Prozessor ausgeführt werden, den Prozessor veranlassen, ein Verfahren durchzuführen, das umfasst:Erfassen erster Messdaten, die ein Satz von Messwerten in einer ersten Periode aus den Zeitreihendaten der Messwerte eines interessierenden Sensors sind;Erfassen zweiter Messdaten, die ein Satz von Messwerten in einer zweiten Periode sind, die sich von der ersten Periode unterscheidet, unter den Zeitreihendaten von Messwerten des interessierenden Sensors;Berechnen eines ersten Differenzwertsatzes aus den ersten Messdaten, der ein Satz von ersten Differenzwerten in einer Zeitrichtung zu einem Zeitpunkt ist, der in der ersten Periode der Messwerte des interessierenden Sensors enthalten ist;Berechnen eines zweiten Differenzwertsatzes aus den zweiten Messdaten, der ein Satz von zweiten Differenzwerten in einer Zeitrichtung zu einem Zeitpunkt ist, der in der zweiten Periode der Messwerte des interessierenden Sensors enthalten ist;Erzeugen einer ersten Differenzwertverteilung unter Verwendung des ersten Differenzwertsatzes;Erzeugen einer zweiten Differenzwertverteilung unter Verwendung des zweiten Differenzwertsatzes; undAusgeben der ersten Differenzwertverteilung und der zweiten Differenzwertverteilung,wobei der erste und der zweite Differenzwert Zeitableitungen darstellen.
Applications Claiming Priority (1)
| Application Number | Priority Date | Filing Date | Title |
|---|---|---|---|
| JP2021179004A JP7646520B2 (ja) | 2021-11-01 | 2021-11-01 | データ処理装置、方法およびプログラム |
Publications (2)
| Publication Number | Publication Date |
|---|---|
| EP4174603A1 EP4174603A1 (de) | 2023-05-03 |
| EP4174603B1 true EP4174603B1 (de) | 2025-02-19 |
Family
ID=83546939
Family Applications (1)
| Application Number | Title | Priority Date | Filing Date |
|---|---|---|---|
| EP22195334.2A Active EP4174603B1 (de) | 2021-11-01 | 2022-09-13 | Datenverarbeitungsvorrichtung, -verfahren und -programm |
Country Status (3)
| Country | Link |
|---|---|
| US (1) | US12124251B2 (de) |
| EP (1) | EP4174603B1 (de) |
| JP (1) | JP7646520B2 (de) |
Families Citing this family (1)
| Publication number | Priority date | Publication date | Assignee | Title |
|---|---|---|---|---|
| WO2025221862A1 (en) * | 2024-04-16 | 2025-10-23 | Nec Laboratories America, Inc. | Incident diagnosis with retrieval augmented llm for medical decision making |
Family Cites Families (15)
| Publication number | Priority date | Publication date | Assignee | Title |
|---|---|---|---|---|
| JP2812252B2 (ja) * | 1995-06-19 | 1998-10-22 | トヨタ自動車株式会社 | 酸素濃度センサの異常判定装置 |
| WO2007087728A1 (en) | 2006-02-03 | 2007-08-09 | Recherche 2000 Inc. | Adaptive method and system of monitoring signals for detecting anomalies |
| JP2007279887A (ja) | 2006-04-04 | 2007-10-25 | Nippon Telegr & Teleph Corp <Ntt> | 特異パターン検出システム、モデル学習装置、特異パターン検出装置、特異パターン検出方法、及び、コンピュータプログラム |
| JP2014081863A (ja) * | 2012-10-18 | 2014-05-08 | Sony Corp | 情報処理装置、情報処理方法、及び、プログラム |
| JP2014240266A (ja) | 2013-05-13 | 2014-12-25 | 株式会社豊田中央研究所 | センサドリフト量推定装置及びプログラム |
| JP2015011388A (ja) * | 2013-06-26 | 2015-01-19 | 株式会社東芝 | データ処理装置及びプラント監視システム |
| JP7179444B2 (ja) | 2017-03-29 | 2022-11-29 | 三菱重工業株式会社 | 予兆検知システム及び予兆検知方法 |
| JP7299002B2 (ja) * | 2018-08-23 | 2023-06-27 | ファナック株式会社 | 判別装置及び機械学習方法 |
| JP7310137B2 (ja) * | 2018-12-28 | 2023-07-19 | 株式会社Gsユアサ | データ処理装置、データ処理方法、及びコンピュータプログラム |
| JP7068246B2 (ja) | 2019-08-26 | 2022-05-16 | 株式会社東芝 | 異常判定装置、および、異常判定方法 |
| JP7481897B2 (ja) | 2020-05-12 | 2024-05-13 | 株式会社東芝 | 監視装置、監視方法、プログラムおよびモデル訓練装置 |
| JP7391765B2 (ja) | 2020-05-29 | 2023-12-05 | 株式会社東芝 | プラント監視支援装置、方法及びプログラム |
| JP7504772B2 (ja) | 2020-11-05 | 2024-06-24 | 株式会社東芝 | 異常判定装置、学習装置及び異常判定方法 |
| CN112526973A (zh) | 2020-12-01 | 2021-03-19 | 上海爱信诺航芯电子科技有限公司 | 微控制器模数转换器微分非线性和积分非线性的测试方法 |
| JP7717549B2 (ja) | 2021-09-15 | 2025-08-04 | 株式会社東芝 | 監視装置、方法およびプログラム |
-
2021
- 2021-11-01 JP JP2021179004A patent/JP7646520B2/ja active Active
-
2022
- 2022-09-12 US US17/942,976 patent/US12124251B2/en active Active
- 2022-09-13 EP EP22195334.2A patent/EP4174603B1/de active Active
Also Published As
| Publication number | Publication date |
|---|---|
| US12124251B2 (en) | 2024-10-22 |
| JP7646520B2 (ja) | 2025-03-17 |
| JP2023067606A (ja) | 2023-05-16 |
| EP4174603A1 (de) | 2023-05-03 |
| US20230140271A1 (en) | 2023-05-04 |
Similar Documents
| Publication | Publication Date | Title |
|---|---|---|
| US11521105B2 (en) | Machine learning device and machine learning method for learning fault prediction of main shaft or motor which drives main shaft, and fault prediction device and fault prediction system including machine learning device | |
| EP3910437B1 (de) | Überwachungsvorrichtung, überwachungsverfahren und computerlesbares medium | |
| US11526783B2 (en) | Abnormality determination device, learning device, and abnormality determination method | |
| JP5901140B2 (ja) | システムの高い可用性のためにセンサデータを補間する方法、コンピュータプログラム、システム。 | |
| US10228994B2 (en) | Information processing system, information processing method, and program | |
| US20200143292A1 (en) | Signature enhancement for deviation measurement-based classification of a detected anomaly in an industrial asset | |
| US11146444B2 (en) | Computer system alert situation detection based on trend analysis | |
| JP6948197B2 (ja) | プロセス監視装置 | |
| JP5824333B2 (ja) | スティックスリップ検出装置および検出方法 | |
| EP4174603B1 (de) | Datenverarbeitungsvorrichtung, -verfahren und -programm | |
| CN106652393A (zh) | 假警报确定方法及装置 | |
| JP7127305B2 (ja) | 情報処理装置、情報処理方法、プログラム | |
| US20080288213A1 (en) | Machine condition monitoring using discontinuity detection | |
| JP5949135B2 (ja) | 異常診断方法及び異常診断装置 | |
| CA3114157C (en) | Process management device, process management method, and process management program storage medium | |
| EP4152115B1 (de) | Überwachungsgerät, verfahren und programm | |
| US12106191B2 (en) | Continuous learning process using concept drift monitoring | |
| US20220188570A1 (en) | Learning apparatus, learning method, computer program and recording medium | |
| US11585732B2 (en) | Apparatus and method for diagnosing failure of plant | |
| US20250085696A1 (en) | Abnormality detection apparatus, method, and non-transitory computer readable medium | |
| KR20230073587A (ko) | 발전소 운전 건전성 예측 시스템 및 방법 | |
| KR101882384B1 (ko) | 다중 센서의 신뢰도 향상을 위한 통합적 교차 교정 장치 및 방법 | |
| US10677619B2 (en) | Method of monitoring a vector-based position sensor | |
| JP2013191136A (ja) | 異常診断装置 | |
| US20250191464A1 (en) | Lane change detection apparatus, lane change detection method, and non-transitory computer-readable medium |
Legal Events
| Date | Code | Title | Description |
|---|---|---|---|
| PUAI | Public reference made under article 153(3) epc to a published international application that has entered the european phase |
Free format text: ORIGINAL CODE: 0009012 |
|
| STAA | Information on the status of an ep patent application or granted ep patent |
Free format text: STATUS: REQUEST FOR EXAMINATION WAS MADE |
|
| 17P | Request for examination filed |
Effective date: 20220913 |
|
| AK | Designated contracting states |
Kind code of ref document: A1 Designated state(s): AL AT BE BG CH CY CZ DE DK EE ES FI FR GB GR HR HU IE IS IT LI LT LU LV MC MK MT NL NO PL PT RO RS SE SI SK SM TR |
|
| GRAP | Despatch of communication of intention to grant a patent |
Free format text: ORIGINAL CODE: EPIDOSNIGR1 |
|
| STAA | Information on the status of an ep patent application or granted ep patent |
Free format text: STATUS: GRANT OF PATENT IS INTENDED |
|
| RIC1 | Information provided on ipc code assigned before grant |
Ipc: G05B 23/02 20060101AFI20240910BHEP |
|
| INTG | Intention to grant announced |
Effective date: 20240919 |
|
| GRAS | Grant fee paid |
Free format text: ORIGINAL CODE: EPIDOSNIGR3 |
|
| GRAA | (expected) grant |
Free format text: ORIGINAL CODE: 0009210 |
|
| STAA | Information on the status of an ep patent application or granted ep patent |
Free format text: STATUS: THE PATENT HAS BEEN GRANTED |
|
| AK | Designated contracting states |
Kind code of ref document: B1 Designated state(s): AL AT BE BG CH CY CZ DE DK EE ES FI FR GB GR HR HU IE IS IT LI LT LU LV MC MK MT NL NO PL PT RO RS SE SI SK SM TR |
|
| REG | Reference to a national code |
Ref country code: GB Ref legal event code: FG4D |
|
| REG | Reference to a national code |
Ref country code: CH Ref legal event code: EP |
|
| REG | Reference to a national code |
Ref country code: IE Ref legal event code: FG4D |
|
| REG | Reference to a national code |
Ref country code: DE Ref legal event code: R096 Ref document number: 602022010746 Country of ref document: DE |
|
| REG | Reference to a national code |
Ref country code: NL Ref legal event code: MP Effective date: 20250219 |
|
| PG25 | Lapsed in a contracting state [announced via postgrant information from national office to epo] |
Ref country code: RS Free format text: LAPSE BECAUSE OF FAILURE TO SUBMIT A TRANSLATION OF THE DESCRIPTION OR TO PAY THE FEE WITHIN THE PRESCRIBED TIME-LIMIT Effective date: 20250519 |
|
| PG25 | Lapsed in a contracting state [announced via postgrant information from national office to epo] |
Ref country code: FI Free format text: LAPSE BECAUSE OF FAILURE TO SUBMIT A TRANSLATION OF THE DESCRIPTION OR TO PAY THE FEE WITHIN THE PRESCRIBED TIME-LIMIT Effective date: 20250219 |
|
| PG25 | Lapsed in a contracting state [announced via postgrant information from national office to epo] |
Ref country code: PL Free format text: LAPSE BECAUSE OF FAILURE TO SUBMIT A TRANSLATION OF THE DESCRIPTION OR TO PAY THE FEE WITHIN THE PRESCRIBED TIME-LIMIT Effective date: 20250219 |
|
| PG25 | Lapsed in a contracting state [announced via postgrant information from national office to epo] |
Ref country code: ES Free format text: LAPSE BECAUSE OF FAILURE TO SUBMIT A TRANSLATION OF THE DESCRIPTION OR TO PAY THE FEE WITHIN THE PRESCRIBED TIME-LIMIT Effective date: 20250219 |
|
| REG | Reference to a national code |
Ref country code: LT Ref legal event code: MG9D |
|
| PG25 | Lapsed in a contracting state [announced via postgrant information from national office to epo] |
Ref country code: NO Free format text: LAPSE BECAUSE OF FAILURE TO SUBMIT A TRANSLATION OF THE DESCRIPTION OR TO PAY THE FEE WITHIN THE PRESCRIBED TIME-LIMIT Effective date: 20250519 Ref country code: IS Free format text: LAPSE BECAUSE OF FAILURE TO SUBMIT A TRANSLATION OF THE DESCRIPTION OR TO PAY THE FEE WITHIN THE PRESCRIBED TIME-LIMIT Effective date: 20250619 |
|
| PG25 | Lapsed in a contracting state [announced via postgrant information from national office to epo] |
Ref country code: NL Free format text: LAPSE BECAUSE OF FAILURE TO SUBMIT A TRANSLATION OF THE DESCRIPTION OR TO PAY THE FEE WITHIN THE PRESCRIBED TIME-LIMIT Effective date: 20250219 |
|
| PG25 | Lapsed in a contracting state [announced via postgrant information from national office to epo] |
Ref country code: HR Free format text: LAPSE BECAUSE OF FAILURE TO SUBMIT A TRANSLATION OF THE DESCRIPTION OR TO PAY THE FEE WITHIN THE PRESCRIBED TIME-LIMIT Effective date: 20250219 |
|
| PG25 | Lapsed in a contracting state [announced via postgrant information from national office to epo] |
Ref country code: LV Free format text: LAPSE BECAUSE OF FAILURE TO SUBMIT A TRANSLATION OF THE DESCRIPTION OR TO PAY THE FEE WITHIN THE PRESCRIBED TIME-LIMIT Effective date: 20250219 Ref country code: PT Free format text: LAPSE BECAUSE OF FAILURE TO SUBMIT A TRANSLATION OF THE DESCRIPTION OR TO PAY THE FEE WITHIN THE PRESCRIBED TIME-LIMIT Effective date: 20250620 |
|
| PG25 | Lapsed in a contracting state [announced via postgrant information from national office to epo] |
Ref country code: BG Free format text: LAPSE BECAUSE OF FAILURE TO SUBMIT A TRANSLATION OF THE DESCRIPTION OR TO PAY THE FEE WITHIN THE PRESCRIBED TIME-LIMIT Effective date: 20250219 Ref country code: GR Free format text: LAPSE BECAUSE OF FAILURE TO SUBMIT A TRANSLATION OF THE DESCRIPTION OR TO PAY THE FEE WITHIN THE PRESCRIBED TIME-LIMIT Effective date: 20250520 |
|
| REG | Reference to a national code |
Ref country code: AT Ref legal event code: MK05 Ref document number: 1768878 Country of ref document: AT Kind code of ref document: T Effective date: 20250219 |
|
| PG25 | Lapsed in a contracting state [announced via postgrant information from national office to epo] |
Ref country code: SE Free format text: LAPSE BECAUSE OF FAILURE TO SUBMIT A TRANSLATION OF THE DESCRIPTION OR TO PAY THE FEE WITHIN THE PRESCRIBED TIME-LIMIT Effective date: 20250219 |
|
| PG25 | Lapsed in a contracting state [announced via postgrant information from national office to epo] |
Ref country code: SM Free format text: LAPSE BECAUSE OF FAILURE TO SUBMIT A TRANSLATION OF THE DESCRIPTION OR TO PAY THE FEE WITHIN THE PRESCRIBED TIME-LIMIT Effective date: 20250219 |
|
| PG25 | Lapsed in a contracting state [announced via postgrant information from national office to epo] |
Ref country code: DK Free format text: LAPSE BECAUSE OF FAILURE TO SUBMIT A TRANSLATION OF THE DESCRIPTION OR TO PAY THE FEE WITHIN THE PRESCRIBED TIME-LIMIT Effective date: 20250219 |
|
| PGFP | Annual fee paid to national office [announced via postgrant information from national office to epo] |
Ref country code: DE Payment date: 20250702 Year of fee payment: 4 |
|
| PG25 | Lapsed in a contracting state [announced via postgrant information from national office to epo] |
Ref country code: IT Free format text: LAPSE BECAUSE OF FAILURE TO SUBMIT A TRANSLATION OF THE DESCRIPTION OR TO PAY THE FEE WITHIN THE PRESCRIBED TIME-LIMIT Effective date: 20250219 |
|
| PG25 | Lapsed in a contracting state [announced via postgrant information from national office to epo] |
Ref country code: AT Free format text: LAPSE BECAUSE OF FAILURE TO SUBMIT A TRANSLATION OF THE DESCRIPTION OR TO PAY THE FEE WITHIN THE PRESCRIBED TIME-LIMIT Effective date: 20250219 |
|
| PGFP | Annual fee paid to national office [announced via postgrant information from national office to epo] |
Ref country code: FR Payment date: 20250703 Year of fee payment: 4 |
|
| PG25 | Lapsed in a contracting state [announced via postgrant information from national office to epo] |
Ref country code: EE Free format text: LAPSE BECAUSE OF FAILURE TO SUBMIT A TRANSLATION OF THE DESCRIPTION OR TO PAY THE FEE WITHIN THE PRESCRIBED TIME-LIMIT Effective date: 20250219 Ref country code: CZ Free format text: LAPSE BECAUSE OF FAILURE TO SUBMIT A TRANSLATION OF THE DESCRIPTION OR TO PAY THE FEE WITHIN THE PRESCRIBED TIME-LIMIT Effective date: 20250219 |
|
| PG25 | Lapsed in a contracting state [announced via postgrant information from national office to epo] |
Ref country code: RO Free format text: LAPSE BECAUSE OF FAILURE TO SUBMIT A TRANSLATION OF THE DESCRIPTION OR TO PAY THE FEE WITHIN THE PRESCRIBED TIME-LIMIT Effective date: 20250219 |
|
| PG25 | Lapsed in a contracting state [announced via postgrant information from national office to epo] |
Ref country code: SK Free format text: LAPSE BECAUSE OF FAILURE TO SUBMIT A TRANSLATION OF THE DESCRIPTION OR TO PAY THE FEE WITHIN THE PRESCRIBED TIME-LIMIT Effective date: 20250219 |
|
| REG | Reference to a national code |
Ref country code: DE Ref legal event code: R097 Ref document number: 602022010746 Country of ref document: DE |
|
| PLBE | No opposition filed within time limit |
Free format text: ORIGINAL CODE: 0009261 |
|
| STAA | Information on the status of an ep patent application or granted ep patent |
Free format text: STATUS: NO OPPOSITION FILED WITHIN TIME LIMIT |
|
| 26N | No opposition filed |
Effective date: 20251120 |