EP3483587B1 - Analysevorrichtung und analyseverfahren - Google Patents
Analysevorrichtung und analyseverfahren Download PDFInfo
- Publication number
- EP3483587B1 EP3483587B1 EP18205272.0A EP18205272A EP3483587B1 EP 3483587 B1 EP3483587 B1 EP 3483587B1 EP 18205272 A EP18205272 A EP 18205272A EP 3483587 B1 EP3483587 B1 EP 3483587B1
- Authority
- EP
- European Patent Office
- Prior art keywords
- gate
- count value
- processing unit
- measurement
- signal
- Prior art date
- Legal status (The legal status is an assumption and is not a legal conclusion. Google has not performed a legal analysis and makes no representation as to the accuracy of the status listed.)
- Active
Links
Images






Classifications
-
- G—PHYSICS
- G01—MEASURING; TESTING
- G01N—INVESTIGATING OR ANALYSING MATERIALS BY DETERMINING THEIR CHEMICAL OR PHYSICAL PROPERTIES
- G01N15/00—Investigating characteristics of particles; Investigating permeability, pore-volume or surface-area of porous materials
- G01N15/10—Investigating individual particles
- G01N15/14—Optical investigation techniques, e.g. flow cytometry
- G01N15/1456—Optical investigation techniques, e.g. flow cytometry without spatial resolution of the texture or inner structure of the particle, e.g. processing of pulse signals
-
- G—PHYSICS
- G01—MEASURING; TESTING
- G01N—INVESTIGATING OR ANALYSING MATERIALS BY DETERMINING THEIR CHEMICAL OR PHYSICAL PROPERTIES
- G01N21/00—Investigating or analysing materials by the use of optical means, i.e. using sub-millimetre waves, infrared, visible or ultraviolet light
- G01N21/01—Arrangements or apparatus for facilitating the optical investigation
-
- B—PERFORMING OPERATIONS; TRANSPORTING
- B01—PHYSICAL OR CHEMICAL PROCESSES OR APPARATUS IN GENERAL
- B01L—CHEMICAL OR PHYSICAL LABORATORY APPARATUS FOR GENERAL USE
- B01L3/00—Containers or dishes for laboratory use, e.g. laboratory glassware; Droppers
- B01L3/50—Containers for the purpose of retaining a material to be analysed, e.g. test tubes
- B01L3/502—Containers for the purpose of retaining a material to be analysed, e.g. test tubes with fluid transport, e.g. in multi-compartment structures
- B01L3/5027—Containers for the purpose of retaining a material to be analysed, e.g. test tubes with fluid transport, e.g. in multi-compartment structures by integrated microfluidic structures, i.e. dimensions of channels and chambers are such that surface tension forces are important, e.g. lab-on-a-chip
-
- B—PERFORMING OPERATIONS; TRANSPORTING
- B82—NANOTECHNOLOGY
- B82Y—SPECIFIC USES OR APPLICATIONS OF NANOSTRUCTURES; MEASUREMENT OR ANALYSIS OF NANOSTRUCTURES; MANUFACTURE OR TREATMENT OF NANOSTRUCTURES
- B82Y15/00—Nanotechnology for interacting, sensing or actuating, e.g. quantum dots as markers in protein assays or molecular motors
-
- G—PHYSICS
- G01—MEASURING; TESTING
- G01N—INVESTIGATING OR ANALYSING MATERIALS BY DETERMINING THEIR CHEMICAL OR PHYSICAL PROPERTIES
- G01N21/00—Investigating or analysing materials by the use of optical means, i.e. using sub-millimetre waves, infrared, visible or ultraviolet light
- G01N21/17—Systems in which incident light is modified in accordance with the properties of the material investigated
-
- G—PHYSICS
- G01—MEASURING; TESTING
- G01N—INVESTIGATING OR ANALYSING MATERIALS BY DETERMINING THEIR CHEMICAL OR PHYSICAL PROPERTIES
- G01N21/00—Investigating or analysing materials by the use of optical means, i.e. using sub-millimetre waves, infrared, visible or ultraviolet light
- G01N21/17—Systems in which incident light is modified in accordance with the properties of the material investigated
- G01N21/25—Colour; Spectral properties, i.e. comparison of effect of material on the light at two or more different wavelengths or wavelength bands
- G01N21/251—Colorimeters; Construction thereof
- G01N21/253—Colorimeters; Construction thereof for batch operation, i.e. multisample apparatus
-
- G—PHYSICS
- G01—MEASURING; TESTING
- G01N—INVESTIGATING OR ANALYSING MATERIALS BY DETERMINING THEIR CHEMICAL OR PHYSICAL PROPERTIES
- G01N33/00—Investigating or analysing materials by specific methods not covered by groups G01N1/00 - G01N31/00
- G01N33/48—Biological material, e.g. blood, urine; Haemocytometers
- G01N33/50—Chemical analysis of biological material, e.g. blood, urine; Testing involving biospecific ligand binding methods; Immunological testing
- G01N33/53—Immunoassay; Biospecific binding assay; Materials therefor
-
- G—PHYSICS
- G01—MEASURING; TESTING
- G01N—INVESTIGATING OR ANALYSING MATERIALS BY DETERMINING THEIR CHEMICAL OR PHYSICAL PROPERTIES
- G01N35/00—Automatic analysis not limited to methods or materials provided for in any single one of groups G01N1/00 - G01N33/00; Handling materials therefor
- G01N35/00029—Automatic analysis not limited to methods or materials provided for in any single one of groups G01N1/00 - G01N33/00; Handling materials therefor provided with flat sample substrates, e.g. slides
- G01N35/00069—Automatic analysis not limited to methods or materials provided for in any single one of groups G01N1/00 - G01N33/00; Handling materials therefor provided with flat sample substrates, e.g. slides whereby the sample substrate is of the bio-disk type, i.e. having the format of an optical disk
-
- G—PHYSICS
- G01—MEASURING; TESTING
- G01N—INVESTIGATING OR ANALYSING MATERIALS BY DETERMINING THEIR CHEMICAL OR PHYSICAL PROPERTIES
- G01N35/00—Automatic analysis not limited to methods or materials provided for in any single one of groups G01N1/00 - G01N33/00; Handling materials therefor
- G01N35/02—Automatic analysis not limited to methods or materials provided for in any single one of groups G01N1/00 - G01N33/00; Handling materials therefor using a plurality of sample containers moved by a conveyor system past one or more treatment or analysis stations
- G01N35/04—Details of the conveyor system
-
- G—PHYSICS
- G01—MEASURING; TESTING
- G01N—INVESTIGATING OR ANALYSING MATERIALS BY DETERMINING THEIR CHEMICAL OR PHYSICAL PROPERTIES
- G01N15/00—Investigating characteristics of particles; Investigating permeability, pore-volume or surface-area of porous materials
- G01N15/10—Investigating individual particles
- G01N15/14—Optical investigation techniques, e.g. flow cytometry
- G01N2015/1486—Counting the particles
-
- G—PHYSICS
- G01—MEASURING; TESTING
- G01N—INVESTIGATING OR ANALYSING MATERIALS BY DETERMINING THEIR CHEMICAL OR PHYSICAL PROPERTIES
- G01N21/00—Investigating or analysing materials by the use of optical means, i.e. using sub-millimetre waves, infrared, visible or ultraviolet light
- G01N21/01—Arrangements or apparatus for facilitating the optical investigation
- G01N2021/0162—Arrangements or apparatus for facilitating the optical investigation using microprocessors for control of a sequence of operations, e.g. test, powering, switching, processing
-
- G—PHYSICS
- G01—MEASURING; TESTING
- G01N—INVESTIGATING OR ANALYSING MATERIALS BY DETERMINING THEIR CHEMICAL OR PHYSICAL PROPERTIES
- G01N21/00—Investigating or analysing materials by the use of optical means, i.e. using sub-millimetre waves, infrared, visible or ultraviolet light
- G01N21/17—Systems in which incident light is modified in accordance with the properties of the material investigated
- G01N2021/1789—Time resolved
- G01N2021/1791—Time resolved stroboscopic; pulse gated; time range gated
-
- G—PHYSICS
- G01—MEASURING; TESTING
- G01N—INVESTIGATING OR ANALYSING MATERIALS BY DETERMINING THEIR CHEMICAL OR PHYSICAL PROPERTIES
- G01N35/00—Automatic analysis not limited to methods or materials provided for in any single one of groups G01N1/00 - G01N33/00; Handling materials therefor
- G01N35/02—Automatic analysis not limited to methods or materials provided for in any single one of groups G01N1/00 - G01N33/00; Handling materials therefor using a plurality of sample containers moved by a conveyor system past one or more treatment or analysis stations
- G01N35/04—Details of the conveyor system
- G01N2035/0439—Rotary sample carriers, i.e. carousels
- G01N2035/0441—Rotary sample carriers, i.e. carousels for samples
-
- G—PHYSICS
- G01—MEASURING; TESTING
- G01N—INVESTIGATING OR ANALYSING MATERIALS BY DETERMINING THEIR CHEMICAL OR PHYSICAL PROPERTIES
- G01N35/00—Automatic analysis not limited to methods or materials provided for in any single one of groups G01N1/00 - G01N33/00; Handling materials therefor
- G01N35/02—Automatic analysis not limited to methods or materials provided for in any single one of groups G01N1/00 - G01N33/00; Handling materials therefor using a plurality of sample containers moved by a conveyor system past one or more treatment or analysis stations
- G01N35/04—Details of the conveyor system
- G01N2035/0474—Details of actuating means for conveyors or pipettes
- G01N2035/0491—Position sensing, encoding; closed-loop control
Definitions
- the present disclosure relates to an analysis device and an analysis method of analyzing biomaterials such as antigens and antibodies.
- Immunoassays are known to quantitatively analyze disease detection and therapeutic effects by detecting particular antigens or antibodies as biomarkers associated with diseases.
- JP 2017-58242 A discloses an analysis device in which antibodies that are fixed to a reaction region on a specimen analysis disc, are allowed to bind to antigens provided on nanoparticles to be analyzed in a specimen, and the antigens are labeled by nanoparticles for labeling (hereinafter referred to as "nanoparticles") having antibodies and are scanned with laser light emitted from an optical pickup so as to detect the nanoparticles captured on the reaction region.
- the analysis device disclosed in JP 2017-58242 A is an optical disc device utilized for detecting a specimen.
- the conventional analysis device as disclosed in JP 2017-58242 A moves the optical pickup per track in a radial direction of the specimen analysis disc being rotated.
- the analysis device generates a plurality of gate signals for dividing the reaction region at regular time intervals in the rotating direction of the specimen analysis disc, and detects the nanoparticles captured on the reaction region per gate signal.
- the analysis device indirectly measures the nanoparticles captured on the reaction region by counting the number of the nanoparticles detected, so as to indirectly measure a distribution of the nanoparticles in the reaction region.
- the measurement resolution is determined depending on a gate width of a gate signal in the rotating direction of the specimen analysis disc.
- a decrease in the gate width of the gate signal can improve the measurement resolution.
- the gate width is decreased, the number of gate signals generated in the rotating direction of the specimen analysis disc is increased, resulting in an increase in circuit scale.
- WO 2017 134 944 A describes an analyzer and an analysis method for analyzing biological substances.
- the analysis device is provided with a turntable, an optical pickup, and a control unit.
- the turntable holds a sample analysis disk having a reaction region in which fine particles that bind to a substance to be detected are captured.
- the optical pickup irradiates the reaction region with laser light, receives the resultant reflected light, and generates a light reception level signal.
- the control unit continuously generates a plurality of measurement gate signals for measuring the number of fine particles captured in the reaction region, measures the number of fine particles for each of the measurement gate signals on the basis of the light reception level signal, identifies a measurement gate section in the reaction region on the basis of the measurement result for each of the measurement gate signals, and adds the number of the fine particles in the measurement gate section for each of the measurement gate signals.
- An object of the embodiments is to provide an analysis device and an analysis method with an increase in circuit scale avoided and a measurement resolution in a rotating direction of a specimen analysis disc improved.
- the analysis device 100 includes a control graphical user interface (GUI) 101, a control central processing unit (CPU) 120, a detection circuit 103, and an optical disc drive 110.
- GUI graphical user interface
- CPU central processing unit
- the control GUI 101 receives an instruction by a user to output a startup command signal MS to the control CPU 120.
- the control CPU 120 starts up the detection circuit 103 and the optical disc drive 110 when the startup command signal MS is input.
- the control CPU 120 includes a count information processing unit 130, a gate information processing unit 140, a circuit control unit 150, and a drive control unit 160.
- the count information processing unit 130 includes a count value generation processing unit 131, a gate shift processing unit 132, a count value distribution data processing unit 133, a reaction region specifying processing unit 134, and a defect correction processing unit 135.
- the count information processing unit 130, the gate information processing unit 140, the circuit control unit 150, and the drive control unit 160 may each be composed of software executed by the control CPU 120 or composed of hardware such as a circuit.
- the count information processing unit 130 includes the count value generation processing unit 131, the gate shift processing unit 132, the count value distribution data processing unit 133, the reaction region specifying processing unit 134, and the defect correction processing unit 135.
- the count value generation processing unit 131, the gate shift processing unit 132, the count value distribution data processing unit 133, the reaction region specifying processing unit 134, and the defect correction processing unit 135 may each be composed of software executed by the control CPU 120 or composed of hardware such as a circuit.
- the optical disc drive 110 includes an optical pickup 111 and a reference position detection sensor 112.
- the specimen analysis disc 10 having a circular shape is provided with a reference position defining portion 11 which is a notch at the circumferential edge of the disc.
- the reference position defining portion 11 is used for defining a reference position in a rotating direction of the specimen analysis disc 10.
- the specimen analysis disc 10 is removably attached to the optical disc drive 110.
- the surface of the specimen analysis disc 10 is provided with recesses 12 and convex regions 13 alternately arranged in a radial direction.
- the recesses 12 and the convex regions 13 are formed in a spiral from the inner side to the outer side of the specimen analysis disc 10.
- the recesses 12 correspond to grooves of an optical disc.
- the convex regions 13 correspond to lands of an optical disc.
- a track pitch of the specimen analysis disc 10, which corresponds to a track pitch of an optical disc, is 320 nanometers, for example.
- nanoparticles 15 specifically binding to detection target substances by an antigen-antibody reaction are captured on the recesses 12 in a reaction region 14 formed on the specimen analysis disc 10.
- the drive control unit 160 controls the optical disc drive 110.
- the drive control unit 160 drives or stops the optical disc drive 110.
- the optical disc drive 110 controls the specimen analysis disc 10 to rotate or stop.
- the optical disc drive 110 moves the optical pickup 111 in the radial direction of the specimen analysis disc 10 to a target measurement radial position.
- the optical pickup 111 includes an objective lens 113 .
- the optical disc drive 110 moves the optical pickup 111 to the measurement radial position at which the measurement of the specimen analysis disc 10 starts, and causes the optical pickup 111 to emit laser light 111a toward the specimen analysis disc 10.
- the optical disc drive 110 can adjust the objective lens 113 in a vertical direction so that the laser light 111a is condensed on the recess 12 in the reaction region 14.
- the reaction region 14 is irradiated with the laser light 111a emitted from the optical pickup 111 with the specimen analysis disc 10 rotating so as to be scanned along the recess 12 corresponding to a track of the specimen analysis disc 10.
- the optical pickup 111 receives the reflected light of the laser light 111a from the specimen analysis disc 10 to generate a light reception detection signal JS, and outputs the signal to the detection circuit 103.
- the optical disc drive 110 detects the measurement radial position for the optical pickup 111 in the specimen analysis disc 10 to generate measurement radial positional information HJ, and outputs the information to the drive control unit 160.
- the drive control unit 160 outputs the measurement radial positional information HJ to the gate information processing unit 140.
- the gate information processing unit 140 outputs the measurement radial positional information HJ to the count value generation processing unit 131.
- the reference position detection sensor 112 is placed adjacent to the circumferential edge of the specimen analysis disc 10.
- the reference position detection sensor 112 is an optical sensor such as a photodetector.
- the reference position detection sensor 112 detects the reference position defining portion 11 in the specimen analysis disc 10 to generate a reference position detection signal KS, and outputs the signal to the detection circuit 130.
- the gate information processing unit 140 generates gate information GJ1 including a reference shift amount ⁇ a, a phase difference ⁇ a + ⁇ a, and a gate width W based on the measurement radial positional information HJ, and outputs the information to the circuit control unit 150.
- the reference shift amount ⁇ a, the phase difference ⁇ a + ⁇ a, and the gate width W will be described below.
- the circuit control unit 150 outputs the gate information GJ1 to the detection circuit 103.
- the detection circuit 103 generates a gate signal GS based on the gate information GJ1.
- the detection circuit 103 synchronizes the timing between the gate signal GS and the light reception detection signal JS on the basis of the reference position detection signal KS, as shown in Fig. 4 .
- a method of generating gate signals GS will be described below.
- the detection circuit 103 extracts nanoparticle pulse signals BS from the light reception detection signal JS per gate signal GS.
- the nanoparticle pulse signals BS are generated every time the nanoparticles 15 are scanned with the laser light 111a.
- the detection circuit 103 counts the extracted nanoparticle pulse signals BS, generates count values GCV (first count values) of the corresponding gate signals GS, and sequentially outputs the values to the circuit control unit 150 per gate signal GS.
- the circuit control unit 150 sequentially outputs the count values GCV of the corresponding gate signals GS to the count value generation processing unit 131 per gate signal GS.
- the gate information processing unit 140 sets the gate width W of each gate signal GS in each measurement radial position (track) of the specimen analysis disc 10 so as to divide a measurement region 16 including the reaction region 14 shown in Fig. 2 into the number m (m is an integer of two or more) in the rotating direction of the specimen analysis disc 10.
- the gate width W is determined according to the rotation number of the specimen analysis disc 10 in the respective measurement radial positions. When the specimen analysis disc 10 is rotated at a constant linear velocity, the gate widths W in the respective measurement radial positions are set to be the same.
- a case of setting the gate width W of each gate signal GS to divide the measurement region 16 into three (m 3) is described below with reference to Fig. 5A to Fig. 5C .
- the gate information processing unit 140 sets the gate width W of each gate signal GS so as to divide the measurement region 16 into three in the rotating direction of the specimen analysis disc 10.
- the gate information unit 140 sets the reference shift amount ⁇ a for each measurement radial position.
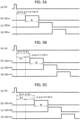
- the gate information processing unit 140 sets, as the reference shift amount ⁇ a, a period of time from a point at which the reference position defining portion 11 is detected to a point at which the measurement region 16 reaches a measurement radial position rn corresponding to a track TRn (n is the track number) on the basis of the reference position detection signal KS, as shown in Fig. 5A .
- the gate information processing unit 140 sets, as the reference shift amount ⁇ a, the period of time from the fall of the reference position detection signal KS to the rise of the first gate signal GSn.
- the gate shift amount ⁇ a is equal to a positive integral multiple of the unit gate shift amount ⁇ ua.
- the detection circuit 103 generates the gate signals GS based on the reference position detection signal KS and the gate information GJ1. For example, the detection circuit 103 generates a gate signal GSna which raises after the fall of the reference position detection signal KS with the phase difference ⁇ a in the measurement radial position rn, and sequentially generates a gate signal GSnb and a gate signal GSnc.
- the detection circuit 103 generates a gate signal GSn+1a which raises after the fall of the reference position detection signal KS with the phase difference ⁇ a + W/3 in the measurement radial position rn+1, and sequentially generates a gate signal GSn+1b and a gate signal GSn+lc.
- the detection circuit 103 further generates a gate signal GSn+2a which raises after the fall of the reference position detection signal KS with the phase difference ⁇ a + 2 ⁇ W/3 in the measurement radial position rn+2, and sequentially generates a gate signal GSn+2b and a gate signal GSn+2c.
- the detection circuit 103 repeatedly executes the same processing in the respective measurement radial positions of the corresponding tracks TR in the radial direction of the specimen analysis disc 10 as in the measurement radial positions rn, rn+1, and rn+2. Accordingly, the gate signals GS shifted in the respective measurement radial positions in the rotating direction of the specimen analysis disc 10 are generated, as shown in Fig. 6A.
- Fig. 6B illustrates gate signals GS of a comparative example not shifted in the respective measurement radial positions in the rotating direction of the specimen analysis disc 10.
- the detection circuit 103 sequentially outputs the count values GCV of the corresponding gate signals GS shown in Fig. 6A to the count value generation processing unit 131 via the circuit control unit 150 per gate signal GS.
- the count value generation processing unit 131 outputs the measurement radial positional information HJ to the gate shift processing unit 132, and sequentially outputs the count values GCV of the corresponding gate signals GS to the gate shift processing unit 132 per gate signal GS.
- the signs GR shown in Fig. 7A to Fig. 7C denote the gate signal-corresponding regions of the corresponding gate signals GS.
- the gate signal-corresponding regions GR are regions in the specimen analysis disc 10 defined when the corresponding gate signals GS are measured.
- the divided regions DRa shown in Fig. 7A to Fig. 7C and Fig. 8 correspond to the divided region DRa shown in Fig. 6A .
- the divided region DRa is included in a gate signal-corresponding region GRa corresponding to the gate signal GSna, and a width of the divided region DRa in the rotating direction of the specimen analysis disc 10 is a third of the width of the gate signal-corresponding region GRa.
- the gate shift processing unit 132 sets count values DCV (second count values) in the respective divided regions DR in accordance with the measurement radial positional information HJ and the count values GCV corresponding to the respective gate signals GS.
- a first setting method of setting the count values DCV in the divided regions DR is described with reference to Fig. 7A .
- the gate shift processing unit 132 calculates an average value of a count value GCVna of the gate signal GSna corresponding to the gate signal-corresponding region GRa, a count value GCVn+1a of the gate signal GSn+1a corresponding to a gate signal-corresponding region GRb adjacent to one side of the divided region DRa in the radial direction of the specimen analysis disc 10, and a count value GCVn-1b of a gate signal GSn-1b corresponding to a gate signal-corresponding region GRc adjacent to the other side of the divided region DRa, or calculates a value obtained by multiplying the average by a third, so as to set the obtained value as a count value DCVa in the divided region DRa.
- the gate shift processing unit 132 sets the count values DCV in the other divided regions DR in the same manner as in the divided region DRa.
- a second setting method of setting the count values DCV in the divided regions DR is described with reference to Fig. 7B .
- the gate shift processing unit 132 compares distances between a central point CDa of the divided region DRa and the respective central points CG of the gate signal-corresponding regions GR around the divided region DRa.
- the gate shift processing unit 132 specifies the gate signal-corresponding region GRb having a central point CGb with the shortest distance from the central point CDa of the divided region DRa in accordance with the comparison result.
- the gate shift processing unit 132 sets, as the count value DCVa in the divided region DRa, the count value of the gate signal GSn+1a corresponding to the gate signal-corresponding region GRb or a value obtained by multiplying the count value by a third.
- the gate shift processing unit 132 sets the count values DCV in the other divided regions DR in the same manner as in the divided region DRa.
- a third setting method of setting the count values DCV in the divided regions DR is described with reference to Fig. 7C .
- a distance between the central point CDa of the divided region DRa and a central point CGa of the gate signal-corresponding region GRa is set as a first distance LGa.
- a distance between the central point CDa of the divided region DRa and a central point CGb of the gate signal-corresponding region GRb is set as a second distance LGb.
- a distance between the central point CDa of the divided region DRa and a central point CGc of the gate signal-corresponding region GRc is set as a third distance LGc.
- the gate shift processing unit 132 compares the first distance LGa, the second distance LGb, and the third distance LGc.
- the first distance LGa is W/3.
- the second distance LGb is LP.
- the third distance LGc is [LP 2 + (W/3) 2 ] 1/2 .
- the first, second, and third distances LGa, LGb, and LGc have a relationship of LGb ⁇ LGa ⁇ LGc.
- the gate shift processing unit 132 executes weighting processing of the count values of the gate signals GSna, GSn+1a, and GSn-1b corresponding to the gate signal-corresponding regions GRa, GRb, and GRc in accordance with the first, second, and third distances LGa, LGb, and LGc, so as to set the count value DCVa for the divided region DRa.
- the gate shift processing unit 132 multiplies the count value of the gate signal GSn+1a corresponding to the gate signal-corresponding region GRb having the second distance LGb by a second weighting coefficient ⁇ b.
- the gate shift processing unit 132 multiplies the count value of the gate signal GSn-1b corresponding to the gate signal-corresponding region GRc having the third distance LGc by a third weighting coefficient ⁇ c ( ⁇ b > ⁇ c).
- the gate shift processing unit 132 multiplies the count value of the gate signal GSna corresponding to the gate signal-corresponding region GRa having the first distance LGa by a first weighting coefficient ⁇ a ( ⁇ b > ⁇ a > ⁇ c).
- the gate shift processing unit 132 adds up the products of the count values multiplied by the respective weighting coefficients ⁇ a, ⁇ b, and ⁇ c, and sets the obtained value as the count value DCVa in the divided region DRa.
- the gate shift processing unit 132 sets the count values DCV in the other divided regions DR in the same manner as in the divided region DRa.
- the gate shift processing unit 132 generates positional information (for example, central position coordinate information) DRJ of the respective divided regions DR, and outputs the positional information DRJ of the respective divided regions DR and the count values DCV in the respective divided regions DR to the count value generation unit 131.
- the count value generation unit 131 outputs the positional information DRJ of the respective divided regions DR and the count values DCV in the respective divided regions DR to the count value distribution data processing unit 133.
- the count value distribution data processing unit 133 stores the count values DCV of the respective divided regions DR in a count value distribution data table CT in accordance with the positional information DRJ of the respective divided regions DR, as shown in Fig. 8 .
- the count value generation processing unit 131 determines whether the measurement of the reaction region 14 is completed according to the measurement radial positional information HJ. When the measurement is determined to be completed, the count value generation processing unit 131 generates a reaction region specifying signal RS and outputs the signal to the reaction region specifying processing unit 134.
- the reaction region specifying processing unit 134 generates a distribution data acquisition signal DS based on the reaction region specifying signal RS, and outputs the signal to the count value distribution data processing unit 133.
- the count value distribution data processing unit 133 outputs, to the reaction region specifying processing unit 134, the count values DCV in respective divided regions DR stored in the count value distribution data table CT as count value distribution data DD in accordance with the distribution data acquisition signal DS.
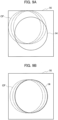
- the reaction region specifying processing unit 134 specifies the position of the reaction region 14 in accordance with the count value distribution data DD (the count values DCV in respective divided regions DR), and determines a count value RCV in the reaction region 14. For example, as shown in Fig. 9A and Fig. 9B , the reaction region specifying processing unit 134 scans the entire measurement region 16 with a filter CF having the same design in shape as the reaction region 14, and determines a position where the filter CF has the largest count value.
- the reaction region specifying processing unit 134 specifies the position of the reaction region 14 (for example, a central position coordinate) in accordance with the determination result to generate positional information RRJ of the reaction region 14, and determines the count value RCV in the reaction region 14 based on the count value distribution data DD.
- the count value RCV in the reaction region 14 corresponds to the number of nanoparticles 15 captured in the reaction region 14 and the number of detection target substances specifically bound to the nanoparticles 15.
- the filter CF When the reaction region 14 is formed into a circular shape, the filter CF has the same circular shape as the reaction region 14. Any other method that can specify the position of the reaction region 14 may be used instead.
- the reaction region specifying processing unit 134 outputs the positional information RRJ of the reaction region 14 and the count value RCV in the reaction region 14 to the count value generation processing unit 131.
- the count value generation processing unit 131 When the measurement is determined to be completed, the count value generation processing unit 131 generates a distribution data table acquisition signal TS1 and outputs the signal to the count value distribution data processing unit 133.
- the count value distribution data processing unit 133 outputs the count value distribution data table CT to the count value generation processing unit 131 when the distribution data table acquisition signal TS1 is input.
- the count value generation processing unit 131 When an acquisition request AR for the measurement result is made by the control GUI 101, the count value generation processing unit 131 outputs, to the control GUI 101, the positional information RRJ of the reaction region 14, the count value RCV in the reaction region 14, and the count value distribution data table CT.
- the control GUI 101 displays a count value distribution of the reaction region 14 obtained by associating the reaction region 14 with the count value distribution data table CT or displays the count value RCV of the reaction region 14.
- the user observes the count value distribution of the reaction region 14, and determines whether a defect region is present in the reaction region 14.
- the defect region is a region in which no nanoparticle is captured because bubbles in a solution adhere to the reaction region 14 during the process of forming the reaction region 14.
- the user specifies a range of the defect region.
- the control GUI 101 outputs defect region information DJ including the specified defect region to the defect correction processing unit 135.
- the defect correction processing unit 135 generates a distribution data table acquisition signal TS2 when the defect region information DJ is input, and outputs the signal to the count value distribution data processing unit 133.
- the count value distribution data processing unit 133 outputs the count value distribution data table CT to the defect correction processing unit 135 when the distribution data table acquisition signal TS2 is input.
- the defect correction processing unit 135 specifies the defect region in the count value distribution data table CT according to the defect region information DJ, and determines that the other region not specified as the defect region is a normal measurement region.
- the defect correction processing unit 135 corrects the count value of the defect region in the count value distribution data table CT based on the count value in the normal measurement region, and generates a corrected count value distribution data table CCT.
- the defect correction processing unit 135 outputs the corrected count value distribution data table CCT to the control GUI 101.
- the control GUI 101 displays the corrected count value distribution data table CCT.
- the defect correction processing unit 135 may output the corrected count value distribution data table CCT to the count value generation processing unit 131, and the count value generation processing unit 131 may then output the corrected count value distribution data table CCT to the control GUI 101.
- step S101 shown in Fig. 10A the control GUI 101 outputs the startup command signal MS to the control CPU 120 in accordance with the instruction by the user.
- the control CPU 120 starts up the detection circuit 103 and the optical disc drive 110 in step S102.
- step S103 the drive control unit 160 of the control CPU 120 controls the optical disc drive 110 to control the rotation of the specimen analysis disc 10.
- the drive control unit 160 of the control CPU 120 further controls the optical disc drive 110 to move the optical pickup 111 to the target measurement radial position in the specimen analysis disc 10 and direct the optical pickup 111 to emit the laser light 111a to the specimen analysis disc 10.
- step S104 the optical disc drive 110 detects the measurement radial position for the optical pickup 111 in the specimen analysis disc 10 to generate the measurement radial positional information HJ, and outputs the information to the count value generation processing unit 131 via the drive control unit 160 and the gate information processing unit 140.
- the reference position detection sensor 112 detects the reference position defining portion 11 in the specimen analysis disc 10 and generates the reference position detection signal KS.
- the optical pickup 111 receives the reflected light from the specimen analysis disc 10 and generates the light reception detection signal JS.
- step S107 the gate information processing unit 140 sets the gate width W of each gate signal GS in each measurement radial position so as to divide the measurement region 16 into the number m in the rotating direction of the specimen analysis disc 10.
- the optical disc drive 110 and the gate information processing unit 140 may execute the steps S104 to S106 and step 5107 simultaneously.
- step S108 the gate information processing unit 140 sets, as the reference shift amount ⁇ a, the period of time from the point at which the reference position defining portion 11 is detected to the point at which the measurement region 16 reaches the measurement radial position, in accordance with the measurement radial positional information HJ.
- the gate information processing unit 140 sets the gate shift amount ⁇ a and the phase difference ⁇ a + ⁇ a for each measurement radial position (track).
- step S109 the gate information processing unit 140 generates the gate information GJ1 based on the measurement radial positional information HJ, and outputs the information to the detection circuit 103 via the circuit control unit 150.
- step S110 the detection circuit 103 generates the gate signals GS shifted in the respective measurement radial positions in the rotating direction of the specimen analysis disc 10 on the basis of the reference position detection signal KS and the gate information GJ1.
- step S111 the detection circuit 103 extracts the nanoparticle pulse signals BS from the light reception detection signal JS per gate signal GS.
- step S112 the detection circuit 103 counts the extracted nanoparticle pulse signals BS and generates the count value GCV of the corresponding gate signal GS.
- the detection circuit 103 then sequentially outputs the count values GCV per gate signal GS to the count value generation processing unit 131 via the circuit control unit 150.
- step S113 the gate shift processing unit 132 divides the reaction region 14 by the unit gate shift amount ⁇ ua in each measurement radial position in the rotating direction of the specimen analysis disc 10 so as to define a plurality of divided regions DR.
- step S114 the gate shift processing unit 132 sets the count values DCV of the divided regions DR in accordance with the count value in the gate signal-corresponding region GR including the divided regions DR and the count values in the gate signals GS corresponding to the peripheral gate signal-corresponding regions around the divided regions DR.
- the gate shift processing unit 132 further outputs the positional information DRJ of the respective divided regions DR and the count values DCV in the divided regions DR to the count value distribution data processing unit 133 via the count value generation processing unit 131.
- step S115 shown in Fig. 10B the count value distribution data processing unit 133 stores the count values DCV of the respective divided regions DR in the count value distribution data tale CT in accordance with the positional information DRJ of the respective divided regions DR and the count values DCV in the respective divided regions DR.
- step S116 the count value generation processing unit 131 determines whether the measurement of the reaction region 14 is completed according to the measurement radial positional information HJ.
- the control CPU 120 causes the process to return to step S104.
- the control CPU 120 stops the detection circuit 103 and the optical disc drive 110 in step S117.
- the count value generation processing unit 131 When the measurement is determined to be completed in step S116, the count value generation processing unit 131 generates the reaction region specifying signal RS and outputs the signal to the reaction region specifying processing unit 134 in step S118.
- the reaction region specifying processing unit 134 When the reaction region specifying signal RS is input, the reaction region specifying processing unit 134 generates the distribution data acquisition signal DS and outputs the signal to the count value distribution data processing unit 133 in step S119.
- the count value distribution data processing unit 133 When the distribution data acquisition signal DS is input, the count value distribution data processing unit 133 outputs, to the reaction region specifying processing unit 134, the count values DCV in the respective divided regions DR stored in the count value distribution data table CT as count value distribution data DD in step S120.
- the reaction region specifying processing unit 134 scans the entire measurement region 16 with the filter CF having the same shape as the reaction region 14, and determines a position where that filter FC has the largest count value.
- the reaction region specifying processing unit 134 specifies the position of the reaction region 14 (for example, the central position coordinate) in accordance with the determination result to generate the positional information RRJ of the reaction region 14, and determines the count value RCV in the reaction region 14.
- the reaction region specifying processing unit 134 outputs the positional information RRJ of the reaction region 14 and the count value RCV in the reaction region 14 to the count value generation processing unit 131.
- the count value generation processing unit 131 When the measurement is determined to be completed in step S116, the count value generation processing unit 131 generates the distribution data table acquisition signal TS1 and outputs the signal to the count value distribution data processing unit 133 in step S122. When the distribution data table acquisition signal TS1 is input, the count value distribution data processing unit 133 outputs the count value distribution data table CT to the count value generation processing unit 131 in step S123.
- the count value generation processing unit 131 When the acquisition request AR for the measurement result is made by the control GUI 101, the count value generation processing unit 131 outputs, to the control GUI 101, the positional information RRJ of the reaction region 14, the count value RCV in the reaction region 14, and the count value distribution data table CT in step S124. In step S125, the control GUI 101 displays the count value distribution of the reaction region 14 obtained by associating the reaction region 14 with the count value distribution data table CT or displays the count value RCV of the reaction region 14.
- the control GUI 101 When the user specifies a range of a defect region, the control GUI 101 outputs the defect region information DJ including the specified defect region to the defect correction processing unit 135 in step S126 shown in Fig. 10C .
- the defect correction processing unit 135 generates the distribution data table acquisition signal TS2 when the defect region information DJ is input, and outputs the signal to the count value distribution data processing unit 133 in step S127.
- the count value distribution data processing unit 133 outputs the count value distribution data table CT to the defect correction processing unit 135 in step S128.
- step S129 the defect correction processing unit 135 specifies the defect region in the count value distribution data table CT according to the defect region information DJ.
- the defect correction processing unit 135 then corrects the count value of the defect region in the count value distribution data table CT in accordance with the count value in the normal measurement region, and generates the corrected count value distribution data table CCT.
- the defect correction processing unit 135 outputs the corrected count value distribution data table CCT to the control GUI 101.
- the control GUI 101 displays the corrected count value distribution data table CCT.
- the analysis device 100 and the analysis method according to the first embodiment set the gate shift amount ⁇ a for each measurement radial position (track), and shift the gate signals GS by the gate shift amount ⁇ a in the respective measurement radial positions in the rotating direction of the specimen analysis disc 10.
- the analysis device 100 and the analysis method according to the first embodiment divide the reaction region 14 by the unit gate shift amount ⁇ ua in the respective measurement radial positions in the rotating direction of the specimen analysis disc 10 so as to define a plurality of divided regions DR.
- Fig. 11A is a view showing a part of a count value distribution of the reaction region 14 in the case in which the gate signals GS are shifted in the respective measurement radial positions in the rotating direction of the specimen analysis disc 10 as shown in Fig. 6A .
- Fig. 11B is a view illustrating a comparative example, showing a part of a count value distribution of the reaction region 14 in the case in which the gate signals GS are not shifted in the respective measurement radial positions in the rotating direction of the specimen analysis disc 10 as shown in Fig. 6B .
- the analysis device 100 and the analysis method according to the first embodiment set the count values in the divided regions DR based on the count values of the gate signals GS. Accordingly, an increase in circuit scale is avoided, and the measurement resolution in the rotating direction of the specimen analysis disc 10 can be improved, as shown in Fig. 11A .
- the analysis device 200 includes the control GUI 101, a control CPU 220, the detection circuit 103, and the optical disc drive 110.
- the control GUI 101 receives an instruction by a user to output a startup command signal MS to the control CPU 220.
- the control CPU 220 starts up the detection circuit 103 and the optical disc drive 110 when the startup command signal MS is input.
- the control CPU 220 includes a count information processing unit 230, a gate information processing unit 240, a circuit control unit 250, and a drive control unit 260.
- the count information processing unit 230, the gate information processing unit 240, the circuit control unit 250, and the drive control unit 260 may each be composed of software executed by the control CPU 220 or composed of hardware such as a circuit.
- the count information processing unit 230 includes a count value generation processing unit 231, a gate shift processing unit 232, a count value distribution data processing unit 233, a reaction region specifying processing unit 234, and a defect correction processing unit 235.
- the count value generation processing unit 231, the gate shift processing unit 232, the count value distribution data processing unit 233, the reaction region specifying processing unit 234, and the defect correction processing unit 235 may each be composed of software executed by the control CPU 220 or composed of hardware such as a circuit.
- the drive control unit 260 executes the same control processing as the drive control unit 160.
- the optical disc drive 110 detects a measurement radial position for the optical pickup 111 in the specimen analysis disc 10 to generate measurement radial positional information HJ, and outputs the information to the count value generation processing unit 231 via the drive control unit 260 and the gate information processing unit 240.
- the gate information processing unit 240 generates, based on the measurement radial positional information HJ, gate information GJ2 including a reference shift amount ⁇ b, a distribution gate shift amount ⁇ b, a shift adjustment amount ⁇ c, a phase difference ⁇ b + ⁇ b, and two kinds of gate widths W which are a distribution gate width DW and a measurement gate width MW, and outputs the gate information GJ2 to the circuit control unit 250.
- the reference shift amount ⁇ b, the distribution gate shift amount ⁇ b, the shift adjustment amount ⁇ c, the phase difference ⁇ b + ⁇ b, the distribution gate width DW, and the measurement gate width MW will be described below.
- the circuit control unit 250 outputs the gate information GJ2 to the detection circuit 103 .
- the detection circuit 103 generates two kinds of gate signals GS which are a distribution gate signal DGS and a measurement gate signal MGS according to the gate information GJ2.
- the detection circuit 103 synchronizes the timing of the distribution gate signal DGS and the measurement gate signal MGS with the timing of the light reception detection signal JS on the basis of the reference position detection signal KS output from the reference position detection sensor 112. A method of generating distribution gate signals DGS and measurement gate signals MGS will be described below.
- the detection circuit 103 extracts nanoparticle pulse signals BS from the light reception detection signal JS per each distribution gate signal DGS and measurement gate signal MGS.
- the detection circuit 103 counts the extracted nanoparticle pulse signals BS, generates a count value DGCV of the corresponding distribution gate signal DGS and a count value MGCV of the corresponding measurement gate signal MGS, and sequentially outputs the respective values per distribution gate signal DGS and measurement gate signal MGS to the circuit control unit 250.
- the circuit control unit 250 sequentially outputs, to the count value generation processing unit 231, the respective count values DGCV and MGCV per distribution gate signal DGS and measurement gate signal MGS.
- the gate information processing unit 240 sets the distribution gate width DW of each distribution gate signal DGS in each measurement radial position (track) of the specimen analysis disc 10.
- the distribution gate width DW is determined according to the rotation number of the specimen analysis disc 10 in the respective measurement radial positions. When the specimen analysis disc 10 is rotated at a constant linear velocity, the distribution gate widths DW in the respective measurement radial positions are set to be the same.
- the gate information processing unit 240 sets, as the reference shift amount ⁇ b, a period of time from a point at which the reference position defining portion 11 is detected to a point at which the first distribution signal DGSn rises in a measurement radial position rn corresponding to a track TRn (n is the track number), based on the reference position detection signal KS. For example, the gate information processing unit 240 sets, as the reference shift amount ⁇ b, the period of time from the fall of the reference position detection signal KS to the rise of the first distribution gate signal DGSna, as shown in Fig. 13 .
- the gate information processing unit 240 sets the distribution gate shift amount ⁇ b and the phase difference ⁇ b + ⁇ b for each measurement radial position (track).
- the distribution gate shift amount ⁇ b is set in a manner similar to the gate shift amount ⁇ a.
- the gate information processing unit 240 sets the distribution gate shift amount ⁇ b so as to divide the distribution gate width DW into four.
- the detection circuit 103 generates the distribution gate signals DGS based on the reference position detection signal KS and the gate information GJ2.
- the detection circuit 103 generates a distribution gate signal DGSna which raises after the fall of the reference position detection signal KS with a delay of the reference shift amount ⁇ b in the measurement radial position rn, for example, and sequentially generates gate signals DGSnb, DGSnc, and DGSnd.
- the detection circuit 103 further generates a distribution gate signal DGSne which raises after the fall of the reference position detection signal KS with a delay of the reference shift amount ⁇ b + the shift adjustment amount ⁇ c in the measurement radial position rn, for example, and sequentially generates gate signals DGSnf, DGSng, and DGSnh.
- the distribution gate signals DGS are used for specifying the position of the reaction region 14.
- the reference shift amount ⁇ b and the shift adjustment amount ⁇ c are set for each measurement radial position so that the distribution gate signals DGS correspond to the outer circumference of the designed position of the reaction region 14.
- the distribution gate signals DGSna to DGSnd are set to correspond to one side of the outer circumference of the reaction region 14 (the outer circumference on the left side in Fig. 14 ) in the measurement radial position rn.
- the distribution gate signals DGSne to DGSnh are set to correspond to the other side of the outer circumference of the reaction region 14 (the outer circumference on the right side in Fig. 14 ) in the measurement radial position rn.
- the distribution gate signals DGS are used for specifying the position of the reaction region 14.
- the detection circuit 103 generates the distribution gate signals DGS shifted by the distribution gate shift amount ⁇ b in the respective measurement radial positions in the rotating direction of the specimen analysis disc 10.
- the distribution gate signals DGS are generated by the same generating method as the gate signals GS.
- the detection circuit 103 sequentially outputs the distribution count values DGCV of the corresponding distribution gate signals DGS to the count value generation processing unit 231 via the circuit control unit 250 per distribution gate signal DGS.
- the detection circuit 103 sequentially outputs the count values MGCV of the corresponding measurement gate signals MGS to the count value generation processing unit 231 via the circuit control unit 250 per measurement gate signal MGS.
- the count value generation processing unit 231 outputs the measurement radial positional information HJ to the gate shift processing unit 232, and sequentially outputs the count values DGCV of the corresponding distribution gate signals DGS to the gate shift processing unit 232 per distribution gate signal DGS.
- the count value generation processing unit 231 stores the count values MGCV per measurement radial position.
- the gate shift processing unit 232 sets a count value DCV in each divided region DR.
- the divided regions DR and the count values DCV are set by the same setting method as the divided regions DR and the count values DCV in the first embodiment.
- the gate shift processing unit 232 outputs positional information (for example, central position coordinate information) DRJ of the respective divided regions DR and the count values DCV in the respective divided regions DR to the count value generation unit 231.
- the count value generation unit 231 outputs the positional information DRJ of the respective divided regions DR and the count values DCV in the respective divided regions DR to the count value distribution data processing unit 233.
- the count value distribution data processing unit 233 stores the count values DCV of the respective divided regions DR in the count value distribution data table CT in accordance with the positional information DRJ of the respective divided regions DR and the count values DCV in the respective divided regions DR.
- the count value generation processing unit 231 determines whether the measurement of each measurement radial position is completed according to the measurement radial positional information HJ. When the measurement is determined to be completed, the count value generation processing unit 231 generates a reaction region specifying signal RS for each measurement radial position, and sequentially outputs the signal to the reaction region specifying processing unit 234.
- the reaction region specifying processing unit 234 generates a distribution data acquisition signal DS based on the reaction region specifying signal RS and outputs the signal to the count value distribution data processing unit 233.
- the count value distribution data processing unit 233 outputs, to the reaction region specifying processing unit 234, the count values DCV in the respective divided regions DR in the corresponding measurement radial position stored in the count value distribution data table CT as count value distribution data DD in accordance with the distribution data acquisition signal DS.
- the reaction region specifying processing unit 234 scans the entire measurement region 16 with a filter having a shape greater in length than the diameter of the reaction region 14 in design and greater in width than the divided regions DR in the radial direction of the specimen analysis disc 10, and determines a position where the filter has the largest count value.
- the reaction region specifying processing unit 234 specifies the position of the reaction region 14 (for example, a central position coordinate) in each measurement radial position in accordance with the determination result, and generates the positional information RRJ of the reaction region 14 for each measurement radial position. Any other method that can specify the position of the reaction region 14 may be used instead.
- the reaction region specifying processing unit 234 outputs the positional information RRJ of the reaction region 14 to the detection circuit 103 via the count value generation processing unit 231 and the circuit control unit 250 per measurement radial position.
- the detection circuit 103 generates the measurement gate signal MGS based on the reference position detection signal KS, the gate information GJ2, and the positional information RRJ.
- positional information RRJn generated in accordance with the distribution gate signal DGSn in the measurement radial position rn is input to the detection circuit 103, the detection circuit 103 generates a measurement gate signal MGSn+1 in the measurement radial position rn+1 subsequently measured, in accordance with the reference position detection signal KS, the gate information GJ2, and the positional information RRJ.
- the detection circuit 103 when the detection circuit 103 generates each distribution gate signal DGSn+1 and measurement gate signal MGSn+1 in the subsequent measurement radial position rn+1, the detection circuit 103 generates the measurement gate signal MGSn+1 having a measurement gate width MW corresponding to the reaction region 14 in the measurement radial position rn+1 in accordance with the positional information RRJn of the reaction region 14 in the previous measurement radial position rn.
- the measurement gate signal MGS is used for counting the number of nanoparticles 15 in the reaction region 14 and the number of detection target substances.
- the count value generation processing unit 231 determines whether the measurement of the reaction region 14 is completed according to the measurement radial positional information HJ. When the measurement is determined to be completed, the count value generation processing unit 231 sums up the count values MGCV in all of the measurement radial positions so as to determine the count value RCV in the reaction region 14.
- the count value RCV in the reaction region 14 corresponds to the number of nanoparticles 15 captured in the reaction region 14 and the number of detection target substances specifically bound to the nanoparticles 15.
- the count value generation processing unit 231 When the measurement is determined to be completed, the count value generation processing unit 231 generates a distribution data table acquisition signal TS1 and outputs the signal to the count value distribution data processing unit 233.
- the count value distribution data processing unit 233 outputs the count value distribution data table CT to the count value generation processing unit 231 when the distribution data table acquisition signal TS1 is input.
- the count value generation processing unit 231 When the measurement is determined to be completed, the count value generation processing unit 231 generates a reaction region specifying signal RS and outputs the signal to the reaction region specifying processing unit 234.
- the reaction region specifying processing unit 234 When the reaction region specifying signal RS is input, the reaction region specifying processing unit 234 generates a distribution data acquisition signal DS and outputs the signal to the count value distribution data processing unit 233.
- the count value distribution data processing unit 233 outputs, to the reaction region specifying processing unit 234, the count values DCV in the respective divided regions DR stored in the count value distribution data table CT as count value distribution data DD.
- the reaction region specifying processing unit 234 specifies the position of the reaction region 14 (for example, the central position coordinate) in accordance with the detection result in each measurement radial position to generate the positional information RRJ of the reaction region 14, and outputs the information to the count value generation processing unit 231.
- the count value generation processing unit 231 When an acquisition request AR for the measurement result is made by the control GUI 101, the count value generation processing unit 231 outputs, to the control GUI 101, the positional information RRJ of the reaction region 14, the count value RCV in the reaction region 14, and the count value distribution data table CT.
- the control GUI 101 displays a count value distribution of the reaction region 14 obtained by associating the reaction region 14 with the count value distribution data table CT or displays the count value RCV of the reaction region 14.
- step S201 shown in Fig. 15A the control GUI 101 outputs the startup command signal MS to the control CPU 220 in accordance with the instruction by the user.
- the control CPU 220 starts up the detection circuit 103 and the optical disc drive 110 in step 5202.
- step S203 the drive control unit 260 of the control CPU 220 controls the optical disc drive 110 to control the rotation of the specimen analysis disc 10.
- the drive control unit 260 of the control CPU 220 further controls the optical disc drive 110 to move the optical pickup 111 to the target measurement radial position in the specimen analysis disc 10 and direct the optical pickup 111 to emit the laser light 111a to the specimen analysis disc 10.
- step S204 the optical disc drive 110 generates the measurement radial positional information HJ including the measurement radial position for the optical pickup 111 in the specimen analysis disc 10, and outputs the information to the count value generation processing unit 231 via the drive control unit 260 and the gate information processing unit 240.
- the reference position detection sensor 112 detects the reference position defining portion 11 in the specimen analysis disc 10 and generates the reference position detection signal KS.
- the optical pickup 111 receives the reflected light from the specimen analysis disc 10 and generates the light reception detection signal JS.
- step S207 the gate information processing unit 240 sets the distribution gate width DW and the measurement gate width MW for each measurement radial position.
- the optical disc drive 110 and the gate information processing unit 240 may execute the steps S204 to S206 and step S207 simultaneously.
- step S208 the gate information processing unit 240 sets, as the reference shift amount ⁇ b for each measurement radial position (track), the period of time from the point at which the reference position defining portion 11 is detected to the point at which the measurement region 16 reaches the measurement radial position, in accordance with the measurement radial positional information HJ.
- the gate information processing unit 240 sets the distribution gate shift amount ⁇ b, the shift adjustment amount ⁇ c, and the phase difference ⁇ b + ⁇ b for each measurement radial position.
- step S209 the gate information processing unit 240 generates the gate information GJ2 based on the measurement radial positional information HJ, and outputs the gate information GJ2 to the detection circuit 103 via the circuit control unit 250.
- step S210 the detection circuit 103 generates the distribution gate signals DGS shifted in the respective measurement radial positions in the rotating direction of the specimen analysis disc 10 on the basis of the reference position detection signal KS and the gate information GJ2.
- step S211 the detection circuit 103 extracts the nanoparticle pulse signals BS from the light reception detection signal JS per distribution gate signal DGS.
- step S212 the detection circuit 103 counts the extracted nanoparticle pulse signals BS and generates the count value DGCV of the corresponding distribution gate signal DGS.
- step S213 the detection circuit 103 sequentially outputs the count values DGCV per distribution gate signal DGS to the gate shift processing unit 232 via the circuit control unit 250 and the count value generation processing unit 231.
- step S215 the gate shift processing unit 232 sets the count values DGCV in the respective divided regions DR.
- step S216 the count value distribution data processing unit 233 successively stores the count values DGCV of the divided regions DR in an internal memory per divided region DR.
- step S217 the count value generation processing unit 231 determines whether the measurement of each measurement radial position is completed according to the measurement radial positional information HJ. When the measurement in the respective measurement radial positions is determined not to be completed yet (NO in step S217), the control CPU 220 causes the process to return to step S216.
- the count value generation processing unit 231 stores, in the count value distribution data table CT, the count values DGCV in the respective divided regions DR stored in the internal memory in accordance with the positional information DRJ of the corresponding divided regions DR in step S218.
- the count value generation processing unit 231 generates the reaction region specifying signal RS for each measurement radial position and sequentially outputs the signal to the reaction region specifying processing unit 234.
- step S220 the reaction region specifying processing unit 234 generates the distribution data acquisition signal DS based on the reaction region specifying signal RS, and outputs the generated signal to the count value distribution data processing unit 233.
- step S221 the count value distribution data processing unit 233 outputs, to the reaction region specifying processing unit 234, the count values DCV of the respective divided regions DR in the corresponding measurement radial position stored in the count value distribution data table CT as count value distribution data DD.
- the reaction region specifying processing unit 234 scans the entire measurement region 16 with the filter, and determines a position where the filter has the largest count value in step S222.
- the reaction region specifying processing unit 234 specifies the position of the reaction region 14 (for example, the central position coordinate) in each measurement radial position in accordance with the determination result, and generates the positional information RRJ of the reaction region 14 for each measurement radial position.
- the reaction region specifying processing unit 234 outputs the positional information RRJ of the reaction region 14 to the detection circuit 103 via the count value generation processing unit 231 and the circuit control unit 250 per measurement radial position.
- the detection circuit 103 In step S223, the detection circuit 103 generates the measurement gate signal MGS based on the reference position detection signal KS, the gate information GJ2, and the positional information RRJ.
- the detection circuit 103 When the detection circuit 103 generates each distribution gate signal DGSn+1 and measurement gate signal MGSn+1 in the measurement radial position rn+1, the detection circuit 103 generates the measurement gate signal MGSn+1 based on the positional information RRJn in the previous measurement radial position rn.
- step S224 the detection circuit 103 extracts the nanoparticle pulse signals BS from the light reception detection signal JS per measurement gate signal MGS.
- step S225 the detection circuit 103 counts the extracted nanoparticle pulse signals BS and generates the count value MGCV of the corresponding measurement gate signal MGS.
- the detection circuit 103 sequentially outputs the count values MGCV per measurement gate signal MGS to the count value generation processing unit 231 via the circuit control unit 250. Steps S211 and S212 and steps S224 and S225 are executed simultaneously by the detection circuit 103.
- step S226 the count value generation processing unit 231 stores the count value MGCV per measurement radial position.
- step S227 the count value generation processing unit 231 determines whether the measurement of the reaction region 14 is completed according to the measurement radial positional information HJ.
- the control CPU 220 causes the process to return to step S204.
- the control CPU 220 stops the detection circuit 103 and the optical disc drive 110 in step 5228.
- the count value generation processing unit 231 sums up the count values MGCV in all of the measurement radial positions so as to determine the count value RCV in the reaction region 14 in step S229.
- the count value RCV in the reaction region 14 corresponds to the number of nanoparticles 15 captured in the reaction region 14 and the number of detection target substances specifically bound to the nanoparticles 15.
- step S230 the count value generation processing unit 231 generates the distribution data table acquisition signal TS1 and outputs the signal to the count value distribution data processing unit 233.
- the count value distribution data processing unit 233 outputs the count value distribution data table CT to the count value generation processing unit 231 in step 5231.
- the count value generation processing unit 231 When the measurement is determined to be completed in step S227, the count value generation processing unit 231 generates the reaction region specifying signal RS and outputs the signal to the reaction region specifying processing unit 234 in step S232.
- the reaction region specifying processing unit 234 When the reaction region specifying signal RS is input, the reaction region specifying processing unit 234 generates the distribution data acquisition signal DS and outputs the signal to the count value distribution data processing unit 233 in step S233.
- the count value distribution data processing unit 233 When the distribution data acquisition signal DS is input, the count value distribution data processing unit 233 outputs, to the reaction region specifying processing unit 234, the count values DCV in the respective divided regions DR stored in the count value distribution data table CT as count value distribution data DD in step S234.
- step S235 the reaction region specifying processing unit 234 specifies the position of the reaction region 14 (for example, the central position coordinate) based on the count value distribution data DD to generate the positional information RRJ of the reaction region 14, and outputs the information to the count value generation processing unit 231.
- the count value generation processing unit 231 When the acquisition request AR for the measurement result is made by the control GUI 101, the count value generation processing unit 231 outputs, to the control GUI 101, the positional information RRJ of the reaction region 14, the count value RCV in the reaction region 14, and the count value distribution data table CT in step 5236. In step S237, the control GUI 101 displays the count value distribution of the reaction region 14 obtained by associating the reaction region 14 with the count value distribution data table CT or displays the count value RCV of the reaction region 14.
- the analysis device 200 and the analysis method according to the example not forming part of the present invention generate two kinds of gate signals GS which are the distribution gate signal DGS and the measurement gate signal MGS.
- the distribution gate signal DGS is used for specifying the position of the reaction region 14.
- the measurement gate signal MGS is used for counting the number of nanoparticles 15 in the reaction region 14 and the number of detection target substances.
- the analysis device 200 and the analysis method set the distribution gate shift amount ⁇ b for each measurement radial position (track).
- the analysis device 200 and the analysis method shift the distribution gate signals DGS by the distribution gate shift amount ⁇ b in the respective measurement radial positions in the rotating direction of the specimen analysis disc 10.
- the analysis device 200 and the analysis method divide the reaction region 14 by the unit distribution gate shift amount ⁇ ub in the respective measurement radial positions in the rotating direction of the specimen analysis disc 10 so as to define a plurality of divided regions DR.
- the analysis device 200 and the analysis method generate the distribution gate signals DGS corresponding to the outer circumference of the designed position of the reaction region 14, and set the count values of the divided regions DR based on the count values of the distribution gate signals DGS. Accordingly, an increase in circuit scale is avoided, and the measurement resolution in the rotating direction of the specimen analysis disc 10 can be improved.
- the analysis device 200 and the analysis method generate the measurement gate signal MGSn+1 having a measurement gate width MW corresponding to the reaction region 14 in the measurement radial position rn+1 in accordance with the positional information RRJn of the reaction region 14 in the previous measurement radial position rn.
- the analysis device 200 and the analysis method according to the example not forming part of the present invention thus can count the number of nanoparticles 15 in the reaction region 14 and the number of detection target substances accurately due to the measurement gate signal MGSn+1 with the measurement gate width MW corresponding to the reaction region 14.
- the unit gate shift amount ⁇ ua and the unit distribution gate shift amount ⁇ ub are set so as to divide the gate width W and the distribution gate width DW each into the number m, the measurement resolution in the rotating direction of the specimen analysis disc is further increased as the number m increases, and an increase in circuit scale is further prevented as the number m decreases.
- the number m for division is therefore not limited to that described in the analysis device 100 or 200 or the analysis method according the first embodiment or according the example not forming part of the present invention, but is determined as appropriate depending on the specifications of design.
- the embodiment can provide the analysis device and the analysis method with an increase in circuit scale avoided and the measurement resolution in the rotating direction of the specimen analysis disc improved.
Landscapes
- Chemical & Material Sciences (AREA)
- Health & Medical Sciences (AREA)
- Life Sciences & Earth Sciences (AREA)
- Immunology (AREA)
- General Health & Medical Sciences (AREA)
- Physics & Mathematics (AREA)
- Analytical Chemistry (AREA)
- General Physics & Mathematics (AREA)
- Biochemistry (AREA)
- Pathology (AREA)
- Engineering & Computer Science (AREA)
- Molecular Biology (AREA)
- Hematology (AREA)
- Dispersion Chemistry (AREA)
- Biomedical Technology (AREA)
- Urology & Nephrology (AREA)
- Nanotechnology (AREA)
- Cell Biology (AREA)
- Microbiology (AREA)
- Food Science & Technology (AREA)
- Medicinal Chemistry (AREA)
- Biotechnology (AREA)
- Spectroscopy & Molecular Physics (AREA)
- Clinical Laboratory Science (AREA)
- Chemical Kinetics & Catalysis (AREA)
- Crystallography & Structural Chemistry (AREA)
- Automatic Analysis And Handling Materials Therefor (AREA)
- Optical Measuring Cells (AREA)
- Investigating Or Analysing Materials By Optical Means (AREA)
Claims (4)
- Analysevorrichtung (100), aufweisend:ein optisches Plattenlaufwerk (110), beinhaltend:einen optischen Aufnehmer (111), der konfiguriert ist zumBestrahlen, mit Laserlicht (111a), eines Reaktionsbereichs (14), der in einer kreisförmigen Probenanalysescheibe (10) mit eingefangenen Nanopartikeln (15) gebildet ist, undEmpfangen von reflektiertem Licht von der Probenanalysescheibe (10), Erzeugen eines Lichtempfangsdetektionssignals (JS) basierend auf dem empfangenen reflektierten Licht und Ausgeben des Lichtempfangsdetektionssignals (JS) an eine Detektionsschaltung (103); undeinen Referenzpositionsdetektionssensor (112), der konfiguriert ist zum Detektieren eines Referenzpositionsdefinitionsabschnitts (11), der in der Probenanalysescheibe (10) gebildet ist, Erzeugen eines Referenzpositionsdetektionssignals (KS) basierend auf dem detektierten Referenzpositionsdefinitionsabschnitt (11) und Ausgeben des Referenzpositionsdetektionssignals (KS) an die Detektionsschaltung (103),wobei das optische Plattenlaufwerk (110) konfiguriert ist zum Drehen der Probenanalysescheibe (10), Bewegen des optischen Aufnehmers (111) in einer radialen Richtung der Probenanalysescheibe (10), Detektieren einer radialen Messposition für den optischen Aufnehmer (111) in der Probenanalysescheibe (10), Erzeugen von radialen Messpositionsinformationen (HJ) basierend auf der detektierten radialen Messposition und Ausgeben der radialen Messpositionsinformationen (HJ) an eine Gate-Informationsverarbeitungseinheit (140) über eine Antriebssteuereinheit (160);wobei die Gate-Informationsverarbeitungseinheit (140) konfiguriert ist zum Erzeugen von Gate-Informationen (GJ1), beinhaltend eine Gate-Breite (W) und eine Phasendifferenz (φa+Δφa), basierend auf den radialen Messpositionsinformationen (HJ), Ausgeben der Gate-Informationen (GJ1) an die Detektionsschaltung (103) über eine Schaltungssteuereinheit (150) und Ausgeben der radialen Messpositionsinformationen (HJ) an eine Zählwerterzeugungsverarbeitungseinheit (131),
wobei die Phasendifferenz (φa+Δφa) eine Summe eines Referenzverschiebungsbetrags (φa) und eines Gate-Verschiebungsbetrags (Δφa) ist;wobei die Detektionsschaltung (103) konfiguriert ist zumErzeugen eines Gate-Signals (GS), das in Bezug auf das Referenzpositionsdetektionssignal (KS) um die Phasendifferenz (φa+Δφa) in jeder radialen Messposition in einer Drehrichtung der Probenanalysescheibe (10) gemäß dem Referenzpositionsdetektionssignal (KS) und den Gate-Informationen (GJ1) verschoben ist,Synchronisieren eines Timings zwischen dem Gate-Signal (GS) und dem Lichtempfangsdetektionssignal (JS) basierend auf dem Referenzpositionsdetektionssignal (KS),Extrahieren von Nanopartikelimpulssignalen (BS), die jedes Mal erzeugt werden, wenn die Nanopartikel (15) mit dem Laserlicht (111a) abgetastet werden, aus dem Lichtempfangsdetektionssignal (JS) pro Gate-Signal (GS), undZählen der Nanopartikelimpulssignale (BS), Erzeugen eines Zählwerts (GCV) des entsprechenden Gate-Signals (GS) basierend auf den gezählten Nanopartikelimpulssignalen (BS) und sequentielles Ausgeben von Zählwerten (GCV) von entsprechenden Gate-Signalen (GS) pro Gate-Signal (GS) an die Zählwerterzeugungsverarbeitungseinheit (131) über die Schaltungssteuereinheit (150);wobei die Zählwerterzeugungsverarbeitungseinheit (131) konfiguriert ist zum Ausgeben der radialen Messpositionsinformationen (HJ) an eine Gate-Verschiebungsverarbeitungseinheit (132) und sequentielles Ausgeben der Zählwerte (GCV) der entsprechenden Gate-Signale (GS) pro Gate-Signal (GS) an die Gate-Verschiebungsverarbeitungseinheit (132);wobei die Gate-Verschiebungsverarbeitungseinheit (132) konfiguriert ist zumTeilen eines Gate-Signal-entsprechenden Bereichs (GR) des entsprechenden Gate-Signals (GS) durch einen Einheits-Gate-Verschiebungsbetrag (Δφua) in der Drehrichtung der Probenanalysescheibe (10), um eine Vielzahl von geteilten Bereichen (DR) zu definieren,wobei der Gate-Signal-entsprechende Bereich (GR) ein Bereich in der Probenanalysescheibe (10) ist, der definiert wird, wenn das entsprechende Gate-Signal (GS) gemessen wird, undder Gate-Verschiebungsbetrag (Δφa) gleich einem positiven ganzzahligen Vielfachen des Einheits-Gate-Verschiebungsbetrags (Δφua) ist, und die Gate-Verschiebungsverarbeitungseinheit (132) konfiguriert ist zumEinstellen von Zählwerten (DCV) der geteilten Bereiche (DR) basierend auf den radialen Messpositionsinformationen (HJ) und den Zählwerten (GCV) der entsprechenden Gate-Signale (GS), Erzeugen von Positionsinformationen (DRJ) der geteilten Bereiche (DR) und Ausgeben der Positionsinformationen (DRJ) der geteilten Bereiche (DR) und der Zählwerte (DCV) der geteilten Bereiche (DR) an die Zählwerterzeugungsverarbeitungseinheit (131);eine Zählwertverteilungsdatenverarbeitungseinheit (133), die konfiguriert ist zum Speichern der Zählwerte (DCV) der geteilten Bereiche (DR) in einer Zählwertverteilungsdatentabelle (CT) gemäß den Positionsinformationen (DRJ) der geteilten Bereiche (DR),
wobei die Positionsinformationen (DRJ) der geteilten Bereiche (DR) und die Zählwerte (DCV) der geteilten Bereiche (DR) von der Zählwerterzeugungsverarbeitungseinheit (131) ausgegeben werden; undeine Reaktionsbereichsspezifizierungsverarbeitungseinheit (134), die konfiguriert ist zum Spezifizieren einer Position des Reaktionsbereichs (14) durch Abtasten eines gesamten Messbereichs (16) mit einem Filter (CF) mit einer vorbestimmten Form, die eine Designform des Reaktionsbereichs (14) ist, und Bestimmen einer Position, an der das Filter (CF) einen größten Zählwert aufweist, Erzeugen von Positionsinformationen (RRJ) des Reaktionsbereichs (14) basierend auf der spezifizierten Position des Reaktionsbereichs (14), und Bestimmen eines Zählwerts (RCV) im Reaktionsbereich (14) basierend auf den Zählwerten (DCV) der geteilten Bereiche (DR), die in der Zählwertverteilungsdatentabelle (CT) gespeichert sind, die von der Zählwertverteilungsdatenverarbeitungseinheit (133) ausgegeben werden. - Analysevorrichtung (100) nach Anspruch 1, wobei der Referenzverschiebungsbetrag (φa) ein fester Wert für jede radiale Messposition ist und der Gate-Verschiebungsbetrag (Δφa) ein variabler Wert basierend auf der radialen Messposition ist.
- Analysevorrichtung (100) nach Anspruch 1, wobei die Gate-Verschiebungsverarbeitungseinheit (132), in die ein Zählwert (GCVna) von einem Gate-Signal (GSna), das einem Gate-Signal-entsprechenden Bereich (GRa) entspricht, der einen geteilten Bereich (DRa) aufweist, einem Zählwert (GCVn+1a) von einem Gate-Signal (GSn+1a), das einem Gate-Signal-entsprechenden Bereich (GRb) entspricht, der zu einer Seite des geteilten Bereichs (DRa) in der radialen Richtung der Probenanalysescheibe (10) benachbart ist, und einem Zählwert (GCVn-1b) von einem Gate-Signal (GSn-1b), das einem Gate-Signal-entsprechenden Bereich (GRc) entspricht, der zu der anderen Seite des geteilten Bereichs (DRa) in der radialen Richtung der Probenanalysescheibe (10) benachbart ist, von der Zählwerterzeugungsverarbeitungseinheit (131) eingegeben wird, wobei die Gate-Verschiebungsverarbeitungseinheit (132) konfiguriert ist zum Einstellen eines Durchschnittswerts der drei Zählwerte (GCVna, GCVn+1a, GCVn-1b) oder eines Werts, der durch Multiplizieren des Durchschnitts mit einem Drittel erhalten wird, als einen Zählwert (DCVa) des geteilten Bereichs (DRa) und Ausgeben des Zählwerts (DCVa) des geteilten Bereichs (DRa) an die Zählwerterzeugungsverarbeitungseinheit (131).
- Analyseverfahren, aufweisend:Drehen einer kreisförmigen Probenanalysescheibe (10) mit einem Reaktionsbereich (14), auf dem Nanopartikel (15) eingefangen sind;Bewegen eines optischen Aufnehmers (111) in eine radiale Richtung der Probenanalysescheibe (10), Detektieren einer radialen Messposition für den optischen Aufnehmer (111) in der Probenanalysescheibe (10) und Erzeugen von radialen Messpositionsinformationen (HJ) basierend auf der detektierten radialen Messposition;Detektieren eines Referenzpositionsdefinitionsabschnitts (11), der in der Probenanalysescheibe (10) gebildet ist, und Erzeugen eines Referenzpositionsdetektionssignals (KS) basierend auf dem detektierten Referenzpositionsdefinitionsabschnitt (11);Bestrahlen des Reaktionsbereichs (14) mit Laserlicht (111a), das von dem optischen Aufnehmer (111) emittiert wird, Empfangen von reflektiertem Licht von der Probenanalysescheibe (10) und Erzeugen eines Lichtempfangsdetektionssignals (JS) basierend auf dem empfangenen reflektierten Licht;Erzeugen von Gate-Informationen (GJ1), beinhaltend eine Gate-Breite (W) und eine Phasendifferenz (φa+Δφa), basierend auf den radialen Messpositionsinformationen (HJ),
wobei die Phasendifferenz (φa+Δφa) eine Summe eines Referenzverschiebungsbetrags (φa) und eines Gate-Verschiebungsbetrags (Δφa) ist;Erzeugen eines Gate-Signals (GS), das in Bezug auf das Referenzpositionsdetektionssignal (KS) um die Phasendifferenz (φa+Δφa) in jeder radialen Messposition in einer Drehrichtung der Probenanalysescheibe (10) gemäß dem Referenzpositionsdetektionssignal (KS) und den Gate-Informationen (GJ1) verschoben ist;Synchronisieren eines Timings zwischen dem Gate-Signal (GS) und dem Lichtempfangsdetektionssignal (JS) basierend auf dem Referenzpositionsdetektionssignal (KS);Extrahieren von Nanopartikelimpulssignalen (BS), die jedes Mal erzeugt werden, wenn die Nanopartikel (15) mit dem Laserlicht (111a) abgetastet werden, aus dem Lichtempfangsdetektionssignal (JS) pro Gate-Signal (GS), Zählen der Nanopartikelimpulssignale (BS) und Erzeugen eines Zählwerts (GCV) des entsprechenden Gate-Signals (GS) basierend auf den gezählten Nanopartikelimpulssignalen (BS);Teilen eines Gate-Signal-entsprechenden Bereichs (GR) des entsprechenden Gate-Signals (GS) durch einen Einheits-Gate-Verschiebungsbetrag (Δφua) in der Drehrichtung der Probenanalysescheibe (10), um eine Vielzahl von geteilten Bereichen (DR) zu definieren,wobei der Gate-Signal-entsprechende Bereich (GR) ein Bereich in der Probenanalysescheibe (10) ist, der definiert wird, wenn das entsprechende Gate-Signal (GS) gemessen wird, undder Gate-Verschiebungsbetrag (Δφa) gleich einem positiven ganzzahligen Vielfachen des Einheits-Gate-Verschiebungsbetrags (Δφua) ist;Einstellen von Zählwerten (DCV) der geteilten Bereiche (DR) basierend auf den radialen Messpositionsinformationen (HJ) und dem Zählwert (GCV) des entsprechenden Gate-Signals (GS);Erzeugen von Positionsinformationen (DRJ) der geteilten Bereiche (DR);Speichern der Zählwerte (DCV) der geteilten Bereiche (DR) in einer Zählwertverteilungsdatentabelle (CT) gemäß den Positionsinformationen (DRJ) der geteilten Bereiche (DR); undSpezifizieren einer Position des Reaktionsbereichs (14) durch Abtasten eines gesamten Messbereichs (16) mit einem Filter (CF) mit einer vorbestimmten Form, die eine Designform des Reaktionsbereichs (14) ist, und Bestimmen einer Position, an der das Filter (CF) einen größten Zählwert aufweist, Erzeugen von Positionsinformationen (RRJ) des Reaktionsbereichs (14) basierend auf der spezifizierten Position des Reaktionsbereichs (14), und Bestimmen eines Zählwerts (RCV) im Reaktionsbereich (14) basierend auf den Zählwerten (DCV) der geteilten Bereiche (DR), die in der Zählwertverteilungsdatentabelle (CT) gespeichert sind.
Applications Claiming Priority (1)
| Application Number | Priority Date | Filing Date | Title |
|---|---|---|---|
| JP2017217036A JP6972946B2 (ja) | 2017-11-10 | 2017-11-10 | 分析装置及び分析方法 |
Publications (2)
| Publication Number | Publication Date |
|---|---|
| EP3483587A1 EP3483587A1 (de) | 2019-05-15 |
| EP3483587B1 true EP3483587B1 (de) | 2023-11-29 |
Family
ID=64308517
Family Applications (1)
| Application Number | Title | Priority Date | Filing Date |
|---|---|---|---|
| EP18205272.0A Active EP3483587B1 (de) | 2017-11-10 | 2018-11-08 | Analysevorrichtung und analyseverfahren |
Country Status (3)
| Country | Link |
|---|---|
| US (1) | US11131621B2 (de) |
| EP (1) | EP3483587B1 (de) |
| JP (1) | JP6972946B2 (de) |
Families Citing this family (4)
| Publication number | Priority date | Publication date | Assignee | Title |
|---|---|---|---|---|
| JP7127512B2 (ja) * | 2018-11-28 | 2022-08-30 | 株式会社Jvcケンウッド | 光ディスク装置及び光ディスク回転位置検出方法 |
| JP7183899B2 (ja) * | 2019-03-25 | 2022-12-06 | 株式会社Jvcケンウッド | 分析装置及び分析方法 |
| WO2021229970A1 (ja) * | 2020-05-12 | 2021-11-18 | 古野電気株式会社 | 分析装置、分析方法、およびプログラム |
| EP4310497A4 (de) * | 2021-03-18 | 2024-08-28 | JVCKenwood Corporation | Analysevorrichtung und analyseverfahren |
Family Cites Families (5)
| Publication number | Priority date | Publication date | Assignee | Title |
|---|---|---|---|---|
| JP2002039974A (ja) * | 2000-07-26 | 2002-02-06 | Shimadzu Corp | 蛍光x線分析装置 |
| US20040248093A1 (en) * | 2000-11-27 | 2004-12-09 | Coombs James Howard | Magneto-optical bio-discs and systems including related methods |
| JP2015127692A (ja) * | 2013-11-28 | 2015-07-09 | 株式会社Jvcケンウッド | 分析用基板、分析用基板の製造方法及び基板分析装置 |
| JP2017058242A (ja) | 2015-09-16 | 2017-03-23 | 株式会社Jvcケンウッド | 検体検出用ユニット、分析装置、及び、分析方法 |
| JP6687834B2 (ja) * | 2016-02-03 | 2020-04-28 | 株式会社Jvcケンウッド | 分析装置及び分析方法 |
-
2017
- 2017-11-10 JP JP2017217036A patent/JP6972946B2/ja not_active Expired - Fee Related
-
2018
- 2018-11-02 US US16/178,889 patent/US11131621B2/en not_active Expired - Fee Related
- 2018-11-08 EP EP18205272.0A patent/EP3483587B1/de active Active
Also Published As
| Publication number | Publication date |
|---|---|
| US11131621B2 (en) | 2021-09-28 |
| EP3483587A1 (de) | 2019-05-15 |
| JP2019086484A (ja) | 2019-06-06 |
| US20190145885A1 (en) | 2019-05-16 |
| JP6972946B2 (ja) | 2021-11-24 |
Similar Documents
| Publication | Publication Date | Title |
|---|---|---|
| EP3483587B1 (de) | Analysevorrichtung und analyseverfahren | |
| US10866233B2 (en) | Analysis device and analysis method | |
| US11300580B2 (en) | Analysis device and analysis method | |
| US10809178B2 (en) | Analysis device and analysis method | |
| WO2015083442A1 (ja) | データ処理方法及びデータ処理装置 | |
| CN112219107B (zh) | 分析用阈值生成装置以及分析用阈值生成方法 | |
| CN100342434C (zh) | 光盘的跟踪控制装置及其跟踪控制方法 | |
| EP3128310A1 (de) | Analysevorrichtung und analyseverfahren | |
| EP3546941B1 (de) | Analysegerät und analysemethode unter verwendung von nanopartikeln | |
| US12007325B2 (en) | Analysis device and analysis method | |
| US11692924B2 (en) | Optical device and method for detection target substance analysis | |
| JP2018136297A (ja) | 分析装置及び分析方法 | |
| JP6962276B2 (ja) | 分析用閾値決定装置及び分析用閾値決定方法 | |
| JP4710347B2 (ja) | 分析装置およびそれに使用する分析ディスク | |
| JP2023546458A (ja) | 核燃料ペレットを検査するためのシステムおよび方法 | |
| JP7218788B2 (ja) | 分析用閾値生成装置及び分析用閾値生成方法 | |
| JP7183899B2 (ja) | 分析装置及び分析方法 | |
| JP2015068731A (ja) | 磁気メディアの光学式検査方法及びその装置 |
Legal Events
| Date | Code | Title | Description |
|---|---|---|---|
| PUAI | Public reference made under article 153(3) epc to a published international application that has entered the european phase |
Free format text: ORIGINAL CODE: 0009012 |
|
| STAA | Information on the status of an ep patent application or granted ep patent |
Free format text: STATUS: THE APPLICATION HAS BEEN PUBLISHED |
|
| AK | Designated contracting states |
Kind code of ref document: A1 Designated state(s): AL AT BE BG CH CY CZ DE DK EE ES FI FR GB GR HR HU IE IS IT LI LT LU LV MC MK MT NL NO PL PT RO RS SE SI SK SM TR |
|
| AX | Request for extension of the european patent |
Extension state: BA ME |
|
| STAA | Information on the status of an ep patent application or granted ep patent |
Free format text: STATUS: REQUEST FOR EXAMINATION WAS MADE |
|
| 17P | Request for examination filed |
Effective date: 20191115 |
|
| RBV | Designated contracting states (corrected) |
Designated state(s): AL AT BE BG CH CY CZ DE DK EE ES FI FR GB GR HR HU IE IS IT LI LT LU LV MC MK MT NL NO PL PT RO RS SE SI SK SM TR |
|
| STAA | Information on the status of an ep patent application or granted ep patent |
Free format text: STATUS: EXAMINATION IS IN PROGRESS |
|
| 17Q | First examination report despatched |
Effective date: 20211104 |
|
| GRAP | Despatch of communication of intention to grant a patent |
Free format text: ORIGINAL CODE: EPIDOSNIGR1 |
|
| STAA | Information on the status of an ep patent application or granted ep patent |
Free format text: STATUS: GRANT OF PATENT IS INTENDED |
|
| INTG | Intention to grant announced |
Effective date: 20230623 |
|
| RAP3 | Party data changed (applicant data changed or rights of an application transferred) |
Owner name: JVC KENWOOD CORPORATION |
|
| GRAS | Grant fee paid |
Free format text: ORIGINAL CODE: EPIDOSNIGR3 |
|
| GRAA | (expected) grant |
Free format text: ORIGINAL CODE: 0009210 |
|
| STAA | Information on the status of an ep patent application or granted ep patent |
Free format text: STATUS: THE PATENT HAS BEEN GRANTED |
|
| AK | Designated contracting states |
Kind code of ref document: B1 Designated state(s): AL AT BE BG CH CY CZ DE DK EE ES FI FR GB GR HR HU IE IS IT LI LT LU LV MC MK MT NL NO PL PT RO RS SE SI SK SM TR |
|
| RAP3 | Party data changed (applicant data changed or rights of an application transferred) |
Owner name: JVCKENWOOD CORPORATION |
|
| REG | Reference to a national code |
Ref country code: GB Ref legal event code: FG4D |
|
| REG | Reference to a national code |
Ref country code: CH Ref legal event code: EP |
|
| REG | Reference to a national code |
Ref country code: IE Ref legal event code: FG4D |
|
| REG | Reference to a national code |
Ref country code: DE Ref legal event code: R096 Ref document number: 602018061749 Country of ref document: DE |
|
| REG | Reference to a national code |
Ref country code: LT Ref legal event code: MG9D |
|
| REG | Reference to a national code |
Ref country code: NL Ref legal event code: MP Effective date: 20231129 |
|
| PG25 | Lapsed in a contracting state [announced via postgrant information from national office to epo] |
Ref country code: GR Free format text: LAPSE BECAUSE OF FAILURE TO SUBMIT A TRANSLATION OF THE DESCRIPTION OR TO PAY THE FEE WITHIN THE PRESCRIBED TIME-LIMIT Effective date: 20240301 |
|
| PG25 | Lapsed in a contracting state [announced via postgrant information from national office to epo] |
Ref country code: IS Free format text: LAPSE BECAUSE OF FAILURE TO SUBMIT A TRANSLATION OF THE DESCRIPTION OR TO PAY THE FEE WITHIN THE PRESCRIBED TIME-LIMIT Effective date: 20240329 |
|
| PG25 | Lapsed in a contracting state [announced via postgrant information from national office to epo] |
Ref country code: LT Free format text: LAPSE BECAUSE OF FAILURE TO SUBMIT A TRANSLATION OF THE DESCRIPTION OR TO PAY THE FEE WITHIN THE PRESCRIBED TIME-LIMIT Effective date: 20231129 |
|
| PG25 | Lapsed in a contracting state [announced via postgrant information from national office to epo] |
Ref country code: ES Free format text: LAPSE BECAUSE OF FAILURE TO SUBMIT A TRANSLATION OF THE DESCRIPTION OR TO PAY THE FEE WITHIN THE PRESCRIBED TIME-LIMIT Effective date: 20231129 |
|
| PG25 | Lapsed in a contracting state [announced via postgrant information from national office to epo] |
Ref country code: LT Free format text: LAPSE BECAUSE OF FAILURE TO SUBMIT A TRANSLATION OF THE DESCRIPTION OR TO PAY THE FEE WITHIN THE PRESCRIBED TIME-LIMIT Effective date: 20231129 Ref country code: IS Free format text: LAPSE BECAUSE OF FAILURE TO SUBMIT A TRANSLATION OF THE DESCRIPTION OR TO PAY THE FEE WITHIN THE PRESCRIBED TIME-LIMIT Effective date: 20240329 Ref country code: GR Free format text: LAPSE BECAUSE OF FAILURE TO SUBMIT A TRANSLATION OF THE DESCRIPTION OR TO PAY THE FEE WITHIN THE PRESCRIBED TIME-LIMIT Effective date: 20240301 Ref country code: ES Free format text: LAPSE BECAUSE OF FAILURE TO SUBMIT A TRANSLATION OF THE DESCRIPTION OR TO PAY THE FEE WITHIN THE PRESCRIBED TIME-LIMIT Effective date: 20231129 Ref country code: BG Free format text: LAPSE BECAUSE OF FAILURE TO SUBMIT A TRANSLATION OF THE DESCRIPTION OR TO PAY THE FEE WITHIN THE PRESCRIBED TIME-LIMIT Effective date: 20240229 |
|
| REG | Reference to a national code |
Ref country code: AT Ref legal event code: MK05 Ref document number: 1636601 Country of ref document: AT Kind code of ref document: T Effective date: 20231129 |
|
| PG25 | Lapsed in a contracting state [announced via postgrant information from national office to epo] |
Ref country code: NL Free format text: LAPSE BECAUSE OF FAILURE TO SUBMIT A TRANSLATION OF THE DESCRIPTION OR TO PAY THE FEE WITHIN THE PRESCRIBED TIME-LIMIT Effective date: 20231129 |
|
| PG25 | Lapsed in a contracting state [announced via postgrant information from national office to epo] |
Ref country code: SE Free format text: LAPSE BECAUSE OF FAILURE TO SUBMIT A TRANSLATION OF THE DESCRIPTION OR TO PAY THE FEE WITHIN THE PRESCRIBED TIME-LIMIT Effective date: 20231129 Ref country code: RS Free format text: LAPSE BECAUSE OF FAILURE TO SUBMIT A TRANSLATION OF THE DESCRIPTION OR TO PAY THE FEE WITHIN THE PRESCRIBED TIME-LIMIT Effective date: 20231129 Ref country code: PL Free format text: LAPSE BECAUSE OF FAILURE TO SUBMIT A TRANSLATION OF THE DESCRIPTION OR TO PAY THE FEE WITHIN THE PRESCRIBED TIME-LIMIT Effective date: 20231129 Ref country code: NO Free format text: LAPSE BECAUSE OF FAILURE TO SUBMIT A TRANSLATION OF THE DESCRIPTION OR TO PAY THE FEE WITHIN THE PRESCRIBED TIME-LIMIT Effective date: 20240229 Ref country code: NL Free format text: LAPSE BECAUSE OF FAILURE TO SUBMIT A TRANSLATION OF THE DESCRIPTION OR TO PAY THE FEE WITHIN THE PRESCRIBED TIME-LIMIT Effective date: 20231129 Ref country code: LV Free format text: LAPSE BECAUSE OF FAILURE TO SUBMIT A TRANSLATION OF THE DESCRIPTION OR TO PAY THE FEE WITHIN THE PRESCRIBED TIME-LIMIT Effective date: 20231129 Ref country code: HR Free format text: LAPSE BECAUSE OF FAILURE TO SUBMIT A TRANSLATION OF THE DESCRIPTION OR TO PAY THE FEE WITHIN THE PRESCRIBED TIME-LIMIT Effective date: 20231129 |
|
| PG25 | Lapsed in a contracting state [announced via postgrant information from national office to epo] |
Ref country code: DK Free format text: LAPSE BECAUSE OF FAILURE TO SUBMIT A TRANSLATION OF THE DESCRIPTION OR TO PAY THE FEE WITHIN THE PRESCRIBED TIME-LIMIT Effective date: 20231129 |
|
| PG25 | Lapsed in a contracting state [announced via postgrant information from national office to epo] |
Ref country code: CZ Free format text: LAPSE BECAUSE OF FAILURE TO SUBMIT A TRANSLATION OF THE DESCRIPTION OR TO PAY THE FEE WITHIN THE PRESCRIBED TIME-LIMIT Effective date: 20231129 Ref country code: AT Free format text: LAPSE BECAUSE OF FAILURE TO SUBMIT A TRANSLATION OF THE DESCRIPTION OR TO PAY THE FEE WITHIN THE PRESCRIBED TIME-LIMIT Effective date: 20231129 |
|
| PG25 | Lapsed in a contracting state [announced via postgrant information from national office to epo] |
Ref country code: SK Free format text: LAPSE BECAUSE OF FAILURE TO SUBMIT A TRANSLATION OF THE DESCRIPTION OR TO PAY THE FEE WITHIN THE PRESCRIBED TIME-LIMIT Effective date: 20231129 |
|
| PG25 | Lapsed in a contracting state [announced via postgrant information from national office to epo] |
Ref country code: SM Free format text: LAPSE BECAUSE OF FAILURE TO SUBMIT A TRANSLATION OF THE DESCRIPTION OR TO PAY THE FEE WITHIN THE PRESCRIBED TIME-LIMIT Effective date: 20231129 Ref country code: SK Free format text: LAPSE BECAUSE OF FAILURE TO SUBMIT A TRANSLATION OF THE DESCRIPTION OR TO PAY THE FEE WITHIN THE PRESCRIBED TIME-LIMIT Effective date: 20231129 Ref country code: RO Free format text: LAPSE BECAUSE OF FAILURE TO SUBMIT A TRANSLATION OF THE DESCRIPTION OR TO PAY THE FEE WITHIN THE PRESCRIBED TIME-LIMIT Effective date: 20231129 Ref country code: IT Free format text: LAPSE BECAUSE OF FAILURE TO SUBMIT A TRANSLATION OF THE DESCRIPTION OR TO PAY THE FEE WITHIN THE PRESCRIBED TIME-LIMIT Effective date: 20231129 Ref country code: EE Free format text: LAPSE BECAUSE OF FAILURE TO SUBMIT A TRANSLATION OF THE DESCRIPTION OR TO PAY THE FEE WITHIN THE PRESCRIBED TIME-LIMIT Effective date: 20231129 Ref country code: DK Free format text: LAPSE BECAUSE OF FAILURE TO SUBMIT A TRANSLATION OF THE DESCRIPTION OR TO PAY THE FEE WITHIN THE PRESCRIBED TIME-LIMIT Effective date: 20231129 Ref country code: CZ Free format text: LAPSE BECAUSE OF FAILURE TO SUBMIT A TRANSLATION OF THE DESCRIPTION OR TO PAY THE FEE WITHIN THE PRESCRIBED TIME-LIMIT Effective date: 20231129 Ref country code: AT Free format text: LAPSE BECAUSE OF FAILURE TO SUBMIT A TRANSLATION OF THE DESCRIPTION OR TO PAY THE FEE WITHIN THE PRESCRIBED TIME-LIMIT Effective date: 20231129 |
|
| PG25 | Lapsed in a contracting state [announced via postgrant information from national office to epo] |
Ref country code: PT Free format text: LAPSE BECAUSE OF FAILURE TO SUBMIT A TRANSLATION OF THE DESCRIPTION OR TO PAY THE FEE WITHIN THE PRESCRIBED TIME-LIMIT Effective date: 20240401 |
|
| PG25 | Lapsed in a contracting state [announced via postgrant information from national office to epo] |
Ref country code: PT Free format text: LAPSE BECAUSE OF FAILURE TO SUBMIT A TRANSLATION OF THE DESCRIPTION OR TO PAY THE FEE WITHIN THE PRESCRIBED TIME-LIMIT Effective date: 20240401 |
|
| REG | Reference to a national code |
Ref country code: DE Ref legal event code: R097 Ref document number: 602018061749 Country of ref document: DE |
|
| PLBE | No opposition filed within time limit |
Free format text: ORIGINAL CODE: 0009261 |
|
| STAA | Information on the status of an ep patent application or granted ep patent |
Free format text: STATUS: NO OPPOSITION FILED WITHIN TIME LIMIT |
|
| PG25 | Lapsed in a contracting state [announced via postgrant information from national office to epo] |
Ref country code: SI Free format text: LAPSE BECAUSE OF FAILURE TO SUBMIT A TRANSLATION OF THE DESCRIPTION OR TO PAY THE FEE WITHIN THE PRESCRIBED TIME-LIMIT Effective date: 20231129 |
|
| PG25 | Lapsed in a contracting state [announced via postgrant information from national office to epo] |
Ref country code: SI Free format text: LAPSE BECAUSE OF FAILURE TO SUBMIT A TRANSLATION OF THE DESCRIPTION OR TO PAY THE FEE WITHIN THE PRESCRIBED TIME-LIMIT Effective date: 20231129 |
|
| 26N | No opposition filed |
Effective date: 20240830 |
|
| REG | Reference to a national code |
Ref country code: DE Ref legal event code: R119 Ref document number: 602018061749 Country of ref document: DE |
|
| REG | Reference to a national code |
Ref country code: CH Ref legal event code: PL |
|
| PG25 | Lapsed in a contracting state [announced via postgrant information from national office to epo] |
Ref country code: MC Free format text: LAPSE BECAUSE OF FAILURE TO SUBMIT A TRANSLATION OF THE DESCRIPTION OR TO PAY THE FEE WITHIN THE PRESCRIBED TIME-LIMIT Effective date: 20231129 |
|
| PG25 | Lapsed in a contracting state [announced via postgrant information from national office to epo] |
Ref country code: LU Free format text: LAPSE BECAUSE OF NON-PAYMENT OF DUE FEES Effective date: 20241108 |
|
| REG | Reference to a national code |
Ref country code: CH Ref legal event code: PL |
|
| GBPC | Gb: european patent ceased through non-payment of renewal fee |
Effective date: 20241108 |
|
| PG25 | Lapsed in a contracting state [announced via postgrant information from national office to epo] |
Ref country code: CH Free format text: LAPSE BECAUSE OF NON-PAYMENT OF DUE FEES Effective date: 20241130 |
|
| REG | Reference to a national code |
Ref country code: BE Ref legal event code: MM Effective date: 20241130 |
|
| PG25 | Lapsed in a contracting state [announced via postgrant information from national office to epo] |
Ref country code: FI Free format text: LAPSE BECAUSE OF FAILURE TO SUBMIT A TRANSLATION OF THE DESCRIPTION OR TO PAY THE FEE WITHIN THE PRESCRIBED TIME-LIMIT Effective date: 20231129 |
|
| PG25 | Lapsed in a contracting state [announced via postgrant information from national office to epo] |
Ref country code: DE Free format text: LAPSE BECAUSE OF NON-PAYMENT OF DUE FEES Effective date: 20250603 |
|
| PG25 | Lapsed in a contracting state [announced via postgrant information from national office to epo] |
Ref country code: GB Free format text: LAPSE BECAUSE OF NON-PAYMENT OF DUE FEES Effective date: 20241108 Ref country code: BE Free format text: LAPSE BECAUSE OF NON-PAYMENT OF DUE FEES Effective date: 20241130 |
|
| PG25 | Lapsed in a contracting state [announced via postgrant information from national office to epo] |
Ref country code: FR Free format text: LAPSE BECAUSE OF NON-PAYMENT OF DUE FEES Effective date: 20241130 |
|
| PG25 | Lapsed in a contracting state [announced via postgrant information from national office to epo] |
Ref country code: IE Free format text: LAPSE BECAUSE OF NON-PAYMENT OF DUE FEES Effective date: 20241108 |
|
| PG25 | Lapsed in a contracting state [announced via postgrant information from national office to epo] |
Ref country code: HU Free format text: LAPSE BECAUSE OF FAILURE TO SUBMIT A TRANSLATION OF THE DESCRIPTION OR TO PAY THE FEE WITHIN THE PRESCRIBED TIME-LIMIT; INVALID AB INITIO Effective date: 20181108 |
|
| PG25 | Lapsed in a contracting state [announced via postgrant information from national office to epo] |
Ref country code: CY Free format text: LAPSE BECAUSE OF FAILURE TO SUBMIT A TRANSLATION OF THE DESCRIPTION OR TO PAY THE FEE WITHIN THE PRESCRIBED TIME-LIMIT; INVALID AB INITIO Effective date: 20181108 |