EP3474822B1 - Formulations of brincidofovir - Google Patents
Formulations of brincidofovir Download PDFInfo
- Publication number
- EP3474822B1 EP3474822B1 EP17737695.1A EP17737695A EP3474822B1 EP 3474822 B1 EP3474822 B1 EP 3474822B1 EP 17737695 A EP17737695 A EP 17737695A EP 3474822 B1 EP3474822 B1 EP 3474822B1
- Authority
- EP
- European Patent Office
- Prior art keywords
- brincidofovir
- clear
- concentration
- colorless
- bcv
- Prior art date
- Legal status (The legal status is an assumption and is not a legal conclusion. Google has not performed a legal analysis and makes no representation as to the accuracy of the status listed.)
- Active
Links
Images


Classifications
-
- A—HUMAN NECESSITIES
- A61—MEDICAL OR VETERINARY SCIENCE; HYGIENE
- A61K—PREPARATIONS FOR MEDICAL, DENTAL OR TOILETRY PURPOSES
- A61K31/00—Medicinal preparations containing organic active ingredients
- A61K31/66—Phosphorus compounds
- A61K31/675—Phosphorus compounds having nitrogen as a ring hetero atom, e.g. pyridoxal phosphate
-
- A—HUMAN NECESSITIES
- A61—MEDICAL OR VETERINARY SCIENCE; HYGIENE
- A61K—PREPARATIONS FOR MEDICAL, DENTAL OR TOILETRY PURPOSES
- A61K47/00—Medicinal preparations characterised by the non-active ingredients used, e.g. carriers or inert additives; Targeting or modifying agents chemically bound to the active ingredient
- A61K47/06—Organic compounds, e.g. natural or synthetic hydrocarbons, polyolefins, mineral oil, petrolatum or ozokerite
- A61K47/16—Organic compounds, e.g. natural or synthetic hydrocarbons, polyolefins, mineral oil, petrolatum or ozokerite containing nitrogen, e.g. nitro-, nitroso-, azo-compounds, nitriles, cyanates
- A61K47/18—Amines; Amides; Ureas; Quaternary ammonium compounds; Amino acids; Oligopeptides having up to five amino acids
- A61K47/183—Amino acids, e.g. glycine, EDTA or aspartame
-
- A—HUMAN NECESSITIES
- A61—MEDICAL OR VETERINARY SCIENCE; HYGIENE
- A61K—PREPARATIONS FOR MEDICAL, DENTAL OR TOILETRY PURPOSES
- A61K47/00—Medicinal preparations characterised by the non-active ingredients used, e.g. carriers or inert additives; Targeting or modifying agents chemically bound to the active ingredient
- A61K47/06—Organic compounds, e.g. natural or synthetic hydrocarbons, polyolefins, mineral oil, petrolatum or ozokerite
- A61K47/26—Carbohydrates, e.g. sugar alcohols, amino sugars, nucleic acids, mono-, di- or oligo-saccharides; Derivatives thereof, e.g. polysorbates, sorbitan fatty acid esters or glycyrrhizin
-
- A—HUMAN NECESSITIES
- A61—MEDICAL OR VETERINARY SCIENCE; HYGIENE
- A61K—PREPARATIONS FOR MEDICAL, DENTAL OR TOILETRY PURPOSES
- A61K9/00—Medicinal preparations characterised by special physical form
- A61K9/0012—Galenical forms characterised by the site of application
- A61K9/0019—Injectable compositions; Intramuscular, intravenous, arterial, subcutaneous administration; Compositions to be administered through the skin in an invasive manner
-
- A—HUMAN NECESSITIES
- A61—MEDICAL OR VETERINARY SCIENCE; HYGIENE
- A61K—PREPARATIONS FOR MEDICAL, DENTAL OR TOILETRY PURPOSES
- A61K9/00—Medicinal preparations characterised by special physical form
- A61K9/08—Solutions
-
- A—HUMAN NECESSITIES
- A61—MEDICAL OR VETERINARY SCIENCE; HYGIENE
- A61K—PREPARATIONS FOR MEDICAL, DENTAL OR TOILETRY PURPOSES
- A61K9/00—Medicinal preparations characterised by special physical form
- A61K9/14—Particulate form, e.g. powders, Processes for size reducing of pure drugs or the resulting products, Pure drug nanoparticles
- A61K9/19—Particulate form, e.g. powders, Processes for size reducing of pure drugs or the resulting products, Pure drug nanoparticles lyophilised, i.e. freeze-dried, solutions or dispersions
-
- A—HUMAN NECESSITIES
- A61—MEDICAL OR VETERINARY SCIENCE; HYGIENE
- A61P—SPECIFIC THERAPEUTIC ACTIVITY OF CHEMICAL COMPOUNDS OR MEDICINAL PREPARATIONS
- A61P31/00—Antiinfectives, i.e. antibiotics, antiseptics, chemotherapeutics
- A61P31/12—Antivirals
-
- A—HUMAN NECESSITIES
- A61—MEDICAL OR VETERINARY SCIENCE; HYGIENE
- A61P—SPECIFIC THERAPEUTIC ACTIVITY OF CHEMICAL COMPOUNDS OR MEDICINAL PREPARATIONS
- A61P31/00—Antiinfectives, i.e. antibiotics, antiseptics, chemotherapeutics
- A61P31/12—Antivirals
- A61P31/14—Antivirals for RNA viruses
-
- A—HUMAN NECESSITIES
- A61—MEDICAL OR VETERINARY SCIENCE; HYGIENE
- A61P—SPECIFIC THERAPEUTIC ACTIVITY OF CHEMICAL COMPOUNDS OR MEDICINAL PREPARATIONS
- A61P31/00—Antiinfectives, i.e. antibiotics, antiseptics, chemotherapeutics
- A61P31/12—Antivirals
- A61P31/20—Antivirals for DNA viruses
-
- A—HUMAN NECESSITIES
- A61—MEDICAL OR VETERINARY SCIENCE; HYGIENE
- A61P—SPECIFIC THERAPEUTIC ACTIVITY OF CHEMICAL COMPOUNDS OR MEDICINAL PREPARATIONS
- A61P31/00—Antiinfectives, i.e. antibiotics, antiseptics, chemotherapeutics
- A61P31/12—Antivirals
- A61P31/20—Antivirals for DNA viruses
- A61P31/22—Antivirals for DNA viruses for herpes viruses
-
- Y—GENERAL TAGGING OF NEW TECHNOLOGICAL DEVELOPMENTS; GENERAL TAGGING OF CROSS-SECTIONAL TECHNOLOGIES SPANNING OVER SEVERAL SECTIONS OF THE IPC; TECHNICAL SUBJECTS COVERED BY FORMER USPC CROSS-REFERENCE ART COLLECTIONS [XRACs] AND DIGESTS
- Y02—TECHNOLOGIES OR APPLICATIONS FOR MITIGATION OR ADAPTATION AGAINST CLIMATE CHANGE
- Y02A—TECHNOLOGIES FOR ADAPTATION TO CLIMATE CHANGE
- Y02A50/00—TECHNOLOGIES FOR ADAPTATION TO CLIMATE CHANGE in human health protection, e.g. against extreme weather
- Y02A50/30—Against vector-borne diseases, e.g. mosquito-borne, fly-borne, tick-borne or waterborne diseases whose impact is exacerbated by climate change
Definitions
- Brincidofovir (BCV, CMX001) is an orally bioavailable, lipid acyclic nucleoside phosphonate that is converted intracellularly into the active antiviral cidofovir diphosphate (CDV-PP).
- CDV-PP active antiviral cidofovir diphosphate
- WO 2008/133966A1 discloses conjugate compounds comprising an acyclic nucleoside phosphonate covalently coupled to a lipid for the therapeutic and/or prophylactic treatment of viral infection in an immunodeficient subject, wherein a preferred conjugate compound is CMX001.
- Brincidofovir has broad spectrum antiviral activity against double-stranded DNA viruses. The structure of brincidofovir is shown below:
- compositions comprising brincidofovir and methods of using the same.
- the compositions can be lyophilized (e.g., as a powder) for long-term storage.
- biocompatible formulations for intravenous (IV) administration e.g., to a subject in need thereof).
- the bulking agent is mannitol, and the buffer is L-arginine.
- the brincidofovir is present at a concentration of 10 mg/mL.
- the bulking agent mannitol is present at a concentration of 2.5-9% (w/v). In some embodiments, the bulking agent mannitol is present at a concentration of 2.5% (w/v). In some embodiments, the bulking agent mannitol is present at a concentration of 5% (w/v).
- the buffer L-arginine is present at a concentration of 100-200 mM. In some embodiments, the buffer L-arginine is present at a concentration of 100 mM. In some embodiments, the pH is adjusted using HCl and/or NaOH.
- the pharmaceutical composition comprises: brincidofovir at a concentration of 10.0 mg/mL; mannitol at a concentration of 25-50 mg/mL; L-arginine at a concentration of 17.4 mg/mL; and water; wherein the pH of the composition is 8.0.
- the pharmaceutical composition comprises: brincidofovir at a concentration of 17.8 mM; mannitol at a concentration of 137.5-275 mM; L-arginine at a concentration of 100 mM; and water; wherein the pH of the composition is 8.0.
- the liquid pharmaceutical composition can be lyophilized, e.g., to remove water, forming a lyophilized powder.
- the present disclosure provides a lyophilized powder comprising: 13-19% by weight brincidofovir; 48% - 65% by weight mannitol; and 22-33% by weight arginine.
- the lyophilized powder contains 19% by weight brincidofovir, 48% by weight mannitol, and 33% by weight arginine.
- the lyophilized powder contains 13% by weight brincidofovir, 65% by weight mannitol, and 22% by weight arginine.
- the pH of the lyophilized powder is 8.0.
- the present disclosure provides an aqueous pharmaceutical composition, comprising the lyophilized powder disclosed above; and an aqueous sugar alcohol solution, an aqueous sugar solution, Ringer's solution or a sodium chloride solution.
- the aqueous pharmaceutical composition comprises: brincidofovir; mannitol; L-arginine; and dextrose.
- the aqueous pharmaceutical composition comprises: brincidofovir; mannitol; L-arginine; and dextrose; wherein the pH of the composition is 8.0.
- the aqueous sugar solution is a solution comprising 5% dextrose by weight. In some embodiments, the concentration of the sodium chloride solution is 0.9% by weight. In some embodiments, the aqueous pharmaceutical composition further comprises additional water.
- the additional water is added (e.g. to adjust tonicity, concentration, or pH of the formulation).
- the aqueous pharmaceutical composition comprises: brincidofovir at a concentration of 1.0 mg/mL; mannitol at a concentration of 2.5-5 mg/mL; and L-arginine at a concentration of 1.74 mg/mL; and dextrose at a concentration of 50 mg/mL.
- the pH of the composition is 8.0, 7.5, 7.0, 6.5, 6.0, or below 6.0.
- the aqueous pharmaceutical composition comprises: brincidofovir at a concentration of 1.78 mM; mannitol at a concentration of 13.75 - 27.5 mM; L-arginine at a concentration of 10 mM; and dextrose at a concentration of 287 mM.
- the pH of the composition is 8.0, 7.5, 7.0, 6.5, 6.0, or below 6.0.
- the aqueous pharmaceutical composition comprises: brincidofovir at a concentration of 0.89 mM; mannitol at a concentration of 6.85 - 13.7 mM; L-arginine at a concentration of 5 mM; and dextrose at a concentration of 287 mM.
- the pH of the composition is 8.0, 7.5, 7.0, 6.5, 6.0, or below 6.0.
- the aqueous pharmaceutical composition comprises: brincidofovir at a concentration of 1.78 mM; mannitol at a concentration of 13.75 - 27.5 mM; L-arginine at a concentration of 10 mM; and dextrose at a concentration of 287 mM; wherein the pH of the composition is 8.0.
- the aqueous pharmaceutical composition comprises: brincidofovir at a concentration of 0.5 mg/mL; mannitol at a concentration of 1.25 - 2.5 mg/mL; and L-arginine at a concentration of 0.87 mg/mL; and dextrose at a concentration of 50 mg/mL; wherein the pH of the composition is 8.0.
- the aqueous pharmaceutical composition comprises: brincidofovir at a concentration of 0.89 mM; mannitol at a concentration of 6.85 - 13.7 mM; L-arginine at a concentration of 5 mM; and dextrose at a concentration of 287 mM; wherein the pH of the composition is 8.0.
- the volume of the aqueous sugar solution, aqueous sugar alcohol solution, Ringer's solution, or aqueous salt solution used to dissolve a lyophilized formulation of brincidofovir is 100 or 200 mL.
- a lyophilized powder comprising brincidofovir is dissolved in 100 mL or 200 mL of aqueous sugar solution, aqueous sugar alcohol solution, Ringer's solution, aqueous salt solution, or water.
- the lyophilized powder is dissolved in 100 mL, 110 mL, 120 mL, 130 mL, 140 mL, 150 mL, 160 mL, 170 mL, 180 mL, 190 mL, or 200 mL.
- a lyophilized powder of the disclosure can be dissolved in 100 mL of a 5% dextrose solution in water.
- a lyophilized powder of the disclosure can be dissolved in 200 mL of a 5% dextrose solution in water.
- the aqueous pharmaceutical composition comprises: 200 mg brincidofovir; 500 - 1000 mg mannitol; 348 mg arginine; 10 g dextrose; and 200 mL water.
- the pH of the composition is 8.0, 7.5, 7.0, 6.5, 6.0, or below 6.0.
- the aqueous pharmaceutical composition comprises: 50 mg brincidofovir; 125 - 250 mg mannitol; 87 mg arginine; 5 g dextrose; and 100 mL water.
- the pH of the composition is 8.0, 7.5, 7.0, 6.5, 6.0, or below 6.0.
- the aqueous pharmaceutical composition comprises: 100 mg brincidofovir; 250 - 500 mg mannitol; 174 mg arginine; 10 g dextrose; and 200 mL water.
- the pH of the composition is 8.0, 7.5, 7.0, 6.5, 6.0, or below 6.0.
- the aqueous pharmaceutical composition comprises: 100 mg brincidofovir; 250 - 500 mg mannitol; 174 mg arginine; 5 g dextrose; and 100 mL water; wherein the pH of the composition is 8.0.
- the aqueous pharmaceutical composition comprises: 200 mg brincidofovir; 500 - 1000 mg mannitol; 348 mg arginine; 10 g dextrose; and 200 mL water; wherein the pH of the composition is 8.0.
- the aqueous pharmaceutical composition comprises: 50 mg brincidofovir; 125 - 250 mg mannitol; 87 mg arginine; 5 g dextrose; and 100 mL water; wherein the pH of the composition is 8.0.
- the aqueous pharmaceutical composition comprises: 100 mg brincidofovir; 250 - 500 mg mannitol; 174 mg arginine; 10 g dextrose; and 200 mL water; wherein the pH of the composition is 8.0.
- one or more of the brincidofovir, the bulking agent, and the buffer have been lyophilized before incorporation into the aqueous pharmaceutical composition described herein.
- the aqueous pharmaceutical composition is suitable for intravenous administration. In some embodiments, the aqueous pharmaceutical composition is sterile.
- the sterile, aqueous pharmaceutical composition for intravenous administration comprisies: brincidofovir; a bulking agent; a buffer; and dextrose.
- the sterile, aqueous pharmaceutical composition for intravenous administration comprises: brincidofovir; a bulking agent; a buffer; and dextrose; wherein the pH of the composition is 8.0.
- the aqueous pharmaceutical composition for intravenous administration comprises: brincidofovir at a concentration of between 0.5 mg/mL and 1.0 mg/mL; the bulking agent mannitol at a concentration of between 2.5 mg/mL and 5 mg/mL; the buffer L-arginine at a concentration of between 0.87 mg/mL and 1.74 mg/mL; and dextrose at a concentration of 50 mg/mL.
- the pH of the composition is 8.0, 7.5, 7.0, 6.5, 6.0, or below 6.0.
- the aqueous pharmaceutical composition for intravenous administration comprises: brincidofovir at a concentration of between 0.5 mg/mL and 1.0 mg/mL; the bulking agent mannitol at a concentration of between 2.5 mg/mL and 5 mg/mL; the buffer L-arginine at a concentration of between 0.87 mg/mL and 1.74 mg/mL; and dextrose at a concentration of 50 mg/mL; wherein the pH of the composition is 8.0.
- the aqueous pharmaceutical composition is for use in the treatment of a viral infection.
- the aqueous pharmaceutical composition can be used in a method of treating a subject with a viral infection, the method comprising: administering to the subject the aqueous pharmaceutical composition as set forth herein.
- the aqueous pharmaceutical composition can be also used in a method of treating a subject with a viral infection, the method comprising: administering to the subject an intravenous pharmaceutical composition comprising brincidofovir; a bulking agent; a buffer; and dextrose as set forth herein.
- the aqueous pharmaceutical composition can be also used in a method of treating a subject with a viral infection, the method comprising: administering to the subject an intravenous pharmaceutical composition comprising brincidofovir; a bulking agent; a buffer; and dextrose; wherein the pH of the composition is 8.0, as set forth herein.
- the aqueous pharmaceutical composition can be also used in a method of treating a subject with a viral infection, the method comprising: administering to the subject an intravenous pharmaceutical composition comprising brincidofovir at a concentration of between 0.5 mg/mL and 1.0 mg/mL; a bulking agent at a concentration of between 2.5 mg/mL and 5 mg/mL; a buffer at a concentration of between 0.87 mg/mL and 1.74 mg/mL; and dextrose at a concentration of 50 mg/mL%.
- the pH of the composition is 8.0, 7.5, 7.0, 6.5, 6.0, or below 6.0, as set forth herein.
- the aqueous pharmaceutical composition can be also used in a method of treating a subject with a viral infection, the method comprising: administering to the subject an intravenous pharmaceutical composition comprising brincidofovir at a concentration of between 0.5 mg/mL and 1.0 mg/mL; a bulking agent at a concentration of between 2.5 mg/mL and 5 mg/mL; a buffer at a concentration of between 0.87 mg/mL and 1.74 mg/mL; and dextrose at a concentration of 50 mg/mL%; wherein the pH of the composition is 8.0, as set forth herein.
- the aqueous pharmaceutical formulation or composition for treatment of a viral infection can be prepared by a process comprising the steps of: dissolving, in any order, an amount of brincidofovir, a bulking agent, and a buffer in water to form a first solution; lyophilizing the first solution to form a lyophilized powder; and dissolving the lyophilized powder in an aqueous sugar alcohol solution, an aqueous sugar solution, Ringer's solution or a sodium chloride solution to form the aqueous pharmaceutical formulation or composition.
- the aqueous pharmaceutical composition comprising brincidofovir; a bulking agent; a buffer; and an aqueous sugar alcohol solution, an aqueous sugar solution, Ringer's solution or a sodium chloride solution can be used in the manufacture of a medicament for the treatment of a viral infection.
- the aqueous pharmaceutical composition comprising brincidofovir; a bulking agent; a buffer; and an aqueous sugar alcohol solution, an aqueous sugar solution, Ringer's solution or a sodium chloride solution is for use in the treatment of a viral infection.
- the viral infection to be treated is, polyomavirus, papillomavirus, herpes virus, adenovirus, Epstein-Barr virus, cytomegalovirus, Hepatitis B virus, Hepatitis C virus, varicella zoster virus, adenovirus, poxvirus, or a combination thereof.
- IV brincidofovir can deliver the drug to organs (e.g., the brain) that can be difficult to reach by other administrative routes (e.g., oral dosage).
- organs e.g., the brain
- other administrative routes e.g., oral dosage
- higher CNS exposure with IV brincidofovir can treat viral infections in the brain (e.g., herpes encephalitis in newborns and adults; HHV-6 encephalitis; JC virus/PML in transplant recipients or patients with multiple sclerosis).
- Representative "pharmaceutically acceptable salts" of brincidofovir include, e.g., water-soluble and water-insoluble salts, such as the acetate, amsonate (4,4-diaminostilbene-2,2-disulfonate), benzenesulfonate, benzonate, bicarbonate, bisulfate, bitartrate, borate, bromide, butyrate, calcium, calcium edetate, camsylate, carbonate, chloride, citrate, clavulariate, dihydrochloride, edetate, edisylate, estolate, esylate, fiunarate, gluceptate, gluconate, glutamate, glycollylarsanilate, hexafluorophosphate, hexylresorcinate, hydrabamine, hydrobromide, hydrochloride, hydroxynaphthoate, iodide, sethionate, lactate, lactobionate,
- solubility of a liquid formulation of the disclosure in a 5% dextrose solution to yield a liquid formulation comprising 10 mg/mL brincidofovir, 100 mM arginine and 5% (w/v) mannitol was 100% for at least 24h after dilution of the liquid formulation. Furthermore, the resulting solution stayed clear and colorless, and no significant shifts in pH were observed.
- lysis of red blood cells can cause local reactions such as cellulitis, phlebitis and can impact organ function.
- the results presented herein demonstrate that the IV formulations of brincidofovir do not cause a hemolytic reaction when administered intravenously.
- Rat and human whole blood (stabilized with K 2 EDTA) were obtained from 4 rats and 1 human donor. Each concentration (0.2, 0.5 and 1.6 mg/mL) of brincidofovir for the rat was mixed separately in a 1:4 ratio with rat whole blood while each concentration (0.2, 0.5 and 1.6 mg/mL) of brincidofovir for the human was mixed separately in a 1:4 ratio with human whole blood. All samples were then incubated for 20 minutes at 37 ⁇ 1°C.
- brincidofovir demonstrated a hemolytic potential effect in rat whole blood that appeared to be concentration dependent with evidence of hemolysis observed at 1.6 mg/mL. However, brincidofovir was found to have no hemolytic potential in human whole blood up to the highest concentration tested corresponding to a final concentration of 0.2, 0.5 and 1.6 mg/mL.
- Reference Example 8 presents a maximum-tolerated Dose and 7-day dose range finding study (DRF) for BCV in rats.
- the results presented detail an acute range finding study in the rat.
- this data can be used to generate information to allow one to rationally set the doses to be administered in further toxicology studies.
- Phase 1 was designed to determine the Maximum Tolerated Dose (MTD) of brincidofovir following intravenous infusion (2-hour) to rats.
- Phase 1 encompassed a single escalating dose arm to assess any acute toxicity (e.g., 'toxic syndrome') that can present in general clinical signs generally within a 48 +/- hour period of exposure to BCV.
- the escalating dose arm can identify any overt signs or symptoms of over-dosage.
- Phase 2 the repeat-dose range- finding (DRF) phase (Phase II), was designed to assess the toxicity of brincidofovir and the plasma toxicokinetic profiles of brincidofovir and one of its metabolites, cidofovir.
- Cidofovir is known to cause nephrotoxicity when administered intravenously to animals and humans.
- Toxicokinetic parameters were evaluated following the first and last dose administration of two dose levels of brincidofovir (1 mg/kg and 15 mg/kg) administered via intravenous (2-hour) infusion on Days 1, 3, and 7.
- Phase 2 of the present study the animals received a short term treatment of the high (15mg/kg) or low (1mg/kg) BCV IV infusion dose (3 doses over the course of 9 days).
- this second phase of the study was used to determine if any potential cumulative toxicity can occur with repeat dosing.
- the second phase also included a toxicokinetic arm to determine the establish IV toxicokinetics following single (the first dose administered) and repeat (the last dose administered) BCV IV infusion dosing.
- Reference Example 10 details a repeat-dose, subchronic study with IV BCV in rats. Without wishing to be bound by theory, this study explores the cumulative biological effects (e.g., clinical, macro and micro) of brincidofovir administered over a range of doses.
- the effects can be qualitative, such as target organs, nature of effect or quantitative, such as plasma or tissue levels at which effects are observed.
- the study can define the toxicity and the potential for recovery or progression.
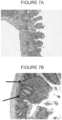
- Figure 7A shows a histogram of histogram of rat intestine after oral administration of brincidofovir
- Figure 7B shows a histogram of rat intestine after IV administration of brincidofovir.
- IV administration of brincidofovir is more well-tolerated in the intestine.
- brincidofovir was administered twice weekly for 28 days via 2-hour intravenous infusion to Sprague-Dawley CD ® rats (15/sex/group) at 0 (2X Sodium Phosphate Buffer Solution), 1, 4 or 15 mg/kg/dose. Up to 5 animals/sex/group were held for a 14-day post-dosing recovery.
- Brincidofovir-related findings were present in the male reproductive tract (testicular germ cell depletion, luminal cell debris in the epididymides and increased epithelial apoptosis in the seminal vesicles) and intestinal tract (single cell necrosis) at ⁇ 4 mg/kg/dose and sebaceous glands (atrophy) at 15 mg/kg/dose. All brincidofovir-related findings completely recovered with the exception of testicular changes in males at ⁇ 4 mg/kg/dose, which without wishing to be bound by theory would not be expected to fully recover in a 2 week period. In addition, a few animals administered 15 mg/kg/dose had decreased bone marrow cellularity and unilaterally or bilaterally soft and/or small testes and epididymides at the end of recovery.
- the study can provide support for the initiation or continued conduct of clinical studies in humans.
- the study can also be used to establish doses for longer term studies. Without wishing to be bound by theory, this study can also guide parameters such as the number of animals to assess when conducting longer-term studies. This study also contained a toxicokinetic arm following the first and last administered dose.
- [ 14 C]Brincidofovir was administered to pigmented and non-pigmented rats by 2-hour IV infusion or by oral gavage at a dose of 15 mg/kg. Tissue distribution was determined by quantitative whole body autoradiography at time points up to 35-days post-dose.
- tissue radioactive concentrations in small intestinal tissue after IV administration were approximately 1/10 the concentrations in small intestinal tissue after oral administration.
- tissue radioactive exposure was generally higher after IV administration than after oral gavage administration. Peak concentrations of radioactivity in most tissues occurred at 4 to 8 h after oral administration, or at the end of the 2-h IV infusion.
- Tissues with highest concentrations of radioactivity were associated with organs of clearance or elimination, e.g., liver, kidney and small intestine, regardless of route of administration.
- the tissue to plasma ratios (T/P) in these organs were high (>30) and for kidney cortex and liver were similar between the IV and oral routes of administration.
- Tissues with lowest concentrations of radioactivity were brain, spinal cord, skeletal muscle, white adipose tissue and bone. Association of radioactivity in the brain and spinal cord was higher after IV administration ( ⁇ 20% of plasma concentration compared to ⁇ 5% after oral administration). At 35 days post-dose, radioactivity was below the limit of quantification in all tissues except for bone marrow, lymph node, spleen and adrenal gland after IV administration, which were different from those tissues with residual concentrations after oral administration (kidney cortex, liver and small intestine). No evidence of specific association with melanin containing tissues (eye, uvea) was detected.
- single cell necrosis in the small and large intestine were occasionally noted following IV BCV infusion.
- These minor and reversible GI findings are explained by the lower concentrations of radioactivity seen in intestinal tissue following IV infusion of [ 14 C]brincidofovir. Further, the GI findings did not result in any dose-limiting GI toxicities (i.e., gastropathy, enteropathy or enteritis). Accordingly, the present disclosure provides IV formulations of BCV and methods of IV BCV administration that can be used to mitigate BCV-associated GI disturbances.
- the C max of [ 14 C]brincidofovir total radioactivity in plasma after a 2-h IV infusion administration to male SD rats at 15 mg/kg (Group 2) was 10.3 ⁇ g equiv/mL, which occurred at a T max of 2 h (i.e., end of infusion), and the concentration decreased to 0.045 ⁇ g equiv/mL at 72 h post-dose.
- the AUC last of [ 14 C]brincidofovir total radioactivity was 64.4 ⁇ g equiv ⁇ h/mL, and the t 1/2 was 13.0 h.
- [ 14 C]Brincidofovir-derived radioactivity was well distributed into most tissues of albino and pigmented male rats after a 2-h IV infusion at 15 mg/kg, and most tissues had concentrations that were slightly higher than plasma, in particular, excretory and alimentary canal tissues, which were much higher than plasma (tissue AUC all :plasma ratio > 1.9).
- the C max of [ 14 C]brincidofovir-derived radioactivity in most tissues were found at 2 h post-dose (i.e., end of infusion) when most of the tissues had concentrations that were between 1.0 and 6.0 ⁇ g equiv/g.
- the tissues of albino and pigmented male rats with the highest concentrations (> 200 ug equiv/g) at the respective T max after a 2-h IV infusion at 15 mg/kg were observed in liver, kidney cortex, small intestine, kidney medulla, and urinary bladder.
- the tissues with the lowest concentrations ( ⁇ 1.0 ⁇ g equiv/g) at their respective T max were: brain, spinal cord, white adipose, bone, skeletal muscle, and eye lens.
- the tissues with the longest t 1/2 were spleen (378 h), lymph node (345 h), skin non-pigmented (310 h), and bone marrow (276 h).
- the t 1/2 for tissues with quantifiable concentrations at 840 h ranged from 254 h (adrenal gland) to 378 h (spleen).
- the C max of [ 14 C]brincidofovir total radioactivity in plasma after PO administration to male LE rats at 15 mg/kg was 1.5 ⁇ g equiv/mL at a T max of 8 h, and the concentration decreased to 0.180 ⁇ g equiv/mL at 24 h post-dose.
- the AUC last of [ 14 C]brincidofovir total radioactivity was 21.0 ⁇ g equiv ⁇ h/mL, and the t 1/2 was not able to be determined due to insufficient data points.
- [ 14 C]brincidofovir-derived radioactivity was well distributed into most tissues of pigmented and non-pigmented male rats after a PO administration at 15 mg/kg, and most tissues had concentrations that were slightly higher plasma, especially for excretory and alimentary canal tissues, which were much higher (tissue AUC all :plasma ratio > 4.1).
- the C max of [ 14 C]brincidofovir-derived radioactivity in most tissues were found at 8 h post-dose (22 of 38 tissues) when most of the tissues had concentrations that were between 0.7 and 17.8 ⁇ g equiv/g.
- the tissues of pigmented male rats with the highest concentrations (> 3.3 ⁇ g equiv/g) at the respective T max after a PO dose at 15 mg/kg were observed in: small intestine, liver kidney cortex, stomach (gastric mucosa), kidney medulla, cecum, esophagus, large intestine.
- the tissues with the lowest concentrations ( ⁇ 1.0 ⁇ g equiv/g) at their respective T max were: spinal cord, brain, bone, white adipose, and eye lens.
- radioactivity was still present in kidney cortex, liver, and small intestine, but was approaching the LLOQ.
- the t 1/2 for plasma was approximately 5 h.
- the t 1/2 for all tissues ranged from 37.2 h for esophagus to 234 h for adipose (brown).
- the tissues with the longest t 1/2 were adipose brown (234 h), spleen (115 h), pituitary gland (106 h), and lung (93 h).
- the only tissue with a reliable t 1/2 and quantifiable concentrations at 840 h was small intestine at 98.1 h.
- the AUC all blood to plasma ratio ranged between 1.1 and 1.4.
- the blood to plasma ratio ranged from 0.64 to 1.5 with a median value of 1.00.
- tissue with highest concentrations of radioactivity were associated with excretory organs (i.e., liver, kidney, and intestine).
- the tissue to plasma ratios were high (>30) for each of these tissues, and in kidney cortex and liver the tissue/plasma ratios were similar between the IV and oral routes of administration.
- tissue with the highest concentrations, ranked from highest to lowest, were liver, kidney cortex, small intestine, and kidney medulla for IV administration, and small intestine, liver, kidney cortex, kidney medulla, and cecum for oral administration.
- the tissues with residual drug after 840 hours were the adrenal glands, spleen, lymph nodes and bone marrow for IV administration, and small intestine, liver, and kidney cortex for oral administration.
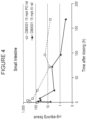
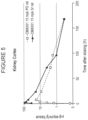
- lower dose of BCV administered intravenously can provide similar plasma concentrations similar to those observed using oral administration at higher doses. Accordingly, treatment of a viral infection in a subject in need thereof can be provided using a lower dose of BCV than necessary with oral administration.
- brincidofovir was administered to healthy subjects both orally and intravenously. It was found that IV brincidofovir administration at 10 mg provided similar exposure as orally administered brincidofovir at 100 mg. Accordingly, the present disclosure teaches administration of brincidofovir intravenously.
- no drug-related adverse events e.g., no gastrointestinal events
- no graded lab abnormalities e.g., no hemolytic toxicity and no kidney toxicity
- the vehicles were clear, colorless solutions. Precipitation was observed for vehicles #11 and #12, and vehicle #29 was a clear light yellow solution. Formulations #11 and #12 inherited precipitation from their vehicles. Formulations #18, #30, #31, and #32 were observed with precipitation on day 1 after preparation. Formulations were stored at 2-8°C from day 2 onwards, and the appearance was monitored over 12 days.
- Vehicle #11 and #12 were found to form precipitate upon preparation of the formulation (i.e, addition of brincidofovir).
- Formulations with a low pH formed precipitate in the presence of solubilizing excipients such as Cremophor ® , PEG 300, polysorbate 80, and ethanol (formulation #1, #6, #18, and #22), while formulations with the same composition, but higher pH (formulation #2, #7, #19, and #24) maintained the ability to solubilize brincidofovir (Table 1).
- solubilizing excipients such as Cremophor ® , PEG 300, polysorbate 80, and ethanol
- Table 3 Summary of brincidofovir solubility and filterability assessment.
- the buffer in all formulations was 100 mM Na phosphate. Form. # Composition Target pH Measured pH Volume filtered ( ⁇ L) Ease of filtration Observed c(BCV) (mg/mL) Tonicifier Excipient Vehicle BCV-saturated filtrate At solubility equilibrium Post-filtration 33 Dextrose, 68.8 mM - 8.0 8.1 6.9 900 Easy 27 27 34 NaCl, 66.5 mM Cremophor ® , 10% 7.5 7.6 6.5 900 Easy 30 31 35 NaCl, 66.5 mM Cremophor ® , 5% 7.5 7.6 6.6 900 Easy 27 29 36 Dextrose, 68.8 mM Cremophor ® , 5% 7.5 7.6 6.7 900 Easy 26 26 37 NaCl, 66.5 mM Cremophor ® , 2% 7.5 7.6 6.7 900 Easy 25 26 38 NaCl,
- the relatively high brincidofovir concentrations observed in equilibrium solubility testing led to a significant shift of the vehicle pH. Filtration of the formulations saturated with brincidofovir through the selected syringe filters did not reveal any issues regarding the ease of filtration, loss of brincidofovir, or introduction of impurities.
- the testing solutions were filtered (5 mL filter pass) through a syringe filter (25 mm, 0.2 ⁇ m PES membrane). The ease of the filtration was observed and the pH as well as brincidofovir recovery (HPLC assay) were recorded at the pre- and post-filtration stage. No significant change in pH, loss of brincidofovir, or introduction of impurities was observed (Table 4).
- Table 4 Filterability assessment of brincidofovir in the formulation 57 vehicle c(BCV) prepared to Measured pH Observed c(BCV) (mg/mL) Pre filtration Post filtration Pre filtration Post filtration 20 mg/mL 8.0 8.0 23 26 10 mg/mL 8.1 8.1 13 12 0.5 mg/mL 8.0 8.1 0.8 0.9
- a brincidofovir formulation containing dextrose as tonicifier was applied in stability study I as well as in the infusion vehicle compatibility assessment.
- the outline of the corresponding formulation preparation is as follows:
- Tonicifier-free formulation (w / o dextrose)
- a brincidofovir formulation lacking dextrose was applied in stability study II, as well as in the adsorption assessment, and the majority of experiments associated with material compatibility assessments.
- the tonicifier-free formulation was prepared as follows:
- the stability testing results (accelerated conditions), i.e., the changes of pH and trends of brincidofovir recovery over the course of the stability study are summarized in Table 8 and Table 9 for the formulations at 10 mg/mL and 15 mg/mL respectively.
- the accelerated stability study with strong biphasic rate trends did not allow for an Arrhenius analysis and calculation of a brincidofovir half-life or extrapolation to degradation rates at typical storage conditions.
- the test results on the vehicle controls in the accelerated stability study (75 °C station only) are summarized in Table 5.
- Table 10 Liquid particle counting results of the 10 and 15 mg/mL brincidofovir formulations (Study I) Formulation Time point (day) Stability station temperature (°C) 2-8 25 10 ⁇ m particle count 25 ⁇ m particle count 10 ⁇ m particle count 25 ⁇ m particle count 10 mg/mL brincidofovir formulation 0 1 0 1 0 14 11 1 7 0 28 4 0 5 0 15 mg/mL brincidofovir formulation 0 0 0 0 0 14 7 1 4 0 28 3 1 3 0
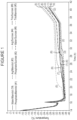
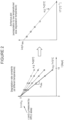
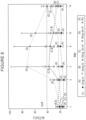
- the obtained recovery data were applied to determine the degradation rate at the different temperatures via an Arrhenius analysis, i.e., by logarithmically plotting the brincidofovir recovery as a function of time, and determining the rate constant through a linear fit.
- the half-life for the dextrose-free 15 mg/mL brincidofovir formulation was so determined to 729 days and 295 days at stability station temperatures of 5°C and 25°C respectively.
- the Arrhenius analysis is illustrated in Figure 2 .
- Table 13 Physical degradation and benchmark stability study results of the 15 mg/mL brincidofovir formulation (Study II) Sample Appearance Measured pH Observed c(BCV) 1 (mg/mL) BCV recovery 1,3 (%) BCV purity (%) Station temp. (°C) Time point (day) 2-8 0 Clear, Colorless 8.0 15.4 100 99 14 Clear, Colorless 8.0 14.9 97 100 28 Clear, Colorless 8.1 15.2 99 99 25 0 Clear, Colorless 8.0 15.4 100 99 14 Clear, Colorless 8.0 14.9 97 99 28 Clear, Colorless 8.0 15.2 99 99 1 Average value of three (3) replicates.
- BCV recovery c(BCV) Day n /c(BCV) Day 0 ⁇ 100%. It was defined as 100% at the initial time point.
- Table 14 Physical degradation and benchmark stability study results of the vehicle control (Study II) Sample conditions Appearance Measured pH Station temp. (°C) time point (day) n.a. 1 0 Clear, colorless 8.0 2-8 14 Clear, colorless 8.1 28 Clear, colorless 8.1 25 14 Clear, colorless 8.1 28 Clear, colorless 8.0 1 Not applicable.
- the formulation sample from one serum vial (5.0 mL filling) was sonicated for 1 min before decrimping of the vial.
- the tonicifier-free sample was subjected to liquid particle counting as described above for the tonicifier containing formulations.
- the Results of the analysis are summarized in Table 15.
- Table 15 Liquid particle counting results of the tonicifier-free 15 mg/mL brincidofovir formulation and vehicle control (Study II) Solution Time point (day) Stability station temperature (°C) 2-8 25 10 ⁇ m particle count 25 ⁇ m particle count 10 ⁇ m particle count 25 ⁇ m particle count 15 mg/mL brincidofovir formulation 0 0 0 0 14 80 2 45 0 28 87 0 4 0 Vehicle control 0 0 0 0 0 0 14 0 0 0 0 28 0 0 0 0 0 0 0 0 0 0
- BCV recovery c(BCV) Day n/ c(BCV) Day 0 ⁇ 100%. It was defined as 100% at the initial time point. BCV recovery was defined as 100.00% on the initial time point for samples with and without treatment. 3 Not applicable for samples without treatment. 4 The sample for the initial time point was not subjected to any conditions. Table 17: Test results of the 0.2 mg/mL brincidofovir formulation in adsorption assessment Sample conditions Appearance Measured pH Observed c(BCV) a (mg/mL) BCV Recovery a, b (%) BCV purity (%) Station temp.
- BCV recovery c(BCV) Day n /c(BCV) Day 0 ⁇ 100%. It was defined as 100% at the initial time point. BCV recovery was defined as 100.00% on the initial time point for samples with and without treatment. c The sample for the initial time point was not subjected to any conditions.
- An array of materials was tested for compatibility with the formulation. This includes testing materials from the manufacturing stage, pre-clinical toxicology as well as clinical tests.
- the applied compatibility tests evaluate 1) a potential loss of brincidofovir by adsorption or precipitation (appearance, brincidofovir recovery by HPLC) and 2) a shift in pH that could compromise stability.
- Materials that were tested include the infusion vehicle, filters for sterilization, product vials and stoppers, infusion systems for testing animals (rats) and infusion bags and IV systems for clinical applications.
- the diluted solutions were stored at ambient conditions, and samples were collected at initially at the beginning of the experiment, and after 2 h, 8 h, and 24 h and evaluated for appearance, pH, and recovery of c(BCV) (via HPLC). No significant changes in appearance, pH, or c(BCV) were observed for the tested solutions over 24 hours at ambient conditions. Detailed results of the study are summarized below (Table 18).
- Table 18 Results of infusion vehicle compatibility assessment c(BCV) in infusion vehicle (mg/mL) Time point (h) Appearance Measured pH Observed c(BCV) a (mg/mL) BCV Recovery a,b (%) 0.5 0 Clear, colorless 8.2 0.51 100 2 Clear, colorless 8.3 0.51 100 8 Clear, colorless 8.2 0.51 100 24 Clear, colorless 8.2 0.49 99 1.0 0 Clear, colorless 8.2 1.0 100 2 Clear, colorless 8.2 1.0 99 8 Clear, colorless 8.2 1.0 99 24 Clear, colorless 8.2 1.0 100 a Average value of the three (3) replicates.
- BCV recovery c(BCV)Hour n /c(BCV)Hour 0 ⁇ 100%. It was defined as 100% for samples at initial time point.
- Formulations of the disclosure were evaluated for sterilization filter compatibility. Aliquots of a testing brincidofovir formulation were filtered through the corresponding syringe filters as follows:
- Formulations of the disclosure were evaluated for sterilization filter compatibility.
- the vials were stoppered with West NovaPure ® stoppers and crimped with Afton Ready-To-Fill ® sterilized seals, and stored for 6 hours at ambient conditions in upright and inverted orientations. Samples of the filling solution were collected before filling and after 6 hours of storage under the respective condition. The collected samples were assessed for their appearance, pH, and c(BCV).
- the tested formulation strengths after dilution into the infusion bag were approximately:
- the infusion bags were then stored at ambient conditions, and samples were collected from the infusion bags at the time points (t 0 , t 1h , t 8h , and t 24h ) for assessments of appearance, pH, and c(BCV).
- the 5% dextrose solution was removed from a separate infusion bag, and external dilutions (standard laboratory glassware) of the testing formulation with the 5% dextrose solution were performed applying identical dilution factors.
- the testing procedure can be summarized as follows:
- Pre-lyophilization formulations were prepared as set forth in Table 24, below and subjected to the lyophilization process.
- Table 24 Pre-lyophilization Formulations.
- the glass transition temperature T g' (amorphous), the eutectic melting point T eu (crystalline), the onset temperature of melting T melt , onset, and the freezing temperature T freeze of the formulations 1-8 of Table 27 were determined by differential scanning calorimetry (DSC) analysis. For this, 5 ⁇ L of each formulation was dispensed into an aluminum sample pan and hermetically sealed. DSC scans were performed by down and up scanning in the temperature interval of +25 °C to -65 °C to +25 °C with a ramp rate of 5 °C/min. The tested formulations displayed a sharp freezing point and a well-defined melting transition. The results of the DSC study are summarized in Table 25. Table 25: Results of the DSC analysis Form.
- a conservative lyophilization cycle was applied for lyophilization of brincidofovir formulations including parameters informed by the DSC analysis (see Table 28).
- the cycle consisted of the following steps: freezing, annealing, primary drying and a secondary drying.
- the set point temperature, ramp rate, step time and load time for each step in an exemplary lyophilization cycle are summarized in Table 26.
- Sample vials (5 mL vial size, 1 mL filling volume) were processed under best clean conditions in a biosafety cabinet. For each formulation, nine samples were prepared. For each formulation condition, one sample vial was equipped with a product probe to monitor the product temperature (T product ) along with the shelf temperature of the lyophilizer (T shelf ) throughout the lyophilization cycle. The end of the primary drying was determined as the time when T product ⁇ T shelf is observed. At the end of the lyophilization cycle, the sample vials were back-filled nitrogen (N 2 ), stoppered and removed from the lyophilizer to be inspected and analyzed.
- N 2 back-filled nitrogen
- the mannitol based formulations (Formulations 1, 3, 5 and 7) yielded a more compact and uniform lyophilization cake, and the sucrose based formulations (Formulations 2, 4, 6 and 8) revealed partial cake collapses as well as an increased melt-back.
- Lyophilization product vials were weighed before and after lyophilization in order to determine the reconstitution solution volume.
- the lyophilized products were reconstituted with DI water. After addition of the solvent the vials were gently swirled and the reconstitution appearance as well as the reconstitution time were recorded.
- the reconstituted product was further analyzed for its pH and brincidofovir recovery (determined via HPLC).
- the described parameters were complemented by recording the intensity of foaming as well as the foam dissipation time.
- the results of the reconstitution assessment for Formulations 1-8 are summarized in Table 30.
- Formulation 3 was found to lack foaming upon reconstitution, and Formulation 7 was found to be able to be reconstituted with different buffers or infusion vehicles.
- Table 28 A project overview capturing the purpose, results and the outcome of each activity is summarized in Table 28.
- the details of the lyophilization cycle parameters for certain lyophilization runs during process development can be found in Table 29.
- Table 29 Lyophilization cycle parameters (Cycles #2, #3, #5, #6) Cycle #2 Cycle #3 Cycle #5 Cycle #6 Step Type Ramp rate [°C/h] T shelf [°C] Time [min] Total Time [h] Ramp rate [°C/h] T shelf [°C] Time [min] Total Time [h] Ramp rate [°C/h] T shelf [°C] Time [min] Total Time [h] Ramp rate [°C/h] T shelf [°C] Time [min] Total Time [h] Ramp rate [°C/h] T shelf [°C] Time [min] Total Time [h] Loading Hold N/A 5 0 0 N/A 5 0 0 N/A 5 0 0 N/A 5 0 0 Freeze/ Anneal Hold 0 5 60
- liquid fill solutions were prepared and evaluated as outlined below.
- liquid fill solutions were prepared comprising:
- liquid fill solutions were prepared comprising:
- the applied reconstitution volumes were determined by gravimetric analysis of the product vials before and after lyophilization for each of the formulations. In case of cycles #1 and #2 the specific measured volumes were applied. For reconstitution of lyophilized products of cycle #5 an average reconstitution volume was applied to all formulations. For the lyophilized product of lyophilization cycle #7, the liquid fill volume was scaled in accordance to the previously determined difference between liquid fill and reconstitution volume.
- Formulations 1, 3, and 3a The stability of Formulations 1, 3, and 3a was assessed at 25 °C and 60 °C by evaluating appearance and pH of each formulation, as well as recovery of c(BCV), at the time of reconstitution (t 0 ), after 2 days (t 2 days ), 7 days (t 7 days ), 10 days (t 10 days ), and 14 days (t 14 days ). In addition, the foaming intensity was evaluated at 10, 20 and 30 minutes after reconstitution.
- Table 32 Stability study results of the formulation 3 (200 mM Arginine) Conditions Average Cake appear. Average Recon. Appear. Average Recon. Time [s] Average Foam. Time [min]* pH Observed c(BCV) a [mg/mL] BCV Recovery b [%] BCV Purity [%] Station temp.
- Formulation 3a was compounded according to the following procedure: The pH of a 1M buffer solution of arginine in DI water was adjusted to 8 using Hydrochloric acid (35-37%) under pH-control before Q.S. Then Mannitol was added to the buffer solution followed by BCV. The pH of the resulting solution was adjusted to 8 using sodium hydroxide. DI water was used to Q.S. the solution in separate volumetric flasks. The two solutions were then mixed and sterile filtered to yield the desired Formulation 3a. The procedure yielded Formulation 3a with an observed c(BCV) of 9.9 mg/mL.
- the liquid fill solution for the lyophilized Formulation 3a was tested for compatibility with infusion vehicles as well as a series of materials from the manufacturing and clinical stage.
- the results of the infusion vehicle compatibility testing are summarized in Table 38. No precipitation, pH shift or significant loss in recovery of brincidofovir were observed at the end of the study.
- the appearance, pH, and brincidofovir recovery (determined via HPLC) were evaluated at the time of preparing the test solution (t 0 ), and after 2 h (t 2h ), 8 h (t 8h ), and 24 h (t 24h ) Table 35: Results of the infusion vehicle compatibility assessment.
- a liquid formulation comprising arginine, mannitol, and brincidofovir at a concentration of 10 mg/mL was kept in a 10 mL glass vial, stoppered (rubber stopper or 20 mm serum stopper) and sealed (aluminum seals), and kept at about 5°C or about 25°C for up to 12 months.
- the appearance, pH and brincidofovir content of the stored formulation were monitored along with impurities and particulate matter, at various time intervals (i.e., after 2 weeks, after 1 month, after 2 months, after 3 months, after 6 months, after 9 months and after 12 months).
- Impurities were evaluated via HPLC and are identified herein by their relative retention time. The same experiment was repeated for a solution of the lyophilized powder, comprising 10mg/mL of brincidofovir.
- a 20 mL glass vial with a 20 mm rubber stopper was used for the lyophilized formulations. Furthermore, the appearance of the lyophilized powder (i.e., the lyophilization cake) was recorded.
- White cake in the bottom of the bottle White porous uniform structure with some solid deposits above the cake in the vial.
- One cake at -20 °C, both cakes at 5 °C, and one cake at 40 °C, are removable from the bottom of the vial.
- the vials had some cake particulate s on the stoppers of the vials.
- the vials had some cake particulates on the stoppers of the vials.
- White uniform cake with some deposited material above White porous uniform structure with some solid deposits above the cake on the vial.
- White cake in the bottom of the bottle White porous uniform structure with some solid deposits above the cake on the vial.
- White uniform cake with some deposited material above White uniform cake with deposited material above on the wall.
- White cake in the bottom of the bottle One cake at - 20 °C, both cakes at 5 °C, and one cake at 40 °C are removable from the bottom of the vial.
- the vials had some cake particulates on the stoppers of the vials.
- Each concentration of test item for the rat was mixed separately in a 1:4 ratio with rat whole blood while each concentration of test item for the human was mixed separately in a 1:4 ratio with human whole blood.
- These samples plus control samples [vehicle control (vehicle + whole blood, 1 for rat and 1 for humans), positive control (1% Saponin + whole blood), untreated whole blood control and negative control (saline + whole blood) were analyzed for hemolysis (supernatant hemoglobin concentration).
- the rat and human whole blood samples were incubated in test or control items at 37 ⁇ 1°C for 20 minutes and then immediately (within 2 minutes) centrifuged at 3500 ⁇ 100 rpm (2740 g ) at room temperature for 5-10 minutes.
- the supernatant was extracted and subjected to a hemoglobin analysis using the cyanmethemoglobin method employed on the Siemens Advia 120 hematology analyzer. If the test item has a potential for causing hemolysis, then hemoglobin released from lysed red blood cells into the plasma supernatant can be quantified via the reaction of heme iron in solution being oxidized from a ferrous to a ferric state in the presence of potassium cyanide.
- the reaction results in the formation of methemoglobin, which then combines with cyanide to form a stable cyanmethemoglobin.
- cyanmethemoglobin When measured spectrophotometrically at 546 nm the absorbance of cyanmethemoglobin follows Beer's Law and is directly proportional to the concentration of hemoglobin released into solution.
- the formulated test item at each concentration assessed was mixed in a 1:4 ratio with saline and then directly analyzed to ensure that the test item formulations did not interfere with the Siemens Advia measurement of hemoglobin.
- Table 43 Phase 1, Brincidofovir in Rat Blood Tube Rat Blood* Test Item (BCV) a Vehicle b Positive Control c Saline d 1 e + + 0.2, 0.5 and 1.6 mg/mL - - - 2 f - + 0.2, 0.5 and 1.6 mg/mL - - + 3 g + - + - - 4 h + - - + - 5 i + - - - - 6 i + - - - + *1.0 mL added to Tubes 1 (separate tube for each concentration) and Tubes 3-6 a 250 ⁇ L added to Tubes 1-2 (separate tube for each concentration) b 250 ⁇ L added to Tube 3 c 250 ⁇ L added to Tube 4 d 1.0 mL added to Tube 2; 250 ⁇ L added to Tube 6 e Test item assay for hemolysis: Tube 1A contained 0.2 mg/mL Tube 1B contained 0.5 mg/
- Table 44 Phase 2, Brincidofovir in Human Blood Tube Human Blood* Test Item (BCV) a Vehicle b Positive Control c Saline d 1 e + + 0.2, 0.5 and 1.6 mg/mL - - - 2 f - + 0.2, 0.5 and 1.6 mg/mL - - + 3 g + - + - - 4 h + - - + - 5 i + - - - - 6 j + - - - + *1.0 mL added to Tubes 1 (separate tube for each concentration) and Tubes 3-6 a 250 ⁇ L added to Tubes 1-2 (separate tube for each concentration) b 250 ⁇ L added to Tube 3 c 250 ⁇ L added to Tube 4 d 1.0 mL added to Tube 2; 250 ⁇ L added to Tube 6 e Test item assay for hemolysis: Tube 1A contained 0.2 mg/mL Tube 1B contained 0.5 mg/mL Tube 1C contained 1.6 mg/m
- the brincidofovir injectable liquid stock formulation is stable for 28 days under refrigerated conditions (2 to 8°C). Brincidofovir injectable liquid stock formulation was diluted with 5% dextrose to yield the desired dose concentration.
- the amphipathic glycoside Saponin which complexes with cholesterol to form pores in cell membrane bilayers and cause red blood cell lysis, was utilized for the positive hemolytic control.
- the 1% Saponin-treated positive controls for rat and human whole blood hemolysis generated a mean hemoglobin concentration of 3.9 and 11.0 g/dL in the supernatant, respectively (Tables 47, 48, 49 and 50). These values met the protocol defined assay acceptability criterion of hemoglobin concentration > (Negative Control + 0.5 g/dL).
- Parameters evaluated during Phase 1 were: viability and clinical observations.
- Sprague-Dawley CD ® rats (2/sex/dosing interval) were dosed with brincidofovir via 2-hour IV infusion once at 2, 4, 10 or 15 mg/kg.
- the maximum feasible dose (MFD) was limited to 15mg/kg because of increased hemolytic potential when the concentration of brincidofovir exceeds 1 mg/mL in the dosing solution.
- the dose volume was 10 mL/kg/hr for all dosing intervals. Each dose administration was followed by a 2-3 day observation period. At the end of the Phase 1 treatment period, all animals were euthanized and discarded without macroscopic examination.
- Parameters evaluated during Phase 2 were: viability, clinical observations, body weights, food consumption, hematology (termination of dosing), clinical chemistry (termination of dosing) and macroscopic observations.
- Phase 2 Sprague-Dawley CD ® rats (5/sex/group) were dosed with brincidofovir via 2-hour IV infusion with 0 [2X sodium phosphate buffer solution (400 mM, pH 8.0 ⁇ 0.04)], 1 or 15 mg/kg on Days 1, 4 and 7. The dose volume was 10 mL/kg/hr for all groups. At the end of the Phase 2 treatment period, all animals were euthanized and necropsied. Phase 2 satellite animals (3/sex/Group 1 and 6/sex/Group 2-3) were similarly dosed and blood samples collected on Days 1 and 7 for toxicokinetic analysis of brincidofovir and one of its metabolites, cidofovir.
- the M/P ratio is calculated by first converting the relevant parameters to molar units and then dividing the molar exposure value of the metabolite by the molar exposure value of the parent compound.
- MTD Maximum tolerated dose IV
- Brincidofovir-related hematologic findings were limited to slight decreases in reticulocytes in males and females administered 15 mg/kg brincidofovir (-33% and -30% controls, respectively; statistically significant in males only), associated with increases in mean cell hemoglobin concentration (MCHC) in males (+2.1% controls, statistically significant). Decreases red cell mass (hemoglobin, hematocrit, red blood cells) were negligible (to -4.2% controls) at the end of the 7-day dosing phase
- Phase 1 each animal was administered a single dose of brincidofovir via 2-hour intravenous infusion. At each dose interval, an escalated dose was administered to na ⁇ ve animals to determine the maximum tolerated dose (MTD). MTD data were used to select doses for Phase 2.
- Phase 2 the selected doses were administered via 2-hour intravenous infusion on Days 1, 4 and 7 to evaluate the toxicity of repeated doses of the brincidofovir and to aid in the selection of doses for subsequent toxicity studies.
- a seven-day study can be appropriate for selecting doses for subsequent repeat dose GLP toxicity studies.
- the number of animals (2/sex/dose interval) in Phase 1 (MTD) was the minimum number that would be required to determine the maximum tolerated dose in male and female rats.
- Four dose levels of the brincidofovir were expected to be sufficient to determine the maximum tolerated dose.
- new animals were used at each dose level to eliminate possible additive effects of repeat dosing that could confound determination of a maximum tolerated single dose level.
- the number of main study animals (5/sex/group) in Phase 2 (DRF) was the minimum number that would control for the expected variability among animals.
- the negative control group and the two brincidofovir-treated groups receiving a low and high multiple of the proposed human dose were considered the minimum number of groups necessary to establish a baseline and provide a range of effects and allow for extrapolation of results for additional repeat dose studies.
- the starting dose for Phase 1 of this study was 2 mg/kg.
- the low and high doses for Phase 2 of this study (1 and 15 mg/kg) were selected based on the study results of Phase 1 of the present study. In some embodiments, the low and high doses were selected by the lack of clinical signs during the post-administration observation period in animals that were administered 15 mg/kg during Phase 1 of the present study.
- Phase 1 For Phase 1 (MTD), up to four dose levels of brincidofovir were administered as escalating single doses in na ⁇ ve male and female rats via intravenous infusion (2-hour). Each dose administration was followed by a 2-3 day observation period. Each subsequent dose level was increased and administered to naive animals based on the response to the preceding doses until the maximum tolerated dose (MTD) was identified, or until the maximum feasible dose (MFD) based on prior evidence of hemolysis of 15 mg/kg was achieved.
- MTD maximum tolerated dose
- MFD maximum feasible dose
- Table 51 Phase 1 (MTD) Study Consisted of 4 Dosing Intervals Dose Interval (Group) Treatment Dose (mg/kg) a Number of animals Concentration (mg/mL) Volume Dose (mL/kg/hr) Male Female 1 BCV 2 2 2 0.1 10 2 BCV 4 2 2 0.2 10 3 BCV 10 2 2 0.5 10 4 BCV 15 2 2 0.75 10 a Doses represent active ingredient
- Phase 2 the test and control articles were administered, via intravenous 2-hour IV infusion to rats on Days 1, 4, and 7.
- Table 52 Phase 2 Study: 1 Control and 2 Treated Groups Group Treatment Dose (mg/kg) a Number of animals Concentration (mg/mL) Volume Dose (mL/kg/hr) Main study Satellite study b Male Female Male Female 1 Control 0 5 5 3 3 0 10 2 BCV 1 5 5 6 6 0.05 10 3 BCV 15 5 5 6 6 0.75 10 a Doses represent active ingredient b Satellite animals used for toxicokinetic blood sampling only.
- a vehicle solution of 2X sodium phosphate buffer solution (400 mM, pH 8.0 ⁇ 0.04) was prepared by mixing the appropriate amounts of monobasic sodium phosphate solution (400 mM) and dibasic sodium phosphate solution (400 mM). The pH of the solution was adjusted with monobasic sodium phosphate solution (400 mM), when necessary. The solution was filtered through a 0.22 ⁇ m Millex ® -GP filter under a laminar flow hood into a sterile vessel.
- the vehicle (control article) was stored refrigerated 2-8°C. Fresh vehicle solution was prepared once prior to each phase, and used within one month of preparation.
- a brincidofovir stock of 15 mg/mL was perpared by mixing the appropriate amount of brincidofovir with 2X sodium phosphate buffer solution, sterile water for injection, USP, and 1N sodium hydroxide (NaOH). The solution was filtered through a 0.22 ⁇ m Millex ® -GP filter under a laminar flow hood into a sterile vessel.
- Dose formulations for Phase 1 and 2 were prepared by diluting the appropriate amounts of the brincidofovir stock (15 mg/mL) or of the stock solution vehicle (2X sodium phosphate buffer solution) with the appropriate amounts of 5% dextrose for injection, USP, into a sterile vial under a laminar flow hood and inverting 10 times to mix. During Phase 1 and 2, fresh dose formulations were prepared on each dosing day and were stored refrigerated 2-8°C and protected from light when not in use.
- Intravenous infusion over 2-hours Treated at constant doses in 20 mL/kg/2hours.
- Catheters for infusion were implanted approximately 1-2 weeks prior to dose administration. All animals, including the spares, were surgically implanted with a catheter.
- the surgical site was prepared as per Testing Facility's SOP for aseptic, recovery surgical procedures. Animals received analgesics pre-emptively (flunixin meglumine (USP) 2 mg/kg, subcutaneously).
- analgesics pre-emptively (flunixin meglumine (USP) 2 mg/kg, subcutaneously).
- the animals were placed in jackets and the implanted catheters were attached to pins with capped septum connectors. The catheters were locked with taurolidine citrate locking solution. Each animal received enrofloxacin 5.0 mg/kg intramuscularly on the day of surgery.
- Implanted femoral vein catheters were assessed for patency as per Testing Facility's SOP prior to placing animals on study.
- the individual animal concentrations were calculated from the most recently recorded scheduled bodyweight.
- each animal received a single dose administered via intravenous infusion (2-hours), followed by a 2-3 day observation period after each dose interval.
- each animal received brincidofovir administrations via intravenous infusion (2-hours) on Days 1, 4 and 7.
- Animals were maintained on sterile saline at a rate of 0.5 mL/hour between doses.
- Catheters were tied off after the completion of dose administration on Day 7 (a knot was placed in the catheter and the catheter was receded under the skin) and jackets were removed.
- the lock solution was withdrawn from each animal's implanted catheter (if possible) and the catheter was flushed with saline before connecting to a tether and infusion dosing set. After connecting the animals' catheters, the animals were infused with sterile saline (0.9% NaCl, USP) at a rate of 0.5 mL/hr by a calibrated Medfusion syringe pump until dose administration on Day 1.
- a saline flush was infused to deliver the brincidofovir in the infusion lines and to ensure the delivery of a complete dose (an additional ⁇ 0.5 to 1 mL volume, at the same rate as the brincidofovir, was administered to flush the catheter line).
- Plasma was separated by centrifugation (10 minutes at approximately 2000 g, at approximately 2-8°C). Approximately 0.10 mL of plasma was transferred into a single cryotube appropriately labeled with study number, animal number, time point, date of sampling and sample type. Remaining plasma was transferred into a second cryotube and retained as a backup sample. Plasma frozen at approximately -80 ⁇ 10°C within approximately 2 hours after collection of each blood sample until analysis. Animals were euthanized (CO 2 inhalation) after the final blood collection.
- All plasma sample tubes were stored frozen (-80 ⁇ 10°C) and shipped (frozen, on dry ice) to Pyxant Labs, Colorado Springs, Colorado for analysis. Samples were shipped within 1 month of collection.
- TK parameters were estimated using mean plasma concentrations of brincidofovir and cidofovir derived from the composite blood sampling design using Phoenix WinNonLin (V 6.3).
- Phase 1 Signs of poor health or toxic or pharmacologic effects (e.g., abnormalities in general condition, appearance, activity, behavior, respiration, etc.) observed during infusion period were recorded.
- toxic or pharmacologic effects e.g., abnormalities in general condition, appearance, activity, behavior, respiration, etc.
- Phase 1 Animals were removed from their cages and weighed twice pretest and prior to each dose.
- Phase 2 Animals were removed from their cages and weighed twice pretest, prior to each dose and following the last dose administered during the afternoon of Day 7. Terminal, fasted body weights were obtained just prior to necropsy.
- Hemoglobin concentration HGB
- Hematocrit HCT
- Erythrocyte count RBC
- Platelet count PHT
- Mean corpuscular volume MV
- Mean corpuscular hemoglobin MH
- Mean corpuscular hemoglobin concentration MCHC
- Red cell distribution width RDW
- Total leukocyte count WBC
- Reticulocyte count RETIC
- Differential leukocyte count Manual differential leukocyte counts were performed for verification and absolute values were calculated if necessary
- Neutrophils ANEU
- Lymphocytes ALYM
- Eosinophils AEOS
- Basophils ABASO
- Monocytes AMONO
- Large unstained cells ALUC
- a peripheral blood smear was prepared for each animal at each blood collection interval and was available for confirmation of automated results and/or other evaluations deemed necessary by the Clinical Pathologist.
- Phase 1 All animals were euthanized by exsanguination following carbon dioxide inhalation and discarded without macroscopic examination after the completion of the observation period.
- Phase 2 Main DRF study animals were euthanized by exsanguination following isoflurane inhalation and TK satellite animals via carbon dioxide inhalation.
- the macroscopic examination included examination of the external surface and all orifices; the external surfaces of the brain and spinal cord; the organs and tissues of the cranial, thoracic, abdominal and pelvic cavities and neck; and the remainder of the carcass for the presence
- CS Clotted specimen
- LA Lab accident
- NVIM Not valid due to improbable result
- CLSE Severe platelet clumping noted
- CLSL Slight platelet clumping noted
- NCLP No clumping.
- the following data types were analyzed at each timepoint separately for Phase 2: body weight; body weight change from interval to interval; cumulative body weight change from baseline; food consumption, hematology, and clinical chemistry.
- the parameters to analyze were identified as continuous, discrete or binary. Brincidofovir treated groups were then compared to the control using the following procedures.
- Table 54 summarizes details regarding the study conduct, including but not limited to test animals, study materials, study design, dosing, observations, and results.
- Table 54 Experimental Design Study Summary (Phase 2) Species and Strain: Male and Female [Crl:CD (SD)BR] (Sprague-Dawley derived) Vehicle: 200 mM Sodium Phosphate Buffer, pH 8, Variable dilution with 5% Dextrose Study Design Group Number Dose (mg/kg) Sampling Scheme 1 0 Day 1 and Day 7: 3 animals/sex: 2 hours after the initiation of dose vehicle administration 2 1 Day 1: 3 animals/sex/timepoint: 1, 2, 8, and 24 hours after the initiation of dose administration Day 7: 3 animals/sex/timepoint: Predose, 2, 8, and 24 hours after the initiation of dose administration 3 15 Same as Group 2
- a composite blood sampling design was used such that each rat was sampled twice per sampling day.
- Blood samples were collected according to the scheme shown in Table 54. Blood was collected via tail vein from unanesthetized animals into tubes containing anticoagulant and placed on wet ice in an upright position. Animals were not fasted prior to blood collection. Plasma was separated by centrifugation (for 10 minutes at approximately 2000 g, at approximately 2-8 °C), and transferred into individually labeled cryotubes. All cryotubes containing the collected plasma samples were appropriately labeled as to study number, animal number, time point, date of sampling and sample type. All plasma samples were obtained and frozen at approximately -80 °C ( ⁇ 10 °C) within approximately 2 hours after collection of each blood sample until analysis.
- Rat plasma bioanalysis was conducted by Pyxant Laboratories. Plasma samples were analyzed for concentrations of brincidofovir and cidofovir using a method based upon protein precipitation extraction followed by LC-MS/MS analysis; calibration ranges for brincidofovir and cidofovir were 1.00 - 1500 ng/mL and 5.00 - 750 ng/mL, respectively, (Pyxant study number 3025) for a 50 ⁇ L aliquot of rat plasma. Sample analysis for ISR was not performed as part of this non-GLP study.
- Mean Profile BLQ values for the purposes of NCA, are recorded in Table 63 and Table 64, with the original Mean Profile BLQ result in the column labeled [Mean Concentration] and the imputed values used for NCA analysis in the column labeled [Imputed Mean Concentration].
- Statistical Analysis was limited to descriptive statistical analysis including arithmetic mean, standard deviation, %CV of the arithmetic mean.
- %CV coefficient of variation
- the brincidofovir C max and AUC last values on Day 7 showed a trend toward lower values on Day 7 compared to Day 1 (Day7/Day1 accumulation ratios (AR) of 0.44 to 0.53). Further, no sex differences in brincidofovir TK parameters were observed.
- Bioanalysis was performed on 108 plasma samples collected only during Phase 2 to determine the concentrations of brincidofovir and the cidofovir metabolite, cidofovir.
- the plasma samples were collected at 2 hours following the initiation of dosing on Day 1 and Day 7 (Group 1), or at 1, 2, 8, and 24 hours following the initiation of dosing on Day 1, and prior to administration and at 2, 8, and 24 hours following the initiation of dosing on Day 7 (Groups 2 and 3) and analyzed by LC/MS/MS.
- brincidofovir C max increased in approximate proportion to dose (for female rats), or less than proportionally to dose (for male rats). For a 15-fold increase in dose from 1 mg/kg to 15 mg/kg, C max increased 17.3- to 18.2-fold for females and 9.2- to 18.6-fold for males.
- brincidofovir AUC last increased in approximate proportion (for female rats); for a 15-fold increase in dose, the AUC last increased 14.1- to 16.1-fold. Due to insufficient data points in male rats after 1 mg/kg administration, proportionality of AUC last could not be determined.
- the brincidofovir C max on Days 1 and 7 for a 1 or 15 mg/kg dose were similar (difference within 54%).
- the brincidofovir AUC last for a 1 mg/kg dose could not be compared due to insufficient data points to calculate AUC in males.
- the brincidofovir C max and AUC last values on Day 7 for female animals following twice-weekly dosing of brincidofovir at 1 mg/kg, and for both female and male animals after15 mg/kg, showed a trend toward lower C max and AUC last on Day 7 compared to Day 1 (Day7/Day1 accumulation ratios (AR) of 0.44 to 0.53).
- cidofovir C max generally increased less than proportional to dose. For a 15-fold increase in brincidofovir dose from 1 mg/kg to 15 mg/kg, cidofovir C max increased 2.9- to 4.1-fold for female animals and 5.6- to 16.8-fold for males. On Days 1 and 7, cidofovir AUC last increased less than proportionally to dose for female animals; for a 15-fold increase in brincidofovir dose, cidofovir AUC last increased 9.4- to 16.2-fold. Due to insufficient data points in male rats after 1 mg/kg administration, proportionality of AUC last could not be determined.
- cidofovir C max and AUC last on Day 7 for female animals following twice-weekly dosing of brincidofovir at 1 mg/kg showed a trend toward higher C max and AUC last on Day 7 compared to Day 1 (Day7/Day1 AR ranged from 1.6 to 1.9). However, cidofovir C max and AUC last for both female and male animals administered 15 mg/kg (3 doses), were similar (Day7/Day1 AR ranged from 1.0 to 1.1).
- Red cell mass decreases would be expected to be more pronounced with continued dosing.
- Decreases in reticulocytes were indicative of decreased erythropoiesis in hematopoietic tissues. In the absence of decreases in food consumption or body weight or poor clinical condition, they were likely to be due to brincidofovir-related suppression of erythropoiesis, which is not unexpected with this class of drug (nucleotide analog).
- the concentrations of brincidofovir and cidofovir in all control plasma samples were BLQ for each analyte ( ⁇ 1.0 ng/mL and ⁇ 5.0 ng/mL, respectively).
- Concentrations of brincidofovir reached BLQ in all males and some females 8 hours following administration of 1 mg/kg and were at or near the LLOQ by 24 hours following administration of 15 mg/kg.
- the coefficient of variation (%CV) for mean plasma concentrations for brincidofovir ranged from 13.0 to 173% for female animals and from 9.98 to 28.1% for male animals. In general, the highest %CV was observed at later time points when concentrations were at or near the LLOQ.
- brincidofovir C max increased in approximate proportion to dose (for female rats), or less than proportionally to dose (for male rats). For a 15-fold increase in dose from 1 mg/kg to 15 mg/kg, C max increased 17.3- to 18.2-fold for females and 9.2- to 18.6-fold for males.
- brincidofovir AUC last increased in approximate proportion (for female rats); for a 15- fold increase in dose, the AUC last increased 14.1- to 16.1-fold. Due to insufficient data points in male rats after 1 mg/kg administration, proportionality of AUC last could not be determined.
- the brincidofovir C max on Days 1 and 7 for a 1 or 15 mg/kg dose were similar (difference within 54%).
- the brincidofovir AUC last for a 1 mg/kg dose could not be compared due to insufficient data points to calculate AUC in males.
- the brincidofovir C max and AUC last values on Day 7 for female animals following twice-weekly dosing of brincidofovir at 1 mg/kg, and for both female and male animals after 15 mg/kg, showed a trend toward lower C max and AUC last on Day 7 compared to Day 1 [Day7/Day1 accumulation ratios (AR) of 0.44 to 0.53].
- the median T max of cidofovir occurred at 8 hours following single or twice-weekly 1 mg/kg or 15 mg/kg brincidofovir dosing. In both male and female animals, concentrations of cidofovir reached BLQ by 24 hours following single and twice-weekly administration 1 mg/kg brincidofovir and did not reach BLQ by 24 hours (last time point) following single or twice-weekly administration of 15 mg/kg brincidofovir.
- the %CV for mean concentrations of cidofovir ranged from 4.82 to 88.4% for female animals and 5.49 to 173% for male animals. In general, the highest %CV was observed at early or later time points when cidofovir concentrations were at or near the LLOQ.
- TK parameters for cidofovir following single and twice weekly administration of brincidofovir as an intravenous infusion to rats are summarized in Table 58.
- cidofovir C max On Days 1 and 7, cidofovir C max generally increased less than proportional to dose. For a 15- fold increase in brincidofovir dose from 1 mg/kg to 15 mg/kg, cidofovir C max increased 2.9-to 4.1- fold for female animals and 5.7- to 16.8-fold for males. On Days 1 and 7, cidofovir AUC last increased less than proportionally to dose for female animals; for a 15-fold increase in brincidofovir dose, cidofovir AUC last increased 9.4- to 16.2-fold. Due to insufficient data points in male rats after 1 mg/kg administration, proportionality of AUC last could not be determined.
- cidofovir C max and AUC last on Day 7 for female animals following twice-weekly dosing of brincidofovir at 1 mg/kg showed a trend toward higher C max and AUC last on Day 7 compared to Day 1 (Day7/Day1 AR ranged from 1.6 to 1.9). However, cidofovir C max and AUC last for both female and male animals administered 15 mg/kg (3 doses), were similar (Day7/Day1 AR ranged from 1.0 to 1.1).
- the metabolite-to-parent (M/P) ratio of AUC last on Day 1 for female animals were 0.190 and 0.661 for doses of 1 mg/kg and 15 mg/kg of brincidofovir, respectively.
- the M/P ratios on Day 7 for female animals were 0.193 and 0.444 for doses of 1 mg/kg and 15 mg/kg of brincidofovir, respectively.
- Table 60 Plasma Concentrations of brincidofovir and cidofovir Following Single and Multiple 2-Hour Intravenous Infusion Administrations on Days 1, 3 and 7 at a Nominal brincidofovir Dose of 15 mg/kg to Female and Male Rats Sex Male Female BCV cidofovir BCV cidofovir Dose (mg/kg) Period Time (h) Subject Imputed Concentration a 15 Day 1 1 3053 4020 8.97 NS NS 3055 4030 0.00 NS NS 3057 5060 7.08 NS NS 3564 NS NS 3030 14.5 3566 NS NS 3930 20.5 3568 NS NS 3450 10.3 Mean 4370 5.35 3470 15.1 SD 598 4.73 450 5.13 %CV 13.7 88.4 13.0 33.9 N 3 3 3 3 15 Day 1 2 3054 2510 25.9 NS NS 3058 2990 13.1 NS NS 3074 3010 15.1 NS NS 3565 NS NS 2460 10.9 3567 NS NS
- Table 61 Measured and Imputed brincidofovir Concentration Data for Mean Generation Period Day 1 Day 7 Analyte Dose (mg/kg) Time (h) Subject Sex C (ng/mL) IC (ng/mL) C (ng/mL) IC (ng/mL) BCV 0 2 1015 Male BLQ 0.00 BLQ 0.00 0 2 1016 Male BLQ 0.00 BLQ 0.00 0 2 1017 Male BLQ 0.00 BLQ 0.00 0 2 1523 Female BLQ 0.00 BLQ 0.00 0 2 1524 Female BLQ 0.00 BLQ 0.00 0 2 1525 Female BLQ 0.00 BLQ 0.00 1 0 2031 Male NS NS BLQ 0.00 1 0 2033 Male NS NS BLQ 0.00 1 0 2035 Male NS NS BLQ 0.00 1 0 2542 Female NS NS BLQ 0.00 1 0 2544 Female NS NS BLQ 0.00 1 0 2546 Female
- the objectives of this study were to characterize the tissue distribution of total radioactivity in male Sprague Dawley (SD) and Long-Evans (LE) rats following administration of a single intravenous (IV, 2-h infusion) or oral (PO, gavage) dose of [ 14 C]brincidofovir.
- the rate and extent of excretion (mass balance) and pharmacokinetics (PK) of total radioactivity in male Sprague Dawley rats following a single intravenous (IV, 2-h infusion) dose of [ 14 C]brincidofovir was examined. Residual plasma and excreta collected on this study were stored at -70 °C for metabolite profile and identification experiment conducted under a different protocol.
- Animal body weights which were used for determining the dosing volume, were measured before dosing on the day of dose administration. Dose assay results, animal body weights, and targeted dosing parameters were entered into the Debra LIMS and target dose volumes for each animal were determined by the Debra LIMS. Animals received a single 2-h IV infusion of [ 14 C]brincidofovir at a target oral dose of 15 mg/kg (Groups 1-4) or 2 mg/kg (Group 5), or an oral gavage administration of [ 14 C]brincidofovir at a target oral dose of 15 mg/kg (Groups 6 and 7).
- Table 67 Body Weights and Doses of [ 14 C]brincidofovir Administered to Male Sprague Dawley Rats (Groups 1, 2, 3, and 6), and Male Long-Evans Rats (Groups 4, 5, and 7) Animal No. Animal Weight (g) Amount of Formulation Administered (g) ⁇ Ci Administered ⁇ Ci/kg mg Test Article Administered a,b mg/kg Administered a,b Gp.
- a set of whole-body sections for each rat was mounted on a cardboard backing, covered with a thin plastic wrap, and exposed along with calibration standards, which were 14 C-glucose mixed with blood at 10 different concentrations (0.0009595 to 7.806 ⁇ Ci/g), to a 14 C-sensitive phosphor imaging plate (Fuji Biomedical, Stamford, CT).
- the imaging plate and sections were placed in light-tight exposure cassettes, in a copper-lined lead safe, for a 4-day exposure at room temperature.
- the imaging plate was scanned using the Typhoon 9410 image acquisition system (GE/Molecular Dynamics, Sunnyvale, CA, USA) and the resultant image stored on a dedicated QPS computer server.
- Table 69 Blood and Plasma Concentration and Pharmacokinetic Parameters of Male Sprague Dawley Rats After a Single 2-Hour Intravenous Infusion of 15 mg/kg of [ 14 C]brincidofovir (Group 2) Time Point (h) Plasma Concentration ( ⁇ g/mL) Blood Concentration ( ⁇ g equiv/mL) Blood to Plasma Ratio 0.5 2.557 1.666 0.65 1 4.609 3.017 0.65 2 10.297 6.393 0.62 4 5.363 3.845 0.72 8 1.961 1.584 0.81 24 0.234 0.294 1.26 72 0.045 0.057 1.27 t 1/2 (h) 13.0 14.5 T max (h) 2 2 C max ( ⁇ g equiv/mL) 10.297 6.393 AUC last ( ⁇ g equiv-h/mL) 64.448 50.836 AU Call ( ⁇ gg equiv-h/mL)
- the C max of [ 14 C]brincidofovir total radioactivity in plasma after a 2-h IV infusion administration to male rats at 15 mg/kg was 10.3 ⁇ g equiv/mL at a T max of 2 h (i.e., end of infusion), and the concentration decreased to 0.045 ⁇ g equiv/mL at 72 h post-dose.
- the AUC last of [ 14 C]brincidofovir in plasma was 64.4 ⁇ g equiv ⁇ h/mL, and the t 1/2 was 13.0 h.
- Table 71 Concentrations of Radioactivity in Tissues of Male Sprague Dawley (Albino, Group 3) Rats After a Single 2-Hour Intravenous Infusion of [ 14 C]brincidofovir at a Target Dose of 15 mg/kg Tissue Type Tissue Concentration ( ⁇ g equiv./g) Rat# 11 Rat# 12 Rat# 13 2 h 24 h 168 h Vascular/ Lymphatic Plasma (by LSC) 7.130 0.251 BQL Blood (cardiac) 6.865 0.308 BQL Bone Marrow 3.411 1.219 0.196 Lymph Node 4.055 1.004 0.247 Spleen 4.536 2.244 0.694 Thymus 2.373 0.556 0.105 Excretory/ Metabolic Bile (in
- the tissues with the highest concentrations (> 20.0 ⁇ g equiv/g) at the respective T max were: liver (229.4 ⁇ g equiv/g), kidney cortex (106.5 ⁇ g equiv/g), small intestine (43.7 ⁇ g equiv/g), urinary bladder (36.0 ⁇ g equiv/g), and kidney medulla (33.4 ⁇ g equiv/g).
- the tissues with the lowest concentrations ( ⁇ 1.0 ⁇ g equiv/g) at their respective T max were: brain, spinal cord, white adipose, bone, skeletal muscle, and eye lens.
- Tissue:plasma (T/P) ratios based on AUC (AUC tissue : AUC plasma ; Table 78) show values > 1 for most tissues, indicating higher tissue concentrations relative to plasma.
- the tissues with the highest concentrations (> 20.0 ⁇ g equiv/g) at the respective T max were: liver (229.7 ⁇ g equiv/g), kidney cortex (97.3 ⁇ g equiv/g), small intestine (71.0 ⁇ g equiv/g), kidney medulla (27.0 ⁇ g equiv/g), and urinary bladder (22.8 ⁇ g equiv/g).
- the tissues with the lowest concentrations ( ⁇ 0.5 ⁇ g equiv/g) at their respective T max were: brain (cerebrum and medulla), spinal cord, white adipose, prostate gland, bone, skeletal muscle, and eye lens.
- radioactivity in most tissues increased in proportion to dose (from 2 to 15 mg/kg) across each time point. In small intestinal tissue, the increase was greater than proportional to dose. Following oral administration radioactivity was readily absorbed. Radioactivity was well distributed with peak concentrations of radioactivity in most tissues (34 of 38) occurring at 4 to 8 h after oral administration, and at the end of the IV infusion (2-h). The qualitative distribution patterns of the radioactivity were similar after IV or oral administration; quantitatively, tissue radioactive exposure, adjusted for the radioactive bioavailability (approximately 50%), generally was greater after IV administration than after oral gavage.
- the predicted exposure in humans following a 100 ⁇ Ci oral dose was estimated using four different methods (including single tissue and whole body exposure estimates), all of which resulted in a human exposure that was 4% or less of the FDA and ICRP allowed limits.
- a single dose of oral BCV at 100 mg and 200 mg resulted in about 5% instance of diarrhea, and a 350 mg dose resulted in about 20% instance of diarrhea.
- Figure 6 shows a plot of the plasma brincidofovir concentration (AUC inf (ng*h/mL)) at different 100 mg oral administration, 10 mg IV administration, and 25 mg IV administration.
- AUC inf ng*h/mL
- IV administration of 10 mg brincidofovir provided substantially the same plasma concentration as oral administration of 100 mg brincidofovir
- IV administration of 25 mg brincidofovir provided higher plasma concentration than both the IV 10 mg dose and the oral 100 mg dose.
- Sprague-Dawley CD ® rats (15/sex/group) were administered 0 (2X Sodium Phosphate Buffer Solution), 1, 4 or 15 mg/kg/dose brincidofovir twice per week via 2-hour intravenous infusion on a total of 9 occasions over 29 days.
- the dose rate was 10 mL/kg/hr for all dose groups.
- At the end of the treatment phase up to 10 animals/sex/group were euthanized and necropsied. The remaining animals (up to 5 animals/sex/group) were held for a 14-day recovery phase in order to determine progression or reversibility of any brincidofovir-related effects.
- Satellite animals (up to 3/sex/group) were similarly dosed and serial blood samples were collected from each animal on Days 1 and 29 for toxicokinetic analysis of brincidofovir and the brincidofovir metabolite (Cidofovir, CDV). Parameters evaluated during the study were: viability, clinical observations, ophthalmology, body weights, food consumption, clinical pathology (termination of dosing and end of recovery), organ weights, macroscopic observations and microscopic pathology.
- CDV C max and AUC On Days 1 and 29, following intravenous administration of brincidofovir, CDV C max and AUC last values increased with increasing brincidofovir dose (from 1 to 15 mg/kg). In general, there was little to no accumulation of CDV over the course of the study and male to female ratio generally indicated there were no sex differences in CDV exposures.
- the no-observed-adverse-effect level (NOAEL) for brincidofovir was considered to be 1 mg/kg/dose in males and 4 mg/kg/dose for in females.
- the purpose of this study was to assess the toxicity and toxicokinetics of brincidofovir when administered via intravenous (2-hour) infusion to rats 2 times per week for a total of 9 doses over the course of 29 days, and to evaluate the progression or reversibility of brincidofovir effects during a drug-free post-treatment recovery period of 14 days.
- the study design incorporates elements of general regulatory guidelines for toxicity studies.
- Pre-clinical studies in two or more species are recommended by regulatory agencies such as the FDA to support administration in humans.
- the rat is an animal model commonly utilized in toxicity studies.
- a historical data base is available for comparative evaluation.
- the test item was administered intravenously up to 2 times per week.
- the number of animals in this study was considered to be the minimum necessary for statistical, regulatory and scientific reasons.
- the purpose of this study was to monitor for toxicity and progression or reversibility of effects of the test item.
- Historical control data indicate that clinical laboratory data, organ weight data and microscopic examination of tissues vary among individual animals.
- the number of rats utilized in the conduct of subchronic studies (10 animals/sex/group) is recommended by regulatory guidance documents and was considered the minimum number that would account for the expected variability among animals.
- additional post-treatment (recovery) animals (5 animals/sex/group) were included in the study.
- Three test item-treated groups receiving low, intermediate and high multiples of the proposed human dose and a negative control group were considered the minimum number of groups necessary to provide a range of effects and allowed for extrapolation of results to humans.
- the number of animals selected for toxicokinetic evaluations was considered the minimum number necessary to provide meaningful data, given the inherent variability in absorption, distribution, metabolism and excretion processes.
- a control group with 3 animals/sex was necessary to evaluate the absence of the test item.
- the doses for this study (0, 1, 4 and 15 mg/kg/dose) were 2, 4, 10 or 15 mg/kg/dose over the course of 2 hours in the maximum tolerated dose (MTD) phase, and a second set of animals were then administered 3 doses of 1 or 15 mg/kg/dose over the course of 2 hours in the dose range finding (DRF) phase over the course of 9 days.
- the high dose (15mg/kg) administered on this 2-phase study was determined to be the maximum feasible dose (MFD) based on hemolysis observed at higher concentrations.
- Table 80 Experimental Outline Group Treatment Dose (mg/kg) a Number of animals Toxicity study Recovery phase Satellite study Male Female Male Female Male Female 1 Control 0 15 15 5 5 3 3 2 BCV 1 15 15 5 5 3 3 3 BCV 4 15 15 5 5 3 3 4 BCV 15 15 15 5 5 3 3 a Doses represent active ingredient. b Toxicokinetic samples were collected on Day 1 and Day 29.
- the first day of dosing was defined as Day 1 of the study.
- Brincidofovir was provided as a white powder and was stored at room temperature. The purity was determined to be 99.8%.
- the diluent was a 5% dextrose solution for injection (USP) and was supplied as a clear liquid (96.8% pure). It was stored at room temperature.
- a brincidofovir stock of 15 mg/mL was prepared by mixing the appropriate amount of brincidofovir with 2X sodium phosphate buffer solution, sterile water for injection, USP and 1N sodium hydroxide (NaOH). The solution was filtered through a 0.22 ⁇ m Millex ® -GP filter under a laminar flow hood into a sterile vessel. Brincidofovir stock was prepared once prior to Dose 1 and again prior to Dose 4, and stored refrigerated at 2-8°C.
- brincidofovir formulations at concentrations bracketing those used in this study (0.05 mg/mL and 2.0 mg/mL) are stable for 24 hours when stored at room temperature, and for 8 days when stored refrigerated at 2 to 8°C.
- the brincidofovir stock solution of 15.0 mg/mL was stable for 24 hours when stored at room temperature (nominally 20°C) and for 8, 14 and 28 days when stored at 2 to 8°C.
- Brincidofovir was administered as an intravenous infusion over 2 hours. Animals were treated at constant doses in 20 mL/kg/2 hours.
- the surgical site was prepared as per Testing Facility's SOP for aseptic, recovery surgical procedures. Animals received analgesics pre-emptively (flunixin meglumine (USP) 2 mg/kg, subcutaneously).
- analgesics pre-emptively (flunixin meglumine (USP) 2 mg/kg, subcutaneously).
- the animals were placed in jackets and the implanted catheters were attached to pins with capped septum connectors. The catheters were locked with taurolidine citrate locking solution. Each animal received enrofloxacin 5.0 mg/kg intramuscularly on the day of surgery.
- Surgical repairs (1 repair per animal limit) to restore catheter patency were performed as necessary, during the pretest period and at the discretion of the Study Director during the ontest period.
- Analgesics were administered preemptively (flunixin meglumine 2 mg/kg (USP), subcutaneously). Animals undergoing a surgical repair received an appropriate dose of antibiotics (as per the Standard Operating Procedures of the Testing Facility) on the day of surgery.
- Organs indicated below were weighed for all surviving toxicity and recovery study animals at the scheduled sacrifice intervals. Prior to weighing, the organs were carefully dissected and properly trimmed to remove adipose and other contiguous tissues in a uniform manner. Organs were weighed as soon as possible after dissection in order to avoid drying. Paired organs were weighed together.
- NBF neutral buffered formalin
- the data collection system used for collecting the in-life and post-life data divides the study into phases. The start of each phase begins with Day 1/Week 1. The phases presented in this report are:
- Pre-Treatment Begins the day the animals arrive. Phase days/weeks are labeled P1, P2, P3, etc. During this phase, animals are not being dosed and they have not been assigned their permanent identification numbers.
- Randomization Begins the day the animals are sorted into groups and assigned their permanent identification numbers. Phase days/weeks are labeled Ra1, Ra2, Ra3, etc. Animals are not being dosed during this phase.
- Food consumption (g/animal/day) was calculated as: grams of food consumed ⁇ animal days a a Sum of whole days each animal is alive in the cage for each consumption period. If an animal dies the day of death is not counted as an animal day. For example: 4 animals in a cage for 5 days equals 20 animal days; if one animal died on the 3 rd day then the animal days equals 1
- Globulin was calculated as: total protein ⁇ albumin
- Albumin/globulin ratio was calculated as: albumin ⁇ globulin
- Group means are presented for volume, pH, and specific gravity only.
- Organ weights were presented as absolute, relative to terminal body weight using the weight recorded on the day of necropsy and relative to brain weight.
- the following data types were analyzed at each timepoint separately: body weight; body weight change from interval to interval; food consumption; hematology; coagulation; clinical chemistry; urinalysis; and organ weights.
- Test-item treated groups were then compared to the control using the following procedures.
- the pituitary gland tissue for Animal No. 4074 was collected at the recovery necropsy, but was later found to be missing at the post-fix trimming; a weight was not obtained.
- Table 92 Summary of combined male and female plasma CDV toxicokinetic parameters by treatment on Day 1 in rats (TK parameter population) Treatment Statistic C max T max C last T last T lag AUC last (ng/mL) (hr) (ng/mL) (hr) (hr) (hr*ng/mL) 1 mg/kg N 6 5 5 5 5 6 Mean 5.64 NC 5.66 NC NC 27.3 SD 2.96 NC 0.486 NC NC 20.2 CV% 52.4 NC 8.6 NC NC NC 74.1 Min 0 2.00 5.01 2.00 1.00 0 Median 6.06 2.00 5.87 8.00 1.00 37.8 Max 8.60 8.00 6.18 8.00 1.00 45.2 4 mg/kg N 6 6 6 6 6 6 6 Mean 18.0 NC 7.69 NC NC NC 280 SD 5.85 NC 1.12 NC NC 68.7 CV% 32.5 NC 14.5 NC NC 24.5 Min 11.2 2.00 6.52 24.00 0 204 Median 16.7 8.00 7.54 24.00 1.00 258 Max 27.8 8.00 9.62 24.00 1.00 394 15 mg/kg
- testes weights in males administered ⁇ 4 mg/kg/dose were still lower than controls and differences were of greater magnitude than at the end of dosing. Without wishing to be bound by theory, these changes were, without wishing to be bound by theory, reflective of maturation depletion secondary to the loss of germ cell stages observed microscopically at the end of the dosing period.
- a control male (Animal No. 1005) was found dead on Day 27. The cause of death was sepsis. Macroscopic and microscopic findings were consistent with bacterial infection that originated at the catheter site and disseminated to multiple other organs, resulting in masses in many organs that correlated microscopically with inflammation, abscessation, thrombosis, infarction and necrosis. Inflammation was also present in a swollen extremity (left femorotibial joint). Increased cellularity in the bone marrow was considered to be an adaptive reactive response to infection and decreased cellularity and/or necrosis in the thymus, spleen and lymph nodes, adrenal cortical hypertrophy were considered to be related to physiologic stress.
- Enlargement or abnormal color of lymph nodes and spleen correlated microscopically with reactive lymphoid processes (increased follicle cellularity in lymph nodes and spleen), drainage of blood from sites of inflammation (erythrocytosis/erythrophagocytosis in lymph nodes) or extramedullary hematopoiesis (spleen). All these changes were considered to be systemic reactions associated with inflammation related to the infusion site/procedure.
Landscapes
- Health & Medical Sciences (AREA)
- Life Sciences & Earth Sciences (AREA)
- Chemical & Material Sciences (AREA)
- Veterinary Medicine (AREA)
- Medicinal Chemistry (AREA)
- General Health & Medical Sciences (AREA)
- Public Health (AREA)
- Pharmacology & Pharmacy (AREA)
- Animal Behavior & Ethology (AREA)
- Epidemiology (AREA)
- Virology (AREA)
- Chemical Kinetics & Catalysis (AREA)
- General Chemical & Material Sciences (AREA)
- Engineering & Computer Science (AREA)
- Molecular Biology (AREA)
- Oil, Petroleum & Natural Gas (AREA)
- Communicable Diseases (AREA)
- Organic Chemistry (AREA)
- Nuclear Medicine, Radiotherapy & Molecular Imaging (AREA)
- Oncology (AREA)
- Proteomics, Peptides & Aminoacids (AREA)
- Biotechnology (AREA)
- Biochemistry (AREA)
- Bioinformatics & Cheminformatics (AREA)
- Dermatology (AREA)
- Medicinal Preparation (AREA)
- Pharmaceuticals Containing Other Organic And Inorganic Compounds (AREA)
Priority Applications (1)
| Application Number | Priority Date | Filing Date | Title |
|---|---|---|---|
| EP23195544.4A EP4295853A3 (en) | 2016-06-28 | 2017-06-28 | Formulations of brincidofovir |
Applications Claiming Priority (7)
| Application Number | Priority Date | Filing Date | Title |
|---|---|---|---|
| US201662355844P | 2016-06-28 | 2016-06-28 | |
| US201662394665P | 2016-09-14 | 2016-09-14 | |
| US201762446213P | 2017-01-13 | 2017-01-13 | |
| US201762465053P | 2017-02-28 | 2017-02-28 | |
| US201762507397P | 2017-05-17 | 2017-05-17 | |
| US201762512825P | 2017-05-31 | 2017-05-31 | |
| PCT/US2017/039804 WO2018005676A1 (en) | 2016-06-28 | 2017-06-28 | Formulations of brincidofovir |
Related Child Applications (2)
| Application Number | Title | Priority Date | Filing Date |
|---|---|---|---|
| EP23195544.4A Division EP4295853A3 (en) | 2016-06-28 | 2017-06-28 | Formulations of brincidofovir |
| EP23195544.4A Division-Into EP4295853A3 (en) | 2016-06-28 | 2017-06-28 | Formulations of brincidofovir |
Publications (2)
| Publication Number | Publication Date |
|---|---|
| EP3474822A1 EP3474822A1 (en) | 2019-05-01 |
| EP3474822B1 true EP3474822B1 (en) | 2025-07-09 |
Family
ID=59313330
Family Applications (2)
| Application Number | Title | Priority Date | Filing Date |
|---|---|---|---|
| EP17737695.1A Active EP3474822B1 (en) | 2016-06-28 | 2017-06-28 | Formulations of brincidofovir |
| EP23195544.4A Pending EP4295853A3 (en) | 2016-06-28 | 2017-06-28 | Formulations of brincidofovir |
Family Applications After (1)
| Application Number | Title | Priority Date | Filing Date |
|---|---|---|---|
| EP23195544.4A Pending EP4295853A3 (en) | 2016-06-28 | 2017-06-28 | Formulations of brincidofovir |
Country Status (12)
| Country | Link |
|---|---|
| US (3) | US20170368082A1 (enExample) |
| EP (2) | EP3474822B1 (enExample) |
| JP (3) | JP6878473B2 (enExample) |
| CN (4) | CN118416082A (enExample) |
| AU (2) | AU2017290703B2 (enExample) |
| CA (1) | CA3024886A1 (enExample) |
| DK (1) | DK3474822T3 (enExample) |
| ES (1) | ES3037596T3 (enExample) |
| FI (1) | FI3474822T3 (enExample) |
| PL (1) | PL3474822T3 (enExample) |
| PT (1) | PT3474822T (enExample) |
| WO (1) | WO2018005676A1 (enExample) |
Families Citing this family (10)
| Publication number | Priority date | Publication date | Assignee | Title |
|---|---|---|---|---|
| BR112016010862B1 (pt) * | 2013-11-15 | 2022-11-29 | Chimerix, Inc | Formas mórficas de ésteres de hexadeciloxipropilfosfonato, seu método de preparo e composição compreendendo a dita forma mórfica |
| EP3474822B1 (en) * | 2016-06-28 | 2025-07-09 | Emergent BioDefense Operations Lansing LLC | Formulations of brincidofovir |
| JP7368856B2 (ja) | 2017-07-25 | 2023-10-25 | トゥルーバインディング,インコーポレイテッド | Tim-3とそのリガンドとの相互作用の遮断によるがん治療 |
| CN116063505B (zh) | 2019-01-30 | 2024-05-03 | 真和制药有限公司 | 抗gal3抗体及其用途 |
| US12281166B2 (en) | 2020-05-26 | 2025-04-22 | Truebinding, Inc. | Methods of treating inflammatory diseases by blocking Galectin-3 |
| CN114073772A (zh) * | 2020-08-18 | 2022-02-22 | 上海市公共卫生临床中心 | 铁螯合剂在制备用于治疗或预防多瘤病毒感染的药物中的用途 |
| CN114558022B (zh) * | 2022-02-16 | 2023-11-17 | 华中农业大学 | 布林西多福韦在制备抗伪狂犬病毒药物中的应用 |
| CN114732821A (zh) * | 2022-04-24 | 2022-07-12 | 华中农业大学 | 西多福韦的前药在制备防治非洲猪瘟药物中的应用 |
| JP7417339B1 (ja) * | 2023-08-07 | 2024-01-18 | シンバイオ製薬株式会社 | アデノウイルス感染又はアデノウイルス感染に伴う疾患の治療 |
| WO2025072782A1 (en) * | 2023-09-29 | 2025-04-03 | Symbio Pharmaceuticals Limited | Brincidofovir for treatment of multiple sclerosis |
Family Cites Families (17)
| Publication number | Priority date | Publication date | Assignee | Title |
|---|---|---|---|---|
| BR0016058A (pt) | 1999-12-03 | 2003-07-15 | Univ California San Diego | Compostos de fosfonato |
| JP4136340B2 (ja) * | 2000-08-18 | 2008-08-20 | 武田薬品工業株式会社 | 注射剤 |
| US8642577B2 (en) | 2005-04-08 | 2014-02-04 | Chimerix, Inc. | Compounds, compositions and methods for the treatment of poxvirus infections |
| JP2008538354A (ja) | 2005-04-08 | 2008-10-23 | キメリクス,インコーポレイテッド | ウイルス感染症およびその他の内科疾患を治療するための化合物、組成物および方法 |
| EP2155257B1 (en) | 2007-04-27 | 2016-10-05 | Chimerix, Inc. | Methods of reducing nephrotoxicity in subjects administered with nucleoside |
| JP2011116658A (ja) * | 2008-03-13 | 2011-06-16 | Chemo-Sero-Therapeutic Research Inst | 豚萎縮性鼻炎用薬剤の製造方法 |
| WO2011011519A1 (en) | 2009-07-21 | 2011-01-27 | Chimerix, Inc. | Compounds, compositions and methods for treating ocular conditions |
| EP2462152A4 (en) | 2009-08-03 | 2013-02-13 | Chimerix Inc | COMPOSITION AND METHOD FOR THE TREATMENT OF VIRUS INFECTIONS AND TEMPORED VIRUSES |
| CA2779473C (en) | 2009-10-30 | 2016-08-16 | Chimerix, Inc. | Methods of treating viral associated diseases |
| CA2782911C (en) * | 2009-12-03 | 2016-08-23 | Jiangsu Hengrui Medicine Co., Ltd. | Liposome of irinotecan or its hydrochloride and preparation method thereof |
| US20110263536A1 (en) | 2010-04-22 | 2011-10-27 | Chimerix, Inc. | Methods of Treating Orthopox Virus Infections and Associated Diseases |
| ES2604137T3 (es) | 2010-08-31 | 2017-03-03 | Chimerix, Inc. | Derivados de éster de fosfonato y métodos de síntesis de los mismos |
| CA2853720A1 (en) * | 2011-10-26 | 2013-05-02 | Chimerix, Inc. | Hexadecyloxypropyl cidofovir for the treatment of double-stranded dna virus infection |
| EP2841162A4 (en) | 2012-04-27 | 2016-02-24 | Chimerix Inc | METHOD FOR CONTROLLING VIRUS ASSOCIATED ENDORGANIC DAMAGE |
| UA119324C2 (uk) * | 2013-04-02 | 2019-06-10 | Теміс Медікер Лімітед | Композиції фармацевтично активних речовин, що містять моноетиловий ефір діетиленгліколю або інші алкільні похідні |
| BR112016010862B1 (pt) * | 2013-11-15 | 2022-11-29 | Chimerix, Inc | Formas mórficas de ésteres de hexadeciloxipropilfosfonato, seu método de preparo e composição compreendendo a dita forma mórfica |
| EP3474822B1 (en) * | 2016-06-28 | 2025-07-09 | Emergent BioDefense Operations Lansing LLC | Formulations of brincidofovir |
-
2017
- 2017-06-28 EP EP17737695.1A patent/EP3474822B1/en active Active
- 2017-06-28 CN CN202410393564.XA patent/CN118416082A/zh active Pending
- 2017-06-28 CA CA3024886A patent/CA3024886A1/en active Pending
- 2017-06-28 JP JP2018568195A patent/JP6878473B2/ja active Active
- 2017-06-28 WO PCT/US2017/039804 patent/WO2018005676A1/en not_active Ceased
- 2017-06-28 CN CN201780040478.9A patent/CN109475497A/zh active Pending
- 2017-06-28 PT PT177376951T patent/PT3474822T/pt unknown
- 2017-06-28 CN CN202411127002.7A patent/CN119139329A/zh active Pending
- 2017-06-28 FI FIEP17737695.1T patent/FI3474822T3/fi active
- 2017-06-28 PL PL17737695.1T patent/PL3474822T3/pl unknown
- 2017-06-28 AU AU2017290703A patent/AU2017290703B2/en active Active
- 2017-06-28 CN CN202210134248.1A patent/CN114569547A/zh active Pending
- 2017-06-28 ES ES17737695T patent/ES3037596T3/es active Active
- 2017-06-28 DK DK17737695.1T patent/DK3474822T3/da active
- 2017-06-28 EP EP23195544.4A patent/EP4295853A3/en active Pending
- 2017-06-28 US US15/636,393 patent/US20170368082A1/en not_active Abandoned
-
2019
- 2019-12-20 US US16/722,699 patent/US20200138835A1/en not_active Abandoned
-
2021
- 2021-04-28 JP JP2021075612A patent/JP7221485B2/ja active Active
-
2022
- 2022-07-25 US US17/872,921 patent/US12485131B2/en active Active
-
2023
- 2023-01-18 JP JP2023005643A patent/JP7407984B2/ja active Active
- 2023-06-28 AU AU2023204117A patent/AU2023204117B2/en active Active
Also Published As
| Publication number | Publication date |
|---|---|
| PT3474822T (pt) | 2025-08-21 |
| AU2017290703B2 (en) | 2023-03-30 |
| JP2019519570A (ja) | 2019-07-11 |
| EP4295853A3 (en) | 2024-03-06 |
| EP4295853A2 (en) | 2023-12-27 |
| AU2017290703A1 (en) | 2018-12-13 |
| ES3037596T3 (en) | 2025-10-03 |
| US20170368082A1 (en) | 2017-12-28 |
| CN119139329A (zh) | 2024-12-17 |
| PL3474822T3 (pl) | 2025-11-03 |
| CA3024886A1 (en) | 2018-01-04 |
| JP2023033538A (ja) | 2023-03-10 |
| DK3474822T3 (da) | 2025-08-18 |
| CN118416082A (zh) | 2024-08-02 |
| CN109475497A (zh) | 2019-03-15 |
| US20200138835A1 (en) | 2020-05-07 |
| JP6878473B2 (ja) | 2021-05-26 |
| US12485131B2 (en) | 2025-12-02 |
| AU2023204117B2 (en) | 2025-03-20 |
| US20230210873A1 (en) | 2023-07-06 |
| JP7407984B2 (ja) | 2024-01-04 |
| CN114569547A (zh) | 2022-06-03 |
| WO2018005676A1 (en) | 2018-01-04 |
| JP2021143178A (ja) | 2021-09-24 |
| EP3474822A1 (en) | 2019-05-01 |
| JP7221485B2 (ja) | 2023-02-14 |
| AU2023204117A1 (en) | 2023-07-13 |
| FI3474822T3 (fi) | 2025-08-15 |
Similar Documents
| Publication | Publication Date | Title |
|---|---|---|
| US12485131B2 (en) | Formulations of brincidofovir | |
| EP3225233B1 (en) | Sodium chloride solution for drug reconstitution | |
| US10117830B2 (en) | Stable parenteral DNJ compositions | |
| EP3505154B1 (en) | Composition for improving the solubility of poorly soluble substances, use thereof and complex formulation containing thereof | |
| EP1991239B1 (en) | Doxorubicin formulations for anti-cancer use | |
| HK40105712A (en) | Formulations of brincidofovir | |
| EP3308770A1 (en) | Pemetrexed formulation | |
| US20210177824A1 (en) | Extended release formulations for intra-articular applications | |
| HK40075964A (en) | Formulations of brincidofovir | |
| PETERSEN et al. | Digoxin–trimethoprim interaction | |
| US20240016822A1 (en) | Use of nk1 antagonist prodrug compound in combination with 5-ht3 receptor antagonist | |
| Dekker et al. | Parenteral human use of bilirubin; a re-introduction for translational research. | |
| Rickert | THE PANCREATIC BETA-CELL TOXICITY OF CYPROHEPTADINE. | |
| JPH02202822A (ja) | 肝細胞増殖促進剤 | |
| MXPA94003569A (en) | Stable quinolone and naphthyridine premix formulations | |
| JPWO1999039716A1 (ja) | ニューロン変性疾患予防治療剤 |
Legal Events
| Date | Code | Title | Description |
|---|---|---|---|
| STAA | Information on the status of an ep patent application or granted ep patent |
Free format text: STATUS: UNKNOWN |
|
| STAA | Information on the status of an ep patent application or granted ep patent |
Free format text: STATUS: THE INTERNATIONAL PUBLICATION HAS BEEN MADE |
|
| PUAI | Public reference made under article 153(3) epc to a published international application that has entered the european phase |
Free format text: ORIGINAL CODE: 0009012 |
|
| STAA | Information on the status of an ep patent application or granted ep patent |
Free format text: STATUS: REQUEST FOR EXAMINATION WAS MADE |
|
| 17P | Request for examination filed |
Effective date: 20190125 |
|
| AK | Designated contracting states |
Kind code of ref document: A1 Designated state(s): AL AT BE BG CH CY CZ DE DK EE ES FI FR GB GR HR HU IE IS IT LI LT LU LV MC MK MT NL NO PL PT RO RS SE SI SK SM TR |
|
| AX | Request for extension of the european patent |
Extension state: BA ME |
|
| DAV | Request for validation of the european patent (deleted) | ||
| DAX | Request for extension of the european patent (deleted) | ||
| RIN1 | Information on inventor provided before grant (corrected) |
Inventor name: KABIR, MOHAMMED ANOWRUL Inventor name: GROSSI, IRMA MARISA Inventor name: NADERER, ODIN JOHANN |
|
| REG | Reference to a national code |
Ref country code: HK Ref legal event code: DE Ref document number: 40005624 Country of ref document: HK |
|
| STAA | Information on the status of an ep patent application or granted ep patent |
Free format text: STATUS: EXAMINATION IS IN PROGRESS |
|
| 17Q | First examination report despatched |
Effective date: 20201008 |
|
| RAP1 | Party data changed (applicant data changed or rights of an application transferred) |
Owner name: EMERGENT BIODEFENSE OPERATIONS LANSING LLC |
|
| GRAP | Despatch of communication of intention to grant a patent |
Free format text: ORIGINAL CODE: EPIDOSNIGR1 |
|
| STAA | Information on the status of an ep patent application or granted ep patent |
Free format text: STATUS: GRANT OF PATENT IS INTENDED |
|
| INTG | Intention to grant announced |
Effective date: 20250204 |
|
| RIC1 | Information provided on ipc code assigned before grant |
Ipc: A61P 31/22 20060101ALI20250127BHEP Ipc: A61P 31/20 20060101ALI20250127BHEP Ipc: A61P 31/14 20060101ALI20250127BHEP Ipc: A61P 31/12 20060101ALI20250127BHEP Ipc: A61K 31/685 20060101ALI20250127BHEP Ipc: A61K 31/675 20060101ALI20250127BHEP Ipc: A61K 47/26 20060101ALI20250127BHEP Ipc: A61K 47/18 20170101ALI20250127BHEP Ipc: A61K 9/19 20060101ALI20250127BHEP Ipc: A61K 9/08 20060101AFI20250127BHEP |
|
| RIN1 | Information on inventor provided before grant (corrected) |
Inventor name: GROSSI, IRMA MARISA Inventor name: NADERER, ODIN JOHANN Inventor name: KABIR, MOHAMMED ANOWRUL |
|
| GRAS | Grant fee paid |
Free format text: ORIGINAL CODE: EPIDOSNIGR3 |
|
| GRAA | (expected) grant |
Free format text: ORIGINAL CODE: 0009210 |
|
| STAA | Information on the status of an ep patent application or granted ep patent |
Free format text: STATUS: THE PATENT HAS BEEN GRANTED |
|
| AK | Designated contracting states |
Kind code of ref document: B1 Designated state(s): AL AT BE BG CH CY CZ DE DK EE ES FI FR GB GR HR HU IE IS IT LI LT LU LV MC MK MT NL NO PL PT RO RS SE SI SK SM TR |
|
| REG | Reference to a national code |
Ref country code: GB Ref legal event code: FG4D |
|
| REG | Reference to a national code |
Ref country code: CH Ref legal event code: EP |
|
| REG | Reference to a national code |
Ref country code: IE Ref legal event code: FG4D |
|
| REG | Reference to a national code |
Ref country code: DE Ref legal event code: R096 Ref document number: 602017090446 Country of ref document: DE |
|
| REG | Reference to a national code |
Ref country code: SE Ref legal event code: TRGR |
|
| REG | Reference to a national code |
Ref country code: FI Ref legal event code: FGE |
|
| REG | Reference to a national code |
Ref country code: DK Ref legal event code: T3 Effective date: 20250808 |
|
| P01 | Opt-out of the competence of the unified patent court (upc) registered |
Free format text: CASE NUMBER: UPC_APP_0101_3474822/2025 Effective date: 20250709 |
|
| REG | Reference to a national code |
Ref country code: NL Ref legal event code: FP |
|
| REG | Reference to a national code |
Ref country code: PT Ref legal event code: SC4A Ref document number: 3474822 Country of ref document: PT Date of ref document: 20250821 Kind code of ref document: T Free format text: AVAILABILITY OF NATIONAL TRANSLATION Effective date: 20250814 |
|
| REG | Reference to a national code |
Ref country code: ES Ref legal event code: FG2A Ref document number: 3037596 Country of ref document: ES Kind code of ref document: T3 Effective date: 20251003 |
|
| REG | Reference to a national code |
Ref country code: SK Ref legal event code: T3 Ref document number: E 46910 Country of ref document: SK |
|
| REG | Reference to a national code |
Ref country code: GR Ref legal event code: EP Ref document number: 20250401612 Country of ref document: GR Effective date: 20251009 |