EP3270159A1 - Beobachtungsverfahren mit einer bindungsdissoziationssonde - Google Patents
Beobachtungsverfahren mit einer bindungsdissoziationssonde Download PDFInfo
- Publication number
- EP3270159A1 EP3270159A1 EP16761865.1A EP16761865A EP3270159A1 EP 3270159 A1 EP3270159 A1 EP 3270159A1 EP 16761865 A EP16761865 A EP 16761865A EP 3270159 A1 EP3270159 A1 EP 3270159A1
- Authority
- EP
- European Patent Office
- Prior art keywords
- amino acid
- acid sequence
- probe
- substance
- target
- Prior art date
- Legal status (The legal status is an assumption and is not a legal conclusion. Google has not performed a legal analysis and makes no representation as to the accuracy of the status listed.)
- Pending
Links
Images


Classifications
-
- G—PHYSICS
- G01—MEASURING; TESTING
- G01N—INVESTIGATING OR ANALYSING MATERIALS BY DETERMINING THEIR CHEMICAL OR PHYSICAL PROPERTIES
- G01N21/00—Investigating or analysing materials by the use of optical means, i.e. using sub-millimetre waves, infrared, visible or ultraviolet light
- G01N21/62—Systems in which the material investigated is excited whereby it emits light or causes a change in wavelength of the incident light
- G01N21/63—Systems in which the material investigated is excited whereby it emits light or causes a change in wavelength of the incident light optically excited
- G01N21/64—Fluorescence; Phosphorescence
- G01N21/645—Specially adapted constructive features of fluorimeters
- G01N21/6456—Spatial resolved fluorescence measurements; Imaging
- G01N21/6458—Fluorescence microscopy
-
- C—CHEMISTRY; METALLURGY
- C12—BIOCHEMISTRY; BEER; SPIRITS; WINE; VINEGAR; MICROBIOLOGY; ENZYMOLOGY; MUTATION OR GENETIC ENGINEERING
- C12Q—MEASURING OR TESTING PROCESSES INVOLVING ENZYMES, NUCLEIC ACIDS OR MICROORGANISMS; COMPOSITIONS OR TEST PAPERS THEREFOR; PROCESSES OF PREPARING SUCH COMPOSITIONS; CONDITION-RESPONSIVE CONTROL IN MICROBIOLOGICAL OR ENZYMOLOGICAL PROCESSES
- C12Q1/00—Measuring or testing processes involving enzymes, nucleic acids or microorganisms; Compositions therefor; Processes of preparing such compositions
- C12Q1/02—Measuring or testing processes involving enzymes, nucleic acids or microorganisms; Compositions therefor; Processes of preparing such compositions involving viable microorganisms
-
- C—CHEMISTRY; METALLURGY
- C07—ORGANIC CHEMISTRY
- C07K—PEPTIDES
- C07K1/00—General methods for the preparation of peptides, i.e. processes for the organic chemical preparation of peptides or proteins of any length
- C07K1/13—Labelling of peptides
-
- G—PHYSICS
- G01—MEASURING; TESTING
- G01N—INVESTIGATING OR ANALYSING MATERIALS BY DETERMINING THEIR CHEMICAL OR PHYSICAL PROPERTIES
- G01N21/00—Investigating or analysing materials by the use of optical means, i.e. using sub-millimetre waves, infrared, visible or ultraviolet light
- G01N21/62—Systems in which the material investigated is excited whereby it emits light or causes a change in wavelength of the incident light
- G01N21/63—Systems in which the material investigated is excited whereby it emits light or causes a change in wavelength of the incident light optically excited
- G01N21/64—Fluorescence; Phosphorescence
-
- G—PHYSICS
- G01—MEASURING; TESTING
- G01N—INVESTIGATING OR ANALYSING MATERIALS BY DETERMINING THEIR CHEMICAL OR PHYSICAL PROPERTIES
- G01N33/00—Investigating or analysing materials by specific methods not covered by groups G01N1/00 - G01N31/00
- G01N33/48—Biological material, e.g. blood, urine; Haemocytometers
- G01N33/50—Chemical analysis of biological material, e.g. blood, urine; Testing involving biospecific ligand binding methods; Immunological testing
- G01N33/53—Immunoassay; Biospecific binding assay; Materials therefor
- G01N33/536—Immunoassay; Biospecific binding assay; Materials therefor with immune complex formed in liquid phase
-
- G—PHYSICS
- G01—MEASURING; TESTING
- G01N—INVESTIGATING OR ANALYSING MATERIALS BY DETERMINING THEIR CHEMICAL OR PHYSICAL PROPERTIES
- G01N33/00—Investigating or analysing materials by specific methods not covered by groups G01N1/00 - G01N31/00
- G01N33/48—Biological material, e.g. blood, urine; Haemocytometers
- G01N33/50—Chemical analysis of biological material, e.g. blood, urine; Testing involving biospecific ligand binding methods; Immunological testing
- G01N33/53—Immunoassay; Biospecific binding assay; Materials therefor
- G01N33/543—Immunoassay; Biospecific binding assay; Materials therefor with an insoluble carrier for immobilising immunochemicals
- G01N33/54306—Solid-phase reaction mechanisms
-
- G—PHYSICS
- G01—MEASURING; TESTING
- G01N—INVESTIGATING OR ANALYSING MATERIALS BY DETERMINING THEIR CHEMICAL OR PHYSICAL PROPERTIES
- G01N33/00—Investigating or analysing materials by specific methods not covered by groups G01N1/00 - G01N31/00
- G01N33/48—Biological material, e.g. blood, urine; Haemocytometers
- G01N33/50—Chemical analysis of biological material, e.g. blood, urine; Testing involving biospecific ligand binding methods; Immunological testing
- G01N33/58—Chemical analysis of biological material, e.g. blood, urine; Testing involving biospecific ligand binding methods; Immunological testing involving labelled substances
- G01N33/582—Chemical analysis of biological material, e.g. blood, urine; Testing involving biospecific ligand binding methods; Immunological testing involving labelled substances with fluorescent label
-
- G—PHYSICS
- G01—MEASURING; TESTING
- G01N—INVESTIGATING OR ANALYSING MATERIALS BY DETERMINING THEIR CHEMICAL OR PHYSICAL PROPERTIES
- G01N33/00—Investigating or analysing materials by specific methods not covered by groups G01N1/00 - G01N31/00
- G01N33/48—Biological material, e.g. blood, urine; Haemocytometers
- G01N33/50—Chemical analysis of biological material, e.g. blood, urine; Testing involving biospecific ligand binding methods; Immunological testing
- G01N33/68—Chemical analysis of biological material, e.g. blood, urine; Testing involving biospecific ligand binding methods; Immunological testing involving proteins, peptides or amino acids
- G01N33/6887—Chemical analysis of biological material, e.g. blood, urine; Testing involving biospecific ligand binding methods; Immunological testing involving proteins, peptides or amino acids from muscle, cartilage or connective tissue
-
- G—PHYSICS
- G01—MEASURING; TESTING
- G01N—INVESTIGATING OR ANALYSING MATERIALS BY DETERMINING THEIR CHEMICAL OR PHYSICAL PROPERTIES
- G01N21/00—Investigating or analysing materials by the use of optical means, i.e. using sub-millimetre waves, infrared, visible or ultraviolet light
- G01N21/17—Systems in which incident light is modified in accordance with the properties of the material investigated
- G01N21/47—Scattering, i.e. diffuse reflection
- G01N21/4788—Diffraction
- G01N2021/479—Speckle
-
- G—PHYSICS
- G01—MEASURING; TESTING
- G01N—INVESTIGATING OR ANALYSING MATERIALS BY DETERMINING THEIR CHEMICAL OR PHYSICAL PROPERTIES
- G01N2333/00—Assays involving biological materials from specific organisms or of a specific nature
- G01N2333/435—Assays involving biological materials from specific organisms or of a specific nature from animals; from humans
- G01N2333/46—Assays involving biological materials from specific organisms or of a specific nature from animals; from humans from vertebrates
- G01N2333/47—Assays involving proteins of known structure or function as defined in the subgroups
- G01N2333/4701—Details
- G01N2333/4712—Muscle proteins, e.g. myosin, actin, protein
-
- G—PHYSICS
- G01—MEASURING; TESTING
- G01N—INVESTIGATING OR ANALYSING MATERIALS BY DETERMINING THEIR CHEMICAL OR PHYSICAL PROPERTIES
- G01N2500/00—Screening for compounds of potential therapeutic value
- G01N2500/04—Screening involving studying the effect of compounds C directly on molecule A (e.g. C are potential ligands for a receptor A, or potential substrates for an enzyme A)
Definitions
- Actin polymer used herein refers to a structure body formed through polymerization of an actin molecule, and typically to an actin filament.
- polypeptides in the above (a3), (b3), (c3) and (d3) are polypeptides having preferably equal to or more than 75%, more preferably equal to or more than 80%, more preferably equal to or more than 85%, more preferably equal to or more than 90%, more preferably equal to or more than 95%, more preferably equal to or more than 97%, more preferably equal to or more than 98%, and most preferably equal to or more than 99%, of similarly to the amino acid sequences respectively described in the above (a1), (b1), (c1) and (d1).
- a technique for producing an antibody to an arbitrary target substance has already been established.
- using an antibody or a fragment of an antibody produced in accordance with a target substance as a binding substance of a probe makes it possible to use the technique of the present invention for observation of a target substance ranging in a wide scope.
- the half-life of a probe-target complex formed by binding of a probe containing an antibody or a fragment of an antibody to a target substance is equal to or more than 10 milliseconds and equal to or less than 3 seconds.
- an antibody has a bivalent binding capacity to an antigen (i.e., an antibody of 1 molecule has two antigen binding sites)
- the binding tendency to an antigen is strong and the half-life of a probe-target complex between an antibody and an antigen far exceeds the upper limit of the above scope.
- a fragment of an antibody that can repeatedly bind to and dissociate from a target substance be used and that a fragment of an antibody have a univalent binding capacity to a target substance, which is an antigen, (i.e., 1 molecule has 1 antigen binding site).
- a target substance which is an antigen, (i.e., 1 molecule has 1 antigen binding site).
- an antibody fragment having a univalent binding capacity to a target substance may include a Fab fragment, a Fab' fragment, an scFv fragment, a VHH fragment of a single domain antibody (for example a commercial name of nanobody), etc.
- Luminescent substances contained in probes are not particularly limited as long as they are substances emitting light that makes observation possible under a prescribed condition.
- a fluorescent substance that can emit fluorescence when irradiated with excitation light is particularly preferable.
- fluorescent substances may include a fluorescent protein such as a green fluorescent protein (GFP), an enhanced green fluorescent protein (EGFP), a red fluorescent protein (RFP), TagRFP, etc.; fluorescent dye such as Atto (trademark) 488, Atto (trademark) 550, Dylight (trademark) 488, Dylight (trademark)550, CF (trademark) dye (CF680R, CF488A, CF543, etc.), etc.; and a quantum dot.
- GFP green fluorescent protein
- EGFP enhanced green fluorescent protein
- RFP red fluorescent protein
- TagRFP etc.
- fluorescent dye such as Atto (trademark) 488, Atto (trademark) 550, Dylight (trademark) 488, Dylight (trademark)550, CF (trade
- An imaging step of the present invention is performed in a state in which a medium containing a probe and a sample are in contact with each other.
- Media are not particularly limited as long as they allow a probe and a target substance to maintain the above binding characteristics, however they are usually liquid, and the liquid is preferably an aqueous solution, is more preferably an aqueous buffer solution adjusted to an appropriate pH, is more preferably an aqueous buffer solution adjusted to a pH of 6.1 to a pH of 7.5, and more preferably contains active oxygen remover.
- active oxygen remover at least one type or two or more types selected from glucose oxidase, catalase, 2-mercaptoethanol, glucose, etc. can be used.
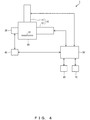
- Devices used for an observation method of the present invention are not particularly limited.
- the excitation illumination devices 10 are devices that provide the microscope body 20 with excitation light for making a fluorescent substance emit light. Any devices can be used as the excitation illumination devices 10 (including the first excitation illumination device 11 and the second excitation illumination device 12) as long as it can provide excitation light of a wavelength in accordance with the fluorescent substance. Although they are not shown, each of the first excitation illumination device 11 and the second excitation illumination device 12 may be a system as a combination of a plurality of devices and usually includes a laser beam source, a shutter, a total reflection mirror.
- the laser beam source is a light source that emits excitation light.
- the shutter is a device that switches between supply and suspend of excitation light to the microscope body 20.
- the total reflection mirror is a mechanism for totally reflecting excitation light emitted from the laser beam source toward a stage 21 of the microscope body 20.
- the microscope body 20 including the stage 20 and the imaging optical system is configured to be able to provide total internal reflection illumination by which excitation light is totally reflected on the interface between the glass in contact with the sample and the sample.
- the total internal reflection illumination makes it possible to illuminate the sample with evanescent light that leaks to the sample side from the glass when the excitation light is totally reflected.
- the second excitation illumination device 12 is equivalent to a device for providing excitation light through total internal reflection illumination.
- the excitation illumination devices 10 do not always have to include the first excitation illumination device 11 and the second excitation illumination device 12 and may have only one of the first and second excitation illumination devices 11 and 12.
- the storage unit 70 can be configured by a storage device such as a semiconductor memory, a hard disk etc.
- a program used in the control unit 50 and data provided from the control unit 50 are stored in a state in which they can be read by the control unit 50.
- the microscope apparatus 1 that uses a fluorescent substance emitting fluorescence when irradiated with excitation light as a luminescent substance contained in a probe.
- the control unit 50 operates the camera 30 via the camera controller 40 so as to pick up an image of fluorescence emitted from a fluorescent substance, and thereby obtains a speckle image.
- An obtained speckle image is output to the control unit 50 from the camera controller 40.
- the control unit 50 also stores thus obtained speckle image in the storage unit 70.
- control unit 50 In an imaging step, the control unit 50 repeatedly performs the above frame imaging step at appropriate intervals.
- Examples of the number of times of frame imaging step may include hundreds of times through hundreds of thousands of times including for example 1,000 to 999,000 times.
- An observation image generation step in the present invention is a step in which an observation image of a target substance that binds to the probe in the sample is generated from a plurality of speckle images obtained in the above imaging step.
- the control unit 50 executes an appropriate computer program so as to obtain, for each of the plurality of speckle images recorded in the storage unit 70, information of position of a speckle included in a speckle image so as to generate an observation image by integrating the pieces of information from the plurality of speckle images.
- information of the position of each speckle is typically information of the central position (position of the center of gravity) of each speckle, and can be obtained by using for example DAOSTORM, a computer program ( Nature methods, 8 279-280, 2011 ).
- a speckle of luminance that is equal to or higher than a prescribed threshold may be used for generating an observation image in each of the speckle images.
- an observation image can be generated by drawing, at the central position of each speckle of a blank image, a point having an appropriate size. Specifically, by turning the size of pixels of a blank image into an appropriate size (for example a square pixel with the length of each side being 5nm through 20nm) and by plotting the central position of each speckle to each pixel, an observation image can be generated.
- the control unit 50 records the data of the generated observation image in the storage unit 70 and also displays it in the display unit 60.
- probes that are specific to respective target substances refer to probes that repeatedly bind to and dissociate from the respective target substances directly and specifically. It is preferable that the sample be washed sufficiently between the respective imaging steps. Then, the control unit 50 can generate an observation image of each target substance in the sample from a plurality of speckle images, stored in the storage unit 70, obtained in the respective imaging steps.
- the above is an embodiment of the observation method of the present invention that uses a probe containing a fluorescent substance as a luminescent substance.
- a luminescent substance is a luminescent substance that is not a fluorescent substance
- the method of the present invention can be implemented through the same procedures as that described above if means for providing a condition in a sample mounted on the stage 21 for that luminescent substance to radiate light instead of the excitation illumination devices 10 in the microscope apparatus 1 is arranged and the camera 30 that can pick up an image of light emitted by the luminescent substance in the probe having bound to a target substance in the sample as a speckle is used.
- any kit may be used as the above kit as long as it includes at least a probe of the above various forms and it may further include a different element used for observing a target substance.
- a different element for the above kit may include a medium such as a liquid medium for dissolving or dispersing the probe etc., a reagent to be used for a process of observing a sample etc.
- the above medium may be a medium that includes a probe and that is used for bringing it into contact with a sample for performing observation.
- the probe and a different element in the above kit are usually wrapped separately so that they will not be mixed physically.
- the present invention also provides a screening method of a site (also referred to as a target substance identification site or a binding substance) in which a target substance is identified in the probe according , the screening method including:
- Types of luminescent substances are not particularly limited in a target substance liked to the luminescent substance used in an observation step, however a fluorescent substance that can emit fluorescence when irradiated with excitation light is particularly preferable. Specific examples of a fluorescent substance are the same as those of the fluorescent substance described above for a probe.
- a target substance linked to a luminescent substance and a solid support to which a candidate substance is fixed are observed in a state in which they are in contact with each other, in a condition that allows observation, in units of 1 molecule, of emission of light by the luminescent substance in a probe-target complex of the target substance and the candidate substance.
- it is effective to reduce the concentration of the target substance in the medium. Even when a candidate substance is a bivalent antibody or antibody fragment having two antigen binding sites, reducing the concentration of the target substance in the medium makes it possible to observe binding of the target substance individually in each antigen binding site.
- Observation means in an observation step may appropriately be selected in accordance with the luminescent substance.
- the luminescent substance is a fluorescent substance
- observation is possible by using a fluorescence microscope (for example, TIRF fluorescence microscope).
- the candidate substance leading to the half-life of the probe-target complex that is equal to or more than 10 milliseconds and equal to or less than 3 seconds is selected as a target substance identification site.
- the half-life is more preferably equal to or more than 10 milliseconds and equal to or less than 2 seconds, more preferably equal to or more than 10 milliseconds and equal to or less than 1 second, more preferably equal to or more than 10 milliseconds and equal to or less than 900 milliseconds, more preferably equal to or more than 10 milliseconds and equal to or less than 800 milliseconds, more preferably equal to or more than 10 milliseconds and equal to or less than 700 milliseconds, more preferably equal to or more than 10 milliseconds and equal to or less than 600 milliseconds, more preferably equal to or more than 10 milliseconds and equal to or less than 500 milliseconds, more preferably equal to or more than 20 milliseconds more preferably equal to or
- the half-life is defined by a period of time before the number of target substances that bound to candidate substances on solid supports at a given moment is reduced to half through dissociation. Measurement procedures for the half-life are as below. A medium containing a target substance labeled with a luminescent substance is brought into contact with a solid support to which the candidate substance has been fixed, and a period of time between when a light emission speckle appears and when it disappears is measured, for each light emission speckle, while performing observation under a condition used for observation. Then, periods of time between the appearance and disappearance of the speckles are plotted in accordance with a complementary cumulative relative frequency function (1-Ndissociation). Then, by fitting the above complementary cumulative relative frequency with an exponent function, that half-life is calculated.
- a complementary cumulative relative frequency function (1-Ndissociation
- a period of time between appearance and disappearance of a light emission speckle based on a labeled target substance is measured by the following procedures. Specifically, while keeping a medium containing a labeled target substance in contact with a solid support to which the candidate substance has been immobilized and providing a prescribed condition necessary for emitting light (for example irradiation with excitation light), speckle images including speckles based on the light emission of the labeled target substance are consecutively picked up with an exposure time of X seconds (for example 0.050 seconds, 0.100 seconds, etc.) and at a frame rate of 1/XHz. Then, a period of time is measured between when a target substance having bound to a candidate substance appears in a speckle image and when it disappears through dissociation. In the above, observation is performed for Y consecutive frames, and for a speckle not observed in frames before and after them, the period of time between the appearance and disappearance of that speckle can be treated as YX seconds.
- the candidate substance is more preferably an antibody or a fragment of an antibody that binds to a prescribed target substance and fixes the antibody to a solid support in the immobilization step.
- ELISA is generally used in which target substances are immobilized to solid supports and candidate antibodies are brought into contact with the solid supports.
- an antibody is solid phased.
- an antigen (target substance) linked to a luminescent substance and the solid support are observed in a state in which they are in contact with each other, in a condition that allows observation, in units of 1 molecule, of emission of light by the luminescent substance in a probe-target complex formed by binding of the target substance and the candidate substance.
- a library of polypeptides and a library of phage display can be solid phased as candidate substances for a target substance identification site of a probe in addition to an antibody or an antibody fragment.
- a screening method of the present invention can also be applied to solid-phasing of them for performing screening for a polypeptide that binds to and dissociates from a target substance.
- EST clones encoding mouse MAP4, human Tau isoforms 3 and 4, mouse KIF1A, human plectin-1 and Xenopus laevis talin-1 were purchased from OpenBiosystems.
- cDNA encoding human FAK was purchased from the DNASU Plasmid Repository.
- GenBank/EMBL/DDBJ accession numbers for each sequence are as follows:
- Each cDNA was inserted into a pFLAG-EGFP-C1 vector or a p3 ⁇ FLAG-EGFP-N3 vector by using PCR.
- a pFLAG-EGFP-C1 vector was used for a probe having an N terminus at the fusion position of GFP in table 1 below.
- a p3 ⁇ FLAG-EGFP-N3 vector was used for a probe having a C terminus at the fusion position of GFP in table 1 below.
- An expression plasmid encoding PIPKI ⁇ fragment (amino acid residues 641-668) having an N terminus tagged with FLAG-EGFP was constructed by inserting a synthetic cDNA encoding PTDERSWVYSPLHYSAQAPPASDGESDT (sequence number 18) into a pFLAG-EGFP-C1 vector.
- amino acid sequence of EGFP is denoted by sequence number 1.
- amino acid sequence of 3 ⁇ FLAG is denoted by sequence number 3.
- amino acid sequence of mouse MAP4 is denoted by sequence number 4.
- amino acid sequence of human Tau isoform 3 is denoted by sequence number 5.
- amino acid sequence of human Tau isoform 4 is denoted by sequence number 6.
- amino acid sequence of mouse KIF1A is denoted by sequence number 7.
- amino acid sequence of human FAK is denoted by sequence number 10.
- amino acid sequence of human APC is denoted by sequence number 14.
- amino acid sequence of human PIPKI ⁇ -90 fragment (amino acid residues 641-668) is denoted by sequence number 18.
- amino acid sequence of Lifeact peptide is denoted by sequence number 19.
- exchangeable probes for super-resolution images of microtubules, intermediate filaments and focal adhesions, a test was conducted by using, as candidate molecules for probes, a protein (polypeptide) and a protein fragment that are known to be able to localize in each target structure.
- “Exchangeable” used herein refers to being able to repeatedly bind to and dissociate from a target structure.
- Table 1 shows the tested probe candidates. The test was conducted a plurality of times by using, as a probe candidate, a protein or a fragment of a protein mentioned in the section of "plasmid and reagent".
- Table 1 describes that "localization” is positive (P) when above criterion (1) is met, that "washability” is positive (P) when above criterion (2) is met and that "IRIS image” is positive (P) when above criterion (3) is met.
- a coverglass on which the sample was mounted was arranged in the observation chamber of a fluorescence microscope apparatus, which will be described in detail in the section of "procedures for imaging of multicolor super-resolution by IRIS" below, and speckle images of 10000 frames were obtained with an exposure time of 50ms or 100ms for one frame and at a frame rate of 20Hz (20 frames per second) or with an exposure time of 100ms and at a frame rate of 10Hz (10 frames per second) while irradiating the sample with a 488nm-laser beam line (with the main body output of 50mW but reaching the sample after being attenuated by AOTF etc.) for total internal reflection fluorescence observation.
- the obtained speckle images of 10000 frames were integrated so as to confirm whether or not a distribution of target substances in the cell (microtubule, intermediate filament, focal adhesion or actin filament) was able to be confirmed.
- target substances in the cell microtubule, intermediate filament, focal adhesion or actin filament
- the result of the localization test was treated as P (positive).
- Ndissociation is a cumulative relative frequency of probes that dissociated.
- the half-life was calculated.
- the binding half-life with respect to an actin filament of Atto488-Lifeact was measured by using a method that is described in detail in the section of Brief Description of the Drawings for FIG. 9 .
- Xenopus laevis XTC cells were cultured in 70% Leibovitz's L15 medium supplemented with 10% fetal bovine serum.
- a multicolor super-resolution image was produced from a large number of fluorescence single molecule speckle (SiMS) images that were sequentially obtained from a fixed and XTC cell (20,000 to 500,000 frames per probe) with various exchangeable probes.
- the cells were allowed to spread on a 0.1 mg/ml poly(L-lysine) and 10 ⁇ g/ml fibronectin-coated coverglass in 70% Leibovitz's L15 medium without serum and distinct stress fibers and focal adhesions were formed (document 33).
- cytoskeleton buffer containing 3.7% PFA and 0.55% Triton X-100 in (10mM Mes pH6.1, 90mM KCl, 3mM MgCl2, 2mM glycol ether diamine tetraacetic acid(EGTA)).
- the purified IRIS probes were brought into contact with the cells in an imaging solution including the HEPES-buffered solution (10mM Hepes pH 7.2, 90mM KCl, 3mM MgCl2, 100 ⁇ M DTT) with an oxygen-scavenging mix (200 ⁇ g/ml glucose oxidase, 35 ⁇ g/ml catalase, 4.5 mg/ml glucose, 0.5% 2-mercaptoethanol) (document 34) .
- the concentration of the probe was 1nM through 100nM.
- the oxygen-scavenging mix was not used, laser-induced photodamage was apparent after obtaining SiMS images several tens of thousands of times.
- imaging solution containing the probe was replaced with fresh imaging solution every 40 sets when the CLIP-170 fragment, the PIPKI ⁇ fragment, paxillin and the Src fragment were used and every 80 sets when Lifeact and the plectin-1 fragment were used.
- pick up of SiMS images was conducted in the order of the CLIP-170 fragment, the PIPKI ⁇ fragment (or Src fragment and paxillin), Lifeact and the plectin-1 fragment.
- washing was conducted 10 times by using the HEPES-buffered solution. Remaining fluorescence of probe was completely photobleached in the HEPES-buffered solution supplemented with an oxygen-scavenging mix, and the next probe was made to react.
- AN xdrift, ydrift
- xdrift xdrift, ydrift
- ydrift a function of variables xdrift and ydrift
- the xdrift and ydrift values leading to a maximum value as AN (xdrift, ydrift) were calculated by using a customized plug-in in ImageJ software (http://rsb.info.nih.gov/ij/).
- the drift of the bright-field image in the Nth set was corrected using the xdrift and ydrift values with pixel accuracy.
- the bright-field image and the corrected image in the first and Nth sets were enlarged by using a bicubic method.
- the drift distances were determined with subpixel accuracy.
- the central positions of speckles in the SiMS images in the Nth set were corrected with the drift distances.
- asuper-resolution image was produced.
- the positions of speckles consecutively observed in 10 or more frames or in 20 or more frames were not used when generating a reconstruction image (observation image) based on Lifeact or generating a reconstruction image (observation image) based on the plectin-1 fragment.
- the height of the observation target object was estimated from the ratio of an TIRF image and an epi-fluorescence image.
- the z position from the coverglass surface was measured by the method, described in document 18, using fluorescent microtubule that was tilted with respect to the coverglass in a low-melting-point agarose gel.
- HyLight 488-labeled tubulin was purchased from Cytoskeleton.
- the labeled microtubules were prepared according to the method described in document 18. Images of the tilted microtubules each having its one end touching the coverglass were picked up by TIRF and epi-fluorescence.
- ⁇ z ⁇ ⁇ z ln ⁇ F TIRF F Epi (where ⁇ z is the z position at which the intensity of TIRF illumination is 1/e, ⁇ is a parameter for calibrating the difference in the laser output between TIRF observation and epi-fluorescence observation, and F TIRF and F Epi are the fluorescence intensities of the target object in an TIRF image and an epi-fluorescence image, respectively)
- the z-position maps of three types of cytoskeletons were converted from the image of a ratio of the IRIS image (observation image) based on TIRF to the IRIS image (observation image) based on epi-fluorescence image.
- the peak intensity of the fluorescent speckle was also fitted by using DAOSTORM.
- the IRIS images were reconstructed by plotting the peak intensity at the central position of the speckle.
- the fluorescence intensity in an image resulting from adding the IRIS image based on TIRF and the IRIS image based on epi-fluorescence was masked by a threshold and noise in a region having no cytoskeletons was removed.
- the calculated z position represents the height of the center of gravity of the structure in the z axial direction.
- XTC cells were transfected with an expression plasmid of EGFP fused EB1.
- live-cell imaging of EB1-EGFP was conducted on the cells at one-second intervals.
- imaging with an exposure time of 100ms of fluorescence by excitation light for epi-fluorescence observation and imaging with an exposure time of 100ms of fluorescence by excitation light for total reflection fluorescence observation were conducted.
- each excitation light was emitted in the above conditions for IRIS super-resolution except that the excitation light was emitted after having its laser power reduced to about 20% of that used for IRIS super-resolution imaging in order to avoid damaging live cells.
- sequence number 18 represents an amino acid sequence of fragments 641-668 of PIPKI ⁇ 90.
- a probe candidate that had not passed either a localization test or a washing test received neither a test of an IRIS image nor half-life measurement, and thus is not described in the above table 1.
- a probe candidate that did not pass a test is estimated to have a very long or very short binding half-life to a target substance or to not bind to a target substance.
- the present inventors confirmed whether or not a super-resolution image can be generated through the IRIS method by using Lifeact, which is a widely used actin marker.
- Lifeact is a short peptide that stains an actin filament in a live cell or a fixed cell (document 10). Lifeact has a property of being exchanged within 0.4 seconds on an actin filament (document 10) .
- the high-speed exchangeability of Lifeact is confirmed through single molecule speckle (SiMS) microscopy (documents 11 to 13).
- the dwell time of Atto488-labeled Lifeact showed single exponential decay of a half-life of 23 milliseconds ( FIG. 9 (a) ).
- the present inventors selected a concentration of 2.
- a major problem in conventional super-resolution microscopy is that using an antibody and a photoactivatable fluorescent protein makes it difficult to label an observation target structure in a sufficient density.
- the actin subunit and the antibody have the widths of 6nm and 12nm, respectively, and accordingly a single actin filament having 360 subunits per 1 ⁇ m can only be used for labeling up to density of at most 180 per 1 ⁇ m in the labeling of antibodies.
- This labeling density is equivalent to the labeling density in an observation image reconstructed from speckle images of 2 ⁇ 10 3 frames in the IRIS method of the present inventors. As shown in the left view of FIG. 5(d) and in FIG.
- actin filaments show a pattern that is not continuous in the longitudinal direction in an observation image reconstructed from speckle images of 2 ⁇ 10 3 in the IRIS method. Even a labeling density that was 6.5 times its original was not sufficient for continuous staining of actin filaments ( FIG. 5(d) ), however it was possible to achieve a labeling density of 1.2 ⁇ 10 4 for an observation image reconstructed from speckle images of 2 ⁇ 10 5 frames and to obtain consecutive super-resolution images of actin filaments ( FIG. 5(d) and FIG. 5(e) ). As described above, it was made obvious that the IRIS method of the present invention can eliminate the problem of a labeling density that had conventionally been an obstacle to dissolving two or three types of target substances coexisting close to each other.
- the present inventors established an effective method for swiftly determining an IRIS probe for a different cell structure while taking into consideration a necessary molecular characteristic determined by data using a Lifeact probe.
- a probe candidate was generated by making a protein and an EGFP fuse with each other, the protein and the EGFP being known to bind to target substance.
- Live-cell fluorescence single molecule speckle (SiMS) microscopy (documents 11 and 12) is also effective for testing a probe candidate.
- the present inventors discovered that the binding specificity and dissociation dynamics of a probe candidate can easily be clarified by bringing crude lysate of a cell that expresses an EGFP fused probe candidate into contact with a fixed cell.
- the inventors selected an IRIS probe in the four steps as follows:
- the z position of each observation target object was estimated by using a signal ratio between an IRIS image based on TIRF and an IRIS image based on epi-fluorescence on the basis of measurements that used images of tilted fluorescent microtubules described in an above method (document 18).
- the 3D images as shown in FIG. 15 clarified the structure of the target substance.
- lamellipodia (LP), stress fibers (SF) and actin arcs (Arc) were distributed with the height positions of the centers of gravity (average ⁇ S.D.) of 42 ⁇ 43nm, 34 ⁇ 30nm and 217 ⁇ 132nm, respectively. (arrows in FIG. 15(a) and FIG. 15d ).
- the z positions of the microtubules became lower from 150nm through 200nm to 50nm through 100nm in the vicinity of the cell perimeters (arrowheads in FIG. 15(b) and FIG. 15(e) ).
- Intermediate filaments formed mesh-shaped structures throughout the cell body, and some of the filaments were located at a height of approximately 200nm behind the lamellipodium (ellipse in FIG. 15(c) ).
- An IRIS image makes it possible to observe a spatial relationship between a plurality of cytoskeletal structures in a single cell at a resolution capability exceeding the diffraction limit.
- intermediate filaments were tangled with actin stress fibers in many cases, but they are not tangled with microtubules ( FIG. 7 (a) through FIG. 7(c) ).
- the tangled actins and intermediate filaments appear to be linked to each other.
- Their cross-sectional profiles show that actin stress fibers overlapped intermediate filaments (arrows in FIG. 7(e) ).
- intermediate filaments did not tangle with actin stress fibers ( FIG. 7 (g) and FIG.
- IRIS can reveal region-specific proximity between 4 cytoskeletal components.
- microtubules locally change in the vicinity of focal adhesions and stress fibers.
- microtubules crossed focal adhesions and stress fibers, they were lifted to positions at 200nm from positions at 100nm from the glass surface (arrowheads in FIG. 8 (a), FIG. 8 (b) and FIG. 16 ) .
- Components of focal adhesions are located at a height of 30nm to 80nm from the glass surface (document 19). It appears that the lifted microtubules climbed on actin stress fibers without touching focal adhesions.
- the present inventors further investigated a relationship between a microtubule plus end and a cytoskeleton network in that portion by observing the behavior of EB1-EGFP in a live cell and then reconstructing a super-resolution image of a 3D cytoskeleton network after fixation.
- the imaging system of the present inventors makes it possible to perform live-cell 3D imaging with acousto-optic tunable filters for swiftly switching between total internal reflection illumination and epi-illumination.
- the trajectory of the tip of the EB1-labeled microtubule was compared with focal adhesions and stress fibers in a super-resolution image (asterisk in FIG. 8(c) ).
- a probe of IRIS can bind to and dissociate from a specific target protein from among various types of proteins existing in cell so as to make it possible to determine the position of the molecule thereof highly accurately.
- the concept of PAINT does not include a concept of obtaining a distribution of a plurality of target substances through probe exchange of IRIS.
- High resolution-capability imaging of various target substances by IRIS cannot be realized by the concept of PAINT.
- this document has does not disclose improving of resolution by increasing the number of times of observation in PAINT. The reason appears to be that even an increased number of times of measurement does not fix a lipid layer, which is a target substance, and thus the resolution does not improve through a change in the shape.
- the reason also seems to be that the problem of labeling density first became widely recognized a few years later than the document as an unsolved problem among those skilled in the art (documents 4 to 7).
- FIG. 10 an observation image of a microtubule based on IRIS and those based on STORM and Exchange-PAINT, which are conventionally known super-resolution microscopy, are compared (documents 21 to 23). According to the line profiles of label intensities along the longitudinal direction of microtubules, the observation image based on IRIS shows more continuous pattern than those of observation images based on STORM and Exchange-PAINT ( FIG.
- IRIS of the present invention In addition to the ability to overcome the problem of labeling density, according to IRIS of the present invention, it is easy to visualize a plurality of target substances by protein-based exchangeable probes and there are no limitations on the number of target substances. In super-resolution microscopy that has conventionally been known and available, only up to 2 target substances can be observed (documents 21, 22, 24 and 25). Recently, Exchange-PAINT, which makes it possible to conduct super-resolution observation of a plurality of target substances, was announced (document 23 ( Nature methods, 11, 313-318, 2014 )). Exchange-PAINT uses characteristic labeling means of hybridizing short and fluorescence-labeled DNA with complementary DNA conjugated to antibody molecules.
- probes of 19 are actually effective for the IRIS method.
- the above probes have been probes that use a binding partner known to associate with a target substance material, however the scope of the invention is not limited to this example.
- Using a phage display or assay that confirms interactions between proteins of yeast two hybrid system etc. makes it possible to perform screening for useful IRIS probes.
- DyLight 488 NHS Ester that had made no reactions was washed and removed by using PBS and only beads were collected through centrifugation.
- 1ml of 7 ⁇ g/ml papain dissolved in a Digestion Buffer 50mM Tris-HCl pH8.0, 10mM Cysteine-HCl, 2mM EDTA
- a Digestion Buffer 50mM Tris-HCl pH8.0, 10mM Cysteine-HCl, 2mM EDTA
- a Xenopus laevis XTC cell was fixed and received a permeabilization process.
- the Fab probes were brought into contact with the cells in an imaging solution comprising the HEPES-buffered solution (10mM Hepes pH 7.2, 90mM KCl, 3mM MgCl2, 100 ⁇ M DTT, 0.1% Triton X-100) supplemented with an oxygen-scavenging mix (200 ⁇ g/ml glucose oxidase, 35 ⁇ g/ml catalase, 4.5 mg/ml glucose, 0.5% 2-mercaptoethanol).
- the Fab probe concentration was 100nM in the imaging solution.
- SiMS images (speckle images) were obtained by using an inverted microscope (Olympus IX83-ZDC) equipped with an Olympus PlanApo 100 ⁇ /1.45-numerical aperture (NA) objective lens, a 2 ⁇ intermediate lens and an EM-CCD camera (Evolve 512, Roper) and controlled by MetaMorph software (Molecular Device).
- the half-life of a probe-target complex formed between a purified Fab probe and a target antigen was obtained in a similar method to that in Experiment 1.
- a period of time between when the Fab probe that had bound to the target appeared in a speckle image and it disappeared through dissociation was measured in a semi-manual mode by using Speckle TrackerJ, a plug-in of ImageJ.
- the number of binding probes with respect to the period of time between the appearance and disappearance was plotted in accordance with a complementary cumulative relative frequency function (1-Ndissociation).
- the half-life was calculated. The result showed that the half-life of a probe-target complex formed between the Fab probe and a target antigen was 216 milliseconds.
- a library (1200 samples) of hybridoma was generated by using FLAG peptide (sequence number 2) as an antigen. After immunizing a mouse with an antigen, lymphocytes were collected from an iliac lymph node and were made to fuse with a mouse myeloma cell, and hybridoma was generated. The library of hybridoma was made through dilution culture. Culture supernatant was collected for each sample from the hybridoma library and was made to react with a 96 well glass bottom plate in which Protein G was solid phased and thereby an antibody in the culture supernatant was fixed to the surface of the bottom glass.
- the 96 well glass bottom plate in which Protein G was solid phased and immobilization of the antibody were conducted in the following procedures.
- (3-aminopropyl) triethoxysilane was dissolved in a mixture of methanol and acetic acid (mixing ratio 100:5) and a 3% solution was produced.
- This solution was put in a 96 well multi-well plate having each of its wells made of glass, the solution was incubated for 30 minutes at an ambient temperature, and the glass surfaces of the well bottoms were coated.
- (3-aminopropyl) triethoxysilane that had made no reactions was washed a plurality of times with methanol so as to remove it and thereafter the plate was air dried so that (3-aminopropyl) triethoxysilane was made to remain on the glass surfaces.
- a 0.1% a glutaraldehyde solution was added to each well so as to cause reactions for 30 minutes at an ambient temperature and glutaraldehyde was made to bind to the glass surfaces.
- a 50ng/ ⁇ l Protein G(Thermo Scientific) solution was added to each well and was kept in contact with the glass surfaces to which glutaraldehyde bound, for 1 night at 4 degrees Celsius.
- Protein G causes covalent bonding with (3-aminopropyl) triethoxysilane via glutaraldehyde and is solid phased on the glass surfaces. Blocking was conducted on the glass surfaces on which Protein G was solid phased, with a 3% BSA solution for 1 night at 4 degrees Celsius. Thereafter, a hybridoma culture supernatant containing an antibody was added to each well and was left to stand for 1 night at 4 degrees Celsius. An antibody contained in the culture supernatant binds, specifically and strongly, to Protein G via the Fc domain thereof and is fixed to the glass surface.
- the glass surfaces were washed with a cell lysis buffer (10mM Hepes pH 7.2, 3mM MgCl2, 0.2% Triton X-100, 100 ⁇ M DTT), and received an observation step, which will be described later.
- a cell lysis buffer (10mM Hepes pH 7.2, 3mM MgCl2, 0.2% Triton X-100, 100 ⁇ M DTT)
- an HEK-293F cell was transfected with a plasmid that encoded FLAG-EGFP. After culturing the transfected cell for 3 to 4 days, it was dissolved in a cell lysis buffer (10mM Hepes pH 7.
- the numbers of the speckles in the field of view were 10 to 20 (0.006 to 0.012/ ⁇ m2). Then, the half-lives of binding between antibodies and FLAG-EGFP were measured by treating, as positive examples, a 26 well in which 40 (0.023/ ⁇ m2) or more speckles had been observed in the field of view. Each of the wells had different half-lives. The half-life in the well shown in FIG. 18A was 55ms.
- Expression vector-(CLONETECH) encoding pEGFP-actin was cut with restriction enzyme Age-I, Bgl-II (NEB) to remove EGFP from the vector.
- Synthetic cDNA encoding FLAG peptide (DYKDDDDK) was inserted into the vector and an expression plasmid encoding an actin for which FLAG was tagged to an N terminus was constructed.
- a Xenopus laevis XTC cell was transfected with the above expression plasmid in the following procedures.
- 3 ⁇ l of an expression plasmid of 1 ⁇ g/ ⁇ of FLAG fused actin was dissolved in 200 ⁇ l of a serum-free medium (70% dilution Leibovitz's L-15 medium) and 8 ⁇ of Polyethylenimine, linear, M.W. 25,000 (Polysciences) of 1mg/ml was added and it was vortexed. After leaving it to stand for 30 minutes at an ambient temperature, a medium with serum of 1ml (70% dilution Leibovitz's L-15 medium, 10%FCS supplement) was added. The solution containing this plasmid and the media of XTC cells spread in 6 wells were switched, and the cells were made to take in plasmids for 1 night.
- the cells were fixed and received the permeabilization process in the procedures described in detail in "procedures for imaging of multicolor super-resolution by IRIS" of experiment 1.
- the Fab probes were each brought into contact with the cells in an imaging solution comprising the HEPES-buffered solution (10mM Hepes pH 7.2, 3mM MgCl2, 100 ⁇ M DTT, 1 ⁇ g/ml leupeptin) supplemented with an oxygen-scavenging mix (200 ⁇ g/ml glucose oxidase, 35 ⁇ g/ml catalase, 4.5 mg/ml glucose, 0.5% 2-mercaptoethanol).
- the Fab probe concentration was 3nM in the imaging solution.
- SiMS images were obtained by using an inverted microscope (Olympus IX83-ZDC) equipped with an Olympus PlanApo 100 ⁇ /1.45-numerical aperture (NA) objective lens, a 2x intermediate lens and an electron-multiplying EM-CCD camera (Evolve 512, Roper) and controlled by MetaMorph software (Molecular Device).
- SiMS images (speckle images) of a total of 120,000 frames were picked up by conducting consecutive imaging of 500 frames for each under a condition such that the exposure time was 50 milliseconds for 1 frame and the frame rate (imaging speed) was 20Hz (20 frames per second).
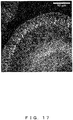
- FIG. 19 shows IRIS super-resolution images of FLAG fused actin by a Fab probe derived from an anti-FLAG monoclonal antibody selected by the above screening method.
- the half-life of a probe-target complex of a Fab probe and an FLAG fused actin used for the generation of these IRIS super-resolution images was 203 milliseconds.
- the present screening method made it possible to select a Fab probe appropriate for IRIS super-resolution imaging.
Applications Claiming Priority (2)
| Application Number | Priority Date | Filing Date | Title |
|---|---|---|---|
| JP2015048692 | 2015-03-11 | ||
| PCT/JP2016/057817 WO2016143900A1 (ja) | 2015-03-11 | 2016-03-11 | 結合解離プローブを用いた観察方法 |
Publications (2)
| Publication Number | Publication Date |
|---|---|
| EP3270159A1 true EP3270159A1 (de) | 2018-01-17 |
| EP3270159A4 EP3270159A4 (de) | 2018-08-08 |
Family
ID=56879622
Family Applications (1)
| Application Number | Title | Priority Date | Filing Date |
|---|---|---|---|
| EP16761865.1A Pending EP3270159A4 (de) | 2015-03-11 | 2016-03-11 | Beobachtungsverfahren mit einer bindungsdissoziationssonde |
Country Status (4)
| Country | Link |
|---|---|
| US (1) | US10858688B2 (de) |
| EP (1) | EP3270159A4 (de) |
| JP (1) | JP6422172B2 (de) |
| WO (1) | WO2016143900A1 (de) |
Families Citing this family (3)
| Publication number | Priority date | Publication date | Assignee | Title |
|---|---|---|---|---|
| US20200043159A1 (en) * | 2016-10-03 | 2020-02-06 | Nikon Corporation | Analysis device, analysis method, and program |
| FR3073050B1 (fr) * | 2017-11-02 | 2023-06-30 | Centre Nat Rech Scient | Appareil et procede de microscopie a fluorescence a super-resolution et de mesure de temps de vie de fluorescence |
| WO2024034543A1 (ja) * | 2022-08-08 | 2024-02-15 | 国立大学法人京都大学 | 多重抗原検出用抗体 |
Family Cites Families (12)
| Publication number | Priority date | Publication date | Assignee | Title |
|---|---|---|---|---|
| WO2002062201A2 (en) * | 2001-02-02 | 2002-08-15 | Dana-Farber Cancer Institute, Inc. | Rare event detection system |
| JP2008522761A (ja) * | 2004-12-08 | 2008-07-03 | ザ・ゼネラル・ホスピタル・コーポレーション | 規準化された蛍光又は生物発光撮像のためのシステムと方法 |
| EP2562266B1 (de) * | 2005-03-30 | 2016-02-24 | Olympus Corporation | Vorbestimmtes Standort-Lumineszenzmessverfahren, vorbestimmte Standort-Lumineszenzmessvorrichtung, Expressionsmengenmessverfahren und Messvorrichtung |
| EP2453240B1 (de) | 2005-05-23 | 2016-12-28 | Harald F. Hess | Optische Mikroskopie mit phototransformierbaren optischen Markern |
| US7776613B2 (en) * | 2006-08-07 | 2010-08-17 | President And Fellows Of Harvard College | Sub-diffraction image resolution and other imaging techniques |
| EP2288903A4 (de) * | 2008-05-16 | 2012-03-21 | Biomedical Photometrics Inc | Bildgebungssystem mit maximierung des dynamischen bereichs |
| JP5587020B2 (ja) * | 2010-04-19 | 2014-09-10 | 富士フイルム株式会社 | 内視鏡装置、内視鏡装置の作動方法およびプログラム |
| US9946058B2 (en) * | 2010-06-11 | 2018-04-17 | Nikon Corporation | Microscope apparatus and observation method |
| JP6006199B2 (ja) * | 2011-03-31 | 2016-10-12 | オリンパス株式会社 | 蛍光観察装置 |
| JP2014048082A (ja) * | 2012-08-30 | 2014-03-17 | Chiba Univ | 母乳中サイトカイン/ケモカイン値に基づく乳児アトピー性皮膚炎の発症予測 |
| US20150286887A1 (en) * | 2014-04-07 | 2015-10-08 | Massachusetts Institute Of Technology | Use of Microparticle Additives to Simultaneously Enable Artifact-Free Image Registration, Auto-Focusing, and Chromatic Aberration Correction in Microscopy |
| WO2015160690A1 (en) * | 2014-04-14 | 2015-10-22 | President And Fellows Of Harvard College | Photoconvertible fluorescent proteins |
-
2016
- 2016-03-11 WO PCT/JP2016/057817 patent/WO2016143900A1/ja active Application Filing
- 2016-03-11 JP JP2017505424A patent/JP6422172B2/ja active Active
- 2016-03-11 EP EP16761865.1A patent/EP3270159A4/de active Pending
-
2017
- 2017-09-05 US US15/696,089 patent/US10858688B2/en active Active
Also Published As
| Publication number | Publication date |
|---|---|
| US20170362630A1 (en) | 2017-12-21 |
| US10858688B2 (en) | 2020-12-08 |
| WO2016143900A1 (ja) | 2016-09-15 |
| JP6422172B2 (ja) | 2018-11-14 |
| EP3270159A4 (de) | 2018-08-08 |
| JPWO2016143900A1 (ja) | 2017-12-28 |
Similar Documents
| Publication | Publication Date | Title |
|---|---|---|
| Kiuchi et al. | Multitarget super-resolution microscopy with high-density labeling by exchangeable probes | |
| Li et al. | Single-molecule nanoscopy elucidates RNA polymerase II transcription at single genes in live cells | |
| Ringer et al. | Multiplexing molecular tension sensors reveals piconewton force gradient across talin-1 | |
| Bu et al. | Cdc42 interaction with N-WASP and Toca-1 regulates membrane tubulation, vesicle formation and vesicle motility: implications for endocytosis | |
| Annibale et al. | Identification of the factors affecting co-localization precision for quantitative multicolor localization microscopy | |
| US10858688B2 (en) | Observation method using binding and dissociation probe | |
| US8999669B2 (en) | Detection and visualization of the cell cycle in living cells | |
| Hatakeyama et al. | Regulatory mode shift of Tbc1d1 is required for acquisition of insulin-responsive GLUT4-trafficking activity | |
| Halstead et al. | TRICK: a single-molecule method for imaging the first round of translation in living cells and animals | |
| Vanslembrouck et al. | Microscopic visualization of cell-cell adhesion complexes at micro and nanoscale | |
| De Keersmaecker et al. | Mapping transient protein interactions at the nanoscale in living mammalian cells | |
| Engel et al. | Total internal reflection fluorescence (TIRF) microscopy of Chlamydomonas flagella | |
| Cheng et al. | A single-molecule localization microscopy method for tissues reveals nonrandom nuclear pore distribution in Drosophila | |
| Nouar et al. | Direct evidence for the interaction of stathmin along the length and the plus end of microtubules in cells | |
| Shirai et al. | Cortical actin nodes: Their dynamics and recruitment of podosomal proteins as revealed by super-resolution and single-molecule microscopy | |
| Galiani et al. | Diffusion and interaction dynamics of the cytosolic peroxisomal import receptor PEX5 | |
| Baggett et al. | Fluorescent labeling of yeast | |
| Hoess et al. | Dual-color and 3D super-resolution microscopy of multi-protein assemblies | |
| Bessa-Neto et al. | Bioorthogonal labeling of transmembrane proteins with non-canonical amino acids allows access to masked epitopes in live neurons | |
| Gerisch et al. | Wave patterns in cell membrane and actin cortex uncoupled from chemotactic signals | |
| Kanadome et al. | Development of intensiometric indicators for visualizing N-cadherin interaction across cells | |
| Cheng et al. | A method for single molecule localization microscopy of tissues reveals non-random distribution of nuclear pores in Drosophila | |
| Hargreaves et al. | Live-Cell SOFI Correlation with SMLM and AFM Imaging | |
| Barr et al. | Super-resolution analysis of TCR-dependent signaling: Single-molecule localization microscopy | |
| Tovey et al. | Confocal microscopy: theory and applications for cellular signaling |
Legal Events
| Date | Code | Title | Description |
|---|---|---|---|
| STAA | Information on the status of an ep patent application or granted ep patent |
Free format text: STATUS: THE INTERNATIONAL PUBLICATION HAS BEEN MADE |
|
| PUAI | Public reference made under article 153(3) epc to a published international application that has entered the european phase |
Free format text: ORIGINAL CODE: 0009012 |
|
| STAA | Information on the status of an ep patent application or granted ep patent |
Free format text: STATUS: REQUEST FOR EXAMINATION WAS MADE |
|
| 17P | Request for examination filed |
Effective date: 20170905 |
|
| AK | Designated contracting states |
Kind code of ref document: A1 Designated state(s): AL AT BE BG CH CY CZ DE DK EE ES FI FR GB GR HR HU IE IS IT LI LT LU LV MC MK MT NL NO PL PT RO RS SE SI SK SM TR |
|
| AX | Request for extension of the european patent |
Extension state: BA ME |
|
| DAV | Request for validation of the european patent (deleted) | ||
| DAX | Request for extension of the european patent (deleted) | ||
| A4 | Supplementary search report drawn up and despatched |
Effective date: 20180709 |
|
| RIC1 | Information provided on ipc code assigned before grant |
Ipc: G01N 21/64 20060101ALI20180703BHEP Ipc: G01N 33/536 20060101AFI20180703BHEP Ipc: C07K 1/13 20060101ALI20180703BHEP Ipc: G01N 33/48 20060101ALI20180703BHEP Ipc: C12Q 1/02 20060101ALI20180703BHEP Ipc: G01N 33/53 20060101ALI20180703BHEP |
|
| STAA | Information on the status of an ep patent application or granted ep patent |
Free format text: STATUS: EXAMINATION IS IN PROGRESS |
|
| 17Q | First examination report despatched |
Effective date: 20191024 |
|
| STAA | Information on the status of an ep patent application or granted ep patent |
Free format text: STATUS: EXAMINATION IS IN PROGRESS |