EP2738541A2 - Anzeigevorrichtung und Anzeigeverfahren für Streuungsdiagramme in Bezug auf Blutkörperchen, und Blutanalysegerät mit dieser Anzeigevorrichtung - Google Patents
Anzeigevorrichtung und Anzeigeverfahren für Streuungsdiagramme in Bezug auf Blutkörperchen, und Blutanalysegerät mit dieser Anzeigevorrichtung Download PDFInfo
- Publication number
- EP2738541A2 EP2738541A2 EP13194456.3A EP13194456A EP2738541A2 EP 2738541 A2 EP2738541 A2 EP 2738541A2 EP 13194456 A EP13194456 A EP 13194456A EP 2738541 A2 EP2738541 A2 EP 2738541A2
- Authority
- EP
- European Patent Office
- Prior art keywords
- display
- blood
- frequency
- scattergram
- dot
- Prior art date
- Legal status (The legal status is an assumption and is not a legal conclusion. Google has not performed a legal analysis and makes no representation as to the accuracy of the status listed.)
- Withdrawn
Links
Images


Classifications
-
- G—PHYSICS
- G06—COMPUTING OR CALCULATING; COUNTING
- G06F—ELECTRIC DIGITAL DATA PROCESSING
- G06F3/00—Input arrangements for transferring data to be processed into a form capable of being handled by the computer; Output arrangements for transferring data from processing unit to output unit, e.g. interface arrangements
- G06F3/01—Input arrangements or combined input and output arrangements for interaction between user and computer
- G06F3/048—Interaction techniques based on graphical user interfaces [GUI]
- G06F3/0484—Interaction techniques based on graphical user interfaces [GUI] for the control of specific functions or operations, e.g. selecting or manipulating an object, an image or a displayed text element, setting a parameter value or selecting a range
- G06F3/04847—Interaction techniques to control parameter settings, e.g. interaction with sliders or dials
-
- G—PHYSICS
- G01—MEASURING; TESTING
- G01N—INVESTIGATING OR ANALYSING MATERIALS BY DETERMINING THEIR CHEMICAL OR PHYSICAL PROPERTIES
- G01N15/00—Investigating characteristics of particles; Investigating permeability, pore-volume or surface-area of porous materials
- G01N15/10—Investigating individual particles
- G01N15/14—Optical investigation techniques, e.g. flow cytometry
-
- G—PHYSICS
- G01—MEASURING; TESTING
- G01N—INVESTIGATING OR ANALYSING MATERIALS BY DETERMINING THEIR CHEMICAL OR PHYSICAL PROPERTIES
- G01N15/00—Investigating characteristics of particles; Investigating permeability, pore-volume or surface-area of porous materials
- G01N15/01—Investigating characteristics of particles; Investigating permeability, pore-volume or surface-area of porous materials specially adapted for biological cells, e.g. blood cells
- G01N2015/011—Investigating characteristics of particles; Investigating permeability, pore-volume or surface-area of porous materials specially adapted for biological cells, e.g. blood cells with lysing, e.g. of erythrocytes
-
- G—PHYSICS
- G01—MEASURING; TESTING
- G01N—INVESTIGATING OR ANALYSING MATERIALS BY DETERMINING THEIR CHEMICAL OR PHYSICAL PROPERTIES
- G01N15/00—Investigating characteristics of particles; Investigating permeability, pore-volume or surface-area of porous materials
- G01N15/10—Investigating individual particles
- G01N15/14—Optical investigation techniques, e.g. flow cytometry
- G01N2015/1402—Data analysis by thresholding or gating operations performed on the acquired signals or stored data
Definitions
- the present invention relates to a display device for displaying a scattergram (also called scatter diagram, scatter plot, scatter plot graph and the like) showing the distribution state of the cells, particularly blood cells, a method of displaying the scattergram using the display device, and a blood analyzer composed of the display device.
- a scattergram also called scatter diagram, scatter plot, scatter plot graph and the like
- red blood cell mainly relates to the transport of oxygen, and the number thereof changes depending on the symptoms such as anemia, polycythemia and the like.
- changes in the morphology reflect various symptoms, for example, sickle-shaped (crescent-shaped) red blood cell means sickle cell anemia, compact red blood cell with an insufficient amount of hemoglobin means hypoferric anemia, large egg-shaped red blood cell means anemia due to the deficiency in folic acid or vitamin B12 (malignant anemia) and the like.
- reticulocyte increases and decreases reflecting the enhancement of or reduction in red blood cell production.
- leukocyte classification display methods such as LMNE matrix and the like using various techniques such as staining technique, impedance method, optical technique and the like, can measure leukocytes to divide into 5 classifications, can display the classification results to enable visual evaluation, and is an important method for diagnosing various diseases reflected by different blood cell numbers, ratios and the like for each sample (e.g., leukemia, malignant lymphoma, multiple myeloma and the like) (e.g., JP-A-2000-329685 ).
- LMNE matrix is one kind of scattergram relating to 4 kinds of leukocytes (namely, Lymphocyte (L), Monocyte (M), Neutrophil (N) and Eosinophil (E)), stained using a cell staining technique such as fat staining, peroxidase staining and the like.
- L Lymphocyte
- M Monocyte
- N Neutrophil
- E Eosinophil
- a conventional LMNE matrix as shown in Fig. 6 is a planar graph obtained when the three-dimensional frequency distribution as in Fig. 7 is seen from the above, and therefore, the frequency of each plotted dot does not appear on the graph. Therefor, even if the height of the mountain and coordinates of the top in each frequency distribution are calculated in the process of displaying the LMNE matrix, they cannot be expressed on the LMNE matrix.
- the present inventors have taken note of this point as a problem to be solved.
- the main constitution of the present invention capable of achieving the above-mentioned object is as follows.
- a blood analyzer comprising the display device of the present invention becomes a more useful analyzer for physical examination and diagnoses of various diseases.
- the [scattergram wherein frequency to be displayed can be freely changed by the user] of the present invention is also referred to as a "frequency-variable scattergram", or an "object scattergram” for the distinction thereof from the conventional scattergrams.
- Examples of the blood cells to be displayed as the object scattergram include, similar to conventional scattergram, red blood cells (including proerythroblast which is a premature stage of red blood cell, basophillic erythroblast, polychromatic erythroblast, orthochromatic erythroblast, reticulocyte, abnormal forms thereof), platelet (including abnormal forms such as large platelet, giant platelet and the like), and leukocyte (including neutrophil, eosinophil, basophil, lymphocyte, monocyte, atypical lymphocyte, abnormal lymphocyte, large lymphocyte, juvenile cell and the like).
- red blood cells including proerythroblast which is a premature stage of red blood cell, basophillic erythroblast, polychromatic erythroblast, orthochromatic erythroblast, reticulocyte, abnormal forms thereof
- platelet including abnormal forms such as large platelet, giant platelet and the like
- leukocyte including neutrophil, eosinophil, basophil, lymphocyte, monocyte, atypical lymphocyte, abnormal lymphocyte, large lymphocyte, juvenile cell and the like
- a set of measured data (measured data of X-axis item and measured data of Y-axis item) obtained for the analysis target blood cells comprise a set of numerical values output by an electric, or optical measuring device. Therefore, they are converted according to each scale of the X-axis and Y-axis to give a dot-data set, so that they can be plotted on the X-Y plane of the object scattergram.
- a preferable example for determining the display-condition range is the following processing.
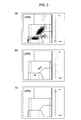
- the dot-data set is (volume of blood cell, absorbance of blood cell), and a model displayed on a simple square coarse screen is shown for explanation in the Figure, which are not to be construed as limitative.
- a user operates the track bar to select 100% (i.e., frequency 1), and the display screen shows dots of frequency 1 or more, i.e., all dots.
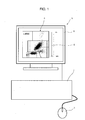
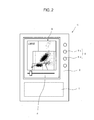
- FIG. 1 an example permitting intuitive quick operation is an embodiment shown in Fig. 1 , wherein the scattergram 3 as well as a track bar (also called a slider) 4 are displayed on the screen of the display 2.
- a user operates a coordinate input device 5 such as a mouse and the like to move the position of the slider knob of track bar 4, and the data processor receives a display-condition value corresponding to the position of the slider knob of the track bar 4 as an input value of the user.
- a coordinate input device 5 such as a mouse and the like to move the position of the slider knob of track bar 4
- the data processor receives a display-condition value corresponding to the position of the slider knob of the track bar 4 as an input value of the user.
- the given blood sample is subjected to a necessary cell staining processing such as fat staining, peroxidase staining and the like to give a sample solution permitting measurement of the above-mentioned 4 kinds of blood cells.
- a necessary cell staining processing such as fat staining, peroxidase staining and the like to give a sample solution permitting measurement of the above-mentioned 4 kinds of blood cells.
Landscapes
- Engineering & Computer Science (AREA)
- Chemical & Material Sciences (AREA)
- General Physics & Mathematics (AREA)
- Physics & Mathematics (AREA)
- General Engineering & Computer Science (AREA)
- Theoretical Computer Science (AREA)
- Analytical Chemistry (AREA)
- Biochemistry (AREA)
- General Health & Medical Sciences (AREA)
- Life Sciences & Earth Sciences (AREA)
- Immunology (AREA)
- Pathology (AREA)
- Health & Medical Sciences (AREA)
- Dispersion Chemistry (AREA)
- Human Computer Interaction (AREA)
- Investigating Or Analysing Biological Materials (AREA)
Applications Claiming Priority (1)
| Application Number | Priority Date | Filing Date | Title |
|---|---|---|---|
| JP2012260401A JP2014106161A (ja) | 2012-11-28 | 2012-11-28 | 血液細胞に関するスキャッターグラムの表示装置、表示方法、および、該表示装置を有する血液分析装置 |
Publications (1)
| Publication Number | Publication Date |
|---|---|
| EP2738541A2 true EP2738541A2 (de) | 2014-06-04 |
Family
ID=49949417
Family Applications (1)
| Application Number | Title | Priority Date | Filing Date |
|---|---|---|---|
| EP13194456.3A Withdrawn EP2738541A2 (de) | 2012-11-28 | 2013-11-26 | Anzeigevorrichtung und Anzeigeverfahren für Streuungsdiagramme in Bezug auf Blutkörperchen, und Blutanalysegerät mit dieser Anzeigevorrichtung |
Country Status (4)
| Country | Link |
|---|---|
| US (1) | US20140149938A1 (de) |
| EP (1) | EP2738541A2 (de) |
| JP (1) | JP2014106161A (de) |
| CN (1) | CN103852404A (de) |
Cited By (1)
| Publication number | Priority date | Publication date | Assignee | Title |
|---|---|---|---|---|
| EP2960640A1 (de) * | 2014-06-26 | 2015-12-30 | Azbil Corporation | Partikelerkennungsvorrichtung und partikelerkennungsverfahren |
Families Citing this family (9)
| Publication number | Priority date | Publication date | Assignee | Title |
|---|---|---|---|---|
| USD749115S1 (en) * | 2015-02-20 | 2016-02-09 | Translate Abroad, Inc. | Mobile device with graphical user interface |
| WO2017171762A1 (en) | 2016-03-30 | 2017-10-05 | Siemens Healthcare Diagnostics Inc. | Systems, methods, and apparatus for processing platelet cell data |
| WO2018110005A1 (ja) * | 2016-12-15 | 2018-06-21 | 株式会社堀場製作所 | 血液細胞に関するスキャッタグラムにおける分類境界線の決定方法、および当該方法を行うための処理部を有する血液分析装置 |
| CN107063981A (zh) * | 2017-02-28 | 2017-08-18 | 赛雷纳(中国)医疗科技有限公司 | 一种基于流式细胞术的数据集中处理方法 |
| WO2019206311A1 (zh) | 2018-04-28 | 2019-10-31 | 深圳迈瑞生物医疗电子股份有限公司 | 血液分析系统、血液分析仪、血液分析方法及存储介质 |
| CN116609243A (zh) * | 2018-04-28 | 2023-08-18 | 深圳迈瑞生物医疗电子股份有限公司 | 血液分析方法、血液分析系统及存储介质 |
| EP3789757B1 (de) * | 2018-04-28 | 2025-11-05 | Shenzhen Mindray Bio-Medical Electronics Co., Ltd. | Blutanalysegerät und analyseverfahren |
| JP7374943B2 (ja) * | 2021-02-26 | 2023-11-07 | シスメックス株式会社 | 表示方法および検体分析装置 |
| CN118777173A (zh) * | 2023-03-30 | 2024-10-15 | 深圳市帝迈生物技术有限公司 | 辅助诊断信息提供装置及血液分析系统 |
Family Cites Families (8)
| Publication number | Priority date | Publication date | Assignee | Title |
|---|---|---|---|---|
| JP3504029B2 (ja) * | 1995-07-04 | 2004-03-08 | シスメックス株式会社 | 粒子分析装置 |
| JP4136017B2 (ja) * | 1996-09-19 | 2008-08-20 | シスメックス株式会社 | 粒子分析装置 |
| JP3620946B2 (ja) * | 1997-03-17 | 2005-02-16 | シスメックス株式会社 | スキャッタグラムの表示方法および粒子計測装置 |
| JPH10260128A (ja) * | 1997-03-17 | 1998-09-29 | Toa Medical Electronics Co Ltd | スキャッタグラムの比較方法 |
| JPH1144632A (ja) * | 1997-07-28 | 1999-02-16 | Toa Medical Electronics Co Ltd | 粒子計測装置のデータ異常判定方法 |
| JP2004501358A (ja) * | 2000-05-11 | 2004-01-15 | ベクトン・ディキンソン・アンド・カンパニー | 最適な境界を有する平滑化された多角形を使用して散布図中のクラスタを識別するシステム |
| US20050192930A1 (en) * | 2004-02-27 | 2005-09-01 | Terradatum, Inc. | System and method of real estate data analysis and display to support business management |
| US9322834B2 (en) * | 2007-05-30 | 2016-04-26 | Sysmex Corporation | Sample analyzer, blood analyzer and displaying method |
-
2012
- 2012-11-28 JP JP2012260401A patent/JP2014106161A/ja not_active Ceased
-
2013
- 2013-11-26 EP EP13194456.3A patent/EP2738541A2/de not_active Withdrawn
- 2013-11-27 US US14/092,747 patent/US20140149938A1/en not_active Abandoned
- 2013-11-28 CN CN201310627200.5A patent/CN103852404A/zh active Pending
Cited By (1)
| Publication number | Priority date | Publication date | Assignee | Title |
|---|---|---|---|---|
| EP2960640A1 (de) * | 2014-06-26 | 2015-12-30 | Azbil Corporation | Partikelerkennungsvorrichtung und partikelerkennungsverfahren |
Also Published As
| Publication number | Publication date |
|---|---|
| CN103852404A (zh) | 2014-06-11 |
| US20140149938A1 (en) | 2014-05-29 |
| JP2014106161A (ja) | 2014-06-09 |
Similar Documents
| Publication | Publication Date | Title |
|---|---|---|
| EP2738541A2 (de) | Anzeigevorrichtung und Anzeigeverfahren für Streuungsdiagramme in Bezug auf Blutkörperchen, und Blutanalysegerät mit dieser Anzeigevorrichtung | |
| CN101097180B (zh) | 分析仪及分析方法 | |
| JP5530691B2 (ja) | 血球計数装置、診断支援装置、診断支援方法及びコンピュータプログラム | |
| EP3173767B1 (de) | Probenprüfsystem und informationsverarbeitungsverfahren | |
| US20250014243A1 (en) | Display method and specimen analysis device | |
| EP3797427A1 (de) | Platten zum testen auf sepsis | |
| US20220292855A1 (en) | Analysis method and analyzer | |
| Gibbs | ADVIA Haematology systems: a guide to cytogram interpretation | |
| JP2017129596A (ja) | 検体検査システム、情報処理装置、情報処理方法、およびプログラム | |
| JP6868132B2 (ja) | 検体検査システム、情報処理装置、情報処理方法、およびプログラム | |
| JP2000329685A (ja) | 血球分類マトリックス図表示装置、血球分類マトリックス図の表示方法および血球分類マトリックス図表示プログラムを記録した記録媒体 | |
| JP7774966B2 (ja) | 分析方法および分析装置 | |
| Sugiyama et al. | Performance evaluation of Celltac G: a new automated hematology analyzer | |
| JP7824031B2 (ja) | 分析方法および分析装置 | |
| JP7721289B2 (ja) | 分析方法および分析装置 | |
| WO2018110005A1 (ja) | 血液細胞に関するスキャッタグラムにおける分類境界線の決定方法、および当該方法を行うための処理部を有する血液分析装置 | |
| CN116125054A (zh) | 样本分析仪的检测方法和样本分析仪 | |
| Falda et al. | Is the interaction of technology useful in laboratory haematology diagnostics? | |
| CN116298335A (zh) | 样本分析仪及血细胞分析方法 | |
| JP2018146591A (ja) | 検体検査システム、情報処理装置、情報処理方法、およびプログラム |
Legal Events
| Date | Code | Title | Description |
|---|---|---|---|
| PUAI | Public reference made under article 153(3) epc to a published international application that has entered the european phase |
Free format text: ORIGINAL CODE: 0009012 |
|
| 17P | Request for examination filed |
Effective date: 20131126 |
|
| AK | Designated contracting states |
Kind code of ref document: A2 Designated state(s): AL AT BE BG CH CY CZ DE DK EE ES FI FR GB GR HR HU IE IS IT LI LT LU LV MC MK MT NL NO PL PT RO RS SE SI SK SM TR |
|
| AX | Request for extension of the european patent |
Extension state: BA ME |
|
| STAA | Information on the status of an ep patent application or granted ep patent |
Free format text: STATUS: THE APPLICATION HAS BEEN WITHDRAWN |
|
| 18W | Application withdrawn |
Effective date: 20150803 |