EP2270699A1 - Verfahren zur Normalisierung bei Metabolomanalyseverfahren mit endogenen Referenzmetaboliten - Google Patents
Verfahren zur Normalisierung bei Metabolomanalyseverfahren mit endogenen Referenzmetaboliten Download PDFInfo
- Publication number
- EP2270699A1 EP2270699A1 EP09164410A EP09164410A EP2270699A1 EP 2270699 A1 EP2270699 A1 EP 2270699A1 EP 09164410 A EP09164410 A EP 09164410A EP 09164410 A EP09164410 A EP 09164410A EP 2270699 A1 EP2270699 A1 EP 2270699A1
- Authority
- EP
- European Patent Office
- Prior art keywords
- acyl
- phosphatidylcholine
- residue sum
- residue
- sum
- Prior art date
- Legal status (The legal status is an assumption and is not a legal conclusion. Google has not performed a legal analysis and makes no representation as to the accuracy of the status listed.)
- Withdrawn
Links
Images


Classifications
-
- G—PHYSICS
- G16—INFORMATION AND COMMUNICATION TECHNOLOGY [ICT] SPECIALLY ADAPTED FOR SPECIFIC APPLICATION FIELDS
- G16B—BIOINFORMATICS, i.e. INFORMATION AND COMMUNICATION TECHNOLOGY [ICT] SPECIALLY ADAPTED FOR GENETIC OR PROTEIN-RELATED DATA PROCESSING IN COMPUTATIONAL MOLECULAR BIOLOGY
- G16B40/00—ICT specially adapted for biostatistics; ICT specially adapted for bioinformatics-related machine learning or data mining, e.g. knowledge discovery or pattern finding
- G16B40/10—Signal processing, e.g. from mass spectrometry [MS] or from PCR
-
- G—PHYSICS
- G16—INFORMATION AND COMMUNICATION TECHNOLOGY [ICT] SPECIALLY ADAPTED FOR SPECIFIC APPLICATION FIELDS
- G16B—BIOINFORMATICS, i.e. INFORMATION AND COMMUNICATION TECHNOLOGY [ICT] SPECIALLY ADAPTED FOR GENETIC OR PROTEIN-RELATED DATA PROCESSING IN COMPUTATIONAL MOLECULAR BIOLOGY
- G16B40/00—ICT specially adapted for biostatistics; ICT specially adapted for bioinformatics-related machine learning or data mining, e.g. knowledge discovery or pattern finding
- G16B40/20—Supervised data analysis
-
- G—PHYSICS
- G01—MEASURING; TESTING
- G01N—INVESTIGATING OR ANALYSING MATERIALS BY DETERMINING THEIR CHEMICAL OR PHYSICAL PROPERTIES
- G01N2800/00—Detection or diagnosis of diseases
- G01N2800/60—Complex ways of combining multiple protein biomarkers for diagnosis
-
- Y—GENERAL TAGGING OF NEW TECHNOLOGICAL DEVELOPMENTS; GENERAL TAGGING OF CROSS-SECTIONAL TECHNOLOGIES SPANNING OVER SEVERAL SECTIONS OF THE IPC; TECHNICAL SUBJECTS COVERED BY FORMER USPC CROSS-REFERENCE ART COLLECTIONS [XRACs] AND DIGESTS
- Y02—TECHNOLOGIES OR APPLICATIONS FOR MITIGATION OR ADAPTATION AGAINST CLIMATE CHANGE
- Y02A—TECHNOLOGIES FOR ADAPTATION TO CLIMATE CHANGE
- Y02A90/00—Technologies having an indirect contribution to adaptation to climate change
- Y02A90/10—Information and communication technologies [ICT] supporting adaptation to climate change, e.g. for weather forecasting or climate simulation
-
- Y—GENERAL TAGGING OF NEW TECHNOLOGICAL DEVELOPMENTS; GENERAL TAGGING OF CROSS-SECTIONAL TECHNOLOGIES SPANNING OVER SEVERAL SECTIONS OF THE IPC; TECHNICAL SUBJECTS COVERED BY FORMER USPC CROSS-REFERENCE ART COLLECTIONS [XRACs] AND DIGESTS
- Y10—TECHNICAL SUBJECTS COVERED BY FORMER USPC
- Y10T—TECHNICAL SUBJECTS COVERED BY FORMER US CLASSIFICATION
- Y10T436/00—Chemistry: analytical and immunological testing
- Y10T436/16—Phosphorus containing
- Y10T436/163333—Organic [e.g., chemical warfare agents, insecticides, etc.]
-
- Y—GENERAL TAGGING OF NEW TECHNOLOGICAL DEVELOPMENTS; GENERAL TAGGING OF CROSS-SECTIONAL TECHNOLOGIES SPANNING OVER SEVERAL SECTIONS OF THE IPC; TECHNICAL SUBJECTS COVERED BY FORMER USPC CROSS-REFERENCE ART COLLECTIONS [XRACs] AND DIGESTS
- Y10—TECHNICAL SUBJECTS COVERED BY FORMER USPC
- Y10T—TECHNICAL SUBJECTS COVERED BY FORMER US CLASSIFICATION
- Y10T436/00—Chemistry: analytical and immunological testing
- Y10T436/20—Oxygen containing
- Y10T436/200833—Carbonyl, ether, aldehyde or ketone containing
- Y10T436/201666—Carboxylic acid
Definitions
- the present invention relates to a method for normalization of intensity data corresponding to amounts and/or concentrations of selected target metabolites in a biological sample of a mammalian subject, wherein said intensity data are obtained by a metabolomics analysis method with one or a plurality of endogenous reference metabolites in accordance with claim 1, and to a use of one or a plurality of compounds or derivatives thereof, wherein said compounds have a molecular mass less than 1500 Da, as endogenous reference metabolites in metabolomics analysis methods, in accordance with claim 13.
- the present invention relates to the field of metabolomics. More specifically, the present invention concerns a method for normalizing signals to be compared in assays for metabolites. This novel method relies on the use of endogenous metabolite concentrations as an internal standard and allows determination of the concentrations and relative abundance as well as direct comparisons between any samples.
- the invention thus relates to the use of metabolite concentrations and the comparison of metabolite levels between different species, tissues and between different cells.
- the invention provides the identity and use of reference, control or normalization metabolites, the level of which remains consistent in individual cells, even under different conditions, as well as among body liquid, cells and tissue from different samples, species and origins.
- normalization refers to a data adjustment step that follows signal extraction and processing and precedes data dissemination and subsequent statistical treatment (Preprocessing, classification modeling and feature selection using flow injection electrospray mass spectrometry metabolite fingerprint data, D.P. Enot, W. Lin, M. Beckmann, D. Parker, D.P. Overy and J. Draper: Nature Protocols, 2008, 3, 446-470 ; Metabolomics by numbers: acquiring and understanding global metabolite data, R. Goodacre, S. Vaidyanathan, W.B. Dunn, .G. Harrigan and D.B. Kell: TRENDS in Biotechnology 2004, 22(5) 245-252 ). Normalization methods in metabolomics data to compare data generated at different days, on different machines, in various dilutions etc. are still a matter of debate, far from a gold standard or even from a uniform recommendation.
- More general methods make use of control samples on a plate to control variations in overall plate quality (e.g. standard batch and method of standard preparation) or measuring differences.
- Applicable normalization strategies are based on some underlying assumptions regarding the data and the strategies used for each experiment. These strategies must therefore be adjusted to reflect both the system under study and the experimental design. A primary assumption is that for some added set of controls, the ratio of measured concentrations averaged over the set should be close to unity.
- a data correction and validation strategy provides for a weighted average of metabolite derivatives after derivatization of an original metabolite.
- a sample is combined with a derivatizing agent to produce derivatives and a separation-molecular ID and quantification process is performed on the derivatives to obtain corresponding peak areas, comprising: measuring the peak areas of the derivatives.
- the present invention relates to:
- the plurality of intensities of the target and endogenous reference metabolites are subjected to a mathematical preprocessing, in particular transformations such as applying logarithms, generalized logarithms, power transformations.
- said plurality of intensities of the endogenous reference metabolites are aggregated to one reference value.
- the plurality of intensities of the endogenous reference metabolites are aggregated to one reference value by calculation of geometric mean value, arithmetic mean value, median value, weighted arithmetic mean value.
- a ratio can be formed by each of the intensities of the target metabolites and the determined reference value in case of linear intensities, or the determined reference value is subtracted from each target metabolite intensity in case of logarithmic intensities.
- said metabolomics analysis method comprises the generation of intensity data for the quantitation of endogenous metabolites by mass spectrometry (MS), in particular MS-technologies such as Matrix Assisted Laser Desorption/lonisation (MALDI), Electro Spray Ionization (ESI), Atmospheric Pressure Chemical Ionization (APCI), 1 H-, 13 C- and/or 31 P- Nuclear Magnetic Resonance spectroscopy (NMR), optionally coupled to MS, determination of metabolite concentrations by use of MS-technologies and/or methods coupled to separation, in particular Liquid Chromatography (LC-MS), Gas Chromatography (GC-MS), or Capillary Electrophoresis (CE-MS), which technologies are well known to the skilled person.
- MS-technologies such as Matrix Assisted Laser Desorption/lonisation (MALDI), Electro Spray Ionization (ESI), Atmospheric Pressure Chemical Ionization (APCI), 1 H-, 13 C- and/or 31 P- Nuclear Magnetic Resonance spectroscopy (N
- metabolites as the endogenous reference metabolites which show stability in accordance with statistical stability measures being selected from the group consisting of coefficient of variation (CV) of raw intensity data, standard deviation (SD) of logarithmic intensity data, stability measure (M) of geNorm - algorithm or stability measure value (rho) of NormFinder-algorithm.
- CV coefficient of variation
- SD standard deviation
- M stability measure
- rho stability measure value
- Such metabolites as endogenous reference metabolites which show stability in accordance with at least 2 statistical stability measures being selected from the group consisting of coefficient of variation (CV) of raw intensity data, standard deviation (SD) of logarithmic intensity data, stability measure (M) of geNorm - algorithm or stability measure value (rho) of NormFinder-algorithm, and/or such endogenous reference metabolites being in particular selected from the group consisting of:
- said selected endogenous reference metabolites show stability in accordance with at least 3 statistical stability measures being selected from the group consisting of coefficient of variation (CV) of raw intensity data, standard deviation (SD) of logarithmic intensity data, stability measure (M) of geNorm - algorithm or stability measure value (rho) of NormFinder-algorithm, and/or such endogenous reference metabolites being in particular selected from the group consisting of:
- a further preferred method according to the present invention uses endogenous reference metabolites which show stability in accordance with all statistical stability measures being selected from the group consisting of coefficient of variation (CV) of raw intensity data, standard deviation (SD) of logarithmic intensity data, stability measure (M) of geNorm - algorithm or stability measure value (rho) of NormFinder-algorithm, and/or such endogenous reference metabolites being in particular Phosphatidylcholine with diacyl residue sum C42:6, wherein the designation "C42:6" represents the chain length of the acyl residues, 42 represents the number of total carbon atoms in the acyl residues, and 6 represents the number of total double bonds in the residues.
- CV coefficient of variation
- SD standard deviation
- M stability measure
- rho stability measure value of NormFinder-algorithm
- said plurality of endogenous reference metabolites comprises 2 to 80, in particular 2 to 60, preferably 2 to 50, preferred 2 to 30, more preferred 2 to 10, particularly preferred 2 to 10, preferably 3 to 5 endogenous reference metabolites.
- a further embodiment of the present invention is use of one or a plurality of compounds or derivatives thereof wherein said compounds have a molecular mass less than 1500 Da as endogenous reference metabolites in metabolomics analysis methods, wherein said endogenous reference metabolites are selected from the group consisting of:
- said metabolomics analysis methods comprise the quantitation of endogenous target and reference metabolites by mass spectrometry (MS), in particular MS-technologies such as Matrix Assisted Laser Desorption/lonisation (MALDI), Electro Spray Ionization (ESI), Atmospheric Pressure Chemical Ionization (APCI), 1 H-, 13 C- and/or 31 P- Nuclear Magnetic Resonance spectroscopy (NMR), optionally coupled to MS, determination of metabolite concentrations by use of MS-technologies and/or methods coupled to separation, in particular Liquid Chromatography (LC-MS), Gas Chromatography (GC-MS), or Capillary Electrophoresis (CE-MS).
- MS-technologies such as Matrix Assisted Laser Desorption/lonisation (MALDI), Electro Spray Ionization (ESI), Atmospheric Pressure Chemical Ionization (APCI), 1 H-, 13 C- and/or 31 P- Nuclear Magnetic Resonance spectroscopy (NMR), optionally coupled to MS, determination of metabolit
- Particularly preferred compounds which can be used as endogenous reference metabolites in accordance with the present invention are selected from the group consisting of:
- Another advantageous embodiment of the present invention is the use of such compounds as endogenous reference metabolites, which show stability in accordance with statistical stability measures being selected from the group consisting of coefficient of variation (CV) of raw intensity data, standard deviation (SD) of logarithmic intensity data, stability measure (M) of geNorm - algorithm or stability measure value (rho) of NormFinder-algorithm.
- CV coefficient of variation
- SD standard deviation
- M stability measure
- rho stability measure value
- such compounds can be used as endogenous reference metabolites which show stability in accordance with at least 2 statistical stability measures being selected from the group consisting of coefficient of variation (CV) of raw intensity data, standard deviation (SD) of logarithmic intensity data, stability measure (M) of geNorm - algorithm or stability measure value (rho) of NormFinder-algorithm, and/or such endogenous reference metabolites being in particular selected from the group consisting of:
- Another advantageous use according to the invention is the use of such endogenous reference metabolites which show stability in accordance with at least 3 statistical stability measures being selected from the group consisting of coefficient of variation (CV) of raw intensity data, standard deviation (SD) of logarithmic intensity data, stability measure (M) of geNorm - algorithm or stability measure value (rho) of NormFinder-algorithm, and/or such endogenous reference metabolites being in particular selected from the group consisting of:
- CV coefficient of variation
- SD standard deviation
- M stability measure
- rho stability measure value
- NormFinder-algorithm NormFinder-algorithm
- normalization should allow also a direct comparison of data obtained from different sample types, of different species and determined on different assay platforms and by different laboratories. Additional, more specifically mass-spectrometry-related unsolved problems comprise matrix-specific signal suppression or ion suppression, detrimental to cross-matrix, cross- tissue and cross-species comparison of data.
- an ideal endogenous standard for metabolomics would be a compound or a set of compounds whose concentration levels do not vary during the cell cycle, between cell types, between various states of a disease, between various states of health or in response to experimental treatments that one wishes to examine. Additionally, for an endogenous standard (that is endogenous metabolites) to be valid in metabolomics it is crucial that it be of a similar relative abundance as the test and reference (or target) metabolite in the metabolite assay. Such molecules have not been described so far, nor a method utilizing these molecules in the context of quantitative multiparametric metabolomics and determination of metabolite levels using mass spectroscopy or any other method affording quantitative or relative concentration data.
- an exogenously added standard has the advantage of giving the user control over the amount of compound added, with low variation between samples. Using an exogenous standard does not, however, control differences in the quality of the starting material or the tissue for workup then subjected to analysis. If there are differences in the levels of integrity of the metabolites between otherwise identical samples, the extraction yield will reflect this variation, although the external standards will still appear identical.
- the inventors investigated whether it will be possible to identify a plurality of metabolites with minimal changes of concentrations or "constant" levels which can be used for normalization, thus prerequisite for the identification, determination, quantitation and application of disease associated concentration changes of other, variable metabolites and the application of these reference or control metabolites, in conjunction with a determination of variable metabolites, in diagnostic tools.
- the invention shows that subsets of endogenous reference metabolites or housekeeper metabolites actually exist and that for these metabolites the distribution of levels remains -within defined limits-constant or have some mean values and standard deviations that surprisingly are independent of any particular sample, physiological conditions of a subject, sample workup, and tissue.
- the present invention provides a general method and a novel solution to the problem of normalizing metabolite data, a general method to generate endogenous reference metabolites, a method to use endogenous reference metabolites as well as a list of endogenous reference compounds and metabolites.
- a further object of the present invention is to address and resolve the above outlined problems in metabolomics data normalization and data applications by generating and providing a list of novel endogenous standards for normalizing the relative intensities of signals in metabolite and metabolomics assays, a method for the application of these standards in normalization and thus in quantitative metabolite determination and diagnosis.
- the invention provides a solution to the comparison, quantification and normalization and thus application of metabolomics data, generated by quantitation of endogenous metabolites by, but not limited to, mass spectrometry (MS), in particular MS-technologies such as MALDI, ESI, atmospheric pressure pressure chemical ionization (APCI), and other methods, determination of metabolite concentrations by use of MS-technologies or alternative methods coupled to separation (LC-MS, LC-NMR, GC-MS, CE-MS), subsequent feature selection and /or the combination of features to classifiers including molecular data of at least two molecules or at least tow analytes of the same or different molecules and to the comparison of these data obtained from different subjects, different species, different time points of sampling, processed by different people and under varying experimental conditions.
- MS mass spectrometry
- MS-technologies such as MALDI, ESI, atmospheric pressure pressure chemical ionization (APCI), and other methods
- determination of metabolite concentrations by use of MS-technologies or alternative
- This invention thus provides robust control metabolites, surprisingly displaying almost unchanged levels among various species, animal model, conditions of health, sample type, sample workup and experimental settings, tissue type or body liquid, sample processing and assay conditions as well as analytical determination of contents, allowing normalization, identification and application of metabolites characteristic for distinct biological states or associated with distinct diseases, respectively the grade of such diseases and their response to therapy in man or in mammalian model systems, irrespective of the experimental set-up and the assay platform.
- the invention further relates to the use of metabolite measurements, such as to diagnose, classify or identify a disease, to prognose future development, to distinguish various states of disease, control treatment regimens or lengths of treatment, control consequences of drug intake or consequences of varying endogenous drug concentrations or any consequences on the levels of endogenous metabolites due to experimental conditions. It provides a reference point and appropriate underlying values to identify and recognize disease-associated metabolic changes and thus applications in diagnosis and therapeutic monitoring.
- metabolite measurements relies upon the ability to detect or measure differential concentration of metabolites in body liquids, cells and tissue.
- Metabolites analyzed include those which are differentially detected in a manner that is relevant to the biological phenotype of interest.
- the metabolite level(s) of one or more differentially concentrated metabolites is determined in the cell(s), tissues or body liquids of a sample or subject, after which the metabolite concentration level(s) of the one or more analytes are used directly or, in the case of determination of multiple analytes, in comparison to each other.
- One non-limiting example of the latter case is where the metabolite concentration levels of two samples are determined and then used as a ratio of one to the other.
- the comparison of metabolite levels in a cell, tissue, body liquid, as well as between specimen of different samples and/or origins and across experiments or dates of experimental measurement is improved when the levels are normalized to a reference. This can be viewed as normalization to a single scale.
- normalization such as, but not limited to, where metabolomics or metabolomics kits with multiple probes are used to determine metabolite levels, allows for direct assay to assay or in case of assays on multi-well plates, plate to plate comparisons.
- Mass Spectrometry is a technique for measuring and analyzing molecules that involves fragmenting a target molecule, then analyzing the fragments, based on their mass/charge ratios, to produce a mass spectrum that serves as a "molecular fingerprint". Determining the mass/charge ratio of an object is done through means of determining the wavelengths at which electromagnetic energy is absorbed by that object. There are several commonly used methods to determine the mass to charge ratio of an ion, some measuring the interaction of the ion trajectory with electromagnetic waves, others measuring the time an ion takes to travel a given distance, or a combination of both. The data from these fragment mass measurements can be searched against databases to obtain
- Mass spectrometry is also widely used in other areas of chemistry, like petrochemistry or pharmaceutical quality control, among many others.
- An “ion” is a charged object formed by adding electrons to or removing electrons from an atom.
- a “mass spectrum” is a plot of data produced by a mass spectrometer, typically containing m/z values on x-axis and intensity values on y-axis.
- the term “m/z” refers to the dimensionless quantity formed by dividing the mass number of an ion by its absolute charge number. It has long been called the “mass-to-charge” ratio.
- the term "metabolite” denotes endogenous organic compounds of a cell, an organism, a tissue or being present in body liquids and in extracts obtained from the aforementioned sources with a molecular weight typically below 1500 Dalton.
- Typical examples of metabolites are carbohydrates, lipids, phospholipids, sphingolipids and sphingophospholipids, amino acids, cholesterol, steroid hormones and oxidized sterols and other compounds such as collected in the Human Metabolite database [ Wishart DS et al., HMDB: the Human Metabolome Database. Nucleic Acids Res. 2007 Jan;35(Database issue):D521-6 (see http://www.hmdb.ca/ ) ] and other databases and literature. This includes any substance produced by metabolism or by a metabolic process and any substance involved in metabolism.
- metabolism refers to the chemical changes that occur within the tissues of an organism, including “anabolism” and “catabolism”. Anabolism refers to biosynthesis or the buildup of molecules and catabolism refers to the breakdown of molecules.
- Methodomics designates the comprehensive quantitative measurement of several (2-thousands) metabolites by, but not limited to, methods such as mass spectroscopy, coupling of liquid chromatography, gas chromatography and other separation methods chromatography with mass spectroscopy or nuclear magnetic resonance (NMR).
- Matrix denotes the sample type for analysis or sample work-up such as body liquids (plasma, blood) different tissues (eg. brain and liver), different parts from an organism such as leaves compared to roots obtained from plants etc.
- Different matrices may also include the same type of tissue or body liquid but from different species such as eg. rat plasma compared to human plasma.
- a biomarker in this context is a characteristic, comprising data of at least one metabolite that is measured and evaluated as an indicator of biologic processes, pathogenic processes, or responses to a therapeutic intervention associated with a diseased state or related treatment.
- a combined biomarker as used here may be selected from at least two small endogenous molecules and metabolites.
- Analyte denotes the chemical entity or mixtures of compounds as analysed. Given limitations to structural resolution of the techniques (mass spectroscopy) that is position of double bond(s), structural isomers varying in configuration (e.g. positions of fatty acid residues in phospholipids or triglycerides) one analyte can thus formally include more than 1 metabolite.
- housekeeping metabolite or analyte, reference or control metabolites are exchangeable in the invention and denote metabolites and analytes with small variations in amounts and concentration levels in-between several samples when different samples of different subjects with various physiological conditions, various states of health or therapy or pre-treatment are compared.
- a control-, reference- or housekeeping metabolite thus is a metabolite with minimal changes of concentration along several samples and which, therefore, can be used as endogenous reference metabolite.
- These endogenous reference metabolites thus can compensate for variability associated with technical set up, sample handling, experimental work up, and random fluctuation in metabolomics.
- a endogenous reference metabolite is preferably not differentially present at a level that is statistically significant (e.g., a p-value less than 0.05 and/or a q-value of less than 0.05). Exemplary asphyxia-specific endogenous reference metabolites are described in the detailed description and experimental sections below.
- disease specific endogenous reference metabolite refers to a metabolite that is not differentially present or differentially concentrated in diseased organisms compared to non-diseased organisms.
- asphyxia specific endogenous reference metabolite refers to a metabolite that has the same concentration level in asphyctic organisms compared to non-asphyctic organisms with a low variability.
- target metabolite refers to a metabolite that is differentially present or differentially concentrated under different conditions or different treatment such as eg. diseased organisms compared to non-diseased organisms, in treated organisms compared to non-treated organisms etc.
- asphyxia specific metabolite refers to a metabolite that is differentially present or differentially concentrated in asphyctic organisms compared to non-asphyctic organisms.
- sample in the present specification and claims is used in its broadest sense. On the one hand it is meant to include a specimen or culture. On the other hand, it is meant to include both biological and environmental samples.
- a sample may include a specimen of synthetic origin.
- Biological samples may be animal, including human, fluid, solid (e.g., stool) or tissue, as well as liquid and solid food and feed products and ingredients such as dairy items, vegetables, meat and meat by-products, and waste.
- Biological samples may be obtained from all of the various families of domestic animals, as well as feral or wild animals, including, but not limited to, such animals as ungulates, bear, fish, rodents, etc.
- a biological sample may contain any biological material suitable for detecting the desired biomarkers, and may comprise cellular and/or non-cellular material from a subject.
- the sample can be isolated from any suitable biological tissue or fluid such as, for example, tissue, blood, blood plasma, urine, or cerebral spinal fluid (CSF), plant extract or processed biological material (e.g. food).
- suitable biological tissue or fluid such as, for example, tissue, blood, blood plasma, urine, or cerebral spinal fluid (CSF), plant extract or processed biological material (e.g. food).
- cell refers to any eukaryotic or prokaryotic cell (e.g., bacterial cells such as E. coli, yeast cells, mammalian cells, avian cells, amphibian cells, plant cells, fish cells, and insect cells), whether located in vitro or in vivo.
- bacterial cells such as E. coli, yeast cells, mammalian cells, avian cells, amphibian cells, plant cells, fish cells, and insect cells
- detect may describe either the general act of discovering or discerning or the specific observation of a detectably labeled or unlabeled composition.
- Normalization as understood in this context denotes a procedure to make metabolomics data of different assays comparable by reduction or elimination of technical variability. In this kind of comparative analysis, normalization is essential to compensate for variations in isolation techniques, initial quantification errors, tube to tube variation in preceding chemical or enzymatic modification and other experimental variations.
- Step 1 Biological sample obtained
- Step 2 Measurement of raw data (concentrations of biomolecules) and deposit in data base
- Step 3 Preprocessing of raw data from data base
- Step 4 Selection of most stable housekeeping metabolites
- Step 5 Normalization of target metabolites
- Step 6 Statistical Analyses and dissemination
- the present invention provides a solution to the comparison, quantification and normalization and thus application of metabolomics data, generated by quantitation of endogenous metabolites by, but not limited to mass spectrometry
- MS in particular MS-technologies such as MALDI, ESI, atmospheric pressure pressure chemical ionization (APCI), and other methods, determination of metabolite concentrations by use of MS-technologies or alternative methods coupled to separation (LC-MS, GC-MS, CE-MS), subsequent feature selection and /or the combination of features to classifiers including molecular data of at least two molecules and to the application and comparison of these data obtained from different subjects, different species, different time points of sampling, processed by different people and under varying experimental conditions.
- MS-technologies such as MALDI, ESI, atmospheric pressure pressure chemical ionization (APCI), and other methods
- determination of metabolite concentrations by use of MS-technologies or alternative methods coupled to separation (LC-MS, GC-MS, CE-MS), subsequent feature selection and /or the combination of features to classifiers including molecular data of at least two molecules and to the application and comparison of these data obtained from different subjects, different species, different time points of sampling, processed by different people and under varying experimental conditions.
- the reference analyte concentrations can be used to determine variable concentrations of other analytes and metabolites varying along with change of experimental conditions, disease, state of disease. pre-treatment, therapy, therapy control and prognosis.
- an "endogenous reference metabolite” or an" endogenous reference analyte” means a level of the metabolite that is constant across the experimental conditions and the relative values of the target metabolites referring to the endogenous reference metabolites as standards may be indicative of a particular disease state, phenotype, or lack thereof, as well as combinations of disease states, phenotypes, or lack thereof.
- stability of the endogenous reference metabolites means that
- a reference level of an endogenous reference metabolite may be an absolute or relative amount or concentration of the metabolite, a range of amount or concentration of the metabolite, a mean amount or concentration of the endogenous reference metabolite, and/or a median amount or concentration of the endogenous reference metabolite; and, in addition, "reference levels" of combinations of endogenous reference metabolites may also be ratios of absolute or relative amounts or concentrations of two or more metabolites with respect to each other or a composed value / score obtained by classification.
- Appropriate reference levels of endogenous reference metabolites for a particular disease state, phenotype, or lack thereof may be determined by measuring levels of desired metabolites in one or more appropriate subjects, and compare to the levels of the endogenous reference metabolites.
- Metabolite levels as well as reference levels of endogenous reference metabolites may be tailored to specific populations of subjects (e.g., a level may be age-matched so that comparisons may be made between metabolite levels in samples from subjects of a certain age and endogenous reference metabolite levels for a particular disease state, phenotype, or lack thereof in a certain age group).
- Such metabolite levels as well as reference levels of endogenous reference metabolites may also be tailored to specific techniques that are used to measure levels of metabolites in biological samples (e.g., LC-MS, GC-MS, ELISA, enzymatic tests etc.), where the levels of metabolites or the levels of the endogenous reference metabolites may differ based on the specific technique that is used.
- Plasma and serum samples were prepared by standard procedures
- the Absolute/ DQ kit p150 (Biocrates Life Sciences AG) was prepared as described in the manufacturer's protocol.
- 10 ⁇ L of brain homogenate was added to the center of the filter on the upper 96-well kit plate, and the samples were dried using a nitrogen evaporator (VLM Laboratories).
- 20 ⁇ L of a 5 % solution of phenyl-isothiocyanate was added for derivatization. After incubation, the filter spots were dried again using an evaporator.
- the metabolites were extracted using 300 ⁇ L of a 5 mM ammonium acetate solution in methanol.
- the extracts were obtained by centrifugation into the lower 96-deep well plate followed by a dilution step with 600 ⁇ L of kit MS running solvent.
- Mass spectrometric analysis was performed on an AP14000 QTrap® tandem mass spectrometry instrument (Applied Biosystems/MDS Analytical Technologies) equipped with an electro-spray ionization (ESI)-source using the analysis acquisition method as provided in the Absolute/ DQ kit.
- the standard FIA-MS/MS method was applied for all measurements with two subsequent 20 ⁇ L injections (one for positive and one for negative mode analysis).
- MRM detection was used for quantification applying the spectra parsing algorithm integrated into the MetIQ software (Biocrates Life Sciences AG). Concentration values for 148 metabolites (all analytes determined with the metabolomics kit besides of the amino acids, which were determined by a different method) obtained by internal calibration were exported for comprehensive statistical analysis.
- Amino acids and biogenic amines were quantitatively analyzed by reversed phase LC-MS/MS to obtain chromatographic separation of isobaric (same MRM ion pairs) metabolites for individual quantitation performed by external calibration and by use of internal standards.
- 10 ⁇ L sample volume (plasma, brain homogenate) is required for the analysis using the following sample preparation procedure. Samples were added on filter spots placed in a 96- solvinert well plate (internal standards were placed and dried down under nitrogen before), fixed above a 96 deep well plate (capture plate). 20 ⁇ L of 5% phenyl-isothiocyanate derivatization reagent was added.
- the derivatized samples were extracted after incubation by aqueous methanol into the capture plate.
- Sample extracts were analyzed by LC-ESI-MS/MS in positive MRM detection mode with an AP14000 QTrap® tandem mass spectrometry instrument (Applied Biosystems/MDS Analytical Technologies).
- the analyzed individual metabolite concentrations (Analyst 1.4.2 software, Applied Biosystems) were exported for comprehensive statistical analysis.
- Prostanoids - a term summarizing prostaglandins (PG), thromboxanes (TX) and prostacylines - and oxidised fatty acid metabolites were analyzed in plasma extracts by LC-ESI-MS/MS [ Unterwurzacher at al. Clin Chem Lab Med 2008; 46 (11):1589-1597 ] and in brain homogenate extracts by online solid phase extraction (SPE)-LC-MS/MS [Schwurzacher et al. Rapid Commun Mass Spec submitted] with an AP14000 QTrap® tandem mass spectrometry instrument (Applied Biosystems/MDS Analytical Technologies) in negative MRM detection mode. The sample preparation was the same for both, plasma and brain homogenates.
- filter spots in a 96 well plate were spiked with internal standard; 20 ⁇ L of plasma or tissue homogenates were added and extracted with aqueous methanol, the individual extracts then were analysed. Data of prostanoids and oxidized fatty acids were quantified with Analyst 1.4.2 software (Applied Biosystems) and finally exported for statistical analysis.
- hdyrophilic interaction liquid chromatography HILIC-ESI-MS/MS method in highly selective negative MRM detection mode was used.
- the MRM detection was performed using an AP14000 QTrap® tandem mass spectrometry instrument (Applied Biosystems/MDS Analytical Technologies). 20 ⁇ L sample volume (plasma, brain homogenate) was protein precipitated and extracted simultaneously with aqueous methanol in a 96 well plate format. Internal standards (ratio external to internal standard) and external calibration were used for highly accurate quantitation. Data were quantified with Analyst 1.4.2 software (Applied Biosystems) and finally exported for statistical analysis.
- Table 1b CAS-Numbers and Target Metabolites Species With The Same Structure BC Code CAS Registry Number Species with the same structure: Suc.EM 110-15-6 Lac.EM 50-21-5 (s)-2-Hydroxypropanoic acid, CAS-NR:79-33-4; (r)-2-Hydroxypropanoic acid, CAS-Nr: 10326-41-7 C4.K1 25576-40-3 3-butanoyloxy-4-trimethylammonio-butanoate (D) CAS-Nr: 25518-46-1 Fum.EM 110-17-8 (Z)-2-Butenedioic acid (Maleic acid), CAS-Nr: 110-16-7 GCA.BA 475-31-0 C16:2.K1 Putrescine.K2 110-60-1 Glu/Gln C16:1.K1 C10:2.K1 TCDCA.BA 516-35-8 Tauroursodeoxycholic acid (Ethanesulfonic acid, 2-(((3-
- Table 1a and 1b summarize analyzed target metabolites and respective abbreviations which are valid also for the following tables; Glycerophospholipids are further differentiated with respect to the presence of ester (a) and ether (e) bonds in the glycerol moiety, where two letters (aa, ea, or ee) denote that the first and the second position of the glycerol scaffold are bound to a fatty acid residue, whereas a single letter (a or e) indicates a bond with only one fatty acid residue; e.g. PC_ea_33:1 denotes a plasmalogen phosphatidylcholine with 33 carbons in the two fatty acid side chains and a single double bond in one of them.
- the designation ".K1 or .K2" at the end of a compound designation is an internal designation used by the Applicant, which has no chemical meaning.
- Piglets were subjected to asphyxia. To "mimic" birth asphyxia we exposed the whole body to hypoxia by ventilating piglets with 8% oxygen and added CO2 to achieve hypercarbia. Hypotension was used to cause ischaemic damage and occurred as a result of the hypercarbic hypoxia.
- Anesthesia was induced by giving Sevofluran 5% (Sevorane, Abbott); an ear vein was cannulated, the piglets were given Pentobarbital sodium 15 mg/kg and Fentanyl 50 ⁇ g/kg intravenously as a bolus injection. The piglets were orally intubated then placed on their back and washed for sterile procedures. Anesthesia was maintained by continuous infusion of Fentanyl (50 ⁇ g/kg/h) and Midazolam (0.25 mg/kg/h) in mixtures giving 1 ml/kg/h for each drug applied by IVAC P2000 infusion pump.
- a bolus of Fentanyl (10 ⁇ g/kg), Midazolam (1 mg/kg) or Pentobarbital (2.5 mg/kg) was added (need for medication being defined as shivering, trigging on the respirator, increased tone assessed by passive movements of the limbs, increase in blood pressure and/or pulse).
- a continuous IV Infusion (Salidex: saline 0.3% and glucose 3.5%, 10 mL/kg/h) was given until hypoxia and from 15 min after start of resuscitation and throughout the experiment.
- the piglets were ventilated with a pressure-controlled ventilator (Babylog 8000+; Drägerwerk, Lübeck, Germany).
- Normoventilation arterial carbon dioxide tension (PaCO 2 ) 4.5-5.5 kPa) and a tidal volume of 6-8 mL/kg were achieved by adjusting the peak inspiratory pressure or ventilatory rate. Ventilatory rate was 15-40 respirations/min.
- Inspiratory time of 0.4 s and positive end-expiratory pressure of 4.5 cm H 2 O was kept constant throughout the experiment.
- Inspired fraction of O 2 and end-tidal CO 2 was monitored continuously (Datex Normocap Oxy; Datex, Helsinki, Finland).
- the left femoral artery was cannulated with polyethylene catheters (Porex PE-50, inner diameter 0.58mm; Porex Ltd Hythe, Kent, UK).
- Mean arterial bloodpressure (MABP) was measured continuously in the left femoral artery using BioPac systems MP150-CE. Rectal temperature was maintained between 38.5 and 39.5°C with a heating blanket and a radiant heating lamp. One hour of stabilization was allowed after surgery. At the end of the experiment, the piglets were given an overdose of 150 mg/kg pentobarbital intravenously. (Eye enucleation at 15 (30 Gr 3) and 60min)
- hypoxemia was achieved by ventilation with a gas mixture of 8% O 2 in N 2 until either mean arterial blood pressure decreased to 20 mm Hg or base excess (BE) reached -20 mM.
- CO 2 was added during hypoxemia aiming at a PaCO 2 of 8.0-9.5 kPa, to imitate perinatal asphyxia.
- the hypoxic piglets were block-randomized for resuscitation with 21 % or 100% oxygen for 15 min and then ventilation with room air for 45 min (group 1 and 2), or to receive 100% oxygen for 60 min (group 3). After initiating the reoxygenation, the piglets were kept normocapnic (PaCO 2 4.5-5.5 kPa).
- Hemoglobin was measured on a HemoCue Hb 201 + (HemoCue AB, Angelholm, Sweden) at baseline and at the end. Temperature-corrected arterial acid/base status and glucose were measured regularly throughout the experiment on a Blood Gas Analyzer 860 (Ciba Corning Diagnostics, Midfield, Mass., USA). Blood samples for Metabolomics were drawn before initiating the hypoxia, at the end of hypoxia and 60 min after initiating reoxygenation and handled according to the Biocrates protocol. Plasma or serum were prepared according to a standard protocol and then stored at minus 70 °C until subsequent analysis. All blood samples obtained from the femoral artery catheter were replaced by saline 1.5 x the volume drawn. One hour after the end of hypoxia the animals were given an overdose of pentobarbital (150 mg/kg iv).
- Oxysterols are determined by HPLC-Tandem mass spectrometer (HPLC-API-MS/MS) in positive detection mode using Multiple Reaction Mode (MRM).
- HPLC-Tandem mass spectrometer HPLC-API-MS/MS
- MRM Multiple Reaction Mode
- Chromatographic separation and detection is performed by using a Zorbax Eclipse XDB C18, 150 x 2.0 mm, 3.5 ⁇ m HPLC-Column at a flow rate of 0.3 mL/min followed by electrospray ionization on the AP14000 tandem mass spectrometer.
- the Analyst Quantitation software from Applied Bioystems was used.
- CV coefficient of variation
- SD standard deviation
- Nr Analyte CV SD mean 1 lysoPC a C26:1.K1 0,03 0,0571 1,6451 2 PC aa C26:0.K1 0,0380 0,0240 0,6314 3 C12-DC.K1 0,0585 0,0089 0,1530 4 lysoPC a C26:0.K1 0,0703 0,0316 0,4492 5 C8.K1 0,1008 0,0157 0,1555 6 C8:1.K1 0,1079 0,0108 0,1005 7 PC ae C40:0.K1 0,1161 0,5832 5,0218 8 PC ae C42:0.K1 0,1171 0,0558 0,4760 9 lysoPC a C28:1.K1 0,1177 0,0353 0,2996 10 PC aa C40:1.K1 0,1213 0,0575 0,4741 11 C3-0H.K1 0,1279 0,0089 0,0696 12 C10.K1 0,1313 0,0361 0,2751 13 IysoPC a C28:0.K1 0,
- Bioinformatics 18 Suppl.1 S96-S104.] or vst [ Lin S.M., Du P., Huber W., Kibbe, W.A. (2008). Model-based variance-stabilizing transformation for Illumina microarray data. Nucleic Acids Research, Vol. 36, No. 2 e11 .] or some other normalization procedure which is well-known from microarray normalization in this step.
- a comparative survey of normalization procedures in case of Affymetrix microarray data is given in Cope et al. (2004) [ L.M. Cope et al. (2004). A Benchmark for Affymetrix GeneChip Expression Measures, Bioinformatics 20(3):323-331 ] or Irizarry et al.
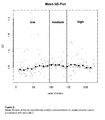
- Figure 1 shows that the variance stabilization via the log-transformation works well but not perfectly. Consequently, lower mean log-concentrations tend to have smaller SDs. Since we are looking for analytes with the smallest variability in terms of SD, we split the log-concentration in three parts (low, medium, high) to avoid getting only analytes with low concentrations.
- Analytes are classified as low concentrated if their mean concentration is smaller than 0.5 (i.e., mean log2-concentration ⁇ -1), as medium concentrated if their mean concentration is between 0.5 and 4 (i.e., mean log2-concentration between -1 and 2), and as high concentrated if their mean concentration is larger than 4 (i.e., mean log2-concentration > 2).
- the choice of the groups is rather arbitrary and one could use other cut-off values and more groups, respectively. Choosing the 10 top ranked analytes, i.e., with lowest SD values, for low, medium and high concentrated analytes, respectively, we obtain the analytes depicted in Table 3.
- Nr Analyte group SD mean 1 C12-DC.K1 low 0,084 -2,711 2 lysoPC a C26:0.K1 low 0,102 -1,158 3 C8.K1 low 0,144 -2,692 4 C8:1.K1 low 0,157 -3,323 5 PC ae C42:0.K1 low 0,172 -1,081 6 lysoPC a C28:1.K1 low 0,172 -1,749 7 PC aa C40:1.K1 low 0,177 -1,087 8 C10.K1 low 0,185 -1,874 9 C3-OH.K1 low 0,187 -3,856 10 C6 (C4:1-DC).K1 low 0,191 -2,847 11 lysoPC a C26:1.K1 medium 0,050 0,7
- geNorm As the geNorm procedure is based on analyte ratios, the two most stable analytes cannot be ranked. geNorm ranks the analytes according to the similarity of the concentration profiles. Hence, the results are quite distinct from the results of the other selection methods (cf. Table 6) and indicate that there are two groups of analytes which have very similar concentration profiles and hence dominate the selection process; confer Table 4 where the 20 top ranked analytes are depicted. Table 4: 20 top ranked analytes using geNorm.
- the NormFinder procedure takes the inter and intra group variability of the analyte concentrations into account where we consider the groups (time points) SA (Start of Asphyxia), EA (End of Asphyxia) and ER (End of Resuscitation). Table 5 shows the 50 top ranked analytes. Nr Analyte Rank rho 1 C8.K1 1 0,0729 2 C6 (C4:1-DC).
- Table 6 shows a summary of all analytes which were chosen by at least one of the four different methods where the selection is indicated by TRUE. There are several analytes which were chosen by two or even three methods simultaneously. Table 6: Summary of the selected analytes. TRUE indicates that an analyte was chosen by the corresponding algorithm.
- Venn diagrams in Figures 2-4 are based on all metabolites having adjusted p values smaller than 0.01 and show that there is a large agreement between the results for the three pairwise comparisons. However, in all cases more significant differences are detected in case of the HK normalized log-transformed data indicating that the use of the HK normalized log-transformed data leads to an increased power of the statistical analysis.
- AUC area under curve
- LPS Lipopolysaccharides
- LPS vs. control a well known animal model for mammalian immune response, at various timepoints 0h, 2h, ..., 240h - in sheep plasma.
- Polyvinyl catheters were placed in both axillary arteries, one axillary vein and in the amniotic cavity.
- the fetal scalp overlying the parasagittal cortex was exposed and two bilateral holes drilled through the skull but avoiding the dura at 5 and 15 mm anterior of bregma and 0.5 mm lateral of midline.
- Two pairs of EEG electrodes (P/N Ag7/40T, Leico Ind, Medwire® MT. Vernon, NY) were inserted through the burr holes and secured to the skull with a small rubber disk glued with cyanoacrylate and skin flaps glued back over the electrodes.
- a reference electrode was placed subcutaneously anterior to the EEG electrodes and one ground electrode subcutaneously in the neck.
- catheters were filled with 50E/ml heparin in saline.
- the uterus was closed in two layers and catheters and electrodes exteriorized.
- One catheter was placed in the tarsal vein of the ewe.
- ewes were housed in individual cages with free access to food and water. Animals were allowed to recover from surgery for at least four days before experimentation, during which time intravenous (i.v.) antibiotics (Gentamycin, 5 mg/kg) were administered to the ewe once daily.
- Blood samples (1 ml) were collected on ice for blood gas analysis (pH, pCO 2 kPa, SO 2 %, glucose mmol/I and lactate mmol/l, Radiometer ABL 725, Copenhagen, Denmark). Remaining blood was centrifuged and serum immediately frozen and stored at -80C for further analysis as described below.
- CV coefficient of variation
- SD standard deviation
- Nr Analyte CV SD mean 1 PC aa C26:0.K1 0,080 0,039 0,489 2 C12-DC.K1 0,118 0,006 0,054 3 PC ae C40:0.K1 0,131 0,775 5,921 4 PCaaC40:1.K1 0,132 0,037 0,278 5 lysoPC a C26:1.K1 0,147 0,332 2,254 6 C5-M-DC.K1 0,154 0,005 0,032 7 C16:1.K1 0,154 0,003 0,021 8 C12.K1 0,158 0,003 0,021 9 C6 (C4:1-DC).
- a comparative survey of normalization procedures in case of Affymetrix microarray data is given in Cope et al. (2004) [ L.M. Cope et al. (2004). A Benchmark for Affymetrix GeneChip Expression Measures, Bioinformatics 20(3):323-331 ] or Irizarry et al.
- Analytes are classified as low concentrated if their mean concentration is smaller than 0.5 (i.e., mean log2-concentration ⁇ -1), as medium concentrated if their mean concentration is between 0.5 and 4 (i.e., mean log2-concentration between -1 and 2), and as high concentrated if their mean concentration is larger than 4 (i.e., mean log2-concentration > 2).
- the choice of the groups is rather arbitrary and one could use other cut-off values and more groups, respectively. Choosing the 10 top ranked analytes, i.e., with lowest SD values, for low, medium and high concentrated analytes, respectively, we obtain the analytes depicted in Table 8.
- Nr Analyte group SD mean 1 PC aa C26:0.K1 low 0,107 -1,037 2 C12-DC.K1 low 0,168 -4,230 3 PC aa C40:1.K1 low 0,189 -1,860 4 C16:1.K1 low 0,222 -5,559 5 C5-M-DC.K1 low 0,223 -4,975 6 C12.K1 low 0,224 -5,568 7 C8.K1 low 0,239 -4,365 8 C6 (C4:1-DC).K1 low 0,243 -5,252 9 IysoPC a C26:0.K1 low 0,247 -1,659 10 PC ae C44:6.K1 low 0,261 -3,855 11 lysoPC a C26:1.K1 medium 0,213 1,
- geNorm As the geNorm procedure is based on analyte ratios, the two most stable analytes cannot be ranked. geNorm ranks the analytes according to the similarity of the concentration profiles. Hence, the results are quite distinct from the results of the other selection methods (cf. Table 11) and indicate that there are three groups of analytes which have very similar concentration profiles and hence dominate the selection process; confer Table 9 where the 20 top ranked analytes are depicted. Table 9: 20 top ranked analytes using geNorm.
- the NormFinder procedure takes the inter and intra group variability of the analyte concentrations into account where we consider the groups LPS (LPS treated animals) and control at time points 0h, 2h, 6h, 24h, 48h, 72h, 96h, 120h, 144h, 168h, 192h, 216h, 240h and obtain 26 different groups.
- Table 10 shows the 50 top ranked analytes.
- Table 10 50 top ranked analytes using NormFinder.
- Table 11 Summary of the selected analytes. TRUE indicates that an analyte was chosen by the corresponding algorithm.
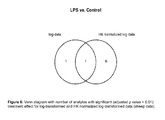
- the normalization by means of housekeeping analytes is performed by subtracting the mean of log-transformed concentrations of the three selected housekeepers from the log-transformed concentrations of the other analytes; i.e., in terms of the raw concentration this means that we use the logarithm of the ratio between the raw concentration of all analytes (except the housekeepers) and the geometric mean of the housekeepers for the statistical analysis.
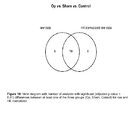
- the Venn diagrams in Figures 6-8 are based on all metabolites having adjusted p values smaller than 0.01. In all cases more significant differences are detected in case of the HK normalized log-transformed data indicating that the use of the HK normalized log-transformed data leads to an increased power of the statistical analysis.
- AUC area under curve
- Animal model HI brain injury A model of HI brain injury based on Rice-Vanucci's procedure was performed at postnatal day (P7). Sprague-Dawley rat pups ( from Charles River, Wilmington, MA, U.S.A. of either sex were anesthetized with inhaled isoflurane (3% for induction of ansthesia, 1,5% for maintenance), the right carotid artery was accessed through a midline incision and surgical ligation was performed with a double suture and a permanent incision. The procedure was performed at room temperature (23-25°C). After closure of the neck wound, pups were returned to their dams for 2 h. The entire surgical procedure lasted no longer than 10 min.
- mice were then exposed to hypoxia at 8% oxygen for 100 minutes. Sham-operated animals underwent the same anaesthesia protocol and neck incision and vessel manipulation without ligation or hypoxia. Control animals were kept without any damage. Animals were euthanized i) immediately after hypoxia (P7), ii) after 24hrs (P8), iii) after 5 days (P12), the right hemisphere of the brains were collected and stored at -80°C until further preparation. All animals were randomized to intervention and time point.
- CV coefficient of variation
- Table 12 shows the top 20 analytes with smallest CV.
- SD standard deviation
- Table 12 Top 20 analytes with smallest CV (based on raw data).
- Nr Analyte CV SD mean 1 PC aa C26:0.K1 0,086 0,179 2,071 2 lysoPC a C26:1.K1 0,097 0,816 8,395 3 lysoPC a C14:0.K1 0,124 1,434 11,567 4 C10.K1 0,155 0,038 0,244 5 C8:1.K1 0,163 0,040 0,243 6 C0.K1 0,167 11,601 69,387 7 C8.K1 0,194 0,045 0,230 8 C7-DC.K1 0,196 0,015 0,078 9 C14-OH.K1 0,199 0,012 0,058 10 10 C16-0H.K1 0,202 0,014 0,071 11 C16:1.K1 0,214 0,016 0,076 12 12 C5-DC(C6-OH).K1 0,215 0,026 0,121 13 13 Gln-PTC.K1 0,241 828,949 3446,608 14 C4-OH (C3-DC).K
- a comparative survey of normalization procedures in case of Affymetrix microarray data is given in Cope et al. (2004) [ L.M. Cope et al. (2004). A Benchmark for Affymetrix GeneChip Expression Measures, Bioinformatics 20(3):323-331 ] or Irizarry et al.
- Analytes are classified as low concentrated if their mean concentration is smaller than 0.5 (i.e., mean log2-concentration ⁇ -1), as medium concentrated if their mean concentration is between 0.5 and 4 (i.e., mean log2-concentration between -1 and 2), and as high concentrated if their mean concentration is larger than 4 (i.e., mean log2-concentration > 2).
- the choice of the groups is rather arbitrary and one could use other cut-off values and more groups, respectively. Choosing the 10 top ranked analytes, i.e., with lowest SD values, for low, medium and high concentrated analytes, respectively, we obtain the analytes depicted in Table 13.
- Nr Analyte group SD mean 1 C10.K1 low 0,222 -2,053 2 C8:1.K1 low 0,243 -2,063
- Table 13 10 top ranked analytes for each case; i.e., with smallest SD for low, medium and high concentrated analytes, respectively (based on log-transformed data).
- geNorm As the geNorm procedure is based on analyte ratios, the two most stable analytes cannot be ranked. geNorm ranks the analytes according to the similarity of the concentration profiles. Hence, the results are quite distinct from the results of the other selection methods (cf. Table 16) and indicate that there is one group of analytes where the analytes have very similar concentration profiles and hence dominate the selection process; confer Table 14 where the 20 top ranked analytes are depicted. Table 14: 20 top ranked analytes using geNorm.
- the NormFinder procedure takes the inter and intra group variability of the analyte concentrations into account where we consider the groups Op, sham and control at time points P7, P8 and P12 after treatment and distinguish between males and females as well as between left and right hemisphere. Overall, this leads to 31 different groups.
- Table 15 shows the 50 top ranked analytes. Table 15: 50 top ranked analytes using NormFinder.
- Table 16 shows a summary of all analytes which were chosen by at least one of the four different methods where the selection is indicated by TRUE. There are several analytes which were chosen by two or even three methods simultaneously. Table 16: Summary of the selected analytes. TRUE indicates that an analyte was chosen by the corresponding algorithm.
- CV coefficient of variation
- SD standard deviation
- Nr Analyte CV SD mean 1 lysoPC a C26:1.K1 0,113 0,248 2,200 2 PC ae C40:0.K1 0,123 0,440 3,585 3 C12-DC.K1 0,134 0,008 0,062 4 PC aa C42:6.K1 0,208 0,111 0,535 5 PC aa C26:0.K1 0,223 0,175 0,786 6 C3:1.K1 0,294 0,002 0,008 7 SM C16:0.K1 0,322 20,649 64,175 8 PC ae C42:5.K1 0,323 0,346 1,072 9 PC aa C42:5.K1 0,325 0,066 0,203 10 PCaeC40:6.K1 0,329 1,147 3,490 11 SM(OH)C24:1.K1 0,336 0,381 1,132 12 SM C20:2.K1 0,337 0,181 0,537 13 Val.K2 0,340 66,198 194,421 14 SM C
- a comparative survey of normalization procedures in case of Affymetrix microarray data is given in Cope et al. (2004) [ L.M. Cope et al. (2004). A Benchmark for Affymetrix GeneChip Expression Measures, Bioinformatics 20(3):323-331 ] or Irizarry et al.
- Nr Analyte group SD mean 1 C12-DC.K1 low 0,173 -4,033 2 C3:1.K1 low 0,430 -7,067 3 C16:2-0H.K1 low 0,469 -6,728 4 PC ae C42:0.K1 low 0,494 -2,538 5 PC aa C42:5.K1 low 0,497 -2,381 6 C3-OH.K1 low 0,527 -5,795 7 PC aa C40:1.K1 low 0,540 -1,266 8 C16-OH.K1 low 0,546 -7,050 9 C12:1.K1 low 0,573 -2,402 10 C18:1-OH.K1 low 0,583 -7,058 11 lysoPC a C26:1.K1 medium 0,158 1,129 12 PC ae C40:0.K1 medium 0,173 1,832 13 PC aa C42:6.K1 medium 0,299 -0,934 14 PC aa C26
- geNorm As the geNorm procedure is based on analyte ratios, the two most stable analytes cannot be ranked. geNorm ranks the analytes according to the similarity of the concentration profiles. Hence, the results are quite distinct from the results of the other selection methods (cf. Table 21) and indicate that there is one group of analytes where the analytes have very similar concentration profiles and hence dominate the selection process; confer Table 19 where the 20 top ranked analytes are depicted. Table 19: 20 top ranked analytes using geNorm.
- the NormFinder procedure takes the inter and intra group variability of the analyte concentrations into account where we consider the groups pneumonia, mixed sepsis and control.
- Table 20 shows the 50 top ranked analytes.
- Table 20 50 top ranked analytes using NormFinder.
- Table 21 shows a summary of all analytes which were chosen by at least one of the four different methods where the selection is indicated by TRUE. There are several analytes which were chosen by two or even three methods simultaneously. Table 21: Summary of the selected analytes. TRUE indicates that an analyte was chosen by the corresponding algorithm.
- AUC area under curve
- the identification and use of diagnostic metabolites is based on the finding and the essential feature that the control metabolites and their levels do not vary along with the disease type or the state of a given disease and can not be distinguished from control metabolite levels in healthy individuals. This allows the quantitative determination of other metabolites and their changes along with the state of a disease and thus diagnosis, prognosis and therapy control.
- Normalization of quantitative data by means of control-, reference or housekeeping metabolites offers several advantages. It enables the identification of metabolites with among various states of health or due to a disease or a distinct grade/ score of a disease differentially regulated concentrations / levels of metabolites as well as the development of diagnostic tools based on that.
- This invention provides the identities of analytes and metabolites that can be used as normalization, endogenous reference, or "housekeeping" analyte or metabolite in samples.
- concentration level(s) of these analytes or metabolites may be advantageously used in methods based on determination of metabolic information to diagnose or classify a disease and applied to these ends to samples of subjects from different species, diseased states and tissues.
- subsets of the endogenous reference metabolites of the present invention can be advantageously used for normalization of distinct variable metabolites to characterize the physiology of a subject or to diagnose a certain disease in a subject.
- the applications of endogenous reference metabolites thus also include the identification of responders and non-responders, therapy control and the use of specific responsive metabolites to these ends.
- the method of our invention is characterized by the ability of determining the presence or absence, the amount, the level or the concentration of one or more metabolites or metabolic biomarker in the sample of a subject relative to the amount, level or concentration of one or more endogenous reference metabolites and of using this information for diagnosis, prognosis and therapy control.
- the endogenous reference metabolites can be used as single endogenous reference metabolites and values or in a combination of
- control- or target metabolites can be used in trials for determination of toxicity, safety and efficacy of compounds or mixtures of compounds and drugs and to model signaling pathways.
- the present invention further provides a method for comparing data obtained with different assay platforms, wherein the above steps for normalizing are reiterated and the normalization factor is used to correct a signal provided by measurement of the test sample with one given method such as mass spectrometry which correction makes said signal directly comparable to a metabolite signal provided by assaying the same metabolite of the reference with one or several of alternative method for metabolite and endogenous reference metabolite determination such as IR-spectroscopy, NMR-spectroscopy, Raman spectroscopy, immunoassays, ELISAs, Western blotting, binding assays using aptamers, nucleotides or chemically modified aptamers or nucleotides for metabolite binding and indication of levels by any quantifiable signal such as eg. fluorescence.
- one given method such as mass spectrometry which correction makes said signal directly comparable to a metabolite signal provided by assaying the same metabolite of the reference with one or several of alternative method
- Data and metabolite levels thus can be determined by any assay known to a person skilled in the arts such as, but not limited to infrared spectroscopy, raman spectroscopy, mass spectroscopy, ELISAs or other immunological assays using antibodies and or enzymes and or nucleotides and or aptamers or by other methods for specific binding or immobilization of metabolites or their recognizing counterparts, to solid supports and applying various methods for detection and visualization such as, but not limited to fluorescence imaging, or MRI imaging.
- any assay known to a person skilled in the arts such as, but not limited to infrared spectroscopy, raman spectroscopy, mass spectroscopy, ELISAs or other immunological assays using antibodies and or enzymes and or nucleotides and or aptamers or by other methods for specific binding or immobilization of metabolites or their recognizing counterparts, to solid supports and applying various methods for detection and visualization such as, but not limited to fluorescence imaging, or
- the method of the present invention is suitable for use in high-throughput screening experiments.
- the endogenous reference metabolites may be chemically modified or may be labelled by any suitable means known to a person skilled in the arts, such as by labeling with dyes containingg reactive chemical groups such as but not limited to reaction with isothiocyanates, cyanates, anhydrides, thiols, amines, an azo (N3) group or fluorine, activated esters such as N-hydroxysuccinimide esters, or labelling with cyanines, biotin, digoxygenin, fluorescein, a dideoxynucleotide, or any other form of label.
- dyes containingg reactive chemical groups such as but not limited to reaction with isothiocyanates, cyanates, anhydrides, thiols, amines, an azo (N3) group or fluorine, activated esters such as N-hydroxysuccinimide esters, or labelling with cyanines, biotin, digoxygenin, fluorescein, a dideoxynucleotide
- Another embodiment is characterized by use of a radioactive marker or label, in particular 32 P, 14 C, 125 I, 33 P or 3 H for detection of control- or target metabolites.
- Another embodiment is characterized by use of a non-radioactive detectable marker, in particular a dye or a fluorescent marker or quantum dots, an enzyme marker, an immune marker or a marker enabling detection via electrical signals in particular change of current, resistance, or capacity on endogenous reference or target metabolites.
- a non-radioactive detectable marker in particular a dye or a fluorescent marker or quantum dots, an enzyme marker, an immune marker or a marker enabling detection via electrical signals in particular change of current, resistance, or capacity on endogenous reference or target metabolites.
- analytes thus may also be detected by use of immunohistochemistry techniques or assays applying enzymes or other antibody or aptamer or related technologies-mediated detection as non-limiting examples. Additional means for analysis of analyte determination are available, including enzymatic, or (catalytic chemical transformation of metabolites or detection by Raman spectroscopy, IR-spectroscopy, NMR-spectroscopy, UV-spectroscopy and other spectroscopic technologies familiar to persons skilled in the arts. These methods may also include preceding or intermediate chemical modification or labeling, e.g. with isotopes or functional groups containing respective isotopes such as carbon 13, deuterium atoms or derivatization with fluorescent or paramagnetic labels to enable specialized methods of detection and quantification.
- this can include specific labeling of all known or a fraction of the reference analytes or a differential treatment or labeling of endogenous reference metabolites and variable metabolites.
- levels of endogenous reference metabolites can be compared with the levels of metabolites with the values of the endogenous reference metabolites or target metabolites determined in separate experiments or used in the form of calibration curves or calibration tables.
- the invention provides a method of determining the metabolite level of one or more metabolites in a cell, tissue or body liquid from a subject.
- the method comprises determining the metabolite level of one or more metabolites.
- the method comprises determining the metabolite concentrations of said one or more metabolites or analytes, and comparing said concentration level(s) to the concentration level of a reference analyte or metabolite as described above.
- the concentration level(s) of one or more reference analytes of the invention provides a means to "normalize” the metabolomics data from analytes and metabolites of interest for comparison of data from a sample. Stated differently, the concentration or relative abundance of a metabolite of interest is calculated in a manner "relative to" the levels(s) of one or more reference analytes of the invention.
- the normalization may also be used for comparisons between samples, especially when they are conducted in separate experiments.
- the methods of the invention may be advantageously used in a kit format, a multi-well array, an array based format, and thus a plurality of metabolites may be evaluated for their concentration at the same time.
- One or more of the reference analytes of the invention may also be evaluated as part of the same experiment.
- the endogenous reference metabolites of the invention are used in a method of classifying a subject as diseased, to diagnose to disease, to classify a cell or a tissue as diseased, to recognize a cell containing sample as including a tumor cell of (or from) a type of tissue or a tissue origin.
- the classification or diagnosis is based upon a comparison of the levels or concentrations or relative abundance of a plurality of analytes in the sample to their levels in confirmed diseased samples and/or known non-diseased samples.
- a plurality refers to the state of two or more. Such use in classification will be used in additional description of the invention below as a non-limiting example.
- the reference analytes of the invention may also be used in the classification of body liquids taken from- or a sample as containing cells from a tissue or organ site, without limitation to tumor cells.
- the invention is described with respect to human subjects. However, samples from other subjects may also be used. All that is necessary is the ability to assess the levels or concentrations of metabolites in a plurality of known samples such that the expression levels in an unknown or test sample may be compared. Thus the invention may be applied to samples from any organism for which a plurality of metabolites, and a plurality of known samples, is available.
- control metabolites and comparison to target metabolites are used to diagnose asphyxia, severity of asphyxia and to control therapy and treatment of asphyxia.
- control metabolites and comparison to target metabolites are used to diagnose hypoxia, ischemia, ischemic encephalopathy and stroke, perinatal asphyxia, choking, drowning, electric shock, injury, or the inhalation of toxic gases, and/or determine the severities of said disorders and/or to control therapy and treatment of these conditions.
- a method for normalizing in vitro monitoring of normoxic, hypoxic and hyperoxic conditions and/or normobaric and hyperbaric oxygen therapy by endogenous metabolites is provided.
- Such method is characterized by use of at least one endogenous reference metabolite and at least one biological sample of at least one tissue of a mammalian subject.
- the present invention provides a method of diagnosing asphyxia, hypoxia or ischemia and/or duration/severity comprising the use of one or more (e.g., 2 or more, 3 or more, 5 or more, 10 or more, etc.) endogenous reference metabolites according to the present invention, measured together with one or 2 or more, 3 or more, 5 or more, 10 or more, etc.
- one or more e.g., 2 or more, 3 or more, 5 or more, 10 or more, etc.
- target metabolites in a multiplex or panel format detecting the presence or absence of or quantitate one or more (e.g., 2 or more, 3 or more, 5 or more, 10 or more, etc.) asphyxia specific target metabolites (measured together in a multiplex or panel format) in a sample (e.g., a tissue (e.g., biopsy) sample, a blood sample, a serum sample, or a urine sample) from a subject; and diagnosing asphyxia based on the normalized values of asphyxia specific target metabolites.
- a sample e.g., a tissue (e.g., biopsy) sample, a blood sample, a serum sample, or a urine sample
- the present invention further provides a method of screening compounds by superior quantitation of responsive metabolites comprising: contacting an animal, a tissue, a cell containing an asphyxia-specific metabolite with a test compound; and determine the level of the asphyxia specific metabolite quantitatively by use of the endogenous reference metabolites.
- the method further comprises the step of comparing the level of the asphyxia specific metabolite in the presence of the test compound or therapeutic intervention to the level of the asphyxia specific metabolite in the absence of the asphyxia specific metabolite applying said endogenous reference metabolites.
- the cell is in vitro, in a non-human mammal, or ex vivo.
- the test compound is a small molecule or a nucleic acid (e.g., antisense nucleic acid, a siRNA, or a miRNA) or oxygen/xenon or any neuroprotective drug that inhibits the expression of an enzyme involved in the synthesis or breakdown of an asphyxia specific metabolite.
- the method is a high throughput method.
- Asphyxia in this context relates to any diseased state linked to lack of oxygen, oxygen saturation, hypoxia. Asphyxia can be induced either pre-/perinatally due to a lack of oxygen supply by the umbilical cord or can be caused by any condition associated with an inability to breathe and/or inadequate lung ventilation like choking, drowning, electric shock, injury, or the inhalation of toxic gases.
- control metabolites and comparison to target metabolites are used to diagnose response of a subject to bacterial fragments or fragments of bacterial cell walls or immune response to bacterial fragments or fragments of bacterial cell walls, severity of said conditions and to control therapy and treatment of conditions due to systemic inflammation.
- the endogenous reference metabolites and target metabolite levels normalized and quantitated by use of these endogenous reference metabolites are applied to characterize, determine or confirm pathophysiological conditions corresponding to the label "diseased", physiological conditions corresponding to the label "healthy” or pathophysiological conditions corresponding to different labels of "grades of a disease", “subtypes of a disease”, different values of a "score for a defined disease”; said prognostic conditions corresponding to a label "good”, “medium”, “poor”, or “therapeutically responding” or “therapeutically non-responding” or “therapeutically poor responding”.
- a particular useful application of the method in accordance with the present invention is that said disorder is hypoxic ischemic encephalopathy, neonatal asphyxia, or systemic inflammation or sepsis or immune response, said mammalian subject is a human being, said biological sample is blood, wherein missing data is imputed; wherein raw data of metabolite concentrations are preprocessed using the log transformation; wherein linear mixed effect models are used to identify metabolites which are differentially present; wherein random forest is selected as suitable classifying algorithm, the training of the classifying algorithm including preprocessed metabolite concentrations, is carried out with stratified bootstrap replications applying said trained random forests classifier to said preprocessed metabolite concentration data set to a subject under suspicion of having hypoxic ischemic encephalopathy, and using the trained classifier to diagnose hypoxic ischemic encephalopathy.
- the tissue from which the biological samples can be obtained is selected from the group consisting of blood and other body fluids, cerebrospinal fluids, urine; brain tissue, nerve tissue, and/or said sample is a biopsy sample and/or said mammalian subject includes humans.
- endogenous reference metabolite based normalization may be used in species comparison, comparison of different tissue types, comparison of the same type of tissue among different mammalian species, comparison of different types of tissue among different mammalian species.
- the invented method and provided endogenous reference metabolites can be used in animal model comparison and data transfer, including data comparison and transfer from animal models to man and vice versa and in applications including but not limited to drug development in mammals and man, in diagnosis and animal diagnostics.
- the invention is contemplated for use with other samples, including those of mammals, primates, and animals used in clinical testing (such as rats, mice, rabbits, dogs, cats, and chimpanzees) as non-limiting examples.
- the invention provides for the normalization of the metabolite levels of the assay with one or more of the reference analytes disclosed herein.
- the classifying may alternatively be based upon a comparison of the levels of the assay analytes to the levels of reference analytes in the same samples, relative to, or based on, the same comparison in known diseased samples and/or known non-diseased samples.
- the normalized analyte levels of the assay may be determined in a set of known diseased samples to provide a database against which the normalized analyte levels detected or determined in a sample, tissue, body liquid or cell containing sample from a subject is compared.
- the analyte level(s) in a sample also may be compared to the level(s) of said analytes in normal or non-diseased sample, tissue, body liquid or cell, preferably from the same sample or subject.
- the analyte levels may be compared to levels of reference analytes in the same sample or a ratio of concentration levels may be used.
- the method may further comprise inclusion of standard lab parameters commonly used in clinical chemistry and critical care units, in particular, blood gases, preferably arterial blood oxygen, blood pH, base status, and lactate, serum and/or plasma levels of routinely used low molecular weight biochemical compounds, enzymes, enzymatic activities, cell surface receptors and/or cell counts, in particular red and/or white cell counts, platelet counts.
- blood gases preferably arterial blood oxygen, blood pH, base status, and lactate
- Data from control metabolites or derived from control metabolite level data can be used and further processed for software and or used in expert systems, patient management systems or distance diagnosis systems and used in diagnosing a disease, differentiate healthy from diseased subjects, identify or characterize states of a disease, determine the severity of a disease and determine scores, to determine the origin or cause of a disease.
Landscapes
- Engineering & Computer Science (AREA)
- Health & Medical Sciences (AREA)
- Life Sciences & Earth Sciences (AREA)
- Physics & Mathematics (AREA)
- Medical Informatics (AREA)
- Data Mining & Analysis (AREA)
- Spectroscopy & Molecular Physics (AREA)
- Databases & Information Systems (AREA)
- Biotechnology (AREA)
- Biophysics (AREA)
- Computer Vision & Pattern Recognition (AREA)
- Artificial Intelligence (AREA)
- Theoretical Computer Science (AREA)
- Epidemiology (AREA)
- Evolutionary Computation (AREA)
- General Health & Medical Sciences (AREA)
- Public Health (AREA)
- Software Systems (AREA)
- Bioinformatics & Cheminformatics (AREA)
- Bioinformatics & Computational Biology (AREA)
- Bioethics (AREA)
- Evolutionary Biology (AREA)
- Molecular Biology (AREA)
- Signal Processing (AREA)
- Investigating Or Analysing Biological Materials (AREA)
- Other Investigation Or Analysis Of Materials By Electrical Means (AREA)
- Cosmetics (AREA)
Priority Applications (8)
| Application Number | Priority Date | Filing Date | Title |
|---|---|---|---|
| EP09164410A EP2270699A1 (de) | 2009-07-02 | 2009-07-02 | Verfahren zur Normalisierung bei Metabolomanalyseverfahren mit endogenen Referenzmetaboliten |
| PCT/EP2010/058911 WO2011000753A1 (en) | 2009-07-02 | 2010-06-23 | Method for normalization in metabolomics analysis methods with endogenous reference metabolites |
| CN201080030109XA CN102473208A (zh) | 2009-07-02 | 2010-06-23 | 在代谢物组学分析方法中使用内源参比代谢物进行归一化的方法 |
| CA2766215A CA2766215A1 (en) | 2009-07-02 | 2010-06-23 | Method for normalization in metabolomics analysis methods with endogenous reference metabolites |
| AU2010268133A AU2010268133A1 (en) | 2009-07-02 | 2010-06-23 | Method for normalization in metabolomics analysis methods with endogenous reference metabolites |
| JP2012516718A JP2012531578A (ja) | 2009-07-02 | 2010-06-23 | メタボローム解析における内因性の参照代謝産物を用いた標準化方法 |
| US13/381,860 US20120208282A1 (en) | 2009-07-02 | 2010-06-23 | Method For Normalization in Metabolomics Analysis Methods with Endogenous Reference Metabolites. |
| EP10726084.6A EP2449488B1 (de) | 2009-07-02 | 2010-06-23 | Verfahren zur normalisierung bei metabolomanalyseverfahren mit endogenen referenzmetaboliten |
Applications Claiming Priority (1)
| Application Number | Priority Date | Filing Date | Title |
|---|---|---|---|
| EP09164410A EP2270699A1 (de) | 2009-07-02 | 2009-07-02 | Verfahren zur Normalisierung bei Metabolomanalyseverfahren mit endogenen Referenzmetaboliten |
Publications (1)
| Publication Number | Publication Date |
|---|---|
| EP2270699A1 true EP2270699A1 (de) | 2011-01-05 |
Family
ID=41138792
Family Applications (2)
| Application Number | Title | Priority Date | Filing Date |
|---|---|---|---|
| EP09164410A Withdrawn EP2270699A1 (de) | 2009-07-02 | 2009-07-02 | Verfahren zur Normalisierung bei Metabolomanalyseverfahren mit endogenen Referenzmetaboliten |
| EP10726084.6A Not-in-force EP2449488B1 (de) | 2009-07-02 | 2010-06-23 | Verfahren zur normalisierung bei metabolomanalyseverfahren mit endogenen referenzmetaboliten |
Family Applications After (1)
| Application Number | Title | Priority Date | Filing Date |
|---|---|---|---|
| EP10726084.6A Not-in-force EP2449488B1 (de) | 2009-07-02 | 2010-06-23 | Verfahren zur normalisierung bei metabolomanalyseverfahren mit endogenen referenzmetaboliten |
Country Status (7)
| Country | Link |
|---|---|
| US (1) | US20120208282A1 (de) |
| EP (2) | EP2270699A1 (de) |
| JP (1) | JP2012531578A (de) |
| CN (1) | CN102473208A (de) |
| AU (1) | AU2010268133A1 (de) |
| CA (1) | CA2766215A1 (de) |
| WO (1) | WO2011000753A1 (de) |
Cited By (3)
| Publication number | Priority date | Publication date | Assignee | Title |
|---|---|---|---|---|
| WO2015181284A1 (en) * | 2014-05-28 | 2015-12-03 | Vito Nv | A method for the relative quantification of chemical compounds contained in a mixture of different biological samples |
| WO2016038157A1 (en) * | 2014-09-10 | 2016-03-17 | Idcgs Clínica De Diagnósticos Médicos Ltda | Biomarkers for assessing breast cancer |
| CN106546721A (zh) * | 2016-11-25 | 2017-03-29 | 南京拓睿谱基因科技有限公司 | 腺性膀胱炎和膀胱癌诊断区分标志物、诊断试剂或试剂盒 |
Families Citing this family (20)
| Publication number | Priority date | Publication date | Assignee | Title |
|---|---|---|---|---|
| US9546979B2 (en) * | 2011-05-18 | 2017-01-17 | Purdue Research Foundation | Analyzing a metabolite level in a tissue sample using DESI |
| EP3273248B1 (de) * | 2011-11-10 | 2018-10-03 | InfanDx AG | Verfahren und verwendung von metabolischen verbindungen zur diagnose eines schlaganfalls |
| EP2674760A1 (de) * | 2012-06-12 | 2013-12-18 | Nestec S.A. | PC-O 44:6 - Ein Biomarker für viszerale Adipositas |
| ES2564362T3 (es) * | 2012-06-12 | 2016-03-22 | Nestec S.A. | PC-O 42:4 - Un biomarcador de la adiposidad visceral |
| AU2015289434A1 (en) * | 2014-07-18 | 2017-02-02 | Genova Diagnostics, Inc. | Use of an evidence-based, translational algorithm to, inter alia, assess biomarkers |
| WO2016025487A1 (en) * | 2014-08-11 | 2016-02-18 | Ameritox, Ltd. | Methods of normalizing the ratio of measured parent and metabolite drug concentrations in fluids |
| CN105021758B (zh) * | 2015-07-27 | 2017-05-10 | 中国科学院生物物理研究所 | 一种基于化学衍生的磷脂分类检测和定量方法 |
| WO2017083310A1 (en) * | 2015-11-09 | 2017-05-18 | Inkaryo Corporation | A normalization method for sample assays |
| CN106295143B (zh) * | 2016-08-01 | 2018-10-23 | 上海洋姜智能科技有限公司 | 一种基于rfid的疾病信息采集方法 |
| WO2018136085A1 (en) * | 2017-01-20 | 2018-07-26 | Mprobe Inc. | Methods and compositions for providing an early stage ovarian cancer assessment with metabolites |
| CN108020592B (zh) * | 2017-11-03 | 2019-10-08 | 中国科学院武汉物理与数学研究所 | 一种毛细管电泳的质谱联用定量分析血清中磷脂酰胆碱的方法及应用 |
| CN112804936A (zh) * | 2018-06-14 | 2021-05-14 | 梅塔博洛米克斯股份有限公司 | 用于预测,诊断和预后包括癌症在内的各种疾病的代谢组学签名 |
| CN112067704A (zh) * | 2019-05-25 | 2020-12-11 | 江苏食品药品职业技术学院 | 一种可与人血中氨基酸及肉碱定量相互溶解免副作用的检测装置 |
| CN111208233A (zh) * | 2020-02-20 | 2020-05-29 | 中国科学院亚热带农业生态研究所 | 一种利用血液代谢物评价保育猪个体生长所处环境温湿状态的方法 |
| CN111220734B (zh) * | 2020-02-26 | 2021-06-22 | 江苏大学 | 一种利用敏感代谢物评价潜伏缺素期作物营养状态的方法 |
| CN113740310A (zh) * | 2020-05-29 | 2021-12-03 | 中国科学院青岛生物能源与过程研究所 | 一种筛选或评价药物的方法 |
| US20230212640A1 (en) * | 2020-06-02 | 2023-07-06 | The Trustees Of Princeton University | Quantitative screen for the assessment of inter-individual variability in drug metabolism by the human gut microbiome |
| CN113223606B (zh) * | 2021-05-13 | 2022-05-27 | 浙江大学 | 一种用于复杂性状遗传改良的基因组选择方法 |
| CN113341044B (zh) * | 2021-06-18 | 2022-11-18 | 中国医科大学 | 一种基于代谢组学标志物鉴定溺死的方法及其应用 |
| WO2023279213A1 (en) * | 2021-07-09 | 2023-01-12 | Uti Limited Partnership | Metabolomic profiles for prediction of functional neurological outcome or death following severe traumatic brain injury |
Citations (2)
| Publication number | Priority date | Publication date | Assignee | Title |
|---|---|---|---|---|
| WO2007008307A2 (en) | 2005-07-11 | 2007-01-18 | Harin Kanani | Data correction, normalization and validation for quantitative high-throughput metabolomic profiling |
| US7277807B2 (en) | 2005-03-24 | 2007-10-02 | Hoffmann-La Roche Inc. | Method for processing a set of spectra, particularly NMR spectra |
-
2009
- 2009-07-02 EP EP09164410A patent/EP2270699A1/de not_active Withdrawn
-
2010
- 2010-06-23 JP JP2012516718A patent/JP2012531578A/ja not_active Withdrawn
- 2010-06-23 US US13/381,860 patent/US20120208282A1/en not_active Abandoned
- 2010-06-23 CA CA2766215A patent/CA2766215A1/en not_active Abandoned
- 2010-06-23 AU AU2010268133A patent/AU2010268133A1/en not_active Abandoned
- 2010-06-23 EP EP10726084.6A patent/EP2449488B1/de not_active Not-in-force
- 2010-06-23 WO PCT/EP2010/058911 patent/WO2011000753A1/en active Application Filing
- 2010-06-23 CN CN201080030109XA patent/CN102473208A/zh active Pending
Patent Citations (2)
| Publication number | Priority date | Publication date | Assignee | Title |
|---|---|---|---|---|
| US7277807B2 (en) | 2005-03-24 | 2007-10-02 | Hoffmann-La Roche Inc. | Method for processing a set of spectra, particularly NMR spectra |
| WO2007008307A2 (en) | 2005-07-11 | 2007-01-18 | Harin Kanani | Data correction, normalization and validation for quantitative high-throughput metabolomic profiling |
Non-Patent Citations (27)
| Title |
|---|
| ANDERSEN CLAUS LINDBJERG ET AL: "Normalization of real-time quantitative reverse transcription-PCR data: a model-based variance estimation approach to identify genes suited for normalization, applied to bladder and colon cancer data sets.", CANCER RESEARCH 1 AUG 2004, vol. 64, no. 15, 1 August 2004 (2004-08-01), pages 5245 - 5250, XP008112436, ISSN: 0008-5472 * |
| ANDERSEN ET AL.: "Normalization of Real-Time Quantitative Reverse Transcription-PCR Data: A Model-Based Variance Estimation Approach to Identify Genes Suited for Normalization, Applied to Bladder and Colon Cancer Data Sets", CANCER RESEARCH, vol. 64, 2004, pages 5245 - 5250 |
| B. M. WARRACK ET AL., JOURNAL OF CHROMATOGRAPHY B, vol. 877, no. 5-6, 2009, pages 547 - 552 |
| BENJAMINI Y.; HOCHBERG Y.: "Controlling the false discovery rate: a practical and powerful approach to multiple testing", JOURNAL OF THE ROYAL STATISTICAL SOCIETY SERIES B, vol. 57, 1995, pages 289 - 300 |
| BOX G.E.P.; COX D.R.: "An analysis of transformations", JOURNAL OF THE ROYAL STATISTICAL SOCIETY B, vol. 26, 1964, pages 211 - 252 |
| BOX, G. E. P.; COX, D. R.: "An analysis of transformations", JOURNAL OF THE ROYAL STATISTICAL SOCIETY B, vol. 26, 1964, pages 211 - 252 |
| D.P. ENOT ET AL., NATURE PROTOCOLS, vol. 3, 2008, pages 446 - 470 |
| DIXON S J ET AL: "Pattern recognition of gas chromatography mass spectrometry of human volatiles in sweat to distinguish the sex of subjects and determine potential discriminatory marker peaks", CHEMOMETRICS AND INTELLIGENT LABORATORY SYSTEMS 20070615 NL, vol. 87, no. 2, 15 June 2007 (2007-06-15), pages 161 - 172, XP022081779, ISSN: 0169-7439 * |
| ENOT DAVID P ET AL: "Preprocessing, classification modeling and feature selection using flow injection electrospray mass spectrometry metabolite fingerprint data.", NATURE PROTOCOLS 2008, vol. 3, no. 3, 2008, pages 446 - 470, XP001539671, ISSN: 1750-2799 * |
| F. DIETERLE ET AL., ANAL CHEM., vol. 78, no. 13, 2006, pages 4281 - 90 |
| HOLM, S.: "A simple sequentially rejective multiple test procedure", SCANDINAVIAN JOURNAL OF STATISTICS, vol. 6, 1979, pages 65 - 70 |
| HUBER W. ET AL.: "Variance stabilization applied to microarray data calibration and to the quantification of differential expression", BIOINFORMATICS, vol. 18, no. 1, 2002, pages S96 - S104 |
| L.M. COPE ET AL.: "A Benchmark for Affymetrix GeneChip Expression Measures", BIOINFORMATICS, vol. 20, no. 3, 2004, pages 323 - 331 |
| LIN S.M. ET AL.: "Model-based variance-stabilizing transformation for Illumina microarray data", NUCLEIC ACIDS RESEARCH, vol. 36, no. 2, 2008, pages E11 |
| M. SYSI-AHO ET AL., BMC BIOINFORMATICS, vol. 8, 2007, pages 93 |
| P. WANG ET AL., PACIFIC SYMPOSIUM ON BIOCOMPUTING, vol. 11, 2006, pages 315 - 326 |
| R. GOODACRE ET AL., TRENDS IN BIOTECHNOLOGY, vol. 22, no. 5, 2004, pages 245 - 252 |
| R.A. IRIZARRY ET AL.: "Comparison of Affymetrix GeneChip Expression Measures", BIOINFORMATICS, vol. 22, no. 7, 2006, pages 789 - 794 |
| R.J.O. TORGRIP ET AL., METABOLOMICS, vol. 20084, no. 2, pages 114 - 121 |
| R.J.O. TORGRIP ET AL., METABOLOMICS, vol. 4, no. 2, 2008, pages 114 - 121 |
| SYSI-AHO MARKO ET AL: "Normalization method for metabolomics data using optimal selection of multiple internal standards", BMC BIOINFORMATICS, vol. 8, March 2007 (2007-03-01), XP021021881, ISSN: 1471-2105 * |
| UNTERWURZACHER, CLIN CHEM LAB MED, vol. 46, no. 11, 2008, pages 1589 - 1597 |
| VANDESOMPELE ET AL.: "Accurate normalization of real-time quantitative RT-PCR data by geometric averaging of multiple internal control genes", GENOME BIOLOGY, vol. 3, no. 7, 2002 |
| VANDESOMPELE J.; KUBISTA M.; PFAFFL M.W.: "Real-Time PCR: Current Technology and Applications", 2009, CAISTER ACADEMIC PRESS, article "Reference Gene Validation Software for Improved Normalization" |
| VANDESOMPELE JO ET AL: "Accurate normalization of real-time quantitative RT-PCR data by geometric averaging of multiple internal control genes.", GENOME BIOLOGY 18 JUN 2002, vol. 3, no. 7, 18 June 2002 (2002-06-18), XP008027995, ISSN: 1465-6914 * |
| WARRACK B M ET AL: "Normalization strategies for metabonomic analysis of urine samples", JOURNAL OF CHROMATOGRAPHY B: ANALYTICAL TECHNOLOGIES IN THE BIOMEDICAL AND LIFE SCIENCES 20090215 ELSEVIER NL, vol. 877, no. 5-6, 15 February 2009 (2009-02-15), pages 547 - 552, XP025928077 * |
| WISHART DS ET AL.: "HMDB: the Human Metabolome Database", NUCLEIC ACIDS RES., vol. 35, January 2007 (2007-01-01), pages D521 - 6, Retrieved from the Internet <URL:htti)://www.hmdb.ca/)> |
Cited By (6)
| Publication number | Priority date | Publication date | Assignee | Title |
|---|---|---|---|---|
| WO2015181284A1 (en) * | 2014-05-28 | 2015-12-03 | Vito Nv | A method for the relative quantification of chemical compounds contained in a mixture of different biological samples |
| US10598642B2 (en) | 2014-05-28 | 2020-03-24 | Vito Nv | Method for relative quantification of chemical compounds contained in a mixture of different biological samples |
| WO2016038157A1 (en) * | 2014-09-10 | 2016-03-17 | Idcgs Clínica De Diagnósticos Médicos Ltda | Biomarkers for assessing breast cancer |
| CN107076748A (zh) * | 2014-09-10 | 2017-08-18 | Idcgs临床诊断医疗有限公司 | 评估乳腺癌的生物标志物 |
| US10962542B2 (en) | 2014-09-10 | 2021-03-30 | Metabolomycs, Inc. | Biomarkers for assessing breast cancer |
| CN106546721A (zh) * | 2016-11-25 | 2017-03-29 | 南京拓睿谱基因科技有限公司 | 腺性膀胱炎和膀胱癌诊断区分标志物、诊断试剂或试剂盒 |
Also Published As
| Publication number | Publication date |
|---|---|
| CA2766215A1 (en) | 2011-01-06 |
| EP2449488A1 (de) | 2012-05-09 |
| CN102473208A (zh) | 2012-05-23 |
| AU2010268133A1 (en) | 2011-12-22 |
| EP2449488B1 (de) | 2015-01-14 |
| WO2011000753A1 (en) | 2011-01-06 |
| JP2012531578A (ja) | 2012-12-10 |
| US20120208282A1 (en) | 2012-08-16 |
Similar Documents
| Publication | Publication Date | Title |
|---|---|---|
| EP2449488B1 (de) | Verfahren zur normalisierung bei metabolomanalyseverfahren mit endogenen referenzmetaboliten | |
| US11313866B2 (en) | Method of diagnosing and treating asphyxia | |
| EP2678690B1 (de) | Verfahren und verwendung von metaboliten zur diagnose von entzündlicher hirnläsion bei frühgeburten | |
| Kim et al. | Understanding metabolomics in biomedical research | |
| EP2284540A1 (de) | Verfahren zur Diagnostizierung eines Organversagens | |
| Zhao | Metabolomics in chronic kidney disease | |
| EP2771696B1 (de) | Verfahren unter verwendung von metaboliten-panels zur diagnose und differenzierung einer encephalopathie bei neugeborenen | |
| Zheng et al. | Comprehensive targeted metabolomic assay for urine analysis | |
| Kuehnbaum et al. | Multiplexed separations for biomarker discovery in metabolomics: Elucidating adaptive responses to exercise training | |
| Feliciano et al. | Overview of proteomics studies in obstructive sleep apnea | |
| Tran et al. | Metabolomics in the study of spontaneous animal diseases | |
| Kalantari et al. | An update of urine and blood metabolomics in chronic kidney disease | |
| Nelson et al. | Acute aerobic exercise reveals that FAHFAs distinguish the metabolomes of overweight and normal-weight runners | |
| Fristedt et al. | Quantitation of circulating short-chain fatty acids in small volume blood samples from animals and humans | |
| CN112305123B (zh) | 小分子物质在动脉粥样硬化性脑梗死中的应用 | |
| Wadi et al. | Developments in the Analysis of Biological Volatile Organic Compounds: Breast cancer and Cystic Fibrosis Using Gas Chromatography-Mass Spectrometry | |
| Milburn et al. | Toxicometabolomics: Technology and Applications |
Legal Events
| Date | Code | Title | Description |
|---|---|---|---|
| PUAI | Public reference made under article 153(3) epc to a published international application that has entered the european phase |
Free format text: ORIGINAL CODE: 0009012 |
|
| AK | Designated contracting states |
Kind code of ref document: A1 Designated state(s): AT BE BG CH CY CZ DE DK EE ES FI FR GB GR HR HU IE IS IT LI LT LU LV MC MK MT NL NO PL PT RO SE SI SK SM TR |
|
| AX | Request for extension of the european patent |
Extension state: AL BA RS |
|
| RIN1 | Information on inventor provided before grant (corrected) |
Inventor name: ENOT, DAVID Inventor name: KOAL, THERESE Inventor name: KELLER, MATTHIAS Inventor name: KOHL, MATTHIAS Inventor name: DEIGNER, HANS-PETER |
|
| 17P | Request for examination filed |
Effective date: 20110704 |
|
| 17Q | First examination report despatched |
Effective date: 20111104 |
|
| STAA | Information on the status of an ep patent application or granted ep patent |
Free format text: STATUS: THE APPLICATION IS DEEMED TO BE WITHDRAWN |
|
| 18D | Application deemed to be withdrawn |
Effective date: 20130201 |