EP2221618A2 - Verwendung eines plasmaproteonischen Musters zur Diagnose, Klassifizierung, Reaktionsprognose auf das Therapie- und Klinikverhalten, Therapieeingliederung und Überwachung der hermatologisch malignen Erkrankung - Google Patents
Verwendung eines plasmaproteonischen Musters zur Diagnose, Klassifizierung, Reaktionsprognose auf das Therapie- und Klinikverhalten, Therapieeingliederung und Überwachung der hermatologisch malignen Erkrankung Download PDFInfo
- Publication number
- EP2221618A2 EP2221618A2 EP10075220A EP10075220A EP2221618A2 EP 2221618 A2 EP2221618 A2 EP 2221618A2 EP 10075220 A EP10075220 A EP 10075220A EP 10075220 A EP10075220 A EP 10075220A EP 2221618 A2 EP2221618 A2 EP 2221618A2
- Authority
- EP
- European Patent Office
- Prior art keywords
- peak
- patient
- protein
- therapy
- response
- Prior art date
- Legal status (The legal status is an assumption and is not a legal conclusion. Google has not performed a legal analysis and makes no representation as to the accuracy of the status listed.)
- Withdrawn
Links
Images








Classifications
-
- G—PHYSICS
- G01—MEASURING; TESTING
- G01N—INVESTIGATING OR ANALYSING MATERIALS BY DETERMINING THEIR CHEMICAL OR PHYSICAL PROPERTIES
- G01N33/00—Investigating or analysing materials by specific methods not covered by groups G01N1/00 - G01N31/00
- G01N33/48—Biological material, e.g. blood, urine; Haemocytometers
- G01N33/50—Chemical analysis of biological material, e.g. blood, urine; Testing involving biospecific ligand binding methods; Immunological testing
- G01N33/68—Chemical analysis of biological material, e.g. blood, urine; Testing involving biospecific ligand binding methods; Immunological testing involving proteins, peptides or amino acids
- G01N33/6803—General methods of protein analysis not limited to specific proteins or families of proteins
- G01N33/6848—Methods of protein analysis involving mass spectrometry
- G01N33/6851—Methods of protein analysis involving laser desorption ionisation mass spectrometry
-
- G—PHYSICS
- G01—MEASURING; TESTING
- G01N—INVESTIGATING OR ANALYSING MATERIALS BY DETERMINING THEIR CHEMICAL OR PHYSICAL PROPERTIES
- G01N33/00—Investigating or analysing materials by specific methods not covered by groups G01N1/00 - G01N31/00
- G01N33/48—Biological material, e.g. blood, urine; Haemocytometers
- G01N33/50—Chemical analysis of biological material, e.g. blood, urine; Testing involving biospecific ligand binding methods; Immunological testing
- G01N33/53—Immunoassay; Biospecific binding assay; Materials therefor
- G01N33/575—Immunoassay; Biospecific binding assay; Materials therefor for cancer
- G01N33/57505—Immunoassay; Biospecific binding assay; Materials therefor for cancer of the blood, e.g. leukaemia
-
- G—PHYSICS
- G01—MEASURING; TESTING
- G01N—INVESTIGATING OR ANALYSING MATERIALS BY DETERMINING THEIR CHEMICAL OR PHYSICAL PROPERTIES
- G01N33/00—Investigating or analysing materials by specific methods not covered by groups G01N1/00 - G01N31/00
- G01N33/48—Biological material, e.g. blood, urine; Haemocytometers
- G01N33/50—Chemical analysis of biological material, e.g. blood, urine; Testing involving biospecific ligand binding methods; Immunological testing
- G01N33/68—Chemical analysis of biological material, e.g. blood, urine; Testing involving biospecific ligand binding methods; Immunological testing involving proteins, peptides or amino acids
- G01N33/6803—General methods of protein analysis not limited to specific proteins or families of proteins
-
- G—PHYSICS
- G01—MEASURING; TESTING
- G01N—INVESTIGATING OR ANALYSING MATERIALS BY DETERMINING THEIR CHEMICAL OR PHYSICAL PROPERTIES
- G01N33/00—Investigating or analysing materials by specific methods not covered by groups G01N1/00 - G01N31/00
- G01N33/48—Biological material, e.g. blood, urine; Haemocytometers
- G01N33/50—Chemical analysis of biological material, e.g. blood, urine; Testing involving biospecific ligand binding methods; Immunological testing
- G01N33/68—Chemical analysis of biological material, e.g. blood, urine; Testing involving biospecific ligand binding methods; Immunological testing involving proteins, peptides or amino acids
- G01N33/6803—General methods of protein analysis not limited to specific proteins or families of proteins
- G01N33/6848—Methods of protein analysis involving mass spectrometry
-
- G—PHYSICS
- G01—MEASURING; TESTING
- G01N—INVESTIGATING OR ANALYSING MATERIALS BY DETERMINING THEIR CHEMICAL OR PHYSICAL PROPERTIES
- G01N2800/00—Detection or diagnosis of diseases
- G01N2800/52—Predicting or monitoring the response to treatment, e.g. for selection of therapy based on assay results in personalised medicine; Prognosis
-
- Y—GENERAL TAGGING OF NEW TECHNOLOGICAL DEVELOPMENTS; GENERAL TAGGING OF CROSS-SECTIONAL TECHNOLOGIES SPANNING OVER SEVERAL SECTIONS OF THE IPC; TECHNICAL SUBJECTS COVERED BY FORMER USPC CROSS-REFERENCE ART COLLECTIONS [XRACs] AND DIGESTS
- Y10—TECHNICAL SUBJECTS COVERED BY FORMER USPC
- Y10T—TECHNICAL SUBJECTS COVERED BY FORMER US CLASSIFICATION
- Y10T436/00—Chemistry: analytical and immunological testing
- Y10T436/24—Nuclear magnetic resonance, electron spin resonance or other spin effects or mass spectrometry
-
- Y—GENERAL TAGGING OF NEW TECHNOLOGICAL DEVELOPMENTS; GENERAL TAGGING OF CROSS-SECTIONAL TECHNOLOGIES SPANNING OVER SEVERAL SECTIONS OF THE IPC; TECHNICAL SUBJECTS COVERED BY FORMER USPC CROSS-REFERENCE ART COLLECTIONS [XRACs] AND DIGESTS
- Y10—TECHNICAL SUBJECTS COVERED BY FORMER USPC
- Y10T—TECHNICAL SUBJECTS COVERED BY FORMER US CLASSIFICATION
- Y10T436/00—Chemistry: analytical and immunological testing
- Y10T436/25—Chemistry: analytical and immunological testing including sample preparation
-
- Y—GENERAL TAGGING OF NEW TECHNOLOGICAL DEVELOPMENTS; GENERAL TAGGING OF CROSS-SECTIONAL TECHNOLOGIES SPANNING OVER SEVERAL SECTIONS OF THE IPC; TECHNICAL SUBJECTS COVERED BY FORMER USPC CROSS-REFERENCE ART COLLECTIONS [XRACs] AND DIGESTS
- Y10—TECHNICAL SUBJECTS COVERED BY FORMER USPC
- Y10T—TECHNICAL SUBJECTS COVERED BY FORMER US CLASSIFICATION
- Y10T436/00—Chemistry: analytical and immunological testing
- Y10T436/25—Chemistry: analytical and immunological testing including sample preparation
- Y10T436/25625—Dilution
Definitions
- the present invention relates generally to the fields of proteomics. More particularly, it concerns the use of proteomics for diagnosis and the prognosis of hematologic malignancies. Also, the invention relates to predicting the response to therapy and stratifying patients for therapy.
- Hematologic malignancies are cancers of the blood and bone marrow, including leukemia and lymphoma.
- Leukemia is a malignant neoplasm characterized by abnormal proliferation of leukocytes and is one of the four major types of cancer.
- Leukemia is diagnosed in about 29,000 adults and 2,000 children each year in the United States.
- Leukemias are classified according to the type of leukocyte most prominently involved.
- Acute leukemias are predominantly undifferentiated cell populations and chronic leukemias have more mature cell forms.
- the acute leukemias are divided into lymphoblastic (ALL) and non-lymphoblastic (ANLL) types and may be further subdivided by morphologic and cytochemical appearance according to the French-American-British classification or according to their type and degree of differentiation. Specific B- and T-cell, as well as myeloid cell surface markers/antigens are used in the classification too. ALL is predominantly a childhood disease while ANLL, also known as acute myeloid leukemia (AML), is a more common acute leukemia among adults.
- ALL lymphoblastic
- ANLL non-lymphoblastic
- AML acute myeloid leukemia
- CLL lymphocytic
- CML myeloid
- proteome refers to all the proteins expressed by a genome, and thus proteomics involves the identification of proteins in the body and the determination of their role in physiological and pathophysiological functions.
- the ⁇ 30,000 genes defined by the Human Genome Project translate into 300,000 to 1 million proteins when alternate splicing and post-translational modifications are considered. While a genome remains unchanged to a large extent, the proteins in any particular cell change dramatically as genes are turned on and off in response to their environment.
- proteome As a reflection of the dynamic nature of the proteome, some researchers prefer to use the term "functional proteome" to describe all the proteins produced by a specific cell in a single time frame. Ultimately, it is believed that through proteomics, new disease markers and drug targets can be identified.
- Proteomics has previously been used in the study of leukemia. For example, two-dimensional polyacrylamide gel electrophoresis (2-D PAGE) of proteins from the lymphoblasts of patients with ALL was used to identify polypeptides that could distinguish between the major subgroups of ALL (Hanash et al., 1986). In other studies of ALL using 2-D PAGE, distinct levels of a polypeptide were observed between infants and older children with otherwise similar cell surface markers (Hanash et al., 1989). Voss et al.
- B-CLL patient populations with shorter survival times exhibited changed levels of redox enzymes, Hsp27, and protein disulfide isomerase, as determined by 2-D PAGE of proteins prepared from mononuclear cells (Voss et al., 2001).
- proteomics can be a useful tool in the study of hematologic malignancies. There is, however, a need for proteomics techniques that are more reliable and simple than those currently available in the art.
- the present invention provides a novel approach that uses plasma proteomics to create a profile that can be used to diagnose hematologic malignancies and predict a patient's clinical behavior and response to therapy.
- the invention provides a method of creating a diagnostic or prognostic protein profile of a hematologic malignancy comprising: obtaining plasma samples from a population of patients with hematologic malignancies; generating protein spectra from the plasma samples; comparing the protein spectra with patients' clinical data relating to the hematologic malignancy; identifying a protein marker or group of protein markers in the plasma samples that correlate with the clinical data; and creating a protein profile based on the identified protein marker or group of protein markers, wherein the protein profile can be used to diagnose the hematologic malignancy or determine the prognosis of the hematologic malignancy.
- the protein spectra is generated by mass spectrometry.
- the mass spectrometry may be, for example, SELDI (surface enhanced laser desorption/ionization), MALDI (matrix assisted desorption/ionization), or Tandem mass spectrometry (MS/MS).
- the protein spectra is generated by two-dimensional gel electrophoresis.
- the protein samples are fractionated before mass spectrometry analysis or two-dimensional gel electrophoresis. Fractionation can be according to a variety of properties, such as pH, size, structure, or binding affinity.
- plasma proteins are fractionated into 4 different fractions according to pH using strong anion exchange column (Fraction1 ⁇ pH9,pH7, Fraction2 ⁇ pH5, Fraction3 ⁇ pH4, Fraction4 ⁇ pH3, organic).
- the protein marker or group of protein markers that correlate with the clinical data are identified by univariate statistics, multivariate statistics, or hierarchical cluster analysis. In a preferred embodiment, the protein marker or group of protein markers that correlate with the clinical data are identified using correlation statistics with beta-uniform mixture analysis, genetic algorithms, univariate, and/or multivariate statistics. In other preferred embodiment, the protein marker or group of protein markers that correlate with the clinical data are identified using a decision tree algorithm. In some embodiments of the invention the clinical data comprises one or more of cytogenetics, age, performance status, response to therapy, type of therapy, progression, event-free survival, time from response to relapse, and survival time.
- the protein profile is used to diagnose the hematologic malignancy; classify the type of hematologic malignancy; predict a patient's response to drug therapy; predict a patient's survival time; or predict a patient's time from response to relapse.
- the hematologic malignancy is leukemia, non-Hodgkin lymphoma, Hodgkin lymphoma, myeloma, or myelodysplastic syndrome.
- the leukemia may be acute myeloid leukemia (AML), chronic myeloid leukemia (CML), acute lymphocytic leukemia (ALL), or chronic lymphocytic leukemia (CLL).
- the invention provides a method of predicting response to therapy in a patient with a hematologic malignancy comprising: obtaining a plasma sample from a patient; identifying a protein marker or group of protein markers in the plasma sample that is associated with response to therapy; and predicting the patient's response to therapy.
- the hematologic malignancy is leukemia, non-Hodgkin lymphoma, Hodgkin lymphoma, myeloma, or myelodysplastic syndrome.
- the leukemia may be acute myeloid leukemia (AML), chronic myeloid leukemia (CML), acute lymphocytic leukemia (ALL), or chronic lymphocytic leukemia (CLL).
- the method may be used to predict a patient's response to therapy before beginning therapy, during therapy, or after therapy is completed. For example, by predicting a patient's response to therapy before beginning therapy, the information may be used in determining the best therapy option for the patient.
- the protein marker is a peak.
- the peak may be generated by mass spectrometry.
- the mass spectrometry may be, for example, SELDI, MALDI, or MS/MS.
- the protein marker is a spot.
- the spot is generated by two-dimensional gel electrophoresis.
- the therapy is chemotherapy, immunotherapy, antibody-based therapy, radiation therapy, or supportive therapy (essentially any implemented for leukemia).
- the chemotherapy is Gleevac or idarubicin and ara-C.
- the protein marker or group of protein markers associated with response to a specific therapy in a patient with AML is one or more of Peak 1 to Peak 17 generated by SELDI mass spectrometry as defined in Table 1 below.
- the group of protein markers associated with response to a specific therapy in a patient with AML comprises Peak 1 and Peak 2.
- Table 1 Protein peaks generated by SELDI-TOF MS that are associated with response to therapy in patients with AML.
- the invention provides a method of predicting time to relapse in a patient with a hematologic malignancy comprising: obtaining a plasma sample from a patient; identifying a protein marker or group of protein markers in the plasma sample that is associated with time to relapse; and predicting the patient's time to relapse.
- the hematologic malignancy is leukemia, non-Hodgkin lymphoma, Hodgkin lymphoma, myeloma, or myelodysplastic syndrome.
- the leukemia may be acute myeloid leukemia (AML), chronic myeloid leukemia (CML), acute lymphocytic leukemia (ALL), or chronic lymphocytic leukemia (CLL).
- the protein marker is a peak.
- the peak may be generated by mass spectrometry.
- the peak is generated by SELDI mass spectrometry.
- the protein marker is a spot.
- the spot is generated by two-dimensional gel electrophoresis.
- the protein marker or group of protein markers associated with time from response to idarubicin and ara-C to relapse in a patient with AML is one or more of the Peak 18 to Peak 29 generated by SELDI mass spectrometry as defined in Table 2 below. Table 2. Protein peaks generated by SELDI-TOF MS that are associated with time from response to therapy to relapse in patients with AML.
- the protein marker or group of protein markers associated with relapse in a patient with ALL is one or more of the Peak 30 to Peak 49 generated by SELDI mass spectrometry as defined in Table 3 below. Table 3. Protein Peaks generated by SELDI-TOF MS that are the strongest predictors for relapse in patients with ALL.
- the protein marker or group of protein markers that differentiate between patients with L1/L2 ALL and patients with L3 ALL is one or more of the Peak 50 to Peak 69 generated by SELDI mass spectrometry as defined in Table 4 below. Table 4. Protein Peaks generated by SELDI-TOF MS that are the strongest differentiators between L1/L2 ALL and L3 ALL.
- Peak Fraction Type Approximate Molecular Weight (Daltons) Peak 50 WCX2/pH9 7727.865343 Peak 51 WCX2/pH9 10214.09619 Peak 52 IMAC3/pH5 9263.336516 Peak 53 IMAC3/pH9 10217.12293 Peak 54 IMAC3/pH9 7722.657526 Peak 55 WCX2/pH5 7728.041349 Peak 56 WCX2/pH9 9268.979905 Peak 57 IMAC3/pH5 7741.020002 Peak 58 WCX2/pH3 9248.709422 Peak 59 WCX2/pH3 7720.190664 Peak 60 SAX2/pH3 13870.3916 Peak 61 IMAC3/pH4 7725.474001 Peak 62 IMAC3/pH9 9275.311795 Peak 63 SAX2/pH4 41782.2775 Peak 64 WCX2/pH9 8896.712054 Peak 65 WCX2/pH3 4911.78345 Peak 66
- a diagnostic or prognostic protein profile is not necessary to create or utilize a diagnostic or prognostic protein profile.
- the presence or absence, or increased or decreased levels, of a protein marker or group of protein markers can be used to create or utilize a diagnostic or prognostic protein profile without knowledge of what the proteins are.
- a diagnostic or prognostic protein profile could be created or utilized based on the pattern of a group of protein markers without needing to know the specific identity of the protein markers in the pattern.
- the invention provides a method of predicting response to therapy in a patient with a hematologic malignancy comprising: obtaining a bone marrow aspirate sample from a patient; identifying a protein marker or group of protein markers in the sample that is associated with response to therapy; and predicting the patient's response to therapy.
- the hematologic malignancy is leukemia, non-Hodgkin lymphoma, Hodgkin lymphoma, myeloma, or myelodysplastic syndrome.
- the leukemia may be acute myeloid leukemia (AML), chronic myeloid leukemia (CML), acute lymphocytic leukemia (ALL), or chronic lymphocytic leukemia (CLL).
- the leukemia is CML.
- a protein marker of the present invention may be a P52rIPK homolog, follistatin-related protein 1 precursor, annexin A10, annexin 14, tumor necrosis factor receptor superfamily member XEDAR, a zinc finger protein, CD38 ADP-ribosyl cyclase 1, connective tissue growth factor, CD28, Bcl2-related ovarian killer, tumor necrosis factor receptor superfamily member 10D, X-linked ectodysplasin receptor, ectodysplain A2 isoform receptor, or chromosome 21 open reading frame 63.
- hematologic malignancies there can be a highly variable clinical course as reflected by varying survival times and resistance to therapy.
- therapy may include radiation, chemotherapy, bone marrow transplant, biological therapy, or some combination of these therapies.
- the accurate diagnosis of a patient's hematologic malignancy is important in determining which therapy option to pursue, as different malignancies respond differently to certain therapies.
- Even within a particular form of hematologic malignancy e.g. , AML, ALL, CML, CLL
- hematologic malignancy e.g. , AML, ALL, CML, CLL
- AML acute myeloid leukemia
- idarubicin + ara-C idarubicin + ara-C
- specific cytogenetic abnormalities in AML patients such as -5, -7 and I I q abnormalities, or poor performance status and advanced age are known to be associated with poor response to therapy
- accurate prediction of response to therapy remains elusive.
- the ability to accurately diagnose and predict clinical behavior in patients with hematologic malignancies would allow stratification of patients for therapy options.
- the present invention enables the evaluation of thousands of proteins at the same time from which a protein profile can be generated that can be used to diagnose or predict clinical behavior in patients with hematologic malignancies.
- the invention uses proteomics in combination with blood plasma. Blood plasma is easy to collect and provides the most complex human-derived proteome, making it superior to cells and serum for proteomic studies of hematologic malignancies.
- the present invention demonstrates that the diagnosis and prediction of clinical behavior in patients with hematologic malignancies can be accomplished by analysis of proteins present in a plasma sample.
- the present invention uses plasma to create a diagnostic or prognostic protein profile of a hematologic malignancy comprising collecting plasma samples from a population of patients with hematologic malignancies; generating protein spectra from the plasma samples; comparing the protein spectra with clinical data; and identifying protein markers in the plasma samples that correlate with the clinical data. Protein markers identified by this approach can then be used to create a protein profile that can be used to diagnose the hematologic malignancy or determine the prognosis of the hematologic malignancy.
- protein markers may be identified by comparing the protein profile from patients with hematologic malignancies with protein profiles from unaffected individuals.
- the invention provides several protein markers shown to accurately predict response to therapy in patients with AML, as well as several protein markers shown to accurately predict the time to relapse in patients with AML.
- Blood plasma is easy to collect and provides the most complex human-derived proteome, containing other tissue proteomes as subsets.
- the protein content of plasma can be classified into the following groups: proteins secreted by solid tissues and that act in the plasma; immunoglobulins; "long distance” receptor ligands; “local” receptor ligands, temporary passengers; tissue leakage products; aberrant secretions from cancer cells and other diseased cells; and foreign proteins (Anderson and Anderson, 2002).
- cerebrospinal fluid and synovial fluid share some of the protein content with plasma.
- These samples are more difficult to obtain in a useful state than plasma.
- Collection of cerebrospinal fluid and synovial fluid are invasive procedures that can be painful and involve some risk, while processing urine to a useful sample for protein analysis can be difficult in a clinical setting.
- Blood plasma may be easily collected by venipuncture.
- venous blood samples can be drawn and collected in sterile ethylene diamine tetra acetate (EDTA) tubes. The plasma can then be separated by centrifugation. If desired, the plasma may be stored at -70°C for later analysis.
- EDTA ethylene diamine tetra acetate
- the present invention employs methods of separating proteins from plasma.
- Methods of separating proteins are well known to those of skill in the art and include, but are not limited to, various kinds of chromatography (e.g. , anion exchange chromatography, affinity chromatography, sequential extraction, and high performance liquid chromatography) and mass spectrometry.
- chromatography e.g. , anion exchange chromatography, affinity chromatography, sequential extraction, and high performance liquid chromatography
- mass spectrometry mass spectrometry
- the present invention employs mass spectrometry.
- Mass spectrometry provides a means of "weighing" individual molecules by ionizing the molecules in vacuo and making them “fly” by volatilization. Under the influence of combinations of electric and magnetic fields, the ions follow trajectories depending on their individual mass (m) and charge (z). Mass spectrometry (MS), because of its extreme selectivity and sensitivity, has become a powerful tool for the quantification of a broad range of bioanalytes including pharmaceuticals, metabolites, peptides and proteins.
- SELDI-TOF MS surface-enhanced laser desorption ionization-time of flight mass spectrometry
- SELDI-TOF MS surface-enhanced laser desorption ionization-time of flight mass spectrometry
- SELDI-TOF MS fractionation based on protein affinity properties is used to reduce sample complexity. For example, hydrophobic, hydrophilic, anion exchange, cation exchange, and immobilized-metal affinity surfaces can be used to fractionate a sample. The proteins that selectively bind to a surface are then irradiated with a laser.
- the laser desorbs the adherent proteins, causing them to be launched as ions.
- the "time of flight" of the ion before detection by an electrode is a measure of the mass-to-charge ration (m/z) of the ion.
- the SELDI-TOF MS approach to protein analysis has been implemented commercially (e.g. , Ciphergen).
- the present invention employs high-resolution electrophoresis to separate proteins from a biological sample such as plasma.
- a biological sample such as plasma
- two-dimensional gel electrophoresis is used to generate a two-dimensional array of spots of proteins from a sample.
- Two-dimensional electrophoresis is a useful technique for separating complex mixtures of molecules, often providing a much higher resolving power than that obtainable in one-dimension separations.
- Two-dimensional gel electrophoresis can be performed using methods known in the art (See, e.g., U.S. Patent Nos. 5,534,121 and 6,398,933 ).
- proteins in a sample are separated by, e.g. , isoelectric focusing, during which proteins in a sample are separated in a pH gradient until they reach a spot where their net charge is zero ( i.e. , isoelectric point). This first separation step results in one-dimensional array of proteins.
- proteins in one dimensional array is further separated using a technique generally distinct from that used in the first separation step.
- proteins separated by isoelectric focusing are further separated using a polyacrylamide gel, such as polyacrylamide gel electrophoresis in the presence of sodium dodecyl sulfate (SDS-PAGE).
- SDS-PAGE gel allows further separation based on molecular mass of the protein.
- Proteins in the two-dimensional array can be detected using any suitable methods known in the art. Staining of proteins can be accomplished with colorimetric dyes (coomassie), silver staining and fluorescent staining (Ruby Red). As is known to one of ordinary skill in the art, spots/or protein profiling patterns generated can be further analyzed for example, by gas phase ion spectrometry. Proteins can be excised from the gel and analyzed by gas phase ion spectrometry. Alternatively, the gel containing proteins can be transferred to an inert membrane by applying an electric field and the spot on the membrane that approximately corresponds to the molecular weight of a marker can be analyzed by gas phase ion spectrometry.
- Chromatography is used to separate organic compounds on the basis of their charge, size, shape, and solubilities.
- a chromatography consists of a mobile phase (solvent and the molecules to be separated) and a stationary phase either of paper (in paper chromatography) or glass beads, called resin, (in column chromatography) through which the mobile phase travels. Molecules travel through the stationary phase at different rates because of their chemistry.
- Types of chromatography that may be employed in the present invention include, but are not limited to, high performance liquid chromatography (HPLC), ion exchange chromatography (IEC), and reverse phase chromatography (RP).
- HPLC high performance liquid chromatography
- IEC ion exchange chromatography
- RP reverse phase chromatography
- Other kinds of chromatography include: adsorption, partition, affinity, gel filtration and molecular sieve, and many specialized techniques for using them including column, paper, thin-layer and gas chromatography (Freifelder, 1982).
- High performance liquid chromatography is similar to reverse phase, only in this method, the process is conducted at a high velocity and pressure drop.
- the column is shorter and has a small diameter, but it is equivalent to possessing a large number of equilibrium stages.
- the column is where the actual separation takes place. It is usually a glass or metal tube of sufficient strength to withstand the pressures that may be applied across it.
- the column contains the stationary phase.
- the mobile phase runs through the column and is adsorbed onto the stationary phase.
- the column can either be a packed bed or open tubular column.
- a packed bed column is comprised of a stationary phase which is in granular form and packed into the column as a homogeneous bed.
- the stationary phase completely fills the column.
- An open tubular column's stationary phase is a thin film or layer on the column wall. There is a passageway through the center of the column.
- the mobile phase is comprised of a solvent into which the sample is injected.
- the solvent and sample flow through the column together; thus the mobile phase is often referred to as the "carrier fluid.”
- the stationary phase is the material in the column for which the components to be separated have varying affinities.
- the materials which comprise the mobile and stationary phases vary depending on the general type of chromatographic process being performed.
- the mobile phase in liquid chromatography is a liquid of low viscosity which flows through the stationary phase bed. This bed may be comprised of an immiscible liquid coated onto a porous support, a thin film of liquid phase bonded to the surface of a sorbent, or a sorbent of controlled pore size.
- HPCF High-performance chromatofocusing
- RP reversed-phase
- MS mass spectrometry
- Reversed phase chromatography utilizes solubility properties of the sample by partitioning it between a hydrophilic and a lipophilic solvent.
- the partition of the sample components between the two phases depends on their respective solubility characteristics. Less hydrophobic components end up primarily in the hydrophilic phase while more hydrophobic ones are found in the lipophilic phase.
- silica particles covered with chemically-bonded hydrocarbon chains (2-18 carbons) represent the lipophilic phase, while an aqueous mixture of an organic solvent surrounding the particle represents the hydrophilic phase.
- the partitioning mechanism When a sample component passes through an RPC column the partitioning mechanism operates continuously. Depending on the extractive power of the eluent, a greater or lesser part of the sample component will be retained reversibly by the lipid layer of the particles, in this case called the stationary phase. The larger the fraction retained in the lipid layer, the slower the sample component will move down the column. Hydrophilic compounds will move faster than hydrophobic ones, since the mobile phase is more hydrophilic than the stationary phase.
- adsorption operates at the interface between the mobile and the stationary phases.
- the adsorption mechanism is more pronounced for hydrophilic sample components while for hydrophobic ones the liquid-liquid partitioning mechanism is prevailing.
- the retention of hydrophobic components is greatly influenced by the thickness of the lipid layer.
- An 18 carbon layer is able to accommodate more hydrophobic material than an 8 carbon or a 2 carbon layer.
- the mobile phase can be considered as an aqueous solution of an organic solvent, the type and concentration of which determines the extractive power.
- organic solvents in order of increasing hydrophobicity are: methanol, propanol, acetonitrile, and tetrahydrofuran.
- reverse phase HPLC peaks are represented by bands of different intensity in the two-dimensional image, according to the intensity of the peaks eluting from the HPLC. In some instances, peaks are collected as the eluent of the HPLC separation in the liquid phase.
- acids are commonly used. Such acids are formic acid, trifluoroacetic acid, and acetic acid.
- IEC Ion exchange chromatography
- ion exchange chromatography a charged particle (matrix) binds reversibly to sample molecules (proteins, etc.). Desorption is then brought about by increasing the salt concentration or by altering the pH of the mobile phase.
- Ion exchange containing diethyl aminoethyl (DEAE) or carboxymethyl (CM) groups are most frequently used in biochemistry. The ionic properties of both DEAE and CM are dependent on pH, but both are sufficiently charged to work well as ion exchangers within the pH range 4 to 8 where most protein separations take place.
- the property of a protein which govern its adsorption to an ion exchanger is the net surface charge. Since surface charge is the result of weak acidic and basic groups of protein; separation is highly pH dependent. Going from low to high pH values the surface charge of proteins shifts from a positive to a negative charge surface charge.
- the pH versus net surface curve is a individual property of a protein, and constitutes the basis for selectivity in IEC.
- Protein marker detection can be made easier by reducing the background noise.
- the background noise can be reduced at different levels.
- One method of reducing background noise is to average the raw protein spectra data.
- peaks should be normalized to assure that equal amounts of samples are compared.
- reducing background can be achieved by eliminating peaks that are not seen in majority (50-70%) of samples.
- Ciphergen ProteinChip® Reader (Ciphergen Biosystems, Inc.).
- the chip reader may be used with peak detection software such as CiphergenExpress 3.0.
- This software calculates clusters by determining peaks that are above a given signal-to-noise ratio, and that are present in multiple spectra.
- Various settings for noise subtraction, peak detection, and cluster completion may be evaluated to optimize the analysis. For example, a first pass peak detection of 5.0 signal-to-noise on both peaks and valleys, and a cluster completion window of 1.0 times peak width, with a second pass signal-to-noise setting of 2.0 for both peaks and valleys may be used.
- normalization is a common practice in SELDI data analysis; however, other methods of normalization may be used.
- normalization could be done using the peak ratio approach in which the ratios of peaks near each other ( e.g ., within 5 peaks upstream and downstream) are used for normalizing.
- the peak ratio approach has an additional advantage of possibly detecting post-translational modifications more effectively.
- Peaks may also be detected manually.
- the results of manual peak detection may then be analyzed using software, such as Matlab (MathWorks, Natick, MA), followed by decision tree analysis.
- Matlab Matlab
- decision tree analysis software is CART from Salford Systems, which is implemented in Biomarker Patterns Software 4.0 from Ciphergen Biosystems, Inc.
- Replicate samples can be analyzed to confirm the reproducibility of the protein spectra generated according to the methods of the invention.
- Those of skill in the art are familiar with statistical methods that can be used to determine the reproducibility of the analysis.
- an agglomerative clustering algorithm may be used to show that replicate samples cluster as nearest neighbors, thus confirming reproduciblitiy.
- Agglomerative clustering analysis is the searching for groups in the data in such a way that objects belonging to the same cluster resemble each other.
- the computer analysis proceeds by combining or dividing existing groups, producing a hierarchical structure displaying the order in which groups are merged or divided. Agglomerative methods start with each observation in a separate group and proceed until all observations are in a single group.
- a multivariate model is a model that aims to predict or explain the behavior of a dependent variable on the basis of a set of known independent variables.
- the purpose of using multivariate analysis is to demonstrate that the proteomic analysis as a variable in predicting response, survival, and duration of response is independent from the currently known variables that can predict the same thing. If the proteomic data adds to the model that includes the conventional markers, the p-value will be significant, but if the proteomic data does not add to the model and similar prediction can be achieved using other conventional markers, the p-value will not be significant even if it was significant in univariate analysis.
- a multivariate model For predicting a the response to therapy of a patient with a hematologic malignancy, a multivariate model is preferred.
- An example of a multivariate model for predicting response to therapy in a patient with AML is (Response ⁇ Cytogenetics + Performance.Status + Age).
- Cytogenetic findings represent the chromosomal abnormalities that were found in the tumor cells. Dependent on these abnormalities, the leukemia/tumor can be classified as good, intermediate, or bad. For example, in a patient with AML and cytogenetic abnormalities including deletion of chromosome 5 or 7 or abnormalities on chromosome 11, this patient has a "bad" disease (>90% die within one year and will not respond to therapy). Patients with AML and t(8;21), t(15;17), or Inv 16 are classified as "good” disease and the rest are with "intermediate” disease.
- Performance status is a scoring system to evaluate the patient's overall health as described below in Table 5. Obviously, the higher the grade (ECOG), the less likely the patient will survive. Table 5. Performance Status Criteria. ECOG Performance Status Scale Karnofsky Performance Scale Grade Descriptions Percent Description 0 Normal activity. Fully active, able to carry on all pre-disease performance without restriction. 100 Normal, no complaints, no evidence of disease. 90 Able to carry on normal activity; minor signs or symptoms of disease. 1 Symptoms, but ambulatory. Restricted in physically strenuous activity, but ambulatory and able to carry out work of a light or sedentary nature ( e.g. , light housework, office work). 80 Normal activity with effort; some signs or symptoms of disease.
- the protein marker can be added to the multivariate model.
- the value (i.e. , height) of a protein peak identified by SELDI MS can be added to the base multivariate model for predicting response to therapy in a patient with AML to give the extended multivariate model of (Response ⁇ Cytogenetics + Performance.Status + Age + Peak Info) where Peak Info is information from a given peak.
- Peak Info is a transformed peak value, such as logPeak, logPeak + (logPeak) 2 , Peak + Peak 2 , or Peak + logPeak.
- a p-value is produced.
- a p-value may be determined by applying ANOVA (analysis of variance between groups) on the base multivariate model and the extended multivariate model.
- a beta-uniform mixture analysis may be used.
- the p-value is considered significant only if it is less than the cut-off as determined by the beta-uniform mixture analysis, in which the transformation is confirmed to be unique and not uniform. This adjusts for the multiple testing.
- Cox proportional hazards model is a commonly used regression model for analyzing data points with time, such as survival, time to progression, time to relapse, or time to therapy.
- the Cox model allows the estimation of nonparametric survival (or other event of interest) curves (such as Kaplan-Meier curves) in the presence of covariates. This can be performed with continuous or as dichotomized variables. The effect of the covariates upon survival is usually of primary interest.
- the Cox model can also be performed in the context of multivariate analysis by incorporating several variables. In the multivariate model, the analysis will first analyze the first variable, then analyze the second variable in the groups generated from the first variable and so on.
- h(t) is the hazard at time t
- h 0 (t) is the baseline hazard
- f(Peak) is some transformation of the peak value.
- Resulting p-values may be analyzed by means of a beta-uniform mixture analysis.
- a positive value of the coefficient ⁇ means that an increased peak height corresponds to increased risk of relapse.
- the p-value was considered significant only if it is less than the cut-off as determined by the beta-uniform mixture analysis, in which the transformation is confirmed to be unique and not uniform. This adjusts for the multiple testing.
- the data can be used to predict patients who will have fungal infection, or patients who would die in the first two weeks. Similar statistical analysis can be used to determine response to second therapy after relapsing
- a decision tree algorithm was used to identify protein spectra useful for predicting clinical outcome (e.g. , responders versus non-responders).
- CART software from Salford Systems is one example of a commercially available decision tree tool. CART automatically sifts large, complex databases, searching for and isolating significant patterns and relationships. This information can then be used to generate predictive models. Variables that may be included in the analysis along with peak values and peak ratios include clinical outcome, patient demographics, and cellular analysis. When using decision trees, caution must be exercised to prevent overfitting (Wiemer and Prokudin 2004). When approach to limiting overfitting is to limit the number of levels allowed. For example, the number of levels may be limited to two, meaning that the model could only be comprised of at most two variables from the set of all peak values and all observational variables ( e.g. , clinical outcomes, patient demographics, cellular analysis).
- AML acute myeloid leukemia
- response to standard chemotherapy idarubicin + ara-C
- idarubicin + ara-C specific cytogenetic abnormalities in AML patients, such as - 5, -7 and 11 q abnormalities, or poor performance status and advanced age are known to be associated with poor response to therapy
- accurate prediction of response to therapy remains elusive.
- Accurate prediction of response to therapy in AML may allow stratification of patients and the use of different regimens that might prove to be more effective in these patients when used upfront before compromising the patient's immune system with conventional therapy that will not be adequate to induce remission.
- Recent advances in genomics and proteomics have provided new hope for finding new molecular markers for the prediction of response to chemotherapy in AML.
- the inventors explored the potential of using proteomics in predicting response to standard chemotherapy (idarubicin + ara-C) in acute myeloid leukemia (AML).
- idarubicin + ara-C acute myeloid leukemia
- AML acute myeloid leukemia
- SELDI surface-enhanced laser desorption/ionization
- Plasma samples were obtained prior to initial cytotoxic therapy from 90 patients with a diagnosis of AML seen at the University of Texas M.D. Anderson Cancer Center. Patients were selected randomly. Forty patient samples were used in the testing set to build the model; the remaining 50 patient samples were used in the validation set to test the accuracy and validity of the model. Diagnosis was based on morphologic, cytochemical staining, immunophenotypic analysis (CD64, CD13, CD33, CD14, CD117, CD10, CD19, CD3, DR, and Tdt), and molecular analysis as indicated. Cytogenetic analysis was also performed. Patients were treated according to Institutional Review Board-approved clinical research protocols at M.D. Anderson Cancer Center after signing informed consent.
- Plasma proteins were first enriched and fractionated into 4 different fractions according to pH using strong anion exchange resin (Fraction1 ⁇ pH9,pH7, Fraction2 ⁇ pH5, Fraction3 ⁇ pH4, Fraction4 ⁇ pH3, organic). Each fraction was then immobilized on three arrays: anion exchange (SAX), cation exchange (WCX), and metal affinity chip (IMAC). Chips were read on Ciphergen reader Model PBS II. Spectra from plasma samples corresponding to 40 patients were collected from each fraction and surface (for a total of 12 spectra per patient) and peaks were compared.
- SAX anion exchange
- WCX cation exchange
- IMAC metal affinity chip
- the peak locations were extracted using the following approach. For each surface and fraction, the inventors averaged all raw spectra. This reduced the noise significantly and made peak detection easier and more robust. This way the inventors applied the peak detection algorithm to 12 average spectra. These peaks were filtered with respect the estimated Signal to Noise ratio (S/N) in their vicinity in the average spectra. In particular the inventors used S/N>5.
- S/N Signal to Noise ratio
- the inventors inspected numerous individual spectra (as well as average spectra for all 12 Surface-Fraction combinations) from both testing and validation sets to detect cases of poor alignment. There were no problems in alignment, thus the extracted peak heights from validation set at the 1976 locations were similar to the testing set. Each sample was analyzed in duplicate and an agglomerative clustering algorithm showed that replicate samples cluster as nearest neighbors, confirming the reproducibility of the analysis.
- cytogenetics include cytogenetics, performance status, and age.
- age As expected, multivariate modeling demonstrated that age, cytogenetics, and performance status are strong predictors of response to therapy.
- the extended model is: (Response ⁇ Cytogenetics + Performance.Status + Age + Peak Info), where Peak Info is additional info from a given peak.
- a set of p-values was obtained and used for a beta-uniform analysis.
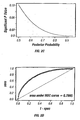
- the results from the beta-uniform mixture analysis of case (i), (ii), (iii), and (iv) are shown in FIG. 1 , FIG. 2 , FIG. 3 , and FIG. 4 , respectively.
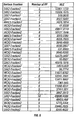
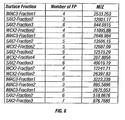
- the threshold for the p-values was calculated after the beta-uniform mixture analysis by fixing the false discovery rate (FDR). For case (i) the FDR was set to 0.2, for cases (ii), (iii), and (iv) FDR was set to 0.1. The most significant peaks for cases (i), (ii), (iii), and (iv) are shown in FIG. 5 , FIG. 6 , FIG. 7 , and FIG. 8 , respectively.
- the base model (Response ⁇ Cytogenetics + Performance.Status + Age) accurately predicted the response in 31 out of 40 patients.
- the base model predicted 21 no response (NR) and 19 complete response (CR). Of these, there were 5 false NR and 4 false CR.
- the base model was extended by adding the most significant peaks identified for cases (i), (ii), (iii), and (iv). In each of FIGs. 5-8 , the 3rd column shows the number of false predictions (F.P.) of the base model extended with each individual peak.
- the first and third protein peaks (shaded) in Table 7 were a pair that perfectly predicted response.
- Table 8 shows the significant peaks for case (iv).
- case (iv) 52 pairs of peaks could predict response perfectly when added to the base model.
- the first two protein peaks (shaded) in Table 8 were a pair that perfectly predicted response.
- proteomic profiling is useful in predicting clinical behavior in AML patients. This approach may be useful in stratifying patients for specific therapy options.
- the inventors processed spectra produced from plasma samples collected from 42 and 48 patients with AML. For each patient the inventors have 24 spectra coming from 4 different fractions (Fraction1 ⁇ pH9,pH7, Fraction2 ⁇ pH5, Fraction3 ⁇ pH4, Fraction4 ⁇ pH3, organic), 3 surfaces (IMAC3-Cu ++ , SAX2, WCX2) and duplication of the experiments.
- the first set of spectra (from 42 patients) was produced in the second half of February, 2003.
- the second set (from 48 subjects) was produced at the end of June, 2003.
- the following analysis applies to all spectra corresponding to 40 patients from Set 1 and 42 patients from Set 2.
- the remaining spectra were discarded due to missing clinical information.
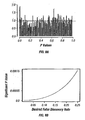
- FIG.9 shows the distribution of p-values.
- Table 9 shows the peaks, in order of significance (ascending order of p-values).
- the third column of Table 9 shows the ⁇ -coefficient of the peak in the model.
- a positive value of the coefficient ⁇ means that an increased peak height corresponds to increased risk of relapse.
- Table 9: Most significant peaks, fdr 0.6.
- FIG.10 shows the BUM analysis of the 1976 p-values obtained after fitting the Cox models. It is evident that there are no significant peaks. In particular, the inventors have to set FDR >0.999 in order to get a p-value threshold that does not cut off all 1976 cases.
- ALL acute lymphoblastic leukemia
- EDTA plasma was obtained by centrifuging whole blood at 1500 g for 10 minutes at 4°C. Plasma was stored at -70°C.
- the plasma proteins were first fractionated based on their pH into four fractions using a strong anion exchange column as follows: pH 7+pH9+flowthrough, pH5, pH4, and pH3+organic wash. Each fraction was applied to three ProteinChip array surfaces: immobilized metal affinity capture (IMAC3), strong anion exchange (SAX2), and weak cation exchange (WCX2). Samples were divided into aliquots of two, and then randomly assigned to 8-well plates, with each plate containing a control from a pool of healthy patient samples.
- IMAC3 immobilized metal affinity capture
- SAX2 strong anion exchange
- WCX2 weak cation exchange
- Chips were read using the Ciphergen ProteinChip® Reader (series PBS II). Twenty-four spectra per patient (4 fractions x 3 arrays in duplicate) were obtained. Peak detection was performed using CiphergenExpress 3.0 (Ciphergen Biosystems, Inc.). Spectra were normalized against total ion current between 2000 and 160,000 m/z. This software calculates clusters by determining peaks that are above a given signal-to-noise ratio, and that are present in multiple spectra. Various settings for noise subtraction, peak detection, and cluster completion were evaluated.
- the final settings chosen were similar to the vendor's default settings, a first pass peak detection of 5.0 signal-to-noise on both peaks and valleys, and a cluster completion window of 1.0 times peak width, with a second pass signal-to-noise setting of 2.0 for both peaks and valleys. Peaks were identified between 2000 and 200,000 m/z.
- This process was repeated for eight other approaches: 2) dividing each peak by the total ion current in a spectrum; 3) dividing each peak by the mean peak intensity value over a spectrum; 4) calculating a ratio by dividing each peak by the closest neighbor; 5) a ratio by dividing each peak by its second closest neighbor to the right (higher m/z value); 6) dividing each peak by its third closest neighbor; 7) dividing each peak by its fourth closest neighbor, 8) dividing each peak by its fifth closest neighbor; and 9) dividing a peak by the average value of its closest 6 peak values (3 on each side).
- the correlation matrix was calculated between all of the observational variables (clinical outcomes, patient demographics, and cellular analysis) and all peaks.
- a program was written in Matlab to plot the top 16 peaks with the lowest p value curve fitted to each observational variable within each fraction type. These plots were then manually inspected for correlation between the mass spec peaks and observational variables.
- ratios of nearby peaks multiplies the number of possible variables, and caution should be taken when using this approach to avoid overfitting.
- a ratio approach can be useful in identifying biological affects that involve two peaks, for example a shift due to post-translational modification, or an alternative splice variant of a protein.
- the median coefficient of variation for repeated patient samples was 9.8 percent.
- the variation between replicates actually increased to 11.5 percent when dividing by the total ion current. Normalizing by dividing by the mean peak intensity from all peaks in a spectrum also slightly increased the variability.
- the only normalization approach that lowered variability was dividing by the mean of the closest six peaks.
- the replicate variability increased to between 10 and 14.5 percent when ratios are calculated using nearby peaks. The further away the peaks were in calculating the ratio, the greater the increase in the variation between replicates.
- the data presented here support the use of peripheral blood plasma for proteomic analysis in leukemias and demonstrate that proteomic approach represents a valid approach for developing clinically useful biomarkers to be used in clinical management of patients with leukemia.
- the analysis also indicates a growing future role for the combination of mass spectrometry measured data with clinically observed variables in the prediction of disease progression.
Landscapes
- Life Sciences & Earth Sciences (AREA)
- Health & Medical Sciences (AREA)
- Engineering & Computer Science (AREA)
- Molecular Biology (AREA)
- Physics & Mathematics (AREA)
- Immunology (AREA)
- Hematology (AREA)
- Biomedical Technology (AREA)
- Urology & Nephrology (AREA)
- Chemical & Material Sciences (AREA)
- Bioinformatics & Computational Biology (AREA)
- Bioinformatics & Cheminformatics (AREA)
- General Health & Medical Sciences (AREA)
- Microbiology (AREA)
- Food Science & Technology (AREA)
- Analytical Chemistry (AREA)
- Biochemistry (AREA)
- Cell Biology (AREA)
- General Physics & Mathematics (AREA)
- Pathology (AREA)
- Biotechnology (AREA)
- Medicinal Chemistry (AREA)
- Spectroscopy & Molecular Physics (AREA)
- Biophysics (AREA)
- Proteomics, Peptides & Aminoacids (AREA)
- Optics & Photonics (AREA)
- Other Investigation Or Analysis Of Materials By Electrical Means (AREA)
- Investigating Or Analysing Biological Materials (AREA)
- Peptides Or Proteins (AREA)
- Measuring Or Testing Involving Enzymes Or Micro-Organisms (AREA)
Applications Claiming Priority (2)
| Application Number | Priority Date | Filing Date | Title |
|---|---|---|---|
| US56387304P | 2004-04-20 | 2004-04-20 | |
| EP05746451A EP1756578A2 (de) | 2004-04-20 | 2005-04-20 | Verwendung des plasmaproteommusters zur diagnose, klassifizierung, vorhersage des ansprechens auf eine therapie und des klinischen verhaltens, stratifizierung der therapie sowie der krankheitsüberwachung bei bösartigen hämatologischen erkrankungen |
Related Parent Applications (1)
| Application Number | Title | Priority Date | Filing Date |
|---|---|---|---|
| EP05746451.3 Division | 2005-04-20 |
Publications (2)
| Publication Number | Publication Date |
|---|---|
| EP2221618A2 true EP2221618A2 (de) | 2010-08-25 |
| EP2221618A3 EP2221618A3 (de) | 2010-09-01 |
Family
ID=35094386
Family Applications (2)
| Application Number | Title | Priority Date | Filing Date |
|---|---|---|---|
| EP10075220A Withdrawn EP2221618A3 (de) | 2004-04-20 | 2005-04-20 | Verwendung eines plasmaproteonischen Musters zur Diagnose, Klassifizierung, Reaktionsprognose auf das Therapie- und Klinikverhalten, Therapieeingliederung und Überwachung der hermatologisch malignen Erkrankung |
| EP05746451A Withdrawn EP1756578A2 (de) | 2004-04-20 | 2005-04-20 | Verwendung des plasmaproteommusters zur diagnose, klassifizierung, vorhersage des ansprechens auf eine therapie und des klinischen verhaltens, stratifizierung der therapie sowie der krankheitsüberwachung bei bösartigen hämatologischen erkrankungen |
Family Applications After (1)
| Application Number | Title | Priority Date | Filing Date |
|---|---|---|---|
| EP05746451A Withdrawn EP1756578A2 (de) | 2004-04-20 | 2005-04-20 | Verwendung des plasmaproteommusters zur diagnose, klassifizierung, vorhersage des ansprechens auf eine therapie und des klinischen verhaltens, stratifizierung der therapie sowie der krankheitsüberwachung bei bösartigen hämatologischen erkrankungen |
Country Status (7)
| Country | Link |
|---|---|
| US (3) | US7622306B2 (de) |
| EP (2) | EP2221618A3 (de) |
| JP (1) | JP4864875B2 (de) |
| BR (1) | BRPI0509978A (de) |
| CA (1) | CA2563847A1 (de) |
| MX (1) | MXPA06012232A (de) |
| WO (1) | WO2005103719A2 (de) |
Cited By (1)
| Publication number | Priority date | Publication date | Assignee | Title |
|---|---|---|---|---|
| CN110632191A (zh) * | 2019-09-10 | 2019-12-31 | 福建工程学院 | 一种基于决策树算法的变压器色谱峰定性方法和系统 |
Families Citing this family (14)
| Publication number | Priority date | Publication date | Assignee | Title |
|---|---|---|---|---|
| US8008020B2 (en) * | 2004-06-03 | 2011-08-30 | Vermillion, Inc. | Biomarkers for peripheral artery disease |
| US20070042443A1 (en) | 2005-08-17 | 2007-02-22 | Quest Diagnostics Investments Incorporated | Hematopoietic cell phenotyping using free circulating cellular markers |
| JP2007240326A (ja) * | 2006-03-08 | 2007-09-20 | Intec Web & Genome Informatics Corp | 波形解析装置 |
| US20100140465A1 (en) * | 2006-03-29 | 2010-06-10 | Chulso Moon | Apparatus and Method for Filtration to Enhance the Detection of Peaks |
| EP2109688A4 (de) * | 2007-01-23 | 2010-02-17 | Univ Virginia | Galectin-3 bindendes protein als biomarker für herz-kreislauf-erkrankungen |
| EP2191277A1 (de) * | 2007-08-14 | 2010-06-02 | Petscreen Limited | Neue diagnostische verfahren |
| KR100937720B1 (ko) * | 2009-04-20 | 2010-01-20 | 전남대학교산학협력단 | CFH 또는 ApoH를 급성골수성백혈병 관해 진단용 생화학적 마커로 사용하는 방법 |
| US9029517B2 (en) | 2010-07-30 | 2015-05-12 | Emd Millipore Corporation | Chromatography media and method |
| US10449517B2 (en) | 2014-09-02 | 2019-10-22 | Emd Millipore Corporation | High surface area fiber media with nano-fibrillated surface features |
| US20170298091A1 (en) | 2014-12-08 | 2017-10-19 | Emd Millipore Corporation | Mixed Bed Ion Exchange Adsorber |
| JP6565801B2 (ja) * | 2016-06-23 | 2019-08-28 | 株式会社島津製作所 | 質量分析データ処理装置、質量分析装置、質量分析データ処理方法、及び質量分析データ処理用プログラム |
| CN109507347B (zh) * | 2017-09-14 | 2021-01-29 | 湖南中烟工业有限责任公司 | 一种色谱峰选择方法 |
| US11096582B2 (en) * | 2018-11-20 | 2021-08-24 | Veris Health Inc. | Vascular access devices, systems, and methods for monitoring patient health |
| EP4198511A1 (de) * | 2021-12-17 | 2023-06-21 | Lehtio, Janne | Verfahren zur bestimmung einer aml-prognose |
Citations (2)
| Publication number | Priority date | Publication date | Assignee | Title |
|---|---|---|---|---|
| US5534121A (en) | 1994-05-16 | 1996-07-09 | The United States Of America As Represented By The Department Of Health And Human Services | Preparative two dimensional gel electrophoresis system |
| US6398933B1 (en) | 1998-08-31 | 2002-06-04 | C.B.S. Scientific Co., Inc. | Two dimensional gel electorophoresis system |
Family Cites Families (5)
| Publication number | Priority date | Publication date | Assignee | Title |
|---|---|---|---|---|
| IN191209B (de) | 1999-09-08 | 2003-10-04 | Council Scient Ind Res | |
| AU2001280581A1 (en) * | 2000-07-18 | 2002-01-30 | Correlogic Systems, Inc. | A process for discriminating between biological states based on hidden patterns from biological data |
| AUPQ886100A0 (en) | 2000-07-19 | 2000-08-10 | Biotron Limited | Diagnostic test |
| US20030013120A1 (en) * | 2001-07-12 | 2003-01-16 | Patz Edward F. | System and method for differential protein expression and a diagnostic biomarker discovery system and method using same |
| JP2005533524A (ja) * | 2002-05-17 | 2005-11-10 | イースタン バージニア メディカル スクール | Htlv−i介在性疾患を診断するための方法 |
-
2005
- 2005-04-20 JP JP2007509551A patent/JP4864875B2/ja not_active Expired - Fee Related
- 2005-04-20 US US11/110,374 patent/US7622306B2/en not_active Expired - Fee Related
- 2005-04-20 EP EP10075220A patent/EP2221618A3/de not_active Withdrawn
- 2005-04-20 BR BRPI0509978-1A patent/BRPI0509978A/pt not_active IP Right Cessation
- 2005-04-20 EP EP05746451A patent/EP1756578A2/de not_active Withdrawn
- 2005-04-20 CA CA002563847A patent/CA2563847A1/en not_active Abandoned
- 2005-04-20 MX MXPA06012232A patent/MXPA06012232A/es unknown
- 2005-04-20 WO PCT/US2005/013224 patent/WO2005103719A2/en not_active Ceased
-
2009
- 2009-10-21 US US12/582,998 patent/US8097468B2/en not_active Expired - Fee Related
-
2011
- 2011-12-14 US US13/325,986 patent/US8563323B2/en not_active Expired - Fee Related
Patent Citations (2)
| Publication number | Priority date | Publication date | Assignee | Title |
|---|---|---|---|---|
| US5534121A (en) | 1994-05-16 | 1996-07-09 | The United States Of America As Represented By The Department Of Health And Human Services | Preparative two dimensional gel electrophoresis system |
| US6398933B1 (en) | 1998-08-31 | 2002-06-04 | C.B.S. Scientific Co., Inc. | Two dimensional gel electorophoresis system |
Non-Patent Citations (6)
| Title |
|---|
| ANDERSON; ANDERSON, MOLEC. CELL. PROTEOM., vol. 1, no. 11, 2002, pages 845 - 867 |
| BAGGERLY KEITH A ET AL: "Reproducibility of SELDI-TOF protein patterns in serum: comparing datasets from different experiments", BIOINFORMATICS, OXFORD UNIVERSITY PRESS, SURREY, GB, vol. 20, no. 5, 22 March 2004 (2004-03-22), pages 777 - 785, XP002450625, ISSN: 1367-4803, DOI: 10.1093/BIOINFORMATICS/BTG484 * |
| HANASH ET AL., BLOOD, vol. 73, no. 2, 1989, pages 527 - 532 |
| HANASH ET AL., PROC. NATL. ACAD. SCI. USA, vol. 83, no. 3, 1986, pages 807 - 811 |
| VOSS ET AL., INT. J. CANCER, vol. 91, no. 2, 2001, pages 180 - 186 |
| WIEMER, J. C.; A. PROKUDIN: "Bioinformatics in proteomics: application, terminology, and pitfalls", PATHOL RES PRACT, vol. 200, no. 2, 2004, pages 173 - 8 |
Cited By (1)
| Publication number | Priority date | Publication date | Assignee | Title |
|---|---|---|---|---|
| CN110632191A (zh) * | 2019-09-10 | 2019-12-31 | 福建工程学院 | 一种基于决策树算法的变压器色谱峰定性方法和系统 |
Also Published As
| Publication number | Publication date |
|---|---|
| JP4864875B2 (ja) | 2012-02-01 |
| JP2007533997A (ja) | 2007-11-22 |
| EP1756578A2 (de) | 2007-02-28 |
| WO2005103719A2 (en) | 2005-11-03 |
| US20120145891A1 (en) | 2012-06-14 |
| EP2221618A3 (de) | 2010-09-01 |
| MXPA06012232A (es) | 2007-06-15 |
| US20100063747A1 (en) | 2010-03-11 |
| US8097468B2 (en) | 2012-01-17 |
| BRPI0509978A (pt) | 2007-10-16 |
| US20060073527A1 (en) | 2006-04-06 |
| US8563323B2 (en) | 2013-10-22 |
| WO2005103719A3 (en) | 2005-12-15 |
| US7622306B2 (en) | 2009-11-24 |
| CA2563847A1 (en) | 2005-11-03 |
Similar Documents
| Publication | Publication Date | Title |
|---|---|---|
| US8563323B2 (en) | Using plasma proteomic pattern for diagnosis, classification, prediction of response to therapy and clinical behavior, stratification of therapy, and monitoring disease in hematologic malignancies | |
| JP6010597B2 (ja) | 卵巣癌用のバイオマーカー | |
| Wang et al. | A simple affinity spin tube filter method for removing high‐abundant common proteins or enriching low‐abundant biomarkers for serum proteomic analysis | |
| EP1756566B1 (de) | Biomarker für ovarialkarzinom | |
| US20100047847A1 (en) | Methods for diagnosing ovarian cancer | |
| JP2008508538A (ja) | 癌についての血小板生物マーカー | |
| KR20050062518A (ko) | 난소암의 검출을 위한 생물 마커의 용도 | |
| US20100197561A1 (en) | Biomarkers for Ovarian Cancer: B2 Microglobulin | |
| JP4954348B2 (ja) | Cfhまたはapohを急性骨髄性白血病寛解診断用生化学的マーカーとして使用する方法 | |
| Long et al. | Pattern-based diagnosis and screening of differentially expressed serum proteins for rheumatoid arthritis by proteomic fingerprinting | |
| JP2011518340A5 (de) | ||
| EP1477803A1 (de) | Serumprotein profiling für die Diagnose von Epithelkrebs | |
| CN101268367A (zh) | 卵巢癌的生物标记 | |
| CA2525743A1 (en) | Differential diagnosis of colorectal cancer and other diseases of the colon | |
| CA2525740A1 (en) | Biomarkers for the differential diagnosis of pancreatitis and pancreatic cancer | |
| Albitar et al. | Proteomics-based prediction of clinical response in acute myeloid leukemia | |
| JP2009098108A (ja) | 糖鎖を持つ物質の精製方法及びその利用 | |
| MX2007001375A (es) | Metodo para extraer nylon a partir de materiales de desperdicio. | |
| AU2012216473B2 (en) | Biomarkers for ovarian cancer: beta-2 microglobulin | |
| WO2007022625A1 (en) | Peptide reversion methods and uses thereof | |
| MX2008000090A (en) | Biomarker for ovarian cancer:ctap3-related proteins | |
| AU2015210343A1 (en) | BIOMARKERS FOR OVARIAN CANCER: ß-2 MICROGLOBULIN |
Legal Events
| Date | Code | Title | Description |
|---|---|---|---|
| PUAI | Public reference made under article 153(3) epc to a published international application that has entered the european phase |
Free format text: ORIGINAL CODE: 0009012 |
|
| PUAL | Search report despatched |
Free format text: ORIGINAL CODE: 0009013 |
|
| 17P | Request for examination filed |
Effective date: 20100611 |
|
| AC | Divisional application: reference to earlier application |
Ref document number: 1756578 Country of ref document: EP Kind code of ref document: P |
|
| AK | Designated contracting states |
Kind code of ref document: A2 Designated state(s): AT BE BG CH CY CZ DE DK EE ES FI FR GB GR HU IE IS IT LI LT LU MC NL PL PT RO SE SI SK TR |
|
| AK | Designated contracting states |
Kind code of ref document: A3 Designated state(s): AT BE BG CH CY CZ DE DK EE ES FI FR GB GR HU IE IS IT LI LT LU MC NL PL PT RO SE SI SK TR |
|
| RIC1 | Information provided on ipc code assigned before grant |
Ipc: G01N 33/68 20060101ALI20100728BHEP Ipc: G01N 33/574 20060101AFI20100728BHEP |
|
| 17Q | First examination report despatched |
Effective date: 20110616 |
|
| STAA | Information on the status of an ep patent application or granted ep patent |
Free format text: STATUS: THE APPLICATION IS DEEMED TO BE WITHDRAWN |
|
| 18D | Application deemed to be withdrawn |
Effective date: 20120727 |