EP2024734B1 - A method of determining the feasibility of a proposed structure analysis process - Google Patents
A method of determining the feasibility of a proposed structure analysis process Download PDFInfo
- Publication number
- EP2024734B1 EP2024734B1 EP07732827.6A EP07732827A EP2024734B1 EP 2024734 B1 EP2024734 B1 EP 2024734B1 EP 07732827 A EP07732827 A EP 07732827A EP 2024734 B1 EP2024734 B1 EP 2024734B1
- Authority
- EP
- European Patent Office
- Prior art keywords
- data
- ray
- nominal
- layer
- ray data
- Prior art date
- Legal status (The legal status is an assumption and is not a legal conclusion. Google has not performed a legal analysis and makes no representation as to the accuracy of the status listed.)
- Active
Links
Images


Classifications
-
- G—PHYSICS
- G01—MEASURING; TESTING
- G01N—INVESTIGATING OR ANALYSING MATERIALS BY DETERMINING THEIR CHEMICAL OR PHYSICAL PROPERTIES
- G01N23/00—Investigating or analysing materials by the use of wave or particle radiation, e.g. X-rays or neutrons, not covered by groups G01N3/00 – G01N17/00, G01N21/00 or G01N22/00
- G01N23/22—Investigating or analysing materials by the use of wave or particle radiation, e.g. X-rays or neutrons, not covered by groups G01N3/00 – G01N17/00, G01N21/00 or G01N22/00 by measuring secondary emission from the material
- G01N23/225—Investigating or analysing materials by the use of wave or particle radiation, e.g. X-rays or neutrons, not covered by groups G01N3/00 – G01N17/00, G01N21/00 or G01N22/00 by measuring secondary emission from the material using electron or ion
- G01N23/2251—Investigating or analysing materials by the use of wave or particle radiation, e.g. X-rays or neutrons, not covered by groups G01N3/00 – G01N17/00, G01N21/00 or G01N22/00 by measuring secondary emission from the material using electron or ion using incident electron beams, e.g. scanning electron microscopy [SEM]
- G01N23/2252—Measuring emitted X-rays, e.g. electron probe microanalysis [EPMA]
Definitions
- the present invention relates to a method of automatic optimisation of a proposed structure analysis process in which an electron beam is used to excite x-rays from a multi-layered structure under one or more process conditions.
- One important method of analysing multiple thin layers on a substrate involves exposing a specimen to a beam of electrons and measuring the emitted x-ray spectrum. Provided the electron beam is sufficiently energetic to penetrate through the layers and reach the substrate, then characteristic x-rays are generated from elements in both the substrate and the various layers and these contribute to the total x-ray spectrum seen by an x-ray detector.
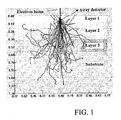
- Figure 1 shows a typical situation where a 10keV electron beam is incident on a layered sample with three layers of different thickness on a substrate. Many electron trajectories are shown and x-rays may be generated at any point along the electron trajectory as a result of ionisation of atoms.
- X-rays are emitted in all directions and if an x-ray detector is positioned above the sample, then x-rays emitted towards the detector will provide signals representative of the elements present in the regions excited by the electron beam.
- x-rays will emerge from all three layers and the substrate.
- Figure 2 the same sample is exposed to a lower energy electron beam. In this case, the electrons only penetrate to the top two layers so there will be no signal from the lowest layer and the substrate.
- the characteristic intensity for a particular element within a multi-layered sample can be expressed as a "k-ratio".
- a "k-ratio" is the ratio of the x-ray intensity received for a particular element from the structure (counts per second recorded from a characteristic x-ray emission series such as K, L or M) to that obtained from a flat bulk specimen of pure element under the same experimental conditions. Taking this ratio avoids having to know the x-ray detector collection efficiency as a function of energy. By measuring a series of k-ratios, it is sometimes possible to deduce the thicknesses and compositions of the various layers in a multi-layer specimen.
- Equation 1 typically involves integratiions and non-linear functions and in general it is not possible to "invert" the set of equations and write down a formula that expresses the thickness or compositions for any one layer in terms of a set of measured k-ratios. Therefore, to determine a set of thicknesses and compositions ("layer variables") from a set of x-ray measurements, it is known to use a modelling approach where the parameters of the model are adjusted to find a set of k i that are a "best-fit" to the measured k-ratios (see for example, Chapter 15 in " Numerical Recipes in C", Second Edition, W.H.Press et al, Cambridge University Press 1999 ).
- a computer program is used to make iterative guesses at the thickness and composition of the layers to find a set that is a close fit with the k-ratios measured from x-ray spectra (see for example, J.L.Pouchou. "X-ray microanalysis of stratified specimens", Analytica Chimica Acta, 283 (1993), 81-97 . This procedure has been made available commercially in the software product "Stratagem” by SAMx, France). The computer program will make a test at each iteration to see if the guesses are not changing significantly between iterations, in which case "convergence" is achieved.
- the iterative procedure of the computer program begins with a set of starting values for the fitted parameters (that is the "unknowns") and the choice of starting "guesses" can affect whether the iteration will converge to the best solution for a given set of input data. Therefore, even when suitable conditions can be defined for the measurements and some prior knowledge is available, the procedure can still fail if the starting guesses for the fitted parameters are not suitable.
- the digitised spectrum effectively consists of a number of independent channels that each record counts for a small range of energies.
- the spectrum is processed mathematically to remove background and correct for any peak overlap.
- Each channel count in the original spectrum is subject to Poisson counting statistics and this will cause variation in the derived peak areas.
- a standard method to obtain estimates of reproducibility for such non-linear problems is to use Monte Carlo simulation (see “ Numerical Recipes in C", Second Edition, W.H.Press et al, Cambridge University Press 1999, p689 ).
- Monte Carlo simulation a set of results is first obtained from a set of input data.
- a set of random numbers representing the appropriate statistical distribution is added as a perturbation to the input data and the results found by iterative solution. These results will be slightly different from the results without the perturbations and the differences are recorded. This process is repeated many times with new sets of random numbers and the changing output results can be used to calculate the standard deviation for each result value as a consequence of counting statistics affecting the input data.
- this sensitivity analysis approach has been used in the specialised field of x-ray fluorescence analysis where x-rays from an x-ray tube are used to excite an x-ray spectrum from the specimen ( US 6118844 ).
- individual channel counts in the uncorrected x-ray data are subjected to counting statistic perturbations to predict the effect, after corrections for peak overlap, on the uncertainty in calculated layer thickness by the fluorescence method.
- the investigator can simulate an entire spectrum from an assumed composition, gaining powerful benefits in setting up an experiment and in confirming the results. It further describes a fast method of spectrum simulation, suitable for energy-dispersive spectroscopy (EDS), and assesses the accuracy using 309 spectra from samples of known composition. These include K, L, and M lines from elements of atomic number 6-92, excited by beam energies in the range of 5-30 keV. The RMS error between 360 measured and calculated peak intensities was found to be 7.1%. Central to the method is the use of the ratio of peak intensity/total background intensity, which allows spectra to be compared from instruments of differing collection efficiency, thereby easing the collection of data over a wide range of conditions.
- EDS energy-dispersive spectroscopy
- US2003/0118148 A1 discloses that where an object to be analysed in an X-ray fluorescence analysis is a thin film sample, an X-ray fluorescence spectrometer facilitates selection of proper secondary X-ray lines to be measured to thereby facilitate an accurate analysis.
- the spectrometer includes a measuring line evaluating means 23 operable to calculate for each specified secondary X-ray line to be measured, a first theoretical intensity at a specified thickness and a composition of each of layers in the thin film and a second theoretical intensity at the thickness and the composition thereof when the thickness or a concentration has been changed by a predetermined quantity, to calculate a precision of a thickness or a precision of the concentration based on the first and second theoretical intensities, and to determine applicability or inapplicability of an analysis using the specified secondary X-ray line to be measured.
- the invention can therefore be thought of as providing a simulation tool for determining whether a given multi-layer structure is "soluble" (for example in terms of determining the composition and/or thickness of each layer) by using an analysis technique based upon electron beam excitation of x-rays and to find the best conditions for that analysis.
- a multi-layered structure comprises at least one thin layer located upon a substrate.
- a substrate is not required although normally this will be present.
- the invention may therefore be utilised in optimising the conditions for performing the analysis process and/or for determining the attainable precision or reproducibility in the "fitted" parameters estimated by this method.
- the x-ray data are generated using a predictor model as a function of the elemental composition and layer thickness of each layer in the multi-layered structure.
- the predictor model may be used to generate x-ray data representing the characteristic x-ray intensity response for a particular element within the multi-layered structure.
- X-ray data for the structure as a whole can therefore be built up in this way by calculating the characteristic x-ray intensity response for each element.
- the predictor model (“thin film model") can always predict k-ratios in the 'forward' direction as shown by equation 1 provided thicknesses and concentrations ("layer variables”) are defined for all layers.
- the structure data is defined as nominal structure data in terms of compositions and layer thicknesses for each layer, the nominal structure data producing corresponding nominal x-ray data and wherein, in step (ii), the x-ray data is modified and input, together with the nominal structure data, into a structure solver adapted to iteratively change the composition and thickness of each layer of the multi-layer structure to see the effect on the predicted x-ray data and find values that match the input x-ray data and thus produce output structure data that is consistent with the input x-ray data.
- the structure solver preferably applies equation 1 in search of a solution.
- the effects of modifications to the x-ray data are then analysed by comparing the output structure data with the nominal structure data in accordance with a feasibility criterion.
- the feasibility criterion is met if, for every modification to the input x-ray data, the structure solver produces a unique set of output structure data having corresponding x-ray data that is substantially identical to the nominal x-ray data.
- K j just one of the k-ratios, K j , is incremented by a small amount (say 1%) and the other k-ratios are unchanged, then when the iterative solution is attempted, the k-ratios will agree with equation 1 except for K j .
- K j the change in K j is sufficiently large, then the test for convergence will fail and the iterative procedure will have to perform an iteration and make an adjustment to the unknown values. This will change the prediction of k-ratios and may lead to further iterations. If the iterations fail to converge, then the problem is clearly unstable.
- the variance, V i in the calculated layer variable T i can be estimated as the sum of ((dT i /dK j ) 2 . ⁇ i 2 ) for all j. Furthermore, systematic errors can occur in measured K j . For example, if the beam current increases during the acquisition of an x-ray spectrum, then all K j derived from this spectrum will be increased in the same proportion.
- the error in the calculated variable T i can be estimated as the sum of ((dT i /dK j ).e j ) for all j.
- a figure of merit can be computed for each source of error. For example, in the case of statistical errors, the maximum relative standard deviation in T i , that is square root of (V i /T i 2 ), gives the "worst case" relative error and a low value for this figure of merit would be desirable. Alternatively, the average relative error for all T i or the relative error for a specific layer variable can be chosen for the figure of merit. Similar figures of merit can be computed for errors due to systematic causes such as beam current variation.
- a typical specimen structure can be defined, then for one set of experimental conditions, in particular the beam energy, the possibility of solving the problem can be tested and one or more figures of merit can be computed to measure the effect of various potential sources of error on the results. If this procedure is repeated at several candidate experimental conditons, then the best set of conditions can be found that minimises the effect of one or more sources of error. If one source of error is likely to dominate, then the conditions that minimise the figure of merit for that error source is appropriate. Alternatively, if realistic values for, ⁇ i and e j are available, then some combination of the related figures of merit can be used, such as the maximum of both figures of merit, to find the experimental conditions that are optimal.
- the structure data is defined as nominal structure data comprising compositions and layer thicknesses for each layer, the nominal structure data producing corresponding nominal x-ray data and wherein, in step (ii), the structure data is modified and input as starting guesses, together with the nominal x-ray data, into a structure solver adapted to iteratively calculate the composition and thickness of each layer of the multi-layer structure as output structure data using these starting guesses.
- the structure solver may therefore calculate x-ray data for the modified structure data and compare the modified x-ray data with the nominal x-ray data.
- the effects of the modification to the structure data are analysed by comparing the x-ray data generated for the modifications in the structure data with the nominal x-ray data and comparing the results of the comparison with a feasibility criterion.
- the feasibility criterion may be deemed met if a unique set of output structure data is found which produces corresponding predicted x-ray data that is substantially identical to the nominal x-ray data and is substantially independent of the modifications applied to the structure data.
- each set of x-ray data may be entered, together with the nominal structure data, into an iterative structure solver for generating output structure data.
- the process may be deemed feasible if, for every modification to the x-ray data the structure solver produces a unique set of output structure data having corresponding x-ray data that is substantially identical to the nominal x-ray data.
- Another alternative method of performing the invention comprises in step (i) generating one or more sets of predicted spectral data, each set representing the x-ray excitation response of the structure according to a respective one of the said process conditions and x-ray data are derived from the predicted spectral data wherein step (ii) comprises calculating output structure data for each set of process conditions, using x-ray data derived from each generated set of spectral data and nominal structure data.
- This method preferably uses a predictor model to generate numerous sets of spectral data for analysis by a structure solver.
- the standard deviation in measured k-ratios will depend on the process conditions and can be calculated from physical theory for the typical specimen structure under consideration.
- the spectral data can be predicted according to a set of process conditions.
- process conditions may include data concerning the type of physical apparatus used and the experimental conditions used, such as for example the acquisition time used for obtaining the spectral data.
- information used to predict the spectral data include the incident beam keV, the beam current, the solid angle for collection of x-rays, the take-off-angle for the emergent x-rays, the tilt of the specimen surface and spectrometer adjustable parameters (such as resolution and acquisition time). It is also necessary in this case to specify the particular elements and line series for which the spectral data are to be generated.
- the form that the spectral data takes is also dependent upon the technique used to generate the spectral data. Typically it will depend upon the format required as an input for the calculations.
- the spectral data may therefore comprise predicted x-ray intensity data for example in the form of k-ratios as described earlier.
- the method preferably further comprises generating elemental spectral data for pure elements and using the elemental spectral data in the generation of the x-ray data. Typically this involves dividing the "structure" x-ray data values by the elemental x-ray data values.
- the "feasibility" of the structure analysis process is not limited to mean whether or not it is possible for the analysis process to arrive at the fitted parameters at all, but also in the sense of whether the fitted parameters arrived at have a sufficient level of reproducibility or accuracy. In making a feasibility determination it is therefore important to model the x-ray emission from the multi-layered structure to a sufficient level of accuracy.
- Real life x-ray excitation involves the probabilistic effects of counting statistics.
- the method further comprises running the iterative solution procedure a number of times, so as to simulate the effects of Poisson counting statistics within each data set by adding random numbers to the spectral data. This effectively simulates the effect of performing a practical analysis experiment a number of times.
- Another technique that can be used to take the counting statistics into account is to perform calculations so as to predict the statistical distribution of x-ray peak areas due to Poisson counting statistics and then to apply the statistical distribution to the spectral data.
- the effective ⁇ i for each k-ratio can be calculated and used in the Monte Carlo approach described above, rather than simulating many spectra with counting statistics and processing each one to obtain a peak area.
- the present invention can also be used to monitor the effects of such errors by modelling such systematic errors into the spectral data.
- the iterative solution procedure may be repeated a number of times in investigating the effects of these systematic errors in the spectrum processing upon the fitted parameters. This can also be achieved by adding the potential relative variance due to spectrum processing errors in quadrature with the relative variance due to counting statistics.
- the results of of the iterative solution procedure are typically a value for each fitted parameter.
- a value is normally a numerical value although it could also be a selection of particular data from a group of data. For example such data might represent further information about the type of multi-layered structure.
- each fitted parameter is a composition (such as the amount of a particular element) or a layer thickness.
- they may comprise different "types" of parameters, such as a mixture of composition and thickness parameters.
- the program that drives the iterative solution procedure typically also includes a number of parameters which may be selected and thereby influence the feasibility of performing the analysis process.
- the "fitted" parameters which are to be determined may begin as undefined values in some calculation models.
- typically starting values are provided for the "fitted" parameters and these are modified as the calculation proceeds so as to converge upon a single solution for each fitted parameter.
- the structure parameters used may likewise be modified.
- the structure parameters define certain aspects of the multilayered structure, including information that is known about certain layers, for example the number of layers, the thickness of particular layers, the partial or total composition of particular layers and so on.
- the iterative solution procedure may therefore be repeated a number of times for each set whilst varying the structure parameters used in the calculation.
- the analysis typically further comprises calculating a statistical distribution of the output fitted parameters. This analysis may be performed for the data within each set (for example where numerous spectra are produced due to counting statistics), for results due to the different starting parameters or for sets (due to the different experimental conditions selected for each set), or indeed a combination of one or more of these.
- the method further comprises calculating a standard deviation for each estimated fitted parameter as a measure of achievable precision for the analysis process. This is advantageous since one goal of the method in a practical implementation is to achieve a predetermined level of precision for a predetermined total measurement time.
- the invention Whilst the invention is limited to x-ray excitation using electron beams, the invention does include proposed structure analysis processes in terms of energy dispersive apparatus (EDS) and wavelength dispersive apparatus (WDS). Each of these may be considered as spectral data.
- EDS energy dispersive apparatus
- WDS wavelength dispersive apparatus
- the proposed process will not be feasible to use if the calculations are unable to produce meaningful results for the fitted parameters. This will be the case if the method is unable to produce single solutions for the fitted parameters.
- the data (such as parameters and conditions data) which cause such failures are typically recorded for later analysis.
- the method preferably further comprises selecting new conditions and repeating the method using spectral data generated according to the new conditions. The method therefore explores other conditions which may produce meaningful results for the fitted parameters.
- the invention therefore allows the feasibility of a proposed structure analysis process to be investigated without the need for expensive and lengthy practical investigations. This is extremely useful in commercial structure analysis processes, for example where products are produced containing multi-layered structures and automatic electron beam x-ray excitation analysis apparatus is provided for quality control purposes.
- the invention therefore allows the feasibility of a particular process to be investigated, this process having certain associated conditions and parameters, for all likely variations in the products (multi-layered structures) to be analysed. If a certain proposed analysis process having an associated set of conditions and parameters is deemed unable to converge upon a solution, then the modification of the conditions and/or parameters according to the method can allow a different proposed analysis process to be selected. If the desired precision cannot be achieved under any conditions, this will save wasted time and allow alternative characterisation methods to be sought.
- step (ii) may comprise analysing the response of the predictor model to small changes in the layer thickness and/or composition within the structure data.
- the behaviour of the predictor model may be analysed as an approximated series expansion for changes from the nominal values.
- the behaviour of the predictor model may be represented as a matrix equation, wherein x-ray data output from the predictor are represented as a vector of M values, wherein unknown layer thicknesses and/or compositions are represented as a vector of N variables, and wherein the partial derivatives relating the outputs to the layer thicknesses or compositions are represented as an M by N dimension Jacobian matrix.
- An analysis may therefore be performed to find if there is always a unique combination of small changes to unknown layer thicknesses and concentrations that can produce an arbitrary set of changes to the nominal x-ray data.
- One particular approach is that of singular value decomposition (SVD).
- the method may further comprise calculating the condition number representing the degree of solubility of the matrix equation for the layer thicknesses or compositions. This condition number may be compared with a threshold so as to comprise a feasibility criterion.
- equation 1 can be linearized by considering small differences; that is, using a first order Taylor series expansion, the differences (k i - k0 i ) are linear combinations of the small differences (T i - T0 i ) where k0i are the measured k-ratios corresponding to the correct layer variables T0 i and k i are the predicted k-ratios for T i from equation 1.
- the iterative procedure has to work out what combination of changes in T i are necessary to produce the change from k i to the give the measured k0 i .
- the effect of small changes can be determined by repetitive forward calculations using equation 1. If all the layer variables are initially set to their correct values, then the k0 i . can be computed.
- delta-k i k i - k0 i
- the quadrature sum used in standard "propagation of errors" can be used whereas if there are systematic changes such as that produced by a change in beam current for example, the straightforward linear combination can be used to predict the effect on determined layer variables.
- any iterative solution procedure will not be able to find a unique solution.
- the real iterative procedure can be tested for these optimum conditions by first simulating k-ratios from equation 1 for the correct specimen structure and then checking that, with these k-ratios as input, the procedure converges to the correct values T0 i using starting guesses that are all different from T0 i . If convergence is not achieved, then this shows that there is room to improve the iteration solution procedure so that it can address the current analytical problem effectively.
- the steps of the method will be performed upon a computer by the method being embodied within computer software ("computer-implemented"). Some such models will require powerful computers, particularly Monte Carlo techniques, in order to produce results with sufficient speed. Whilst the method may be performed upon a single computer such as that of an x-ray analysis system, it will be appreciated that different parts of the method could be performed upon different computers either independent of one another or, more preferably, linked over a network such as the Internet.
- a general overview is firstly provided according to one embodiment in terms of how the invention can advantageously provide a simulated experimental environment for exploring the capabilities of thin film software to solve a particular analysis problem.
- a software model is used to generate x-ray spectral data for a proposed sample and the data are analysed by "thin film analysis" software in order to determine whether the software is capable of deducing the structure of the sample by fitting certain "unknown" parameters.
- a proposed sample is defined, this having the multi-layered structure in the form of a thin film deposited upon a substrate.
- the specification for the sample is provided in terms of the approximate elemental composition, namely a composition typical of the sample to be analysed. This will in general be approximately the same as one of the unknowns that may be eventually analysed for real.
- the proposed sample is also defined in terms of the substrate and layers and the thicknesses of these layers.
- a first set of conditions is chosen, such as an electron beam energy, together with a beam current, x-ray detector parameters and an acquisition time.
- a typical x-ray spectrum that would be obtained from such a sample is then calculated from theory taking account of the characteristics of the x-ray detector and including suitable random number additions to simulate the effect of x-ray counting statistics.
- x-ray spectra are synthesised for other conditions, namely each incident beam voltage and measurement condition that is expected to be necessary.
- the synthesised x-ray spectra are then processed mathematically using the same algorithms that would be used on real spectra. These algorithms are typically used to subtract bremsstrahlung background and deal with the effects of spectral peak overlap to obtain a set of peak areas in counts and hence the peak intensities in counts per second. In addition the expected statistical standard deviation for each peak intensity may be calculated.
- the peak intensities are then converted into data suitable for input to the thin film analysis software program. This typically involves dividing the intensity by the value that would be obtained from a semi-infinite flat sample of pure element under the same excitation conditions. The pure element intensity is also determined by spectrum synthesis and the ratio is typically termed the "k-ratio" for that elemental line.
- the "spectral data" are generated which represent that which would be generated by a sample in a real experiment.
- the thin film analysis software for performing the calculation is then configured by selecting which elemental lines are to be used, which parameters of the real problem are unknown (that is thicknesses and/or composition values), which parameters are known and typical starting "guesses” are used for the unknown parameters to be fitted.
- the theoretical k-ratios for one set of conditions are then supplied as input data to the thin film analysis software which is then run in an attempt to find a solution by iteration that is consistent with the input k-ratios. If convergence is not achieved, different sets of conditions are tried and corresponding spectra synthesised to find a configuration that works. When convergence is achieved, the results for each estimated thickness and composition value are recorded.
- a new set of theoretical k-ratios are then obtained. This can be achieved by repeating the whole spectrum synthesis procedure for each condition using a different set of random numbers to provide the effects of x-ray counting statistics.
- the calculated standard deviations for derived peak intensities can be used to generate suitable Gaussian-distributed random numbers that are used to perturb each k-ratio by a random amount consistent with the expected standard deviation of the corresponding peak intensity.
- the set of k-ratios are used as input data to the thin film analysis software and the results for each estimated thickness and composition are recorded. This process effectively mimics a second experiment on the sample and the results will in general be different from the first experiment.
- the recorded results for each experiment show the variation in results that would be expected in practice when similar conditions are used.
- the mean and standard deviation for the results for the same parameter can then be calculated and provide an estimate of the precision that can be attained using a particular set of beam voltages and acquisition conditions.
- Potential measurement inaccuracy can also be taken into account in the simulation. For example, besides the variation due to x-ray counting statistics, the peak intensities may fluctuate from experiment to experiment because of variations in incident electron beam current. The likely percentage fluctuation in beam current can be added in quadrature to the fluctuation due to counting statistics to realistically represent these random excursions.
- Systematic inaccuracies may be expected from spectrum processing (see for example, " Limitations to accuracy in extracting characteristic line intensities from x-ray spectra", P.J.Statham, J. Res. Natl. Inst. Stand. Technol. 107, 531-546 (2002 )).
- X-ray spectrometers can often be calibrated to minimise these inaccuracies and for a given spectrometer and analysis problem it is often possible to estimate the worst case systematic error that could occur on a given peak area estimated by spectrum processing. If this error value is used in place of the estimated statistical standard deviation in the above procedure to randomly perturb the input k-ratio, the spread in results gives an estimate of the inaccuracies in determined thicknesses and concentrations that could result from errors in spectrum processing.
- the invention thus provides a test bed for exploration to find a feasible set of conditions to use for real samples and gives a method for estimating the precision or reproducibiltiy of results caused by counting statistics and likely causes of fluctuation such as beam current. Furthermore, the test bed provides a method for estimating the likely consequences of inaccuracies involved in spectrum processing. Inaccuracies in the theoretical calculations within the thin film analysis software may still give systematic errors in the estimated thicknesses and concentrations. These systematic errors can usually be minimised by performing relative measurements using standards with known parameters.
- FIG. 3 An overview of a physical system 1 for performing a prior art structure analysis process of multi-layer samples (such as thin films) is shown in Figure 3 .
- the system comprises a scanning electron microscope (SEM) 2 having an x-ray analysis system 3, this being an INCA Energy x-ray analysis system (manufactured by Oxford Instruments Analytical Limited).
- the SEM has a chamber 4 containing a specimen holder 5 which can be tilted.
- An incident beam of electrons is emitted by an electron gun 6, this being focused upon a specimen 10 held within the specimen holder.
- Characteristic x-rays that are emitted as a result of the electron beam are detected by a detector 11 forming part of the x-ray analysis system 3.
- the SEM 2 includes a control computer 15 upon which software is executed to control the operation of the system 1.
- This computer can control the kV used to accelerate electrons from the electron gun 6 and thus alter the energy for the focused electron beam striking the specimen.
- an electron beam energy and beam current is selected and an x-ray spectrum is acquired for a chosen acquisition time.
- Element peak intensities are obtained from the spectrum using a suitable method (for example " Deconvolution and background subtraction by least squares fitting with prefiltering of spectra", P J Statham, Anal. Chem. 49, 2149-2154, 1977 incorporated herein by reference). While the experimental conditions are stable, a known standard is moved under the beam into the same position occupied by the specimen 10 and a reference x-ray spectrum is obtained from the standard.
- the spectrum from the standard measurement is used to obtain the peak intensities that would be obtained from a flat sample of bulk pure element for each of the elements in the specimen to be analysed.
- Either a series of pure element or compound standards can be used, or a single standard can be used and the corresponding intensities worked out by applying calculated scaling factors to the appropriate standard measurement (see for example the operating manual for the thin film program "Stratagem” sold by SAMx, France). If necessary, the specimen and standard measurements are repeated at more incident beam energies.
- a thin film analysis program (for example, "Stratagem” sold by SAMx, France) is then used to calculate the thicknesses and compositions of the various layers. To do this, the number of layers must be defined and any available information on substrate composition and composition of the various layers is supplied. Any unknown thicknesses and compositions will be determined by the program using the measured k-ratios for the elements involved at one or more beam energies. The k-ratio for each measured element is calculated and supplied as input to the thin film program which then attempts to find best fit parameters to the model by iteration. If the thin film program fails to converge, an error warning is given. Otherwise, the program gives a set of estimates for thicknesses and compositions for all the unknowns in the sample.
- the method begins at step 100 in which the structure of the multi-layered sample is defined in terms of parameters for use in the x-ray excitation model. Typical parameters include the number of layers, the thickness and density of each layer, the concentrations of each element in each layer and the concentrations in the substrate.
- each x-ray spectrum acquisition includes the incident beam energy for electrons (SEM kV), beam current, geometry of the sample (particularly take-off-angle for detected x-rays), total acquisition time and detector solid angle for collection of x-rays.
- SEM kV incident beam energy for electrons
- beam current geometry of the sample (particularly take-off-angle for detected x-rays)
- total acquisition time and detector solid angle for collection of x-rays.
- One or more of different conditions are specified up to a total of NC, using these parameters.
- a thin film program (the model for calculating the unknown fitted parameters), this being "Stratagem” in this example, is initialised according to the prior knowledge available (step 110).
- K, L or M emission series to use for measurement
- these can be fixed so they do not change in the iterative solution process. Some elements may be combined in fixed proportions with others and these relationships can be used to enforce conditions that help the program to find a solution.
- x-rays are recorded, a choice is made of which element series to measure to find k-ratios.
- guesses are assigned as starting parameters for the unknown thicknesses and concentrations that are to be estimated (fitted). To be a realistic test of what would happen with a real specimen, these starting parameters should be generic choices rather than exactly the same as for the typical specimen being simulated.
- a suitable prediction model is used to calculate the predicted x-ray spectrum data that would be obtained from flat homogeneous bulk samples of pure elements for the NC specified conditions.
- an accurate theoretical model has been achieved (see " Improved X-ray Spectrum Simulation for Electron Microprobe Analysis", Peter Duncumb, Ian R. Barkshire, Peter J. Statham, Microsc. Microanal. 7, 341-355, 2001 ).
- the method described in the abovementioned paper (which is incorporated herein by reference) is applied in this example.
- This model calculates the emitted spectral intensity and takes account of the efficiency of the detection system used to record the spectrum.
- the intensities for the selected emission series for pure bulk elements at the specified conditions are determined.
- the pure element intensities will be greater than those for the same elements in the multilayer specimen and longer acquisition times can be used for the reference pure element data so any statistical effects on the pure element measurements can be made negligible relative to those that effect the measurements of the specimen.
- a model is used to calculated the predicted x-ray spectrum data that would be obtained from the multilayer specimen for the NC specified conditions.
- the model used for prediction of bulk samples can be combined with existing models to predict intensity for multilayers on substrates (for example " Quantitative analysis of homogeneous or stratified microvolumes applying the model "PAP”.", Pouchou, J.L. & Pichoir, F. (1991) In: Electron Probe Quantitation, Heinrich, K.F.J. & Newbury, D.E. (eds), Plenum Press, New York, 31 - 75 incorporated herein by reference).
- a hypothetical bulk sample spectrum is synthesised using the above theoretical model for bulk samples (implemented in the "INCA Energy” product, Oxford Instruments Analytical Limited).
- the element concentrations and beam current for this hypothetical spectrum are adjusted iteratively until the peak areas in the synthesised spectrum give the same k-ratios that are predicted by the thin film program "Stratagem” relative to pure element spectra taken at the specified beam current. Since, for a particular element both bremsstrahlung background intensity and peak intensity is approximately proportional to elemental concentration and film thickness, a simulated bulk spectrum with the same peak areas as a real spectrum will also exhibit a bremsstrahlung background that is similar to that which would be achieved in the real spectrum from a multi-layer specimen. This similarity ensures that statistical counting effects on the precision of background subtraction will be adequately modelled. Spectra are synthesised in this way for all NC conditions at step 120.
- Each channel count in a real x-ray spectrum is subject to Poisson counting statistics.
- Poisson counting statistics are modelled by the use of computer generated random numbers. An uncorrelated sequence of numbers is thereby generated and added to all the channels in each of the NC spectra (step 125).
- Each spectrum is then processed at step 130 to remove background and correct for peak overlaps (a suitable technique is described in " Deconvolution and background subtraction by least squares fitting with prefiltering of spectra", P J Statham, Anal. Chem. 49, 2149-2154, 1977 , incorporated herein by reference) to find the peak areas for the required element line series.
- K-ratios are required for input to the "Stratagem” thin film program.
- the k-ratios are calculated by ratioing the calculated intensities with respect to those for the pure elements (step 135).
- the thin film program is then executed using the input k-ratios to see if it can find a solution by iteration for all the unknown parameters (step 140) for each of the NC conditions. If it fails to converge, then a warning is given and the operator can select a new set of conditions and initialisation for the thin film (return to step105).
- step 145) a new "instance” is created by adding a new set of random numbers to give a new set of input data for each of the NC conditions.
- This "instance” represents another real experiment and when enough instances have been simulated, the overall standard deviation on the calculated results for all the instances can be determined in the analysis step 150.
- step 125' the method described in " Deconvolution and background subtraction by least squares fitting with prefiltering of spectra", P J Statham, Anal. Chem. 49, 2149-2154, 1977 (incorporated herein by reference), is used to predict the standard deviations for the peak areas determined by spectrum processing.
- these standard deviations are used to modulate a random number generator to produce Gaussian distributed values for the k-ratios with the expected relative standard deviation (step 135').
- the conditions, number of measurements, acquisition times for x-ray spectra and initialisation of the thin film program can be adjusted to optimise the achievable precision for a given total measurement time.
- the thin film program "Stratagem” uses an approximation for the depth distribution of x-ray generation to enable a fast calculation of emitted intensities from the various layers.
- a Monte Carlo simulation of electron scattering and ionisation see for example, " The use of tracer experiments and Monte Carlo calculations in the phi(rho-z) determination fo electron probe microanalysis", P.Karduck and W.Rehbach, (1991) In: Electron Probe Quantitation, Heinrich, K.F.J. & Newbury, D.E. (eds), Plenum Press, New York, 191-217 incorporated herein by reference).
- the intensity can be predicted directly for a multi-layered specimen by using suitable cross sections for characteristic and bremsstrahlung radiation (for example see R. Gauvin and E. Lifshin (2002), “On the Simulation of True EDS X-Ray Spectra", Microscopy & Microanalysis, Vol. 8, Supp. 2, pp. 430 - 431, 2002 , incorporated herein by reference).
- the spectrometer efficiency for either EDS or WDS is used to convert the calculated emission for a given beam current into a measured x-ray intensity.
- the Monte Carlo simulation is run to calculate intensities for the typical sample to find the k-ratios.
- the thin film model can always predict k-ratios in the 'forward' direction as shown by equation 1 provided thicknesses and concentrations ("layer variables") are defined for all layers. If these k-ratios are provided as inputs to the structure solver and the starting values for the unknowns are set to the values corresponding to the hypothetical specimen, then equation 1 will predict k-ratios identical to the starting values and the iteration will converge immediately.
- K j just one of the k-ratios, K j , is incremented by a small amount (say 1%) and the other k-ratios are unchanged, then when the iterative solution is attempted, the k-ratios will agree with equation 1 except for K j .
- K j the change in K j is sufficiently large, then the test for convergence will fail and the iterative procedure will have to perform an iteration and make an adjustment to the unknown values. This will change the prediction of k-ratios and may lead to further iterations. If the iterations fail to converge, then the problem is clearly unstable.
- Systematic errors can occur in measured K i . For example, if the beam current increases during the acquisition of an x-ray spectrum, then all K i derived from this spectrum will be increased in the same proportion. If an estimate of the systematic error, e i , in the measure K i is available, then the error in the calculated variable T i can be estimated as the sum of ((dT i /dK j ).e j ) for all j.
- a figure of merit can be computed for each source of error. For example, in the case of statistical errors, the maximum relative standard deviation in T i , that is square root of (V i /T i 2 ), gives the "worst case" relative error and a low value for this figure of merit would be desirable. Alternatively, the average relative error for all T i or the relative error for a specific layer variable can be chosen for the figure of merit. Similar figures of merit can be computed for errors due to systematic causes such as beam current variation.
- a typical specimen structure can be defined, then for one set of experimental conditions, in particular the beam energy, the possibility of solving the problem can be tested and one or more figures of merit can be computed to measure the effect of various potential sources of error on the results. If this procedure is repeated at several candidate experimental conditons, then the best set of conditions can be found that minimises the effect of one or more sources of error. If one source of error is likely to dominate, then the conditions that minimise the figure of merit for that error source is appropriate. Alternatively, if realistic values for, ⁇ i and e i are available, then some combination of the related figures of merit can be used, such as the maximum of both figures of merit, to find the experimental conditions that are optimal.
- the true specimen structure is used to predict a set of k-ratios from equation 1 for all the NC conditions. These k-ratios are then used as input to the structure solver with a set of starting guesses for the unknown layer variables, T0 j , that are all slightly different from the true values. For example, these starting guesses could all be 1% greater than the true values or differences could be selected using a random number generator while still keeping the maximum relative difference to within a few %.
- the iterative structure solver is then started and it will attempt to adjust the unknown layer variables so that equation 1 predicts the k-ratios supplied as input for the NC different conditions. If convergence cannot be achieved, or the output values for any of the unknown layer variables are substantially different from the true values then this shows that it is not feasible to use this particular set of NC conditions for the structure analysis process so a new set of conditions needs to be tried.
- the program that is used to find a solution by iteration may fail because it has limitations on its iteration procedure or uses an unsuitable algorithm. If iteration does fail, then it is not easy for the user to decide what is necessary to be changed in order to achieve a result. Furthermore, in order to establish feasibility it is necessary to run the structure solver routine which involves many iterations where at each iteration a full set of k-ratios have to be calculated by equation 1.
- a more efficient method of establishing feasibility involves checking the mathematical behaviour of equation 1.
- the change delta-k i in k-ratio k i can be used to estimate the partial derivative ( ⁇ K i / ⁇ T j ) ⁇ delta-k i /delta-T j .
- the beam voltage E 0 and the known layer variables will remain fixed in equation 1
- the MxN matrix of partial derivatives is the "Jacobian" for the model function in equation 1 with respect to the N unknown layer variables at a point in layer variable space.
- ICN inverse condition number
- the same principle can be applied if measurements of k-ratios are taken at more than one beam energy. For each E 0 the partial derivatives of the measured k-ratios are evaluated using the appropriate E 0 in equation 1 and added to the J matrix as additional rows. ICN is then evaluated at each combination of beam energies to find a combination where the problem is soluble. A multi-dimensional search will find at what combinations of beam energies the problem is soluble.
- equation 4 If there is no condition where equation 4 is soluble, then the only way to solve the problem is to remove the linear relationships between columns that are causing J to be ill conditioned.
- the layer variables involved can be identified using the SVD results (see for example, A.K. Bandyopadhyay et al, Int. J. Numer. Model. 2005; 18:413-427 ). Once identified, it may be possible to fix one or more of the unknown variables rather than leave them to be determined. The problem may then be mathematically soluble although the solution will now depend on the values chosen for the now fixed variables.
- any fluctuations in K m will result in fluctuations in T as determined by equation 4.
- the fluctuations in each K m j are correlated, as for example when beam current fluctuates during the measurement, then the error in T i will be the linear sum of P ij .
- d j would be the error in K m j involved in estimating the area of the peak in the x-ray spectrum.
- a figure of merit can be calculated for each source of error, for example, this could be the maximum relative error in T i or the mean square error in T i .
- the invention finds particular application in electron beam excited x-ray analysis for layers between 1 and 100nm in thickness, as occurs in semiconductor processes (metal and dielectric layers), magnetic thin films and catalytic chemistry for example.
Landscapes
- Physics & Mathematics (AREA)
- Health & Medical Sciences (AREA)
- Life Sciences & Earth Sciences (AREA)
- Chemical & Material Sciences (AREA)
- Analytical Chemistry (AREA)
- Biochemistry (AREA)
- General Health & Medical Sciences (AREA)
- General Physics & Mathematics (AREA)
- Immunology (AREA)
- Pathology (AREA)
- Analysing Materials By The Use Of Radiation (AREA)
Applications Claiming Priority (2)
| Application Number | Priority Date | Filing Date | Title |
|---|---|---|---|
| GBGB0609744.8A GB0609744D0 (en) | 2006-05-16 | 2006-05-16 | Method of determining the feasibility of a proposed x-ray structure analysis process |
| PCT/GB2007/001803 WO2007132243A1 (en) | 2006-05-16 | 2007-05-16 | A method of determining the feasibility of a proposed structure analysis process |
Publications (2)
| Publication Number | Publication Date |
|---|---|
| EP2024734A1 EP2024734A1 (en) | 2009-02-18 |
| EP2024734B1 true EP2024734B1 (en) | 2018-06-20 |
Family
ID=36660296
Family Applications (1)
| Application Number | Title | Priority Date | Filing Date |
|---|---|---|---|
| EP07732827.6A Active EP2024734B1 (en) | 2006-05-16 | 2007-05-16 | A method of determining the feasibility of a proposed structure analysis process |
Country Status (5)
| Country | Link |
|---|---|
| US (1) | US8346521B2 (https=) |
| EP (1) | EP2024734B1 (https=) |
| JP (1) | JP5150620B2 (https=) |
| GB (1) | GB0609744D0 (https=) |
| WO (1) | WO2007132243A1 (https=) |
Families Citing this family (12)
| Publication number | Priority date | Publication date | Assignee | Title |
|---|---|---|---|---|
| US7411188B2 (en) | 2005-07-11 | 2008-08-12 | Revera Incorporated | Method and system for non-destructive distribution profiling of an element in a film |
| US8065094B2 (en) | 2008-07-30 | 2011-11-22 | Oxford Instruments Nonotechnology Tools Unlimited | Method of calculating the structure of an inhomogeneous sample |
| US8300501B2 (en) * | 2009-12-23 | 2012-10-30 | The United States Of America As Represented By The Scretary Of The Navy | Supercavitating projectile tracking system and method |
| US8513603B1 (en) * | 2010-05-12 | 2013-08-20 | West Virginia University | In-situ determination of thin film and multilayer structure and chemical composition using x-ray fluorescence induced by grazing incidence electron beams during thin film growth |
| US8666703B2 (en) * | 2010-07-22 | 2014-03-04 | Tokyo Electron Limited | Method for automated determination of an optimally parameterized scatterometry model |
| US9899185B1 (en) * | 2015-04-21 | 2018-02-20 | Applied Materials Israel Ltd. | Resolving ambiguities in an energy spectrum |
| JP6377582B2 (ja) * | 2015-08-06 | 2018-08-22 | 株式会社リガク | X線分析の操作ガイドシステム、操作ガイド方法、及び操作ガイドプログラム |
| EP3825681B1 (en) * | 2019-11-20 | 2025-03-12 | Bruker Nano GmbH | Method for determining a material composition |
| JP7105261B2 (ja) * | 2020-02-18 | 2022-07-22 | 日本電子株式会社 | オージェ電子分光装置および分析方法 |
| WO2023002226A1 (en) * | 2021-07-23 | 2023-01-26 | Oxford Instruments Nanotechnology Tools Limited | Improved navigation for electron microscopy |
| CN118974655A (zh) * | 2022-04-04 | 2024-11-15 | Asml荷兰有限公司 | 用于掩埋特征的套刻测量的电子束优化 |
| CN118465199B (zh) * | 2024-07-11 | 2024-11-12 | 江华新材料科技(江苏)有限公司 | 一种聚乳酸无纺布的抗菌性能检测方法及装置 |
Family Cites Families (14)
| Publication number | Priority date | Publication date | Assignee | Title |
|---|---|---|---|---|
| JP2884692B2 (ja) * | 1990-04-19 | 1999-04-19 | 株式会社島津製作所 | 蒸着膜で被覆した試料の定量測定法 |
| JP3010598B2 (ja) * | 1990-12-29 | 2000-02-21 | 株式会社島津製作所 | 薄膜で覆われた試料のx線分光分析方法 |
| JP3132678B2 (ja) * | 1991-07-25 | 2001-02-05 | 株式会社島津製作所 | 薄膜試料の厚さ測定及び元素定量分析方法 |
| FR2705785B1 (fr) * | 1993-05-28 | 1995-08-25 | Schlumberger Ind Sa | Procédé pour déterminer la fonction d'atténuation d'un objet par rapport à la transmission d'une épaisseur de référence d'un matériau de référence et dispositif pour la mise en Óoeuvre du procédé. |
| DE19739321C2 (de) * | 1997-09-09 | 2001-09-27 | Helmut Fischer Gmbh & Co | Verfahren und Einrichtung zum Bestimmen der Meßunsicherheit bei Röntgenfluoreszenz-Schichtdickenmessungen |
| JP3409742B2 (ja) * | 1999-03-19 | 2003-05-26 | 日本軽金属株式会社 | モンテカルロシミュレーションを用いたepma分析法 |
| JP3729186B2 (ja) * | 2000-04-11 | 2005-12-21 | 理学電機工業株式会社 | 蛍光x線分析装置 |
| JP2002257757A (ja) * | 2001-03-05 | 2002-09-11 | Rigaku Industrial Co | 蛍光x線分析装置 |
| US6675106B1 (en) * | 2001-06-01 | 2004-01-06 | Sandia Corporation | Method of multivariate spectral analysis |
| DE10159828B4 (de) * | 2001-12-06 | 2007-09-20 | Rigaku Industrial Corporation, Takatsuki | Röntgenfluoreszenzspektrometer |
| JP3519397B1 (ja) * | 2002-10-09 | 2004-04-12 | 沖電気工業株式会社 | 固体表面層の膜厚方向組成プロファイル解析方法 |
| JP2004151045A (ja) * | 2002-11-01 | 2004-05-27 | Hitachi High-Technologies Corp | 電子顕微鏡またはx線分析装置及び試料の分析方法 |
| US7108424B2 (en) * | 2004-03-11 | 2006-09-19 | Agilent Technologies, Inc. | Method and apparatus for calibration of indirect measurement systems |
| GB0512945D0 (en) | 2005-06-24 | 2005-08-03 | Oxford Instr Analytical Ltd | Method and apparatus for material identification |
-
2006
- 2006-05-16 GB GBGB0609744.8A patent/GB0609744D0/en not_active Ceased
-
2007
- 2007-05-16 WO PCT/GB2007/001803 patent/WO2007132243A1/en not_active Ceased
- 2007-05-16 EP EP07732827.6A patent/EP2024734B1/en active Active
- 2007-05-16 US US12/300,963 patent/US8346521B2/en active Active
- 2007-05-16 JP JP2009510541A patent/JP5150620B2/ja active Active
Non-Patent Citations (1)
| Title |
|---|
| None * |
Also Published As
| Publication number | Publication date |
|---|---|
| WO2007132243A1 (en) | 2007-11-22 |
| US20100017172A1 (en) | 2010-01-21 |
| JP2009537811A (ja) | 2009-10-29 |
| GB0609744D0 (en) | 2006-06-28 |
| US8346521B2 (en) | 2013-01-01 |
| EP2024734A1 (en) | 2009-02-18 |
| JP5150620B2 (ja) | 2013-02-20 |
Similar Documents
| Publication | Publication Date | Title |
|---|---|---|
| EP2024734B1 (en) | A method of determining the feasibility of a proposed structure analysis process | |
| Stump et al. | Inclusive jet production, parton distributions, and the search for new physics | |
| JP3699723B2 (ja) | 材料サンプルの分析 | |
| US7595489B2 (en) | Method and apparatus for material identification | |
| JP4641619B2 (ja) | プラズマプロセスによる表面プロファイルを予測するための方法及び装置 | |
| Shirley et al. | Chemical characterisation is rough: the impact of topography and measurement parameters on energy-dispersive X-ray spectroscopy in biominerals | |
| Meisenkothen et al. | Exploring the accuracy of isotopic analyses in atom probe mass spectrometry | |
| Axente et al. | Accurate analysis of indium–zinc oxide thin films via laser-induced breakdown spectroscopy based on plasma modeling | |
| JPH10123071A (ja) | X線分析方法および装置 | |
| US7002143B2 (en) | Method and apparatus for compensating waveforms, spectra, and profiles derived therefrom for effects of drift | |
| Newbury et al. | Energy-dispersive X-ray spectrum simulation with NIST DTSA-II: comparing simulated and measured electron-excited spectra | |
| Eggert | Effect of the silicon drift detector on EDAX standardless quant methods | |
| US8065094B2 (en) | Method of calculating the structure of an inhomogeneous sample | |
| US20090041184A1 (en) | X-ray fluorescence spectrometer and program used therein | |
| Powell | Growth and trends in Auger-electron spectroscopy and x-ray photoelectron spectroscopy for surface analysis | |
| WO2011159264A1 (en) | A thickness determination method | |
| US9651369B1 (en) | Method and system for in-situ determination of a chemical composition of films during growth process | |
| Heinrich | Strategies of electron probe data reduction | |
| Hu et al. | Method for the calculation of the chemical composition of a thin film by Monte Carlo simulation and electron probe microanalysis | |
| Bundaleski et al. | Optical properties of the 127° cylindrical energy analyzer used in LEIS experiments | |
| Statham | Feasibility of x-ray analysis of multi-layer thin films at a single beam voltage | |
| Gullayanon | A calibration methodology for energy dispersive X-ray fluorescence measurements based upon synthetically generated reference spectra | |
| Fournier et al. | An expert system for EPMA | |
| Teng et al. | The f-ratio quantification method applied to standard minerals with a cold field emission SEM/EDS | |
| Yavaş et al. | NXSIM: A normalized XRF standardless iterative simulation method for qualitative and quantitative XRF analysis via MCNP |
Legal Events
| Date | Code | Title | Description |
|---|---|---|---|
| PUAI | Public reference made under article 153(3) epc to a published international application that has entered the european phase |
Free format text: ORIGINAL CODE: 0009012 |
|
| 17P | Request for examination filed |
Effective date: 20081204 |
|
| AK | Designated contracting states |
Kind code of ref document: A1 Designated state(s): AT BE BG CH CY CZ DE DK EE ES FI FR GB GR HU IE IS IT LI LT LU LV MC MT NL PL PT RO SE SI SK TR |
|
| AX | Request for extension of the european patent |
Extension state: AL BA HR MK RS |
|
| RBV | Designated contracting states (corrected) |
Designated state(s): DE GB |
|
| 17Q | First examination report despatched |
Effective date: 20091109 |
|
| RAP1 | Party data changed (applicant data changed or rights of an application transferred) |
Owner name: OXFORD INSTRUMENTS NANOTECHNOLOGY TOOLS LIMITED |
|
| DAX | Request for extension of the european patent (deleted) | ||
| RIC1 | Information provided on ipc code assigned before grant |
Ipc: G01N 23/2252 20180101ALI20180208BHEP Ipc: G01N 23/225 20180101AFI20180208BHEP Ipc: G01B 15/02 20060101ALI20180208BHEP |
|
| GRAP | Despatch of communication of intention to grant a patent |
Free format text: ORIGINAL CODE: EPIDOSNIGR1 |
|
| INTG | Intention to grant announced |
Effective date: 20180322 |
|
| GRAS | Grant fee paid |
Free format text: ORIGINAL CODE: EPIDOSNIGR3 |
|
| GRAA | (expected) grant |
Free format text: ORIGINAL CODE: 0009210 |
|
| AK | Designated contracting states |
Kind code of ref document: B1 Designated state(s): DE GB |
|
| REG | Reference to a national code |
Ref country code: GB Ref legal event code: FG4D |
|
| REG | Reference to a national code |
Ref country code: DE Ref legal event code: R096 Ref document number: 602007055157 Country of ref document: DE |
|
| REG | Reference to a national code |
Ref country code: DE Ref legal event code: R097 Ref document number: 602007055157 Country of ref document: DE |
|
| PLBE | No opposition filed within time limit |
Free format text: ORIGINAL CODE: 0009261 |
|
| STAA | Information on the status of an ep patent application or granted ep patent |
Free format text: STATUS: NO OPPOSITION FILED WITHIN TIME LIMIT |
|
| 26N | No opposition filed |
Effective date: 20190321 |
|
| P01 | Opt-out of the competence of the unified patent court (upc) registered |
Effective date: 20230527 |
|
| PGFP | Annual fee paid to national office [announced via postgrant information from national office to epo] |
Ref country code: DE Payment date: 20250423 Year of fee payment: 19 |
|
| REG | Reference to a national code |
Ref country code: DE Ref legal event code: R081 Ref document number: 602007055157 Country of ref document: DE Owner name: OXFORD INSTRUMENTS NANOTECHNOLOGY TOOLS LIMITE, GB Free format text: FORMER OWNER: OXFORD INSTRUMENTS NANOTECHNOLOGY TOOLS LIMITED, ABINGDON, OXON, GB |
|
| PGFP | Annual fee paid to national office [announced via postgrant information from national office to epo] |
Ref country code: GB Payment date: 20260316 Year of fee payment: 20 |