EP1949849B1 - Beurteilungsverfahren zum Verarbeiten eines Glukosekonzentrationssignals - Google Patents
Beurteilungsverfahren zum Verarbeiten eines Glukosekonzentrationssignals Download PDFInfo
- Publication number
- EP1949849B1 EP1949849B1 EP07405024A EP07405024A EP1949849B1 EP 1949849 B1 EP1949849 B1 EP 1949849B1 EP 07405024 A EP07405024 A EP 07405024A EP 07405024 A EP07405024 A EP 07405024A EP 1949849 B1 EP1949849 B1 EP 1949849B1
- Authority
- EP
- European Patent Office
- Prior art keywords
- glucose concentration
- target
- excursion
- gates
- relative
- Prior art date
- Legal status (The legal status is an assumption and is not a legal conclusion. Google has not performed a legal analysis and makes no representation as to the accuracy of the status listed.)
- Active
Links
- WQZGKKKJIJFFOK-GASJEMHNSA-N Glucose Natural products OC[C@H]1OC(O)[C@H](O)[C@@H](O)[C@@H]1O WQZGKKKJIJFFOK-GASJEMHNSA-N 0.000 title claims abstract description 173
- 239000008103 glucose Substances 0.000 title claims abstract description 173
- 238000000034 method Methods 0.000 title claims abstract description 73
- 230000008569 process Effects 0.000 title claims abstract description 15
- 238000004458 analytical method Methods 0.000 claims abstract description 29
- 235000012054 meals Nutrition 0.000 claims abstract description 29
- 238000004891 communication Methods 0.000 claims abstract description 5
- 238000005259 measurement Methods 0.000 claims description 28
- 230000037081 physical activity Effects 0.000 claims description 10
- 230000003993 interaction Effects 0.000 claims description 4
- 230000001960 triggered effect Effects 0.000 abstract description 7
- NOESYZHRGYRDHS-UHFFFAOYSA-N insulin Chemical compound N1C(=O)C(NC(=O)C(CCC(N)=O)NC(=O)C(CCC(O)=O)NC(=O)C(C(C)C)NC(=O)C(NC(=O)CN)C(C)CC)CSSCC(C(NC(CO)C(=O)NC(CC(C)C)C(=O)NC(CC=2C=CC(O)=CC=2)C(=O)NC(CCC(N)=O)C(=O)NC(CC(C)C)C(=O)NC(CCC(O)=O)C(=O)NC(CC(N)=O)C(=O)NC(CC=2C=CC(O)=CC=2)C(=O)NC(CSSCC(NC(=O)C(C(C)C)NC(=O)C(CC(C)C)NC(=O)C(CC=2C=CC(O)=CC=2)NC(=O)C(CC(C)C)NC(=O)C(C)NC(=O)C(CCC(O)=O)NC(=O)C(C(C)C)NC(=O)C(CC(C)C)NC(=O)C(CC=2NC=NC=2)NC(=O)C(CO)NC(=O)CNC2=O)C(=O)NCC(=O)NC(CCC(O)=O)C(=O)NC(CCCNC(N)=N)C(=O)NCC(=O)NC(CC=3C=CC=CC=3)C(=O)NC(CC=3C=CC=CC=3)C(=O)NC(CC=3C=CC(O)=CC=3)C(=O)NC(C(C)O)C(=O)N3C(CCC3)C(=O)NC(CCCCN)C(=O)NC(C)C(O)=O)C(=O)NC(CC(N)=O)C(O)=O)=O)NC(=O)C(C(C)CC)NC(=O)C(CO)NC(=O)C(C(C)O)NC(=O)C1CSSCC2NC(=O)C(CC(C)C)NC(=O)C(NC(=O)C(CCC(N)=O)NC(=O)C(CC(N)=O)NC(=O)C(NC(=O)C(N)CC=1C=CC=CC=1)C(C)C)CC1=CN=CN1 NOESYZHRGYRDHS-UHFFFAOYSA-N 0.000 description 48
- 239000008280 blood Substances 0.000 description 47
- 210000004369 blood Anatomy 0.000 description 47
- 102000004877 Insulin Human genes 0.000 description 24
- 108090001061 Insulin Proteins 0.000 description 24
- 229940125396 insulin Drugs 0.000 description 24
- 238000002560 therapeutic procedure Methods 0.000 description 17
- 238000010586 diagram Methods 0.000 description 14
- 238000012544 monitoring process Methods 0.000 description 13
- 238000009826 distribution Methods 0.000 description 12
- 238000013480 data collection Methods 0.000 description 5
- 238000012806 monitoring device Methods 0.000 description 5
- 230000009471 action Effects 0.000 description 4
- 206010012601 diabetes mellitus Diseases 0.000 description 4
- 230000000694 effects Effects 0.000 description 4
- 235000006694 eating habits Nutrition 0.000 description 3
- 201000001421 hyperglycemia Diseases 0.000 description 3
- 230000002218 hypoglycaemic effect Effects 0.000 description 3
- 238000012545 processing Methods 0.000 description 3
- 238000011282 treatment Methods 0.000 description 3
- 208000013016 Hypoglycemia Diseases 0.000 description 2
- 230000005540 biological transmission Effects 0.000 description 2
- 238000012937 correction Methods 0.000 description 2
- 235000020937 fasting conditions Nutrition 0.000 description 2
- 239000012530 fluid Substances 0.000 description 2
- 238000001802 infusion Methods 0.000 description 2
- 235000016709 nutrition Nutrition 0.000 description 2
- 230000035764 nutrition Effects 0.000 description 2
- 230000000291 postprandial effect Effects 0.000 description 2
- 238000003825 pressing Methods 0.000 description 2
- 230000004044 response Effects 0.000 description 2
- 206010010904 Convulsion Diseases 0.000 description 1
- 208000002230 Diabetic coma Diseases 0.000 description 1
- 206010023379 Ketoacidosis Diseases 0.000 description 1
- 208000007976 Ketosis Diseases 0.000 description 1
- 208000003443 Unconsciousness Diseases 0.000 description 1
- 230000003213 activating effect Effects 0.000 description 1
- 230000036760 body temperature Effects 0.000 description 1
- 150000001720 carbohydrates Chemical class 0.000 description 1
- 235000014633 carbohydrates Nutrition 0.000 description 1
- 230000008859 change Effects 0.000 description 1
- 238000007796 conventional method Methods 0.000 description 1
- 125000004122 cyclic group Chemical group 0.000 description 1
- 238000011161 development Methods 0.000 description 1
- 230000037213 diet Effects 0.000 description 1
- 235000005911 diet Nutrition 0.000 description 1
- 201000010099 disease Diseases 0.000 description 1
- 208000037265 diseases, disorders, signs and symptoms Diseases 0.000 description 1
- 229940079593 drug Drugs 0.000 description 1
- 239000003814 drug Substances 0.000 description 1
- 238000005516 engineering process Methods 0.000 description 1
- 230000001667 episodic effect Effects 0.000 description 1
- 235000013305 food Nutrition 0.000 description 1
- 230000037406 food intake Effects 0.000 description 1
- 150000002303 glucose derivatives Chemical class 0.000 description 1
- 230000036541 health Effects 0.000 description 1
- 230000000977 initiatory effect Effects 0.000 description 1
- 230000004800 psychological effect Effects 0.000 description 1
- 230000035484 reaction time Effects 0.000 description 1
- 238000012552 review Methods 0.000 description 1
- 230000001360 synchronised effect Effects 0.000 description 1
- 238000012360 testing method Methods 0.000 description 1
- 230000002792 vascular Effects 0.000 description 1
Images


Classifications
-
- A—HUMAN NECESSITIES
- A61—MEDICAL OR VETERINARY SCIENCE; HYGIENE
- A61B—DIAGNOSIS; SURGERY; IDENTIFICATION
- A61B5/00—Measuring for diagnostic purposes; Identification of persons
- A61B5/145—Measuring characteristics of blood in vivo, e.g. gas concentration, pH value; Measuring characteristics of body fluids or tissues, e.g. interstitial fluid, cerebral tissue
- A61B5/14532—Measuring characteristics of blood in vivo, e.g. gas concentration, pH value; Measuring characteristics of body fluids or tissues, e.g. interstitial fluid, cerebral tissue for measuring glucose, e.g. by tissue impedance measurement
-
- G—PHYSICS
- G16—INFORMATION AND COMMUNICATION TECHNOLOGY [ICT] SPECIALLY ADAPTED FOR SPECIFIC APPLICATION FIELDS
- G16H—HEALTHCARE INFORMATICS, i.e. INFORMATION AND COMMUNICATION TECHNOLOGY [ICT] SPECIALLY ADAPTED FOR THE HANDLING OR PROCESSING OF MEDICAL OR HEALTHCARE DATA
- G16H50/00—ICT specially adapted for medical diagnosis, medical simulation or medical data mining; ICT specially adapted for detecting, monitoring or modelling epidemics or pandemics
- G16H50/20—ICT specially adapted for medical diagnosis, medical simulation or medical data mining; ICT specially adapted for detecting, monitoring or modelling epidemics or pandemics for computer-aided diagnosis, e.g. based on medical expert systems
-
- G—PHYSICS
- G16—INFORMATION AND COMMUNICATION TECHNOLOGY [ICT] SPECIALLY ADAPTED FOR SPECIFIC APPLICATION FIELDS
- G16Z—INFORMATION AND COMMUNICATION TECHNOLOGY [ICT] SPECIALLY ADAPTED FOR SPECIFIC APPLICATION FIELDS, NOT OTHERWISE PROVIDED FOR
- G16Z99/00—Subject matter not provided for in other main groups of this subclass
-
- A—HUMAN NECESSITIES
- A61—MEDICAL OR VETERINARY SCIENCE; HYGIENE
- A61B—DIAGNOSIS; SURGERY; IDENTIFICATION
- A61B5/00—Measuring for diagnostic purposes; Identification of persons
- A61B5/72—Signal processing specially adapted for physiological signals or for diagnostic purposes
- A61B5/7271—Specific aspects of physiological measurement analysis
- A61B5/7275—Determining trends in physiological measurement data; Predicting development of a medical condition based on physiological measurements, e.g. determining a risk factor
-
- A—HUMAN NECESSITIES
- A61—MEDICAL OR VETERINARY SCIENCE; HYGIENE
- A61B—DIAGNOSIS; SURGERY; IDENTIFICATION
- A61B5/00—Measuring for diagnostic purposes; Identification of persons
- A61B5/72—Signal processing specially adapted for physiological signals or for diagnostic purposes
- A61B5/7271—Specific aspects of physiological measurement analysis
- A61B5/7285—Specific aspects of physiological measurement analysis for synchronising or triggering a physiological measurement or image acquisition with a physiological event or waveform, e.g. an ECG signal
-
- G—PHYSICS
- G16—INFORMATION AND COMMUNICATION TECHNOLOGY [ICT] SPECIALLY ADAPTED FOR SPECIFIC APPLICATION FIELDS
- G16H—HEALTHCARE INFORMATICS, i.e. INFORMATION AND COMMUNICATION TECHNOLOGY [ICT] SPECIALLY ADAPTED FOR THE HANDLING OR PROCESSING OF MEDICAL OR HEALTHCARE DATA
- G16H20/00—ICT specially adapted for therapies or health-improving plans, e.g. for handling prescriptions, for steering therapy or for monitoring patient compliance
- G16H20/10—ICT specially adapted for therapies or health-improving plans, e.g. for handling prescriptions, for steering therapy or for monitoring patient compliance relating to drugs or medications, e.g. for ensuring correct administration to patients
-
- G—PHYSICS
- G16—INFORMATION AND COMMUNICATION TECHNOLOGY [ICT] SPECIALLY ADAPTED FOR SPECIFIC APPLICATION FIELDS
- G16H—HEALTHCARE INFORMATICS, i.e. INFORMATION AND COMMUNICATION TECHNOLOGY [ICT] SPECIALLY ADAPTED FOR THE HANDLING OR PROCESSING OF MEDICAL OR HEALTHCARE DATA
- G16H70/00—ICT specially adapted for the handling or processing of medical references
Definitions
- the invention relates to an assessment method to process a signal corresponding to a glucose concentration, in particular obtained from continuous glucose monitoring, performing a retrospective analysis.
- the invention further relates to a device to process a signal corresponding to a glucose concentration, which is designed and programmed to perform such an assessment method.
- Diabetes is a disease in which the body does not produce an adequate amount of insulin or does not properly respond to the insulin produced. This results in an unbalanced blood glucose concentration (hyper- or hypoglycemia) leading to severe consequences such as ketoacidosis (diabetic coma), vascular complications as well as loss of consciousness or seizures.
- hypoglycemia hyper- or hypoglycemia
- ketoacidosis ketoacidosis
- vascular complications as well as loss of consciousness or seizures.
- patients usually keep a strict diet in combination with selective boluses of insulin.
- a bolus of insulin needs to be adjusted to the individual human body to provide an appropriate amount and distribution of insulin. Whether or not the amount and distribution of insulin are appropriate strongly depends on several factors such as the quantity and type of food and physical activity, e. g. exercise, stress or illness.
- the necessary amount of insulin varies depending on the patient's physical condition.
- the patient's response to certain factors like a meal needs to be considered.
- the timing of the bolus is of particular importance.
- the patient or his or her HCP respectively gets information about the glucose concentration excursion of a predefined period of time, e. g. of the last 12 or 24 hours.
- the measurements usually do not consider the individual timing of relevant events such as physical activities or eating habits of a patient but measure over a fixed and predetermined period of time.
- Glucose concentration is a value which is influenced by parameters such as the amount, distribution and timing of a bolus of insulin as well as by meals or physical activities of the patient. Said conventional measuring methods can only show absolute values of the respective blood glucose concentration at a specific time or within a specific period of time without taking other parameters such as timing of a meal or physical activity into account.
- EP 1 338 295 relates to user-interactive remote control of continuous-delivery medication infusion pump and a percutaneous physiological fluid monitoring device.
- a hand-held “fob" is provided for the remote control of the infusion pump and/or monitoring device.
- the monitoring of the physiological fluid may be done on a substantially continuous basis.
- the fob has a test strip for episodic measurement of the blood glucose concentration.
- the user's actual blood glucose level, the amount of carbohydrates to be consumed, and the bolus dosage correction factors are to be entered on a real-time basis by the user.
- the fob Upon selecting blood glucose calculator mode, the fob prompts the user to enter the most recent blood glucose concentration or a value measured by the monitoring device may be transmitted to the fob.
- the fob determines the standard bolus dosage to be delivered.
- the fob prompts the user to enter a blood glucose correction factor to fine-tune the bolus volume, for example, when the user anticipates exercising soon after a meal. A delivery command is then sent to
- a further object of the invention is to simplify the analysis of measured data, to allow a more flexible analysis and thus to enhance the individual usefulness of an assessment of a glucose concentration measurement.
- the assessment method to process a signal corresponding to a glucose concentration consists in performing a retrospective analysis of the measured data and comprises the steps of starting the assessment initiated by a first trigger, collecting the data to be analysed, analysing the collected data initiated by a second trigger and displaying the results of the analysis.
- This assessment method may be performed using a device which comprises a measuring device for collecting the data to be analysed, a computing device for analysing the collected data, a storage device for recording the collected data and the results of the analysis, a display for visualising the analysed data and a communication link for transmitting data between the measuring device and the computing/storage device and display, respectively.
- the user By performing a user-triggered and retrospective analysis of data which have been collected in particular during or after a relevant event such as a meal or physical activity, the user has the opportunity of choosing the time period the analysis is performed for. This ensures that the analysis relates to a certain event-specific context and therefore enhances the usefulness of the assessment of a glucose concentration.
- the assessment process can be initiated by a first trigger which should correspond to a situation that needs examination with respect to glucose concentration. Then the data collection is performed by using glucose concentration measuring methods that are known as such, in particular by using a continuous monitoring of glucose concentration, whereas the first trigger defines the beginning of a segment of the continuous measurement. Alternatively, data can be collected using spot monitoring of glucose concentration using a strip meter or a tape cassette, whereas the first trigger defines e. g. the first of a series of spot measurements. Then a second trigger initiates the analysis of the collected data. It defines the end of the collected data to be analysed. Eventually, the results of the analysis can be displayed. It is also possible to simply store the analysis and display it later in time or in combination with other analyses.
- the first and the second trigger of the assessment method can correspond to a user input, such as e. g. pressing a button, contacting a touch screen, activating a voice sensitive device or similar interactions.
- the first as well as the second trigger can also correspond to a predetermined time.
- a trigger can preferably be used as the second one, meaning that the data collection is performed during a predefined time. This time can be deduced from medical aspects such as an average reaction time of the blood glucose level to a meal or, e. g. during an insulin therapy, the period of time that a bolus of insulin works.
- Using a predetermined time as a first trigger can be particularly useful if a regular event is monitored (e. g. regular meals).
- a certain value and/or a progression of a glucose concentration can be employed as a trigger. If it is of interest whether the glucose concentration exceeds or falls below a certain (maybe critical) value, e. g. in order to monitor the development of the glucose concentration, the collection process and analysis can meet this demand by starting to collect data and stopping to collect data, respectively, when such a value is reached. Also a certain progression of the glucose concentration, e. g. a particularly flat or steep slope or a local minimum or maximum of the glucose concentration, can be used as a first and/or second trigger.
- a signal of an external device such as e. g. an insulin pump, a blood glucose meter for spot measurements, a thermometer or a pulse monitor can be used as a trigger as well, providing a plurality of possible trigger events, e. g. corresponding to events that have a direct connection with insulin therapy or that relate to physiological parameters such as a certain and possibly predefined body temperature or heart rate.
- an external device such as e. g. an insulin pump, a blood glucose meter for spot measurements, a thermometer or a pulse monitor
- trigger events e. g. corresponding to events that have a direct connection with insulin therapy or that relate to physiological parameters such as a certain and possibly predefined body temperature or heart rate.
- triggers can be used such as e. g. a user input as a first trigger combined with a predetermined time of e. g. four hours after initiation of data collection as a second trigger. It is even possible to combine different conditions (e. g. a certain glucose concentration determined by CGM during a certain predetermined time interval) in such a way that the starting or stopping of data collection is triggered only when all conditions are fulfilled.
- the assessment method can be applied to glucose concentration excursion data corresponding to a reaction to a relevant event such as e. g. a meal or physical activity.
- a relevant event such as e. g. a meal or physical activity.
- a relevant event such as e. g. a meal or physical activity.
- a target gate comprises an interval of values enclosing a centre value, which is preferably defined by an estimated glucose concentration, corresponding to an optimum reaction of the human body to a certain challenge (meal, bolus, physical activity etc.).
- the width of a target gate can be defined by an absolute value or by a relative width i. e. relative to the centre value.
- each target gate can be substituted by a set of target gates.
- a set of target gates comprises at least a first target gate of a first width and a second target gate of a second width.
- each target gate of the set of target gates can be given by an absolute value or by a relative width.
- the centres of the target gates of each set of target gates preferably lie on the very spot. It might also be advantageous to displace the centres of the target gates so the interval values of the glucose excursion of the corresponding grade are displaced. In particular this might be the case if a value of the estimated glucose concentration excursion e. g. is close to a critical value so a deviation in one direction is not as significant as a deviation in the opposite one.
- the grading criterion of the glucose concentration excursion further comprises the number of target gates which enclose the measured glucose concentration excursion curve.
- the grade of the measured glucose concentration excursion curve is the better, the more target gates enclose it.
- the criterion of a grading of the glucose concentration excursion comprises the number of the first gates, the second gates and optionally additional gates of other widths that enclose the glucose concentration excursion curve. The best grading is achieved if the smallest target gate of each set of target gates encloses the glucose concentration excursion curve.
- a further criterion for a grading of a glucose concentration excursion comprises a band of relative target ranges, whereas the width of the relative target ranges is determined as being a percentage of the appropriate value of the estimated glucose concentration excursion.
- the band of relative target ranges can be substituted by a set of bands of relative target ranges, which comprises at least one first band of a first relative target range and one second band of a second relative target range and preferably further bands of relative target ranges of different widths.
- Each of the relative target ranges is preferably centred on the estimated glucose concentration excursion curve.
- the centres of the bands of relative target ranges can also be displaced out of the estimated glucose concentration excursion curve where that might be advantageous.
- this criterion further comprises the relative time during which the measured glucose concentration excursion curve is enclosed by the band of relative target ranges. In case of a set of bands of relative target ranges this criterion further comprises the relative time in which the measured glucose concentration excursion curve is enclosed by each band of relative target ranges.
- the best grade is achieved when the measured glucose concentration curve is completely enclosed by the narrowest band of relative target ranges. More generally speaking, the longer the measured glucose concentration excursion curve is enclosed by a narrow band of relative target ranges, the better is its grading.
- a further criterion for a grading of a glucose concentration excursion comprises the use of j-indices, whereas a j-index is calculated using the mean value as well as the standard deviation of a number of measured glucose concentrations.
- the resulting j-index indicates how the measured glucose concentration excursion is to be graded relative to the estimated glucose concentration excursion. I. e. one or several ranges of numbers of j-indices categorise the deviations of the measured glucose concentration excursion with respect to the estimated glucose concentration excursion.
- the previously described grading of a measured glucose concentration excursion allows for an online feedback of a glucose concentration control.
- the quality/grading of the glucose concentration control can be determined by one of the previously described grading processes and displayed.
- the effect of parameters of the glucose concentration control such as the amount or distribution of insulin or the timing of a bolus can be monitored and corrected. This is in order to match the treatment with the reaction of the organism of an individual person and helps to optimise future treatments of that person.
- the determination of the quality/grading of the glucose concentration control can be based on the number of glucose values which lie within a target gate relative to the total number of target gates. That means that the percentage of target gates which enclose the glucose concentration excursion relates to the grading of the glucose concentration control as the deviation of the measured glucose concentration excursion is compared with and graded with respect to an estimated ideal glucose concentration excursion curve.
- providing a more accurate determination of the quality/grading of the glucose concentration control it can be based on the respective numbers of glucose values which lie within the target gates of the first width, second width and optionally other widths, respectively, relative to the total number of sets of target gates.
- the smallest target gate per set of target gates, which encloses the glucose concentration excursion curve is considered because if a narrow target gate encloses the glucose concentration excursion curve, a wider target gate of the same set of target gates necessarily encloses the glucose concentration excursion curve as well.
- the overall determination of the quality/grading of the glucose concentration control is subsequently deduced from the respective percentage of first, second and optionally other target gates, which enclose the measured glucose concentration excursion curve.
- the determination of the quality/grading of the glucose concentration control can be based on the relative time where the glucose concentration excursion curve lies within the band of relative target range.
- This relative time stands for the percentage where the band of relative target range encloses the measured glucose concentration excursion curve, similar to the previously described percentage of target gates that enclose the glucose concentration excursion curve but with a much larger total number of target gates and therefore a quasi-continuous band of relative target range.
- it can be based on the relative time where the glucose concentration excursion curve lies within the first, second and optionally other bands of relative target ranges, respectively.
- a device or arrangement which is designed and programmed to perform an assessment method on a signal corresponding to a glucose concentration as previously described comprises a measuring device for collecting the data to be analysed.
- a measuring device can be e. g. a continuous glucose measuring device or a strip meter or tape cassette.
- a computing device can analyse the collected data in the previously described way and control the assessment process, respectively.
- a storage device can be used for recording the collected data in particular during the collection process. Analyses performed by the computing unit can also be stored in the storage device for future reviews or further processing of the analyses. The analysed and - if applicable - the stored data then can be visualised on a display providing an online feedback to the user.
- a communication link is comprised by the inventive glucose concentration processing device.
- the communication link for data transmission between the measuring device on the one hand and the computing device, storage device and display on the other hand is working automatically without user interaction.
- the components can communicate with each another independently, and each trigger e. g. by user input or other previously described incidents can be internally processed without the need of further user interaction.
- the previously described assessment processing device preferably is capable of applying at least two criteria and/or methods for determining the grading of a glucose concentration excursion and the criterion and/or method can be chosen online by the user.
- This feature of the device helps to improve the assessment as the previously described criteria and/or methods show individual advantages and disadvantages for certain applications and patients, respectively.
- combining more than one criteria or methods, respectively may lead to an even clearer picture.
- a device that offers a choice of different assessment methods or grading criteria is much more flexible than a device with a fixed and predefined assessment method.
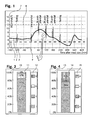
- Figure 1 shows a diagram with its horizontal axis 3 annotated by time after a meal start 9 (in minutes) and its vertical axis 7 annotated by blood glucose concentration BG (in mmol/l).
- a measurement of a blood glucose concentration excursion 2 as well as thresholds of the critical blood glucose concentrations of hypoglycemia (threshold 1) and hyperglycemia (threshold 8) are plotted in the diagram.
- Several sets of target gates 4, 5, 6 indicate ranges of blood glucose concentrations around an ideal excursion.
- Target gates of a first width 4 define the smallest deviation of the measured glucose concentration excursion with respect to the ideal one.
- the target gates of second and third widths 5, 6 define further deviations of the measurement with respect to the ideal values.
- the measured data is downsampled to a few data points - in this example down to six points in time - to look at, which highly reduces the analysis effort.
- Target gates of different widths 4, 5, 6 are defined at the same timed points along the glucose trace. They are further defined by their centre point, which corresponds to an ideal glucose concentration at the respective timed point and a width towards higher and lower concentrations. A smaller width of a gate results in a better grading. In order to determine a grading for the blood glucose concentration excursion control, the grading of all sets of gates is taken into account.
- a set of target gates comprises all equally timed target gates of different widths.
- the set corresponding to two hours (120 minutes) after meal start is given by the three gates 4, 5 and 6.
- Further sets of target gates are positioned at two hours before meal start (fasting), at meal start (pre-prandial), at one and three hours after meal start (post prandial) and at four hours after meal start (fasting).
- the distribution of the sets of target gates is chosen with respect to the ideal glucose concentration excursion but may be subject to change depending on the scope of the assessment of the blood glucose concentration excursion.
- Application of the target gate method does only consider discretely timed and meaningful points along the excursion curve.
- the target gate method is triggered by the user, which is why this assessment method can be adapted to any individual patient's eating habits. Even without cyclic eating habits, a retrospective analysis of the blood glucose concentration control by a particular amount, timing and distribution of insulin can be performed as the analysing process is triggered individually. At the end of the excursion, which typically occurs about four hours after the meal start, or at the user's next input, an online feedback can be given to the user. The feedback concerns the effect of the amount, timing and distribution of the insulin bolus, which has been applied with respect to the previous meal. This retrospective analysing method does clearly determine how good the matching of the applied bolus of insulin to the specific meal was and thus gives advice for the further treatment.
- FIG 2 the summarising assessment of the blood glucose concentration control is shown.
- the measured glucose concentration values are compared to the minimum and maximum values of the respective target gates.
- the best applicable grade which is attributed to the narrowest gate that encloses the glucose concentration value, is assigned to the value of that timing.
- Subsequent application of this step results in a number of respective grades.
- FIG 2 the summarised grading is shown as a column diagram 11, whereas the best grade I is plotted at the lowest position with the next best grade positioned on top of the first one and so on.
- a legend 12 shows the different grades, whereas I means the best grade (corresponding to the narrowest target gate), II and III the second and third best grade.
- V means that the measured glucose concentration value is not enclosed by a target gate and therefore indicates a lack of blood glucose concentration control.
- On the left hand side of the diagram there is a scale 10 showing percentages of 0% up to 100% for determining the accumulated percentage of a certain grade and better grades. E. g. 17% of the measurement were categorised grade II and III, respectively, as opposed to 67% of the measurement being categorised grade I.
- On the scale 10 an accumulated percentage of 84% of the measurement being categorised in grade II or better can be read.
- Figure 3 shows a diagram with its horizontal axis 3 annotated by time after a meal start 9 (in minutes) and its vertical axis 7 annotated by blood glucose concentration BG (in mmol/l).
- a measurement of blood glucose concentration excursion 23 is plotted as well as a plurality of relative target ranges 16, 22; 17, 21; 18, 20 spaced from an ideal glucose concentration excursion depicted as crosses 19 to both sides.
- Each relative target range is defined by a width, which is relative to the centre value given by the ideal glucose concentration 19.
- a first width of 25% relative to the ideal glucose concentration is represented by continuous lines 18, 20, a second width of 66%, by dashed lines 17,21 and a third width of 100% is plotted as dashed-dotted lines 16, 22, whereas the recited widths are total widths meaning that a width of 25% corresponds to 12.5%, 66% to 33% and 100% to 50%, respectively, towards higher as well as lower values.
- the relative target range method is similar to the target gate method but with a far greater number of target gates. Being a continuous or quasi-continuous assessment method, a more accurate determination of the quality of the glucose concentration excursion control is possible. This method therefore is particularly useful for continuous glucose concentration monitoring.
- the assessment of the insulin regimen is performed either over a tunable period of time or between two triggering events resulting from user input.
- a first trigger can start the assessment and data collection.
- the time of triggering can set the assumed time of meal start or another time preferably before the time of meal start.
- the relative target ranges are subsequently arranged around the ideal glucose concentration excursion curve and the categorising step is taking place during the measurement process. On a second trigger the result of the analysing process is immediately shown to the user.
- the measured blood glucose concentration value lies within the first width of 25% it is categorised as a, within the second width of 66% as b, within the third width of 100% as c and if the values do not lie within a relative target range, they are categorised as d These categories can directly be compared to those of the target gate method, whereas a is comparable to I, bto II, cto III and dto V.
- the metric for the relative target range method for performing the summarised assessment of the blood glucose concentration excursion control is also similar to that of the target gate method.
- the respective period of time in which the curve is enclosed by each relative target range is preferably chosen for being the basis for determining the percentage of the grading, i. e. the period of time spent by the measured curve within a relative target range is assigned to the corresponding grade.
- the relative time in which the curve was enclosed by each relative target range denotes the fraction of the corresponding grade with respect to the total measurement. Assuming a measurement of 240 minutes, a summarised grading of 62% of grade a is achieved if the curve is enclosed by the narrowest relative target range for 149 minutes.
- Figure 4 corresponds to the result of the relative target range method as depicted in figure 3
- the relative target ranges 15 a to c correspond to the relative widths of 25%, 66% and 100% respectively.
- Target range d stands for a measured glucose concentration excursion which is separated from the ideal excursion by more than 100%, which is assumed as lack of glucose concentration excursion control.
- the column diagram 14 is similar to the column diagram 11 in figure 2 . It shows the percentage of the respective relative target ranges.
- the scale 13 on the left hand side of the figure measures the accumulated percentage of a grade and all better grades. E. g. an accumulated percentage of 76% for grade b or better can be read from the scale 13 in connection with the column diagram 14.
- Figure 5 shows a diagram with its horizontal axis 3 annotated by time after a meal start 9 (in minutes) and its vertical axis 7 annotated by blood glucose concentration BG (in mmol/l). A measurement of blood glucose concentration excursion 27 is plotted.
- This figure illustrates the prandial/fasting scheme as described in L. J. Chassin et al., "Grading System to Assess Clinical Performance of Closed-Loop Glucose Control; Diabetes Technology and Therapeutics7 (2005) 72 - 82.
- the prandial/fasting scheme distinguishes the outside-meal condition (fasting) 30, 32 from the postprandial condition (prandial) 31, which is defined as a period of time of from 15 minutes to 180 minutes after meal ingestion.
- Each of the conditions represents a physiological status and defines threshold values for determination of the grade of a blood glucose concentration value.
- the scheme comprises grades A to F, whereas A and B characterise excellent and good glucose control, respectively, without the need for a corrective action.
- Grade C represents suboptimal control with a recommendation for a corrective action.
- Grade D represents poor control requiring a corrective action.
- Grades E and F represent very poor and life-threatening control, respectively, with a need for an immediate corrective action or requiring an external assistance.
- these grades can be looked at as corresponding directly to the previously described grades I to V and a to d , respectively.
- the prandial/fasting scheme provides a simpler categorisation with respect to time after meal start.
- BG Blood glucose concentration
- Prandial condition ⁇ 2.8 F F ⁇ 3.3 E E ⁇ 4.4 C D ⁇ 6.1 A B ⁇ 7.2 B A ⁇ 7.8 C A ⁇ 10.0 D B ⁇ 13.9 D C ⁇ 25 E D >25 F F
- the metric for the summarised assessment of the blood glucose concentration excursion control is essentially the same as for the relative target range method, considering the respective period of time the curve is enclosed by each area as chosen for being the basis for determining the percentage of the grading. I. e. the period of time spent by the measured curve within an area is assigned to the corresponding grade. After finishing the measurement, the relative time in which the curve was enclosed by each area gives the fraction of the corresponding grade with respect to the total measurement.
- Figure 6 shows a device for performing the previously described assessment methods. It comprises a central unit 52, which coordinates the measurement and calculates the summarised assessment of the blood glucose concentration excursion control. It can be triggered by a user via a user interface 46 e. g. a button which defines the start of the measurement and/or the meal start. Triggered by the user input the central unit 52 starts assessment of the measurements, which are performed by a blood glucose concentration monitoring device 45 e. g. by spot monitoring of blood glucose concentration by a strip meter or cassette or by continuous monitoring of blood (or interstitial) glucose concentration. The measured data are processed by the central unit 52 using one of the previously described assessment methods.
- a blood glucose concentration monitoring device 45 e. g. by spot monitoring of blood glucose concentration by a strip meter or cassette or by continuous monitoring of blood (or interstitial) glucose concentration.
- the measured data are processed by the central unit 52 using one of the previously described assessment methods.
- the results of the summarised assessment of the blood glucose concentration excursion control are displayed on a display device 47, these results can also be printed on a printer 49 that can be connected to the central unit 52.
- the previously described assessment schemes are a selection of a plurality of different methods to deal with grading of a glucose concentration excursion control.
- the actual grading subsequently is defined by ranges of j-values i. e. 10 ⁇ j ⁇ 20 for ideal blood glucose concentration control up to j > 40 for lack of blood glucose concentration control.
- the assessment device as depicted in figure 6 can be modified e. g. in such a way that the user interface to trigger the assessment method as well as the display device can be combined in the central unit making the assessment device a single apparatus.
- the assessment device can also be combined with the measuring device e. g. in a closed-loop control of blood glucose concentration.
- the number and meaning of the grading can be adapted to the scope of the assessment or therapy support.
- the grading can be varied in such a way that the different grades get closer to one another as the optimisation goes on.
- all the gates can be made narrower and with less difference in width to each other in order to provide a finer grading of the therapy.
- Triggering the assessment method can preferably be done by a simple user input such as pressing a button.
- Other instruments for user input e. g. a touch screen on the display or a trigger using an external device can be employed.
- a countdown may set the end of the assessment.
- a triggering event can also be formed by a specific shape of the glucose concentration curve such as a steep slope or by a specific absolute value of the blood glucose concentration.
- the results of a plurality of assessments can be recorded and graphically displayed. This can also have a positive psychological effect on the patient as advances in the glucose concentration control and therefore in the efficiency of the therapy become apparent.
- the simple way of using the device enables any patient to perform an assessment of his/her actual glucose concentration excursion control. This in turn leads to a more reliable monitoring of the therapy and allows conclusion about the quality of the blood glucose concentration control.
- a well-founded binary judgement in the sense of deciding on the therapy as being good or bad lies in the scope of the described assessment method.
Claims (11)
- Bewertungsverfahren zum Verarbeiten eines einer Glukosekonzentration entsprechenden Signals mit Durchführung einer Retrospektivanalyse, wobei die Bewertung die folgenden Schritte umfasst:a) durch einen ersten Auslöser initiiertes Starten der Bewertung, wobei der erste Auslöser den Beginn eines Abschnitts einer kontinuierlichen Glukosekonzentrationsmessung oder die erste einer Reihe von Glukosekonzentrationspunktmessungen definiert;b) Sammeln von zu analysierenden Daten der kontinuierlichen Messung oder der Reihe von Glukosekonzentrationspunktmessungen, wobei die gesammelten Daten in Beziehung zu einem Glukosekonzentrationsausschlag stehen, der einer Reaktion auf ein relevantes Ereignis, wie etwa eine Mahlzeit oder physische Betätigung, entspricht;c) durch einen zweiten Auslöser initiiertes Analysieren der gesammelten Daten, wobei der zweite Auslöser das Ende der zu analysierenden Daten definiert, wobei ein Maß für ein Einstufen des Ausschlags aus den gesammelten Daten bestimmt wird; undd) Darstellen der Ergebnisse der Analyse.
- Verfahren nach Anspruch 1, dadurch gekennzeichnet, dass der erste und/oder der zweite Auslösera) einer Eingabe durch den Anwender,b) einer vorbestimmten Zeit,c) einem Wert und/oder einer Steigerung der Glukosekonzentration,d) einem Signal einer externen Vorrichtung
oder einer Kombination davon entspricht. - Verfahren nach einem der Ansprüche 1 oder 2, dadurch gekennzeichnet, dass Kriterien für die Bestimmung der Einstufung des Glukosekonzentrationsausschlags durcha) eine diskrete Anzahl von Zielfenstern (4, 5, 6) ebenso wieb) die Anzahl dieser Zielfenster (4, 5, 6), die eine dem Glukosekonzentrationsausschlag entsprechende Kurve (2) einschließen, gegeben sind,
insbesondere, dass die Kriterien durchc) eine diskrete Anzahl von Sätzen von Zielfenstern (4, 5, 6), während jeder Satz von Zielfenstern wenigstens ein erstes Zielfenster (4) einer ersten Breite und ein zweites Zielfenster (5) einer zweiten Breite umfasst, während die Zentren der wenigstens zwei Zielfenster (4, 5) des Satzes zeitlich die gleiche Position zeigen, ebenso wied) die Anzahl der ersten Fenster (4), der zweiten Fenster (5) und gegebenenfalls zusätzlicher Fenster (6) mit anderen Breiten, die die dem Glukosekonzentrationsausschlag entsprechende Kurve (2) einschließen, gegeben sind. - Verfahren nach einem der Ansprüche 1 oder 2, dadurch gekennzeichnet, dass Kriterien für die Bestimmung der Einstufung des Glukosekonzentrationsausschlags durcha) eine Bandbreite eines relativen Zielbereichs (18, 20; 17, 21; 16, 22) ebenso wieb) die relative Zeit, die die Bandbreite die Glukosekonzentrationsausschlagskurve (23) einschließt, gegeben sind,
insbesondere, dass die Kriterien durchc) einen Satz von Bandbreiten relativer Zielbereiche, umfassend wenigstens eine erste Bandbreite (18, 20) eines ersten relativen Zielbereichs und eine zweite Bandbreite (17, 21) eines zweiten relativen Zielbereichs, ebenso wied) die relative Zeit, die jede Bandbreite des relativen Zielbereichs (18, 20; 17, 21) jeweils die Glukosekonzentrationsausschlagskurve (23) einschließt, gegeben sind. - Verfahren nach einem der Ansprüche 1 oder 2, dadurch gekennzeichnet, dass Kriterien für die Bestimmung der Einstufung des Glukosekonzentrationsausschlags durch einen Bereich von j-Indizes gegeben sind, während ein j-Index unter Verwendung des Mittelwerts ebenso wie der Standardabweichung von Glukosekonzentrationen berechnet wird, insbesondere Kriterien für die Bestimmung der Einstufung des Glukosekonzentrationsausschlags durch einen Satz unterschiedlicher Bereiche von j-Indizes, die die Einstufung des Glukosekonzentrationsausschlags anzeigen, gegeben sind.
- Verfahren nach einem der Ansprüche 1 bis 5, dadurch gekennzeichnet, dass Schlussfolgerungen über die Qualität einer Glukosekonzentrationskontrolle als Ergebnis des gemessenen Glukosekonzentrationsausschlags bestimmt und dargestellt werden.
- Verfahren nach Anspruch 3 und 6, dadurch gekennzeichnet, dass die Qualität der Glukosekonzentrationskontrolle bezogen auf die Anzahl von Glukosewerten, die innerhalb eines Zielfensters (4, 5, 6) relativ zu der Gesamtzahl an Zielfenstern liegen, insbesondere bezogen auf die jeweilige Anzahl von Glukosewerten, die innerhalb der Zielfenster der ersten Breite (4), zweiten Breite (5) bzw. gegebenenfalls anderer Breiten (6) liegen, bestimmt wird, während für jeden Satz von Fenstern, relativ zur Gesamtzahl an Sätzen von Zielfenstern, jeweils nur das kleinste Fenster, das den jeweiligen Glukosewert einschließt, betrachtet wird.
- Verfahren nach Anspruch 4 und 6, dadurch gekennzeichnet, dass die Qualität der Glukosekonzentrationskontrolle bezogen auf die relative Zeit, in der die Glukosekonzentrationsausschlagskurve innerhalb der Bandbreite relativer Zielbereiche (18, 20; 17, 21; 16, 22) liegt, insbesondere die relative Zeit, in der der Glukosekonzentrationsausschlag innerhalb der ersten (18, 20), zweiten (17, 21) bzw. gegebenenfalls anderer Bandbreiten (16, 22) relativer Zielbereiche liegt, bestimmt wird.
- Vorrichtung zum Verarbeiten eines einer Glukosekonzentration entsprechenden Signals, dadurch gekennzeichnet, dass sie zur Durchführung eines Bewertungsverfahrens nach einem der Ansprüche 1 bis 8 konstruiert und programmiert ist, umfassenda) eine Messvorrichtung (45) zum Sammeln der zu analysierenden Daten,b) eine Rechnervorrichtung (52) zum Analysieren der gesammelten Daten,c) eine Speichervorrichtung (50) zum Aufzeichnen der gesammelten Daten und der Analyse,d) ein Display (47) zur optischen Darstellung der analysierten Daten unde) eine Kommunikationsverbindung (51) zur Übertragung von Daten zwischen der Messvorrichtung und der Rechner-/Speichervorrichtung bzw. dem Display.
- Vorrichtung nach Anspruch 9, dadurch gekennzeichnet, dass zwischen der Messvorrichtung (45) einerseits sowie der Rechnervorrichtung (52), der Speichervorrichtung (50) und dem Display (47) andererseits eine automatische Kommunikation, ohne Interaktion des Anwenders, erfolgt.
- Vorrichtung nach einem der Ansprüche 9 oder 10, dadurch gekennzeichnet, dass sie in der Lage ist, wenigstens zwei Kriterien und/oder Verfahren zur Bestimmung der Einstufung eines Glukosekonzentrationsausschlags anzuwenden, und dass das anzuwendende Kriterium und/oder Verfahren vom Anwender online gewählt werden kann.
Priority Applications (10)
| Application Number | Priority Date | Filing Date | Title |
|---|---|---|---|
| DK07405024T DK1949849T3 (da) | 2007-01-29 | 2007-01-29 | Vurderingsfremgangsmåde til behandling af et glucosekoncentrationssignal |
| DE602007002372T DE602007002372D1 (de) | 2007-01-29 | 2007-01-29 | Beurteilungsverfahren zum Verarbeiten eines Glukosekonzentrationssignals |
| AT07405024T ATE442081T1 (de) | 2007-01-29 | 2007-01-29 | Beurteilungsverfahren zum verarbeiten eines glukosekonzentrationssignals |
| ES07405024T ES2330897T3 (es) | 2007-01-29 | 2007-01-29 | Procedimiento de evaluacion para el procesamiento de una señal de concentracion en glucosa. |
| EP07405024A EP1949849B1 (de) | 2007-01-29 | 2007-01-29 | Beurteilungsverfahren zum Verarbeiten eines Glukosekonzentrationssignals |
| PCT/CH2008/000025 WO2008092286A1 (en) | 2007-01-29 | 2008-01-25 | Assessment method to process a glucose concentration signal |
| CN2008800033031A CN101594820B (zh) | 2007-01-29 | 2008-01-25 | 处理葡萄糖浓度信号的评估方法 |
| US12/511,190 US8060318B2 (en) | 2007-01-29 | 2009-07-29 | Assessment method to process a glucose concentration signal and devices thereof |
| HK10105172.7A HK1139024A1 (en) | 2007-01-29 | 2010-05-26 | Assessment method to process a glucose concentration signal |
| US13/267,436 US8352196B2 (en) | 2007-01-29 | 2011-10-06 | Assessment method to process a glucose concentration signal and devices thereof |
Applications Claiming Priority (1)
| Application Number | Priority Date | Filing Date | Title |
|---|---|---|---|
| EP07405024A EP1949849B1 (de) | 2007-01-29 | 2007-01-29 | Beurteilungsverfahren zum Verarbeiten eines Glukosekonzentrationssignals |
Publications (2)
| Publication Number | Publication Date |
|---|---|
| EP1949849A1 EP1949849A1 (de) | 2008-07-30 |
| EP1949849B1 true EP1949849B1 (de) | 2009-09-09 |
Family
ID=38181154
Family Applications (1)
| Application Number | Title | Priority Date | Filing Date |
|---|---|---|---|
| EP07405024A Active EP1949849B1 (de) | 2007-01-29 | 2007-01-29 | Beurteilungsverfahren zum Verarbeiten eines Glukosekonzentrationssignals |
Country Status (9)
| Country | Link |
|---|---|
| US (2) | US8060318B2 (de) |
| EP (1) | EP1949849B1 (de) |
| CN (1) | CN101594820B (de) |
| AT (1) | ATE442081T1 (de) |
| DE (1) | DE602007002372D1 (de) |
| DK (1) | DK1949849T3 (de) |
| ES (1) | ES2330897T3 (de) |
| HK (1) | HK1139024A1 (de) |
| WO (1) | WO2008092286A1 (de) |
Cited By (2)
| Publication number | Priority date | Publication date | Assignee | Title |
|---|---|---|---|---|
| US8229535B2 (en) | 2008-02-21 | 2012-07-24 | Dexcom, Inc. | Systems and methods for blood glucose monitoring and alert delivery |
| US9041730B2 (en) | 2010-02-12 | 2015-05-26 | Dexcom, Inc. | Receivers for analyzing and displaying sensor data |
Families Citing this family (16)
| Publication number | Priority date | Publication date | Assignee | Title |
|---|---|---|---|---|
| US8932216B2 (en) | 2006-08-07 | 2015-01-13 | Abbott Diabetes Care Inc. | Method and system for providing data management in integrated analyte monitoring and infusion system |
| CN101785702B (zh) * | 2009-01-23 | 2013-11-06 | 理康互联科技(北京)有限公司 | 健康信息系统、方法及对应装置、设备及试剂载体 |
| US9949672B2 (en) | 2009-12-17 | 2018-04-24 | Ascensia Diabetes Care Holdings Ag | Apparatus, systems and methods for determining and displaying pre-event and post-event analyte concentration levels |
| US8843321B2 (en) * | 2010-01-26 | 2014-09-23 | Roche Diagnostics Operations, Inc. | Methods and systems for processing glucose data measured from a person having diabetes |
| CN104992061B (zh) * | 2010-06-21 | 2017-05-24 | 合肥通用机械研究院 | 氯离子与碱共存环境中奥氏体不锈钢设备损伤因子的确定方法 |
| EP2476901A1 (de) * | 2011-01-17 | 2012-07-18 | Siemens Aktiengesellschaft | Verfahren und Überwachungsvorrichtung für die automatische Überwachung einer Windturbine und Verfahren zum Erzeugen eines linearen Modells |
| WO2014036177A1 (en) * | 2012-08-30 | 2014-03-06 | Abbott Diabetes Care Inc. | Optimizing medication dosage based on analyte sensor data |
| EP3073918B1 (de) | 2013-11-28 | 2023-03-22 | Roche Diabetes Care GmbH | Verfahren und vorrichtung zur analyse von kontinuierlich überwachten physiologischen messwerten eines benutzers, system und computerprogrammprodukt |
| EP3359039B1 (de) * | 2015-10-09 | 2021-07-14 | Dianovator AB | Medizinische anordnungen und verfahren zur bestimmung von parametern bezüglich einer insulintherapie, vorhersage von glucosewerten und zur bereitstellung von insulindosierungsempfehlungen |
| US11311668B2 (en) * | 2016-12-15 | 2022-04-26 | Verily Life Sciences Llc | Auto-calibration of physiological response estimates for closed-loop insulin delivery using patient-selected standardized meals |
| EP3592213B1 (de) * | 2017-03-08 | 2023-03-22 | Abbott Diabetes Care Inc. | System zur überwachung und verwaltung von wellness und ernährung unter verwendung von analytdaten |
| US11284818B2 (en) | 2020-08-31 | 2022-03-29 | TT1 Products, Inc. | Glucose exposure diagnostics and therapeutics related thereto |
| CN115732047A (zh) * | 2021-08-27 | 2023-03-03 | 深圳硅基仿生科技股份有限公司 | 基于分析物数据的评估系统 |
| USD1004777S1 (en) | 2021-09-01 | 2023-11-14 | TT1 Products, Inc. | Wrist reader |
| USD1013544S1 (en) | 2022-04-29 | 2024-02-06 | Biolinq Incorporated | Wearable sensor |
| USD1012744S1 (en) | 2022-05-16 | 2024-01-30 | Biolinq Incorporated | Wearable sensor with illuminated display |
Family Cites Families (5)
| Publication number | Priority date | Publication date | Assignee | Title |
|---|---|---|---|---|
| US6558351B1 (en) * | 1999-06-03 | 2003-05-06 | Medtronic Minimed, Inc. | Closed loop system for controlling insulin infusion |
| US6723048B2 (en) * | 1999-12-28 | 2004-04-20 | Pindi Products, Inc. | Method and apparatus for non-invasive analysis of blood glucose |
| US6442413B1 (en) * | 2000-05-15 | 2002-08-27 | James H. Silver | Implantable sensor |
| US20030208113A1 (en) * | 2001-07-18 | 2003-11-06 | Mault James R | Closed loop glycemic index system |
| US20030212379A1 (en) | 2002-02-26 | 2003-11-13 | Bylund Adam David | Systems and methods for remotely controlling medication infusion and analyte monitoring |
-
2007
- 2007-01-29 ES ES07405024T patent/ES2330897T3/es active Active
- 2007-01-29 EP EP07405024A patent/EP1949849B1/de active Active
- 2007-01-29 AT AT07405024T patent/ATE442081T1/de not_active IP Right Cessation
- 2007-01-29 DK DK07405024T patent/DK1949849T3/da active
- 2007-01-29 DE DE602007002372T patent/DE602007002372D1/de active Active
-
2008
- 2008-01-25 WO PCT/CH2008/000025 patent/WO2008092286A1/en active Application Filing
- 2008-01-25 CN CN2008800033031A patent/CN101594820B/zh active Active
-
2009
- 2009-07-29 US US12/511,190 patent/US8060318B2/en active Active
-
2010
- 2010-05-26 HK HK10105172.7A patent/HK1139024A1/xx unknown
-
2011
- 2011-10-06 US US13/267,436 patent/US8352196B2/en active Active
Cited By (13)
| Publication number | Priority date | Publication date | Assignee | Title |
|---|---|---|---|---|
| US9143569B2 (en) | 2008-02-21 | 2015-09-22 | Dexcom, Inc. | Systems and methods for processing, transmitting and displaying sensor data |
| US8591455B2 (en) | 2008-02-21 | 2013-11-26 | Dexcom, Inc. | Systems and methods for customizing delivery of sensor data |
| US9020572B2 (en) | 2008-02-21 | 2015-04-28 | Dexcom, Inc. | Systems and methods for processing, transmitting and displaying sensor data |
| US8229535B2 (en) | 2008-02-21 | 2012-07-24 | Dexcom, Inc. | Systems and methods for blood glucose monitoring and alert delivery |
| US9498165B2 (en) | 2010-02-12 | 2016-11-22 | Dexcom, Inc. | Receivers for analyzing and displaying sensor data |
| US9498164B2 (en) | 2010-02-12 | 2016-11-22 | Dexcom, Inc. | Receivers for analyzing and displaying sensor data |
| US9041730B2 (en) | 2010-02-12 | 2015-05-26 | Dexcom, Inc. | Receivers for analyzing and displaying sensor data |
| US9504430B2 (en) | 2010-02-12 | 2016-11-29 | Dexcom, Inc. | Receivers for analyzing and displaying sensor data |
| US9833199B2 (en) | 2010-02-12 | 2017-12-05 | Dexcom, Inc. | Receivers for analyzing and displaying sensor data |
| US10165986B2 (en) | 2010-02-12 | 2019-01-01 | Dexcom, Inc. | Receivers for analyzing and displaying sensor data |
| US10265030B2 (en) | 2010-02-12 | 2019-04-23 | Dexcom, Inc. | Receivers for analyzing and displaying sensor data |
| US10278650B2 (en) | 2010-02-12 | 2019-05-07 | Dexcom, Inc. | Receivers for analyzing and displaying sensor data |
| US11769589B2 (en) | 2010-02-12 | 2023-09-26 | Dexcom, Inc. | Receivers for analyzing and displaying sensor data |
Also Published As
| Publication number | Publication date |
|---|---|
| ES2330897T3 (es) | 2009-12-16 |
| US20120029833A1 (en) | 2012-02-02 |
| US8060318B2 (en) | 2011-11-15 |
| US20100030483A1 (en) | 2010-02-04 |
| DE602007002372D1 (de) | 2009-10-22 |
| US8352196B2 (en) | 2013-01-08 |
| EP1949849A1 (de) | 2008-07-30 |
| CN101594820B (zh) | 2012-07-04 |
| DK1949849T3 (da) | 2009-11-30 |
| HK1139024A1 (en) | 2010-09-10 |
| WO2008092286A1 (en) | 2008-08-07 |
| CN101594820A (zh) | 2009-12-02 |
| ATE442081T1 (de) | 2009-09-15 |
Similar Documents
| Publication | Publication Date | Title |
|---|---|---|
| EP1949849B1 (de) | Beurteilungsverfahren zum Verarbeiten eines Glukosekonzentrationssignals | |
| US20210233639A1 (en) | System and Method Considering the Effect of Physical Activity on the Glucoregulatory System | |
| US20190051410A1 (en) | Glycemic risk determination based on variability of glucose levels | |
| US6487429B2 (en) | Use of targeted glycemic profiles in the calibration of a noninvasive blood glucose monitor | |
| US7766831B2 (en) | System, tools, devices and a program for diabetes care | |
| EP3614394B1 (de) | Insulinoptimierungssysteme und testverfahren mit eingestelltem abbruchkriterium unter berücksichtigung von systemgeräuschen im zusammenhang mit biomarkern | |
| JP4891511B2 (ja) | 自己モニタリングデータから糖尿病の血糖管理を評価する方法、システム及びコンピユータプログラム製品 | |
| EP2006786B1 (de) | Verfahren und Glukoseüberwachungssystem zur Überwachung individueller Stoffwechselreaktionen und zur Erlangung eines Nährstofffeedbacks | |
| EP1718196B1 (de) | Stoffwechselüberwachung, verfahren und gerät zur anzeige eines gesundheitsbezogenen zustands einer person | |
| EP2658445B1 (de) | Glykämische messwertbestimmung für die gesundheit und anwendung | |
| US20110112416A1 (en) | System and apparatus for providing diagnosis and personalized abnormalities alerts and for providing adaptive responses in clinical trials | |
| JP2007014751A (ja) | インスリン投与量調節のために糖尿病患者の体液について一連のグルコース濃度を評価する方法と装置 | |
| EP3047413B1 (de) | Datenverwaltungseinheit und betriebsverfahren dafür | |
| CN101785701B (zh) | 信息处理的装置、方法、设备及试剂载体 | |
| JP6696962B2 (ja) | データ管理ユニット | |
| KR20130135677A (ko) | 혈당측정 데이터를 이용한 건강관리 방법 및 그 시스템 | |
| US20230200687A1 (en) | Methods, devices and system for providing diabetic condition diagnosis and therapy | |
| US20150073754A1 (en) | Method and system for calculating indices for diabetes control | |
| Volkov et al. | DiaMeter: a Mobile Application and Web Service for Monitoring Diabetes Mellitus | |
| Larsen et al. | What is hypoglycemia in patients with well-controlled type 1 diabetes treated by subcutaneous insulin pump with use of the continuous glucose monitoring system? | |
| Goode et al. | A practical cyber-physical system for the self-capture of the effect of exercise on blood glucose levels | |
| EP3599610A1 (de) | Verfahren zur bestimmung eines bolus, das durch eine insulinabgabevorrichtung verabreicht wird, computerprogrammprodukt und datenverarbeitungsvorrichtung | |
| CN115862854A (zh) | 用于血糖控制的信息的生成方法、服务器、设备 | |
| Torres et al. | Reproducibility and levels of blood lactate transition thresholds in persons with metabolic syndrome | |
| Munjal et al. | Continuous Glucose Monitoring (CGM) Systems |
Legal Events
| Date | Code | Title | Description |
|---|---|---|---|
| PUAI | Public reference made under article 153(3) epc to a published international application that has entered the european phase |
Free format text: ORIGINAL CODE: 0009012 |
|
| AK | Designated contracting states |
Kind code of ref document: A1 Designated state(s): AT BE BG CH CY CZ DE DK EE ES FI FR GB GR HU IE IS IT LI LT LU LV MC NL PL PT RO SE SI SK TR |
|
| AX | Request for extension of the european patent |
Extension state: AL BA HR MK RS |
|
| 17P | Request for examination filed |
Effective date: 20081103 |
|
| 17Q | First examination report despatched |
Effective date: 20081209 |
|
| AKX | Designation fees paid |
Designated state(s): AT BE BG CH CY CZ DE DK EE ES FI FR GB GR HU IE IS IT LI LT LU LV MC NL PL PT RO SE SI SK TR |
|
| GRAP | Despatch of communication of intention to grant a patent |
Free format text: ORIGINAL CODE: EPIDOSNIGR1 |
|
| GRAS | Grant fee paid |
Free format text: ORIGINAL CODE: EPIDOSNIGR3 |
|
| GRAA | (expected) grant |
Free format text: ORIGINAL CODE: 0009210 |
|
| AK | Designated contracting states |
Kind code of ref document: B1 Designated state(s): AT BE BG CH CY CZ DE DK EE ES FI FR GB GR HU IE IS IT LI LT LU LV MC NL PL PT RO SE SI SK TR |
|
| REG | Reference to a national code |
Ref country code: GB Ref legal event code: FG4D |
|
| REG | Reference to a national code |
Ref country code: CH Ref legal event code: EP |
|
| REG | Reference to a national code |
Ref country code: CH Ref legal event code: NV Representative=s name: KELLER & PARTNER PATENTANWAELTE AG |
|
| REG | Reference to a national code |
Ref country code: IE Ref legal event code: FG4D |
|
| REF | Corresponds to: |
Ref document number: 602007002372 Country of ref document: DE Date of ref document: 20091022 Kind code of ref document: P |
|
| REG | Reference to a national code |
Ref country code: DK Ref legal event code: T3 |
|
| REG | Reference to a national code |
Ref country code: ES Ref legal event code: FG2A Ref document number: 2330897 Country of ref document: ES Kind code of ref document: T3 |
|
| PG25 | Lapsed in a contracting state [announced via postgrant information from national office to epo] |
Ref country code: FI Free format text: LAPSE BECAUSE OF FAILURE TO SUBMIT A TRANSLATION OF THE DESCRIPTION OR TO PAY THE FEE WITHIN THE PRESCRIBED TIME-LIMIT Effective date: 20090909 Ref country code: LT Free format text: LAPSE BECAUSE OF FAILURE TO SUBMIT A TRANSLATION OF THE DESCRIPTION OR TO PAY THE FEE WITHIN THE PRESCRIBED TIME-LIMIT Effective date: 20090909 Ref country code: SE Free format text: LAPSE BECAUSE OF FAILURE TO SUBMIT A TRANSLATION OF THE DESCRIPTION OR TO PAY THE FEE WITHIN THE PRESCRIBED TIME-LIMIT Effective date: 20090909 |
|
| LTIE | Lt: invalidation of european patent or patent extension |
Effective date: 20090909 |
|
| PG25 | Lapsed in a contracting state [announced via postgrant information from national office to epo] |
Ref country code: PL Free format text: LAPSE BECAUSE OF FAILURE TO SUBMIT A TRANSLATION OF THE DESCRIPTION OR TO PAY THE FEE WITHIN THE PRESCRIBED TIME-LIMIT Effective date: 20090909 Ref country code: LV Free format text: LAPSE BECAUSE OF FAILURE TO SUBMIT A TRANSLATION OF THE DESCRIPTION OR TO PAY THE FEE WITHIN THE PRESCRIBED TIME-LIMIT Effective date: 20090909 Ref country code: SI Free format text: LAPSE BECAUSE OF FAILURE TO SUBMIT A TRANSLATION OF THE DESCRIPTION OR TO PAY THE FEE WITHIN THE PRESCRIBED TIME-LIMIT Effective date: 20090909 |
|
| PG25 | Lapsed in a contracting state [announced via postgrant information from national office to epo] |
Ref country code: CY Free format text: LAPSE BECAUSE OF FAILURE TO SUBMIT A TRANSLATION OF THE DESCRIPTION OR TO PAY THE FEE WITHIN THE PRESCRIBED TIME-LIMIT Effective date: 20090909 |
|
| PG25 | Lapsed in a contracting state [announced via postgrant information from national office to epo] |
Ref country code: PT Free format text: LAPSE BECAUSE OF FAILURE TO SUBMIT A TRANSLATION OF THE DESCRIPTION OR TO PAY THE FEE WITHIN THE PRESCRIBED TIME-LIMIT Effective date: 20100111 Ref country code: RO Free format text: LAPSE BECAUSE OF FAILURE TO SUBMIT A TRANSLATION OF THE DESCRIPTION OR TO PAY THE FEE WITHIN THE PRESCRIBED TIME-LIMIT Effective date: 20090909 Ref country code: EE Free format text: LAPSE BECAUSE OF FAILURE TO SUBMIT A TRANSLATION OF THE DESCRIPTION OR TO PAY THE FEE WITHIN THE PRESCRIBED TIME-LIMIT Effective date: 20090909 Ref country code: IS Free format text: LAPSE BECAUSE OF FAILURE TO SUBMIT A TRANSLATION OF THE DESCRIPTION OR TO PAY THE FEE WITHIN THE PRESCRIBED TIME-LIMIT Effective date: 20100109 |
|
| PG25 | Lapsed in a contracting state [announced via postgrant information from national office to epo] |
Ref country code: SK Free format text: LAPSE BECAUSE OF FAILURE TO SUBMIT A TRANSLATION OF THE DESCRIPTION OR TO PAY THE FEE WITHIN THE PRESCRIBED TIME-LIMIT Effective date: 20090909 |
|
| PG25 | Lapsed in a contracting state [announced via postgrant information from national office to epo] |
Ref country code: BE Free format text: LAPSE BECAUSE OF FAILURE TO SUBMIT A TRANSLATION OF THE DESCRIPTION OR TO PAY THE FEE WITHIN THE PRESCRIBED TIME-LIMIT Effective date: 20090909 Ref country code: AT Free format text: LAPSE BECAUSE OF FAILURE TO SUBMIT A TRANSLATION OF THE DESCRIPTION OR TO PAY THE FEE WITHIN THE PRESCRIBED TIME-LIMIT Effective date: 20090909 |
|
| PLBE | No opposition filed within time limit |
Free format text: ORIGINAL CODE: 0009261 |
|
| STAA | Information on the status of an ep patent application or granted ep patent |
Free format text: STATUS: NO OPPOSITION FILED WITHIN TIME LIMIT |
|
| 26N | No opposition filed |
Effective date: 20100610 |
|
| PG25 | Lapsed in a contracting state [announced via postgrant information from national office to epo] |
Ref country code: MC Free format text: LAPSE BECAUSE OF NON-PAYMENT OF DUE FEES Effective date: 20100131 |
|
| REG | Reference to a national code |
Ref country code: FR Ref legal event code: ST Effective date: 20100930 |
|
| PG25 | Lapsed in a contracting state [announced via postgrant information from national office to epo] |
Ref country code: GR Free format text: LAPSE BECAUSE OF FAILURE TO SUBMIT A TRANSLATION OF THE DESCRIPTION OR TO PAY THE FEE WITHIN THE PRESCRIBED TIME-LIMIT Effective date: 20091210 |
|
| PGFP | Annual fee paid to national office [announced via postgrant information from national office to epo] |
Ref country code: CZ Payment date: 20100714 Year of fee payment: 5 |
|
| REG | Reference to a national code |
Ref country code: FR Ref legal event code: D3 |
|
| PGRI | Patent reinstated in contracting state [announced from national office to epo] |
Ref country code: IT Effective date: 20110501 |
|
| PGFP | Annual fee paid to national office [announced via postgrant information from national office to epo] |
Ref country code: IE Payment date: 20120106 Year of fee payment: 6 |
|
| PGFP | Annual fee paid to national office [announced via postgrant information from national office to epo] |
Ref country code: IT Payment date: 20120119 Year of fee payment: 6 |
|
| PG25 | Lapsed in a contracting state [announced via postgrant information from national office to epo] |
Ref country code: HU Free format text: LAPSE BECAUSE OF FAILURE TO SUBMIT A TRANSLATION OF THE DESCRIPTION OR TO PAY THE FEE WITHIN THE PRESCRIBED TIME-LIMIT Effective date: 20100310 Ref country code: BG Free format text: LAPSE BECAUSE OF FAILURE TO SUBMIT A TRANSLATION OF THE DESCRIPTION OR TO PAY THE FEE WITHIN THE PRESCRIBED TIME-LIMIT Effective date: 20090909 Ref country code: LU Free format text: LAPSE BECAUSE OF NON-PAYMENT OF DUE FEES Effective date: 20100129 |
|
| REG | Reference to a national code |
Ref country code: CH Ref legal event code: NV Representative=s name: RENTSCH PARTNER AG |
|
| PG25 | Lapsed in a contracting state [announced via postgrant information from national office to epo] |
Ref country code: TR Free format text: LAPSE BECAUSE OF FAILURE TO SUBMIT A TRANSLATION OF THE DESCRIPTION OR TO PAY THE FEE WITHIN THE PRESCRIBED TIME-LIMIT Effective date: 20090909 |
|
| PGFP | Annual fee paid to national office [announced via postgrant information from national office to epo] |
Ref country code: ES Payment date: 20120120 Year of fee payment: 6 |
|
| REG | Reference to a national code |
Ref country code: IE Ref legal event code: MM4A |
|
| PG25 | Lapsed in a contracting state [announced via postgrant information from national office to epo] |
Ref country code: CZ Free format text: LAPSE BECAUSE OF NON-PAYMENT OF DUE FEES Effective date: 20130129 |
|
| PG25 | Lapsed in a contracting state [announced via postgrant information from national office to epo] |
Ref country code: IT Free format text: LAPSE BECAUSE OF NON-PAYMENT OF DUE FEES Effective date: 20130129 |
|
| PG25 | Lapsed in a contracting state [announced via postgrant information from national office to epo] |
Ref country code: IE Free format text: LAPSE BECAUSE OF NON-PAYMENT OF DUE FEES Effective date: 20130129 |
|
| REG | Reference to a national code |
Ref country code: ES Ref legal event code: FD2A Effective date: 20140611 |
|
| PG25 | Lapsed in a contracting state [announced via postgrant information from national office to epo] |
Ref country code: ES Free format text: LAPSE BECAUSE OF NON-PAYMENT OF DUE FEES Effective date: 20130130 |
|
| REG | Reference to a national code |
Ref country code: FR Ref legal event code: PLFP Year of fee payment: 10 |
|
| REG | Reference to a national code |
Ref country code: FR Ref legal event code: PLFP Year of fee payment: 11 |
|
| REG | Reference to a national code |
Ref country code: CH Ref legal event code: PCAR Free format text: NEW ADDRESS: BELLERIVESTRASSE 203 POSTFACH, 8034 ZUERICH (CH) |
|
| REG | Reference to a national code |
Ref country code: FR Ref legal event code: PLFP Year of fee payment: 12 |
|
| REG | Reference to a national code |
Ref country code: DE Ref legal event code: R082 Ref document number: 602007002372 Country of ref document: DE Ref country code: DE Ref legal event code: R081 Ref document number: 602007002372 Country of ref document: DE Owner name: ROCHE DIABETES CARE GMBH, DE Free format text: FORMER OWNERS: ROCHE DIAGNOSTICS GMBH, 68305 MANNHEIM, DE; F. HOFFMANN-LA ROCHE AG, 4070 BASEL, CH |
|
| PGFP | Annual fee paid to national office [announced via postgrant information from national office to epo] |
Ref country code: CH Payment date: 20230201 Year of fee payment: 17 |
|
| PGFP | Annual fee paid to national office [announced via postgrant information from national office to epo] |
Ref country code: GB Payment date: 20231219 Year of fee payment: 18 |
|
| PGFP | Annual fee paid to national office [announced via postgrant information from national office to epo] |
Ref country code: NL Payment date: 20231219 Year of fee payment: 18 Ref country code: FR Payment date: 20231219 Year of fee payment: 18 Ref country code: DK Payment date: 20231219 Year of fee payment: 18 |
|
| PGFP | Annual fee paid to national office [announced via postgrant information from national office to epo] |
Ref country code: DE Payment date: 20231219 Year of fee payment: 18 Ref country code: CH Payment date: 20240202 Year of fee payment: 18 |