EP1875203B1 - Transmissionspektroskopiesystem zur verwendung bei der bestimmung von analyten in körperflüssigkeit - Google Patents
Transmissionspektroskopiesystem zur verwendung bei der bestimmung von analyten in körperflüssigkeit Download PDFInfo
- Publication number
- EP1875203B1 EP1875203B1 EP05854031A EP05854031A EP1875203B1 EP 1875203 B1 EP1875203 B1 EP 1875203B1 EP 05854031 A EP05854031 A EP 05854031A EP 05854031 A EP05854031 A EP 05854031A EP 1875203 B1 EP1875203 B1 EP 1875203B1
- Authority
- EP
- European Patent Office
- Prior art keywords
- light
- lens
- sample
- angle
- receiving area
- Prior art date
- Legal status (The legal status is an assumption and is not a legal conclusion. Google has not performed a legal analysis and makes no representation as to the accuracy of the status listed.)
- Not-in-force
Links
- 238000002235 transmission spectroscopy Methods 0.000 title claims abstract description 44
- 210000001124 body fluid Anatomy 0.000 title description 15
- 239000010839 body fluid Substances 0.000 title description 15
- 239000012491 analyte Substances 0.000 claims abstract description 35
- 239000012530 fluid Substances 0.000 claims abstract description 10
- 239000000463 material Substances 0.000 claims abstract description 5
- 210000004369 blood Anatomy 0.000 claims description 63
- 239000008280 blood Substances 0.000 claims description 63
- 239000008103 glucose Substances 0.000 claims description 50
- WQZGKKKJIJFFOK-GASJEMHNSA-N Glucose Natural products OC[C@H]1OC(O)[C@H](O)[C@@H](O)[C@@H]1O WQZGKKKJIJFFOK-GASJEMHNSA-N 0.000 claims description 46
- 239000003153 chemical reaction reagent Substances 0.000 claims description 32
- 238000000034 method Methods 0.000 claims description 32
- 238000006243 chemical reaction Methods 0.000 claims description 22
- 238000012544 monitoring process Methods 0.000 claims description 5
- 230000008878 coupling Effects 0.000 claims description 3
- 238000010168 coupling process Methods 0.000 claims description 3
- 238000005859 coupling reaction Methods 0.000 claims description 3
- XUIMIQQOPSSXEZ-UHFFFAOYSA-N Silicon Chemical compound [Si] XUIMIQQOPSSXEZ-UHFFFAOYSA-N 0.000 claims description 2
- 239000003795 chemical substances by application Substances 0.000 claims description 2
- 230000002949 hemolytic effect Effects 0.000 claims description 2
- 229910052710 silicon Inorganic materials 0.000 claims description 2
- 239000010703 silicon Substances 0.000 claims description 2
- 239000000835 fiber Substances 0.000 claims 1
- 125000002791 glucosyl group Chemical group C1([C@H](O)[C@@H](O)[C@H](O)[C@H](O1)CO)* 0.000 claims 1
- 239000000523 sample Substances 0.000 description 134
- 230000005540 biological transmission Effects 0.000 description 93
- 238000005534 hematocrit Methods 0.000 description 57
- 210000004027 cell Anatomy 0.000 description 46
- 108010054147 Hemoglobins Proteins 0.000 description 30
- 102000001554 Hemoglobins Human genes 0.000 description 30
- 238000002835 absorbance Methods 0.000 description 21
- 230000003287 optical effect Effects 0.000 description 18
- 238000005259 measurement Methods 0.000 description 17
- 210000003743 erythrocyte Anatomy 0.000 description 15
- 230000005855 radiation Effects 0.000 description 12
- 238000000926 separation method Methods 0.000 description 11
- 238000004611 spectroscopical analysis Methods 0.000 description 10
- 238000004458 analytical method Methods 0.000 description 9
- 238000000411 transmission spectrum Methods 0.000 description 8
- 230000004044 response Effects 0.000 description 7
- 238000003556 assay Methods 0.000 description 6
- HVYWMOMLDIMFJA-DPAQBDIFSA-N cholesterol Chemical compound C1C=C2C[C@@H](O)CC[C@]2(C)[C@@H]2[C@@H]1[C@@H]1CC[C@H]([C@H](C)CCCC(C)C)[C@@]1(C)CC2 HVYWMOMLDIMFJA-DPAQBDIFSA-N 0.000 description 6
- 230000003595 spectral effect Effects 0.000 description 6
- 239000000126 substance Substances 0.000 description 6
- 230000008859 change Effects 0.000 description 5
- 238000012937 correction Methods 0.000 description 5
- 230000008569 process Effects 0.000 description 5
- JVTAAEKCZFNVCJ-UHFFFAOYSA-M Lactate Chemical compound CC(O)C([O-])=O JVTAAEKCZFNVCJ-UHFFFAOYSA-M 0.000 description 4
- 108010064719 Oxyhemoglobins Proteins 0.000 description 4
- 231100000673 dose–response relationship Toxicity 0.000 description 4
- 238000012986 modification Methods 0.000 description 4
- 230000004048 modification Effects 0.000 description 4
- 238000001228 spectrum Methods 0.000 description 4
- 238000012360 testing method Methods 0.000 description 4
- 238000010521 absorption reaction Methods 0.000 description 3
- WQZGKKKJIJFFOK-VFUOTHLCSA-N beta-D-glucose Chemical compound OC[C@H]1O[C@@H](O)[C@H](O)[C@@H](O)[C@@H]1O WQZGKKKJIJFFOK-VFUOTHLCSA-N 0.000 description 3
- 235000012000 cholesterol Nutrition 0.000 description 3
- 230000009089 cytolysis Effects 0.000 description 3
- 230000001419 dependent effect Effects 0.000 description 3
- 238000002329 infrared spectrum Methods 0.000 description 3
- 230000003834 intracellular effect Effects 0.000 description 3
- 230000002934 lysing effect Effects 0.000 description 3
- 239000000203 mixture Substances 0.000 description 3
- XLYOFNOQVPJJNP-UHFFFAOYSA-N water Substances O XLYOFNOQVPJJNP-UHFFFAOYSA-N 0.000 description 3
- 108010050375 Glucose 1-Dehydrogenase Proteins 0.000 description 2
- BAWFJGJZGIEFAR-NNYOXOHSSA-N NAD zwitterion Chemical compound NC(=O)C1=CC=C[N+]([C@H]2[C@@H]([C@H](O)[C@@H](COP([O-])(=O)OP(O)(=O)OC[C@@H]3[C@H]([C@@H](O)[C@@H](O3)N3C4=NC=NC(N)=C4N=C3)O)O2)O)=C1 BAWFJGJZGIEFAR-NNYOXOHSSA-N 0.000 description 2
- 210000000601 blood cell Anatomy 0.000 description 2
- 210000005056 cell body Anatomy 0.000 description 2
- 230000007423 decrease Effects 0.000 description 2
- 210000003722 extracellular fluid Anatomy 0.000 description 2
- 238000009472 formulation Methods 0.000 description 2
- IXZISFNWUWKBOM-ARQDHWQXSA-N fructosamine Chemical compound NC[C@@]1(O)OC[C@@H](O)[C@@H](O)[C@@H]1O IXZISFNWUWKBOM-ARQDHWQXSA-N 0.000 description 2
- 230000006870 function Effects 0.000 description 2
- 229910052736 halogen Inorganic materials 0.000 description 2
- 150000002367 halogens Chemical class 0.000 description 2
- 238000012417 linear regression Methods 0.000 description 2
- 229950006238 nadide Drugs 0.000 description 2
- 229930027945 nicotinamide-adenine dinucleotide Natural products 0.000 description 2
- 210000002381 plasma Anatomy 0.000 description 2
- 230000035484 reaction time Effects 0.000 description 2
- 210000003296 saliva Anatomy 0.000 description 2
- 210000002966 serum Anatomy 0.000 description 2
- 210000002700 urine Anatomy 0.000 description 2
- 108090000790 Enzymes Proteins 0.000 description 1
- 102000004190 Enzymes Human genes 0.000 description 1
- 239000004366 Glucose oxidase Substances 0.000 description 1
- 102000003855 L-lactate dehydrogenase Human genes 0.000 description 1
- 108700023483 L-lactate dehydrogenases Proteins 0.000 description 1
- VYPSYNLAJGMNEJ-UHFFFAOYSA-N Silicium dioxide Chemical compound O=[Si]=O VYPSYNLAJGMNEJ-UHFFFAOYSA-N 0.000 description 1
- NIXOWILDQLNWCW-UHFFFAOYSA-N acrylic acid group Chemical group C(C=C)(=O)O NIXOWILDQLNWCW-UHFFFAOYSA-N 0.000 description 1
- 239000012472 biological sample Substances 0.000 description 1
- 230000006037 cell lysis Effects 0.000 description 1
- 210000002421 cell wall Anatomy 0.000 description 1
- 230000001413 cellular effect Effects 0.000 description 1
- 238000011109 contamination Methods 0.000 description 1
- 230000003247 decreasing effect Effects 0.000 description 1
- 230000007547 defect Effects 0.000 description 1
- 238000001514 detection method Methods 0.000 description 1
- 239000003599 detergent Substances 0.000 description 1
- 229940088598 enzyme Drugs 0.000 description 1
- 238000001506 fluorescence spectroscopy Methods 0.000 description 1
- 239000005350 fused silica glass Substances 0.000 description 1
- 229940116332 glucose oxidase Drugs 0.000 description 1
- 235000019420 glucose oxidase Nutrition 0.000 description 1
- 230000000977 initiatory effect Effects 0.000 description 1
- 238000001499 laser induced fluorescence spectroscopy Methods 0.000 description 1
- 229940056932 lead sulfide Drugs 0.000 description 1
- 229910052981 lead sulfide Inorganic materials 0.000 description 1
- 239000013307 optical fiber Substances 0.000 description 1
- 125000001997 phenyl group Chemical group [H]C1=C([H])C([H])=C(*)C([H])=C1[H] 0.000 description 1
- 229920000642 polymer Polymers 0.000 description 1
- 238000007781 pre-processing Methods 0.000 description 1
- 238000004445 quantitative analysis Methods 0.000 description 1
- 239000013074 reference sample Substances 0.000 description 1
- 229910052594 sapphire Inorganic materials 0.000 description 1
- 239000010980 sapphire Substances 0.000 description 1
- 238000002798 spectrophotometry method Methods 0.000 description 1
- 125000003831 tetrazolyl group Chemical group 0.000 description 1
Images


Classifications
-
- G—PHYSICS
- G01—MEASURING; TESTING
- G01N—INVESTIGATING OR ANALYSING MATERIALS BY DETERMINING THEIR CHEMICAL OR PHYSICAL PROPERTIES
- G01N21/00—Investigating or analysing materials by the use of optical means, i.e. using sub-millimetre waves, infrared, visible or ultraviolet light
- G01N21/17—Systems in which incident light is modified in accordance with the properties of the material investigated
- G01N21/25—Colour; Spectral properties, i.e. comparison of effect of material on the light at two or more different wavelengths or wavelength bands
- G01N21/31—Investigating relative effect of material at wavelengths characteristic of specific elements or molecules, e.g. atomic absorption spectrometry
-
- G—PHYSICS
- G01—MEASURING; TESTING
- G01N—INVESTIGATING OR ANALYSING MATERIALS BY DETERMINING THEIR CHEMICAL OR PHYSICAL PROPERTIES
- G01N21/00—Investigating or analysing materials by the use of optical means, i.e. using sub-millimetre waves, infrared, visible or ultraviolet light
- G01N21/17—Systems in which incident light is modified in accordance with the properties of the material investigated
- G01N21/25—Colour; Spectral properties, i.e. comparison of effect of material on the light at two or more different wavelengths or wavelength bands
- G01N21/255—Details, e.g. use of specially adapted sources, lighting or optical systems
-
- G—PHYSICS
- G01—MEASURING; TESTING
- G01N—INVESTIGATING OR ANALYSING MATERIALS BY DETERMINING THEIR CHEMICAL OR PHYSICAL PROPERTIES
- G01N21/00—Investigating or analysing materials by the use of optical means, i.e. using sub-millimetre waves, infrared, visible or ultraviolet light
- G01N21/17—Systems in which incident light is modified in accordance with the properties of the material investigated
- G01N21/25—Colour; Spectral properties, i.e. comparison of effect of material on the light at two or more different wavelengths or wavelength bands
- G01N21/31—Investigating relative effect of material at wavelengths characteristic of specific elements or molecules, e.g. atomic absorption spectrometry
- G01N21/314—Investigating relative effect of material at wavelengths characteristic of specific elements or molecules, e.g. atomic absorption spectrometry with comparison of measurements at specific and non-specific wavelengths
- G01N21/3151—Investigating relative effect of material at wavelengths characteristic of specific elements or molecules, e.g. atomic absorption spectrometry with comparison of measurements at specific and non-specific wavelengths using two sources of radiation of different wavelengths
-
- G—PHYSICS
- G01—MEASURING; TESTING
- G01N—INVESTIGATING OR ANALYSING MATERIALS BY DETERMINING THEIR CHEMICAL OR PHYSICAL PROPERTIES
- G01N21/00—Investigating or analysing materials by the use of optical means, i.e. using sub-millimetre waves, infrared, visible or ultraviolet light
- G01N21/17—Systems in which incident light is modified in accordance with the properties of the material investigated
- G01N21/25—Colour; Spectral properties, i.e. comparison of effect of material on the light at two or more different wavelengths or wavelength bands
- G01N21/31—Investigating relative effect of material at wavelengths characteristic of specific elements or molecules, e.g. atomic absorption spectrometry
- G01N21/35—Investigating relative effect of material at wavelengths characteristic of specific elements or molecules, e.g. atomic absorption spectrometry using infrared light
- G01N21/3577—Investigating relative effect of material at wavelengths characteristic of specific elements or molecules, e.g. atomic absorption spectrometry using infrared light for analysing liquids, e.g. polluted water
-
- G—PHYSICS
- G01—MEASURING; TESTING
- G01N—INVESTIGATING OR ANALYSING MATERIALS BY DETERMINING THEIR CHEMICAL OR PHYSICAL PROPERTIES
- G01N21/00—Investigating or analysing materials by the use of optical means, i.e. using sub-millimetre waves, infrared, visible or ultraviolet light
- G01N21/17—Systems in which incident light is modified in accordance with the properties of the material investigated
- G01N21/25—Colour; Spectral properties, i.e. comparison of effect of material on the light at two or more different wavelengths or wavelength bands
- G01N21/31—Investigating relative effect of material at wavelengths characteristic of specific elements or molecules, e.g. atomic absorption spectrometry
- G01N21/39—Investigating relative effect of material at wavelengths characteristic of specific elements or molecules, e.g. atomic absorption spectrometry using tunable lasers
-
- G—PHYSICS
- G01—MEASURING; TESTING
- G01N—INVESTIGATING OR ANALYSING MATERIALS BY DETERMINING THEIR CHEMICAL OR PHYSICAL PROPERTIES
- G01N21/00—Investigating or analysing materials by the use of optical means, i.e. using sub-millimetre waves, infrared, visible or ultraviolet light
- G01N21/75—Systems in which material is subjected to a chemical reaction, the progress or the result of the reaction being investigated
- G01N21/77—Systems in which material is subjected to a chemical reaction, the progress or the result of the reaction being investigated by observing the effect on a chemical indicator
- G01N21/78—Systems in which material is subjected to a chemical reaction, the progress or the result of the reaction being investigated by observing the effect on a chemical indicator producing a change of colour
-
- G—PHYSICS
- G01—MEASURING; TESTING
- G01N—INVESTIGATING OR ANALYSING MATERIALS BY DETERMINING THEIR CHEMICAL OR PHYSICAL PROPERTIES
- G01N21/00—Investigating or analysing materials by the use of optical means, i.e. using sub-millimetre waves, infrared, visible or ultraviolet light
- G01N21/17—Systems in which incident light is modified in accordance with the properties of the material investigated
- G01N21/25—Colour; Spectral properties, i.e. comparison of effect of material on the light at two or more different wavelengths or wavelength bands
- G01N21/27—Colour; Spectral properties, i.e. comparison of effect of material on the light at two or more different wavelengths or wavelength bands using photo-electric detection ; circuits for computing concentration
- G01N21/274—Calibration, base line adjustment, drift correction
Definitions
- the invention generally relates to spectroscopy and, more particularly, to the use of total transmission spectroscopy for determining the concentration of an analyte in body fluid.
- Transmission spectroscopy is used to perform quantitative analysis of a sample based on the transmission of a light beam through a sample contained by a sample cell. Different frequency components of the light beam are absorbed by components of the sample, whereby a frequency analysis of light transmitted through the sample permits analysis of the sample itself. Dry chemical reagents are dissolved by the sample and react with the analyte of interest to produce a chromaphoric response at certain wavelengths of light ranging from about 450 nanometers ("nm”) to about 950 nm.
- Transmission spectroscopy is one method for measuring the concentration of an analyte (e.g. , glucose, lactate, fructosamine, hemoglobin A 1c , and cholesterol) in a body fluid (e.g. , blood, plasma or serum, saliva, urine, and interstitial fluid).
- a body fluid e.g. , blood, plasma or serum, saliva, urine, and interstitial fluid.
- An indicator reagent system and an analyte in a sample of body fluid are reacted to produce a chromatic reaction—the reaction between the reagent and analyte causes the sample to change color.
- the degree of color change is indicative of the analyte concentration in the body fluid.
- the color change of the sample is evaluated, for example, using spectroscopy to measure the absorbance level of the transmitted light.
- a transmission spectroscopic analysis includes a light source that produces a beam of light for illuminating a sample and a detector for detecting light that is transmitted through the sample. The detected transmitted light is then compared to a reference sample (e.g. , light from the source directly detected by the detector without the sample present).
- Regular transmission spectroscopy refers to the collection and analysis of the light that exits the sample at small angles (e.g. , from about 0° to about 15°) relative to the normal optical axis, and not the scattered light transmitted through the sample.
- the normal optical axis is an axis that is perpendicular to the sample cell optical entrance and exit widows.
- Total transmission spectroscopy refers to the collection of substantially all of the light (including scattered light) exiting a sample at large angles (e.g. , from about 0° to about 90°) relative to the normal optical axis.
- Existing systems for total transmission spectroscopic analysis implement an integrating sphere for collecting all of the light passing through the sample, and a required photomultiplier tube for reading the reflected light from a small portion of the inside surface of the integrating sphere.
- the total transmission of light having a wavelength ranging from about 600 nm to about 800 nm is nearly 100%T, and there is little separation between the different hemoglobin levels.
- the hemoglobin concentration level has little impact on the transmitted light having a wavelength ranging from about 600 nm to about 800 nm.
- a drawback associated with existing total transmission spectroscopy systems that use an integrating sphere is a low signal level that requires using a photomultiplier tube for reading the reflected light from a small portion of the inside surface of the integrating sphere.
- Another drawback associated with conventional total transmission spectroscopy systems is the cost of an integrating sphere and photomultiplier tube. The cost of these devices makes it cost-prohibitive to produce existing total transmission spectroscopy systems for use by a patient needing to self-test, for example, the patient's blood-glucose concentration level.
- spectroscopic systems for use in determining the analyte concentration in body fluids have centered on regular transmission measurements.
- a reagent or detergent is typically added to the blood sample to lyse the red blood cells. Rupture of the cell walls through lysis of the blood cells reduces the scattered transmission, and increases the regular transmission of light through the sample.
- the addition of a lysing reagent and subsequent lysis of the red blood cells is time consuming relative to the overall measurement process. This problem is not present in existing total transmission spectroscopy methods because the scattered transmitted light and regular transmitted light is collected by the optics. Total transmission levels are typically high enough that lysing the red blood cells is not required, which significantly reduces the overall time for a chemical assay.
- the indicator reagent may react with intracellular components (i.e. , hemoglobin, lactate dehydogenase, etc.) released from the lysing of red blood cells causing an additional color response.
- intracellular components i.e. , hemoglobin, lactate dehydogenase, etc.
- the transmission bias caused by this reaction of the reagent and the certain intracellular components such as hemoglobin is not indicative of the blood-glucose level.
- This transmission bias causes inaccuracies in determining the analyte (e.g. , glucose) concentration.
- the amount of bias is related to the concentration of certain cellular components in the blood cells.
- the hematocrit level of whole blood may also cause a total transmission bias due to differences in the amount of scattered light at different hematocrit levels.
- the transmission loss caused by varying levels of hematocrit is not indicative of the blood-glucose level.
- Existing systems using regular transmission or total transmission spectroscopy are not capable of detecting the difference in hematocrit levels because of poor transmission level and poor separation between hematocrit levels at certain wavelengths of light.
- US 5,926,271 discloses a laser-induced fluorescence detector comprising a laser beam emitting device, a dichroic mirror to deviate the laser light orthogonally, a lens with a small numerical aperture, a ball lens, a unique cell within a capillary, the cell receiving a solute containing at least one unknown fluorescent substance at the laser wavelength, the same device collecting the fluorescence emitted by the fluorescent substance, with optical filters, a photomultiplier tube, and a computer for displaying results of the analysis.
- the ball lens converts the laser beam into a very small divergent beam, which allows a high irradiated volume in the capillary cell.
- the collinear arrangement using the same optical device for emitting and collecting light avoids the difficulty to put optical devices at the same location close to a small diameter capillary. All lances and the light source and detector are arranged on the same side of the sample cell.
- WO 2004/081612 A2 discloses an optical configuration for use in a gas monitoring system.
- the optical system uses a high numerical aperture lens to maximize capture of relatively large angle rays, thereby increasing the measured signal at the infrared radiation detector.
- a half-ball-type lens is provided proximal to the infrared radiation source in the gas measurement system.
- materials that are reflective in the infrared band of interest are used, so that the walls of the sample cell act as a hollow light pipe.
- US 2002/0067481 A1 discloses an apparatus for the spectroscopic analysis of the composition of the contents of vessels by recording transmission spectra.
- the apparatus comprises at least a radiation source for generating the measuring radiation, and a spectral analyzer for measuring the transmitted radiation, two windows which are disposed opposite one another on the vessel and are transparent to the measuring radiation, and two collimators which are designed to spread the measuring radiation within the range of the measuring section and are disposed opposite one another in front of the windows.
- US 4,747,687 discloses a detector cell assembly for spectrophotometry which has a radiation transparent spherical ball closing the opening in a cell body through which radiation passes. The ball focuses the radiation so that the radiation has a crossed ray pattern within the cell. High strength sapphire and fused silica balls permit a direct seal between the cell body and the spherical ball window without the use of gaskets.
- US 5,602,647 discloses several types of optical apparatus' all having in common that they include a cell, a light irradiator, a photodetector and an arithmetic unit.
- the cell is adapted to present different optical path lengths and to contain a sample therein.
- the light irradiator comprises a lamp and a lens.
- the photodetector is equipped with a spectrometer.
- the light derived from the lamp including different wavelengths is formed into collimated light by the lens and is incident upon the cell, which is in a state of one optical path length.
- the light that has been transmitted through the cell is separated into its spectral components by the spectrometer, so that quantity of transmitted light is measured for each wavelength.
- the sample cell receiving area is adapted to receive a sample to be analyzed.
- the sample cell receiving area is constructed of a substantially optically clear material.
- the collimating lens is adapted to receive light from the light source and adapted to illuminate the sample cell receiving area with a substantially collimated beam of light.
- the first lens is adapted to receive regular and scattered light transmitted through the sample at a first angle of divergence.
- the sample cell receiving area is located between the collimating lens and the first lens.
- the first lens receives light having a first angle of acceptance.
- the first lens outputs light having a second angle of divergence.
- the second angle of divergence is less than the first angle of divergence.
- the second lens is adapted to receive light from the first lens and adapted to output a substantially collimated beam of light.
- the detector is adapted to measure the light output by the second lens.
- Each of the first and second lenses is a half-ball lens.
- the analyte concentration in a fluid sample is determined with a total transmission spectroscopy system.
- a sample to be analyzed is received in a sample cell receiving area of the total transmission spectroscopy system.
- a beam of light is outputted via a light source.
- the beam of light output is substantially collimated from the light source by a collimating lens.
- the sample is illuminated with the substantially collimated beam of light output from the light source via collimating lens.
- Regular and scattered light transmitted through the sample is collected with a first lens.
- the sample cell receiving area is located between the collimating lens and the first lens.
- the angle of divergence of the transmitted light is reduced with the first lens.
- the light having a reduced angle of divergence is received with a second lens.
- the received light is substantially collimated with the second lens.
- the substantially collimated light from the second lens is measured with a detector.
- Each of the first and second lenses is a half-ball lens.
- FIG. 1a is a side view of a total transmission spectroscopy system for use in determining the analyte concentration in body fluid according to one embodiment of the present invention.
- FIG. 1b is a side view of a total transmission spectroscopy system for use in determining the analyte concentration in body fluid according to another embodiment of the present invention.
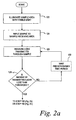
- FIG. 2a is a flow chart illustrating the operation of the system of FIG. 1a according to one embodiment of the present invention that includes an underfill detection for determining if there is an adequate sample size.
- FIG. 2b is a flow chart illustrating the operation of the system of FIG. 1a a according to a further embodiment of the present invention that is capable of correcting for transmission bias caused by hematocrit levels in the blood sample.
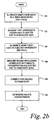
- FIG. 2c is a flow chart illustrating the operation of the system of FIG. 1a according to another embodiment of the present invention that is capable of correcting for transmission bias caused by hemoglobin in a blood sample.
- FIG. 3a is a plot of the total transmission spectra of reacted glucose assays with 20% hematocrit whole blood at 54, 105, 210, and 422 mg/dL glucose levels through the visible and near-infrared spectrum from 500 nm to 940 nm.
- FIG. 3b is the total transmission spectra of reacted glucose assays with 60% hematocrit whole blood at 59, 117, 239, and 475 mg/dL glucose levels through the visible to near-infrared spectrum from 500 nm to 940 nm.
- FIG. 4a is a plot of the total transmission spectra of FIG. 3a corrected for scatter by ratioing all transmission readings to the transmission at 940 nm.
- FIG. 4b is the total transmission spectra of FIG. 3b corrected for scatter by ratioing all transmission readings to the transmission at 940 nm.
- FIG. 5 is a plot of the glucose concentration dose response of whole blood at 20%, 40%, and 60% levels of hematocrit measured with total transmission (in absorbance units) at 680 nm, obtained using the readhead of FIG. 1a .
- FIG. 6 is a plot of the dose response of FIG. 5 corrected for transmission bias (in absorbance units) caused by different hematocrit levels in a blood sample.
- FIG. 7 is a plot of the total transmission (spectrum in absorbance units) of reagent with whole blood at 0, 100, and 400 mg/dL glucose levels, and water with reagent throughout the visible and near-infrared spectrum from 500 nm and 940 nm.
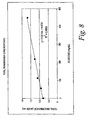
- FIG. 8 plots the linear response of total transmission (in absorbance units) at 680nm of reagent reacted with whole blood at glucose concentrations of 0, 50, 100, 200, and 450 mg/dL.
- FIG. 9 shows the regular and total transmission spectrums from 500 nm to 940 nm for whole blood at 20%, 40%, and 60% levels of hematocrit.
- FIG. 1a there is shown a transmission spectroscopy system 10 implementing total transmission spectroscopy for use in the determination of an analyte concentration in a biological sample such as a body fluid.
- analytes that may be determined include glucose, lactate, fructosamine, cholesterol, hemoglobin A 1c , and cholesterol.
- Such analytes may be in body fluids such as blood (including blood plasma and serum), saliva, urine, and interstitial fluid.
- the system 10 includes a light source 12.
- the light source is a halogen lamp that outputs a beam of white light having a wavelength ranging from about 300 nm to about 3200 nm.
- the light source 12 outputs two or more beams of monochromatic light using light emitting diodes (LEDs) having center wavelengths located within a wavelength range from about 400 nm to about 1000 nm.
- the light output by the light source 12 is received by a collimation lens 22 that outputs a substantially collimated beam of light 14.
- the collimated beam of light 14 illuminates a sample 16 disposed in a sample cell receiving area 18 of a readhead 20.
- the sample comprises blood with glucose that has reacted with a dry reagent system containing an indicator.
- a glucose-indicator reagent that may be used contains glucose dehydrogenase, NAD (nicotinamide adenine dinucleotide), diaphorase, tetrazolium indicator (WST-4) (2-benzothiazoyl-3-(4-carboxy-2-methoxyphenyl)-5-[4-(2-sulfoethylcarbamoyl)phenyl]-2H-tetrazolium), and polymers.
- reagent formulation does not require a hemolyzing agent to break apart red blood cells. By not breaking apart red blood cells, the total time test is faster.
- the substantially collimated beam of light 14 illuminates the sample 16 and a portion of light is transmitted through the sample 16.
- the light that is transmitted through the sample which comprises regular and diffusely scattered light, is collected by a first lens 30 and a second lens 40.
- the first and second lenses are half-ball lenses. It is contemplated that other types of lens including ball lenses or aspheric lenses may be used to collect the transmitted light.
- the first lens 30 collects light at an acceptance angle of about 72°, or a numerical aperture (NA) of about 0.951, but the acceptance angle ranges from 0° to 90° for collecting the scattered portion of the transmitted light.
- the light 32 exiting from the first lens 30 diverges at an angle ranging from about 15° to about 40°, and more specifically at an angle about 20°.
- the second lens 40 reduces the diverging light output 32 of the first lens 30 to an angle of diverging light 42 ranging from 0 to about 10 degrees, and is more specifically collimated from 0 to about 5 degrees.
- the regular and scattered transmitted light emerging from the sample is not diverted or scattered by the first and second lenses 30, 40.
- the pair of lenses 30, 40 collects substantially all of the light transmitted through the sample 16.
- the pair of lenses 30, 40 substantially collimates the collected light and illuminates a detector 50 with nearly normal incidence.
- the diverging light 42 has an angle of divergence of less than about 5°.
- a bandpass filter 52 or a plurality of bandpass filters may be placed before the detector 50.
- the bandpass filter(s) 52 typically has a center wavelength(s) of from about 400 to about 1000 nm, and a narrow bandwidth from about 5 to about 50 nm.
- the bandpass filter(s) 52 are typically used when a white light such as a halogen lamp is used as the light source 12.
- a bandpass filter may be used to modify the spectral bandwidth of an LED source 12, or filter out stray ambient light that does not contribute to the sample transmission.
- the diverging light 42 onto the bandpass filter(s) 52 is substantially collimated because light passing through the filter that is outside the filter's prescribed angle of incidence will not be within the specified bandwidth of the filter.
- the first and second lenses 30, 40 combine to improve the signal level of the light guided to the detector 50 because the lenses 30, 40 collect and guide a high percentage of the light transmitted through the sample 16 to the detector 50. Further, signal level is improved by illuminating the detector 50 with a collimated beam of light that is substantially normal to the surface of the detector. Typically, the angle of divergence of the collimated beam of light is less than about 5 degrees. A normal incidence angle to the surface of the detector 50 reduces signal loss caused by Fresnel reflection off the surface of the detector 50. A significant light loss is caused by Fresnel reflection at angles of incidence greater than about 20 degrees.
- the light 42 collected by the detector 50 is then compared to a reference measurement comprising a reading taken with no sample (air) in the optical path for determining the percent transmission of the sample and subsequent analyte concentration in the sample.
- the detector 50 and bandpass filter(s) 52 are substantially linearly aligned with the second lens 40.
- the detector 50 is a silicon detector.
- other light detectors including other types of photodetectors such as lead sulfide, for example, or charged coupled devices (CCD) may be used for detecting the transmitted light.
- the detector 50 and bandpass filter(s) 52 are not linearly aligned with the second lens 40, but rather a light guide or a optical fiber(s) (not shown) having an inlet substantially linearly aligned with the second lens 40 pipes the light to a detector/filter positioned elsewhere, or to a spectrograph.
- the spectroscopy system 10 significantly improves the signal level obtained over existing total transmission spectroscopy systems because the light is directly coupled to the detector with the first and second lenses 30, 40.
- the path length through the sample 16 is from about 40 ⁇ m to about 200 ⁇ m and the sample has a diameter of about 1 mm.
- the first lens 30 is a plastic micro half-ball lens having a diameter of about 4 mm.
- the second collection lens 40 is a plastic micro half-ball lens having a diameter of about 8 mm.
- the ratio of the diameters of the first lens and the second lens is generally from about 1:2.
- the first and second half-ball lenses 30, 40 are constructed of acrylic according to one embodiment.
- the detector 50 outputs a signal indicative of the amount of received light. According to one embodiment of the present invention, that output is monitored by a control system (not shown) of the transmission spectroscopy system 10 comprising the readhead 20 for determining when a sample has entered and filled the sample cell receiving area 18 of the readhead 20.
- the sample cell receiving area 18 may be part of a capillary channel, or is coupled to a capillary channel for filling the sample cell receiving area 18.
- the sample cell receiving area 18 is made of a substantially optically clear material according to one embodiment.
- FIG. 1b there is shown a transmission system 60 that is used for determining an analyte concentration in a fluid sample according to another embodiment.
- the transmission system 60 has many of the same components that have been described above in connection with FIG. 1a .
- the transmission system 60 includes a coupling lens 62 that collects the diverging light 42.
- the coupling lens 62 further reduces the diverging light 42 to a diverging light 64 before reaching an optical cable 66.
- the optical cable 66 pipes the diverging light to a spectrograph 68.
- the spectrograph may be replaced by a detector ( e.g. , detector 50) shown in FIG. 1a .
- a filter may be added such as ( e.g. , filter(s) 52) described above in connection with FIG. 1a .
- a control system monitors the output of the detector, which changes as the sample cell receiving area 18 fills with a body fluid (e.g. , blood).
- a timing sequence an embodiment of which is described in connection with FIG. 2a , allows sufficient time for the reaction between the reagent and the analyte in the sample to occur. This improves the overall performance of the testing because substantially precise timing may result in a faster and more reliable analyte determination.
- Underfilling occurs, for example, when too little sample is collected to react with the predetermined amount of reagent placed in the sample cell receiving area 18.
- the control system knows the subsequent output of the detector 50 may be used for determining the analyte concentration in the body fluid sample (e.g. , blood sample).
- the system 10 initiates a timing sequence at the conclusion of which the detector 50 begins to detect light transmitted through the sample for analysis.
- the transmission spectroscopy system 10 described in connection with FIG. 2a begins with monitoring the sample area to determine the correct time for initiating the transmitted-light collection by the detector 50.
- the empty sample receiving cell area 18 (FIG. la) is illuminated with light from the light source 12.
- the transmission level through the system 10 is very high (e.g. , nearly 100%).
- the sample is input to the sample cell receiving area 18.
- the reagent to be mixed with the sample has already been dried in placed in the sample cell receiving area 18.
- the reagent may be deposited with the sample or after the sample has been received in the sample cell receiving area 18.
- the system 10 monitors the sample cell receiving area 18 by measuring the light transmitted through the sample at step 126.
- the system 10 compares the amount of transmitted light measured by the detector 50 to a threshold stored in a memory of the system 10 at step 128. If the measured amount of light exceeds the threshold, the system determines that a requisite amount of sample has not been input to the sample cell receiving area at step 128, and the amount of light transmitted through the sample cell receiving area 18 is re-measured at step 126.
- the system 10 may wait a predetermined amount of time (e.g. , 5 or 10 seconds) at step 130 before taking the next measurement. If the measured amount of light is less than the threshold stored in memory, the system then may begin the analysis at step 150 ( FIG. 2b ) or step 102 ( FIG. 2c ).
- While measuring the transmitted light at step 126 has been illustrated as occurring after inputting the sample to the sample receiving area, this step may be performed in a continuous manner.
- the detector may continuously detect light transmitted through the sample cell receiving area 18 for purposes of determining when to begin the analysis set forth in FIG. 2c from the moment the system 10 has started-up to when a positive determination at step 128 occurs.
- the system 10 may generate an error signal if a positive determination has not been made after a sample is input to the sample cell receiving area at step 124 ( e.g. , too little sample input after the system 10 has been started) according to an alternative embodiment.
- the total transmission spectroscopy system is adapted to collect a substantially improved amount of transmitted light in the visible range (e.g. , from about 400 to about 700 nm) and in the near-infrared range (e.g. , from about 700 to about 1100 nm) over regular transmission systems for determining the analyte concentration in a sample.
- the transmission spectroscopy system 10 provides performance advantages over existing total transmission systems because a high percentage of the collected transmitted light illuminates the detector. This improved collection capability permits the system 10 to collect light in these two regions, which are used in correcting for the bias or interference caused by scatter due to different hematocrit levels ( FIG. 2b ) or the presence of both hemoglobin ( FIG. 2c ) and hematocrit ( FIG. 2c ) in a body fluid such as a whole blood sample.
- FIG. 2b one method of using the transmission spectroscopy system 10 to determine the analyte concentration in a body fluid (e.g., a whole blood sample) and to correct for the transmission biases caused by different hematocrit levels is shown.
- the degree of bias is a function of the hematocrit level in the whole blood sample.
- the indicator reagents are designed to produce chromatic reactions indicative of the blood sample's analyte concentration levels at visible light wavelengths less than about 750 nm according to one embodiment of the present invention.
- the hematocrit level of whole blood does affect the spectral response throughout the visible and near IR ("infrared") light regions (e.g. , 400 to 1100 nm).
- the light transmission varies with and is proportional to different hematocrit levels because of differences in the scattered light due to the number of red blood cells.
- the hematocrit transmission bias at near IR wavelengths is proportional to the hematocrit level of the blood.
- a comparison between FIGS. 3a and 3b also shows that the transmission of 20% hematocrit blood is 30%T higher than a 60% hematocrit blood sample throughout the tested range from about 500 to about 940 nm.
- the transmission measured at near-IR wavelengths is not affected by changes in glucose concentration because the indicator is designed to react and produce a chromatic response at visible wavelengths ( e.g. , about 680 nm).
- a whole blood sample reacted with reagent is illuminated with a first wavelength of light (e.g. , from about 750 to about 1100 nm) at step 150 for determining the scattered portion of the measured light due to hematocrit levels in the whole blood sample.
- the sample is illuminated with a second wavelength of light (e.g.
- the transmitted normal and scattered light is measured with the detector 50 at step 156 for determining both the scatted light due to hematocrit level and the chromatic response due to analyte concentration.
- the bias due to hematocrit-dependent scattered light is corrected for at step 158 by calculating the ratio of the transmission measurements obtained at steps 156 and 152.
- the analyte concentration level of the whole blood sample is calculated at step 160 using the corrected transmission from step 158.
- additional correction algorithms such as, for example, linear regression or polynomial-fit correction algorithms may be used to determine the relationship between the hematocrit level and the bias, or interference, caused by the hematocrit at the wavelength where the analyte reaction occurs.
- FIG. 2c a method of using the transmission spectroscopy system 10 to determine the analyte concentration in, for example, a whole blood sample and to correct for the transmission bias caused by the presence of hemoglobin is shown.
- the degree of bias is a function of the hemoglobin level in the whole blood sample and the scatter due to the presence of red blood cells.
- the reaction of the whole blood sample and the reagent is illuminated with light at first wavelength from about 400 to about 600 nm at step 102.
- the first wavelength may be about 545 nm or about 577 nm.
- the light—regular and scattered— is measured in absorbance units with the detector 50 at step 104 as is described above in connection with FIG. 1a .
- the spectra of oxy-hemoglobin shows absorbance peaks at about 545 nm and about 577 nm and is not affected by reaction at these wavelengths, because the reaction is designed to be measured at, for example, a second wavelength about 750 nm.
- the absorbance measured at the first wavelength includes the contribution of both the hemoglobin and the scatter due to hematocrit level of blood.
- the indicator reagents produce a chromatic reaction indicative of the blood sample's analyte concentration level at a second wavelength greater than about 600 nm and less than about 1000 nm (visible-near infrared).
- the whole blood sample and the reagent are illuminated with light at second wavelength at step 106.
- the bias due to the presence of the hemoglobin in the whole blood sample is corrected for at step 110 by using the measurement obtained at step 104 to correct for the bias affecting the measurement obtained at step 108.
- the method for correcting the bias depends on the correlation between the hemoglobin concentration and the bias of measurement 108 caused by hemoglobin. The correlation may be linear or non-linear depending on the chemistry formulation that is used in the reaction.
- the analyte concentration of the sample is determined in step 112 using the corrected transmission measurement from step 110.
- the method for determining the presence of an adequate sample and the start time of the reaction illustrated in FIG. 2a may also be applied to the method of FIG. 2c in another process.
- the transmission spectroscopy system 10 of the present invention is adapted to collect a substantially improved amount of transmitted light in the visible range and in the near-IR range over regular transmission systems for determining the analyte concentration in a sample.
- hematocrit level or hemoglobin may cause transmission bias at the read wavelength where a reagent indicator has a chromatic reaction.
- a transmission bias that is proportional to the hematocrit level occurring at first read wavelength e.g. , greater than 750 nm
- may be used to correct a second read wavelength e.g.
- a transmission bias that is proportional to hemoglobin occurring at a first read wavelength may be used to correct a second read wavelength (e.g. , greater than 600 nm) where the chemical indicator causes a chromatic reaction.
- one embodiment of the present invention measured the total transmission levels of whole blood samples having hematocrit levels of 20% reacted with reagents, and each had a different glucose concentration level—54, 104, 210, and 422 milligrams of glucose per deciliter of blood ("mg/dL glucose").
- the transmission spectroscopy system 10 will be referred to in the examples as the "inventive system.”
- White light from the light source 12 (FIG. la) was transmitted through the sample.
- the total transmission level measured from 500 nm to 940 nm was plotted in FIG. 3a for each of the glucose concentration levels. The transmission was lower from 500 to 600 nm due to the absorption of hemoglobin.
- Transmission loss caused by light scattered by red blood cells affects the transmission from 500 nm to 940 nm.
- the indicator in the glucose reaction absorbs between 500 and 750 nm, so there was separation between the glucose concentration levels up to about 750 nm.
- the decrease in the total transmission level was due only to light loss from the scatter by red blood cells, so there was little separation between the samples having different glucose concentration levels.
- FIG. 3b shows that the total transmission level decreases throughout the measured wavelength range from 500 nm to 940 nm when the hematocrit level of blood is increased to 60% for blood samples having similar glucose concentrations as those plotted in FIG. 3a (59, 117, 239, and 475 mg/dL glucose).
- FIG. 3b also shows separation between the glucose concentration levels from 500 to about 750 nm.
- the transmission level about 750 nm was between 70 to 80% for the blood having a hematocrit level of about 20%.
- the transmission level above 750 nm was between 40 to 50% for the blood having a hematocrit level of about 60%.
- the differences between the spectra at 20% and 60% hematocrit were proportional for wavelengths from about 600 nm to 940 nm, above the wavelengths where there is interference due to the absorption by hemoglobin.
- the 750 to 940 nm spectrum may be used to determine the level of hematocrit caused by differences in the number of red blood cells in these levels.
- the hematocrit level is not dependent on glucose concentration or hemoglobin at those wavelengths.
- the light transmission due to scattered light is used to correct for the interference due to hematocrit level before determining the glucose concentration level.
- FIGS. 4a, 4b show plots of the total transmission spectra of respective FIGS. 3a, 3b corrected for scatter by ratioing all transmission readings to the transmission at 940 nm.
- similar transmissions for similar glucose concentrations are obtained for both the 20% and 60% hematocrit blood samples in the wavelength range where the indicator reaction for the glucose assay is measured (about 660 nm to 680 nm).
- the near-IR wavelengths may be used to correct for differences due to hematocrit of the whole blood sample. The ability to correct for this interference error improves the accuracy of glucose concentration measurements.
- the total transmission response is shown for whole blood at hematocrit levels ("Hct") of 20%, 40%, and 60% in FIG. 5 , wherein the transmission (in absorbance units) for visible light having a wavelength of about 680 nm is plotted against glucose concentration level. Similar dose responses are observed at each hematocrit level, but there is a bias or interference caused by the respective hematocrit levels as shown by the separation between the three hematocrit levels plotted in FIG. 5 .
- FIG. 6 shows the same data where the bias due to different hematocrit levels is corrected by a ratio of the visible light at about 680 nm divided by the near-IR light from about 750 to about 940 nm that is transmitted through a blood sample. The correction is accomplished by dividing the transmission level of the visible light at 680 nm ( FIG. 5 ) by the transmission level of near-IR light at 940 nm for the sample as discussed above. Put simply, the hematocrit bias due to differences in scatter is "subtracted out", and FIG. 6 shows a dose response that is not affected by changes in hematocrit level.
- the inventive system was used to measure the glucose concentration of several samples of whole blood.
- Dried reagents were reconstituted with blood samples having a glucose concentration of 0, 100, and 400 mg/dL. Additionally, a 0 mg/dL blood sample with no reagent, and dried reagents reconstituted with a water sample.
- the blood sample without chemistry shows the spectral contribution of blood, while the water sample with reagent shows the spectral contribution of the reagent.
- the total absorbance levels of the reactions were recorded on a spectrograph every 5 seconds to a total test time of 60 seconds. The reaction was completed in 1 5 to 30 seconds.
- FIG. 8 the inventive system was used to measure the 680 nm light transmitted through several whole blood samples having known glucose concentrations.
- the total transmitted light (plotted in absorbance units) levels were plotted against the known glucose concentration levels of the whole blood.
- a linear regression analysis was applied to the data plotted in FIG. 8 .
- the linear correlation coefficient of 0.985 (nearly 1.000)—demonstrates that there was excellent correlation between the absorbance level and the glucose concentration using the system and method of the present invention.
- the total transmission levels for three whole blood samples having hematocrit levels of 20%, 40%, and 60%, respectively, were obtained using the inventive system.
- Light having wavelengths from about 500 to about 940 nm was transmitted through the whole blood samples.
- the pathlength of the sample receiving cell was 42 micrometers.
- the transmission levels for the three samples obtained were plotted against the wavelength of the transmitted light.
- the transmission levels for three whole blood samples having hematocrit concentration levels of 20%, 40%, and 60% are shown for both methods in FIG. 9 .
- the regular transmission system is labeled in FIG. 9 as "%Hct, regular %T”
- the total transmission system is labeled in Fig. 9 as "%Hct, Total %T”.
- Both transmission systems used in this example illuminated the three samples with substantially collimated light having the wavelengths from about 500 to about 940 nm.
- the substantially collimated light, and not the scattered light, transmitted through the samples, was collected with the regular transmission system, while both regular and scattered light is collected by the inventive system.
- the sample path length was about 42 ⁇ m.
- the regular transmission level of light for the three samples is less than 2% at wavelengths greater than 500 nm.
- the transmission levels of light collected for the three samples obtained with the inventive system were greater than 10%T at wavelengths greater than 500 nm.
- Good separation between the transmission levels for the three samples obtained with the inventive system occurred for light having wavelengths of greater than 500 nm.
- FIG. 9 also shows that, for the data obtained with the inventive system, dips occurred in the transmission levels at from about 542 to about 577 nm.
- the described embodiment of the inventive system achieved a greater amount of transmitted light from 500 to 940 nm over the existing spectroscopy system using a regular transmission system, despite the absorbance of hemoglobin or the light scattered by hematocrit at these wavelengths.
- bias caused by scatter due to imperfections in the sample cell or small amounts of debris in the sample can be corrected in a manner similar to that for different hematocrit levels, as discussed in conjunction with in FIG. 2b .
- the two read wavelengths ratio corrects for contamination on the sample cell such as fingerprints, or sample cell mold defects, or scratches in the windows. This correction significantly improves assay precision compared to using one wavelength.
- the wavelength range where a change in absorbance verses glucose concentration occurs outside the wavelength range where hemoglobin absorbs light e.g. , wavelengths greater than about 600 nm.
- Use of an indicator reagent that develops at wavelengths greater than about 600 nm may also be used so that the hemoglobin absorbance peaks and the indicator reagent would not interfere with each other.
- FIG. 9 also shows that, for the data obtained with the inventive system, dips occurred in the transmission levels at about 530 nm and about 570 nm. These two wavelengths of light correspond to the known absorbance peaks of oxy-hemoglobin.
- the absorbance reading at about 542 nm or 577 nm may be used to determine the concentration of hemoglobin after subtracting out the contribution due to scatter from the red blood cells as measured in the near-IR (from about 750 to 1100 nm). In this case, the absorbance of visible light having a wavelength of about 542 nm would not change or be dependent on glucose concentration.
Landscapes
- Physics & Mathematics (AREA)
- Spectroscopy & Molecular Physics (AREA)
- Chemical & Material Sciences (AREA)
- Health & Medical Sciences (AREA)
- General Health & Medical Sciences (AREA)
- Pathology (AREA)
- Analytical Chemistry (AREA)
- Biochemistry (AREA)
- Life Sciences & Earth Sciences (AREA)
- General Physics & Mathematics (AREA)
- Immunology (AREA)
- Toxicology (AREA)
- Engineering & Computer Science (AREA)
- Chemical Kinetics & Catalysis (AREA)
- Plasma & Fusion (AREA)
- Optics & Photonics (AREA)
- Investigating Or Analysing Materials By Optical Means (AREA)
- Investigating Or Analysing Biological Materials (AREA)
- Optical Measuring Cells (AREA)
Claims (28)
- Gesamttransmissionsspektroskopiesystem (10) zur Verwendung bei der Bestimmung der Konzentration eines Analyten in einer Flüssigkeitsprobe (16), wobei das System Folgendes umfasst:einen Probenzellenaufnahmebereich (18) zum Aufnehmen einer zu analysierenden Probe (16), wobei der Probenzellenaufnahmebereich (18) aus einem im Wesentlichen optisch klaren Material konstruiert ist;eine Lichtquelle (12);eine kollimierende Linse (22), die ausgelegt ist zum Empfangen von Licht von der Lichtquelle (12) und ausgelegt zum Beleuchten des Probenzellenaufnahmebereichs (18) mit einem im Wesentlichen kollimierten Lichtstrahl (14); undeinen Detektor (50);dadurch gekennzeichnet, dass das System (10) weiterhin Folgendes umfasst:eine erste Linse (30), die ausgelegt ist zum Empfangen von regelmäßigem und gestreutem, durch die Probe (16) mit einem ersten Divergenzwinkel übertragenem Licht, wobei die erste Linse (30) Licht mit einem ersten Messwinkel empfängt, wobei die erste Linse (30) Licht (32) mit einem zweiten Divergenzwinkel ausgibt, wobei der zweite Divergenzwinkel kleiner ist als der erste Divergenzwinkel; undeine zweite Linse (40), die ausgelegt ist zum Empfangen von Licht (32) von der ersten Linse (30) und ausgelegt zum Ausgeben eines im Wesentlichen kollimierten Lichtstrahls (42);wobei der Probenzellenaufnahmebereich (18) zwischen der kollimierenden Linse (22) und der ersten Linse (30) angeordnet ist;wobei der Detektor (50) ausgelegt ist zum Messen des von der zweiten Linse (40) ausgegebenen Lichts (42) undwobei jede der ersten und zweiten Linse (30, 40) eine Halbkugellinse ist.
- System (10) nach Anspruch 1, wobei die Flüssigkeitsprobe (16) Blut ist und wobei der Probenzellenaufnahmebereich (18) ein trockenes Reagens enthält, das bei Abwesenheit eines Hämolysierungsmittels ausgelegt ist zum Erzeugen einer chromatischen Reaktion bei Rekonstituierung mit Blut.
- System (10) nach Anspruch 1, wobei die erste Linse (30) einen ersten Messwinkel von 0 bis etwa 90 Grad aufweist.
- System (10) nach Anspruch 1, wobei die erste Linse (30) einen ersten Messwinkel größer als 70 Grad aufweist.
- System (10) nach Anspruch 1, wobei der zweite Divergenzwinkel der ersten Linse zwischen etwa 15 und etwa 40 Grad liegt.
- System (10) nach Anspruch 1, wobei das Verhältnis der Durchmesser der ersten Linse (30) zu der zweiten Linse (40) ab etwa 1:2 beträgt.
- System (10) nach Anspruch 1, wobei die Lichtquelle (12) Licht mit einer Wellenlänge von etwa 500 bis etwa 940 nm ausgibt.
- System (10) nach Anspruch 1, wobei die Lichtquelle (12) eine Leuchtdiode umfasst.
- System (10) nach Anspruch 1, wobei die Lichtquelle (12) monochromatisches Licht ausgibt.
- System (10) nach Anspruch 1, wobei die Lichtquelle (12) weißes Licht ausgibt.
- System (10) nach Anspruch 1, wobei der Detektor (50) einen Siliziumdetektor umfasst.
- System (10) nach Anspruch 1, wobei die Flüssigkeit Blut ist.
- System (10) nach Anspruch 1, wobei der Analyt Glucose ist.
- System (10) nach Anspruch 1, wobei die erste Linse (30) im Wesentlichen das gesamte regelmäßige und gestreute, durch die Probe (16) übertragenes Licht empfängt.
- System (10) nach Anspruch 1, weiterhin umfassend einen Filter (52), der ausgelegt ist zum Auswählen einer spezifischen Wellenlänge von der Lichtquelle (12).
- System (10) nach Anspruch 1, weiterhin umfassend eine Koppellinse (62) und ein faseroptisches Kabel (66) zum Leiten von Licht von der zweiten Linse (40) zu dem Detektor (50).
- System (10) nach Anspruch 1, wobei der von der zweiten Linse (40) ausgegebene, im Wesentlichen kollimierte Lichtstrahl (42) einen Divergenzwinkel von unter etwa 5 Grad aufweist.
- Verfahren zur Verwendung bei der Bestimmung der Analytkonzentration in einer Flüssigkeitsprobe mit einem Gesamttransmissionsspektroskopiesystem (10), wobei das Verfahren die folgenden Handlungen umfasst:Empfangen einer zu analysierenden Probe (16) in einem Probenzellenaufnahmebereich (18) des Gesamttransmissionsspektroskopiesystems (10);Ausgeben eines Lichtstrahls über eine Lichtquelle (12);im Wesentlichen kollimieren des von der Lichtquelle (12) ausgegebenen Lichtstrahls durch eine kollimierende Linse (22);Beleuchten der Probe (16) mit dem von der Lichtquelle (12) über die kollimierende Linse (22) ausgegebenen, im Wesentlichen kollimierten Lichtstrahl (14);Sammeln von durch die Probe (16) übertragenem regelmäßigem und gestreutem Licht mit einer ersten Linse;Reduzieren des Divergenzwinkels des übertragenen Lichts mit der ersten Linse (30);Empfangen des Lichts mit einem reduzierten Divergenzwinkel mit einer zweiten Linse (40);im Wesentlichen kollimieren des empfangenen Lichts (32) mit der zweiten Linse (40); undMessen des im Wesentlichen kollimierten Lichts von der zweiten Linse (40) mit einem Detektor (50),wobei der Probenzellenaufnahmebereich (18) zwischen der kollimierenden Linse (22) und der ersten Linse (30) angeordnet ist,wobei jede der ersten und zweiten Linse (30, 40) eine Halbkugellinse ist.
- Verfahren nach Anspruch 18, wobei der reduzierte Divergenzwinkel mit der ersten Linse (30) zwischen etwa 15 und etwa 40 Grad beträgt.
- Verfahren nach Anspruch 18, wobei das empfangene Licht mit der zweiten Linse (40) den Divergenzwinkel des von der zweiten Linse (40) divergierenden Lichts auf weniger als etwa 5 Grad reduziert.
- Verfahren nach Anspruch 18, wobei die Lichtquelle (12) Licht mit einer Wellenlänge von etwa 500 bis etwa 940 nm ausgibt.
- Verfahren nach Anspruch 18, wobei die Lichtquelle (12) einen monochromatischen Lichtstrahl ausgibt.
- Verfahren nach Anspruch 18, wobei die Lichtquelle (12) weißes Licht ist.
- Verfahren nach Anspruch 18, weiterhin umfassend das Überwachen des Detektors (50) zum Bestimmen, wann der Probenzellenaufnahmebereich (18) eine vorbestimmte Menge an zu analysierender Probe empfangen hat.
- Verfahren nach Anspruch 24, weiterhin umfassend das Bestimmen der Analytkonzentration in der Flüssigkeitsprobe (16) nach dem Bestimmen, dass der Probenzellenaufnahmebereich (18) eine vorbestimmte Menge an zu analysierender Probe empfangen hat.
- Verfahren nach Anspruch 18, wobei das Sammeln von normalem und gestreutem Licht das Sammeln von im Wesentlichen des ganzen, durch die Probe übertragenen normalen und gestreuten Lichts umfasst.
- Verfahren nach Anspruch 18, weiterhin umfassend das Überwachen des Detektors, der ausgelegt ist zu bestimmen, wann der Probenzellenaufnahmebereich eine vorbestimmte Menge an zu analysierender Probe empfangen hat.
- Verfahren nach Anspruch 18, weiterhin umfassend das Bestimmen der Analytkonzentration in der Flüssigkeitsprobe nach dem Bestimmen, dass der Probenzellenaufnahmebereich eine vorbestimmte Menge an zu analysierender Probe empfangen hat.
Priority Applications (2)
| Application Number | Priority Date | Filing Date | Title |
|---|---|---|---|
| EP08020417.5A EP2063252B1 (de) | 2004-12-13 | 2005-12-12 | Transmissionsspektroskopiesystem zur Verwendung bei der Bestimmung von Analyten in Körperflüssigkeit |
| EP16163267.4A EP3062086A1 (de) | 2004-12-13 | 2005-12-12 | Transmissionsspektroskopiesystem zur verwendung bei der bestimmung von analyten in körperflüssigkeit |
Applications Claiming Priority (2)
| Application Number | Priority Date | Filing Date | Title |
|---|---|---|---|
| US63566604P | 2004-12-13 | 2004-12-13 | |
| PCT/US2005/045233 WO2006065898A1 (en) | 2004-12-13 | 2005-12-12 | Transmission spectroscopy system for use in the determination of analytes in body fluid |
Related Child Applications (3)
| Application Number | Title | Priority Date | Filing Date |
|---|---|---|---|
| EP16163267.4A Division EP3062086A1 (de) | 2004-12-13 | 2005-12-12 | Transmissionsspektroskopiesystem zur verwendung bei der bestimmung von analyten in körperflüssigkeit |
| EP08020417.5A Division EP2063252B1 (de) | 2004-12-13 | 2005-12-12 | Transmissionsspektroskopiesystem zur Verwendung bei der Bestimmung von Analyten in Körperflüssigkeit |
| EP08020417.5 Division-Into | 2008-11-25 |
Publications (2)
| Publication Number | Publication Date |
|---|---|
| EP1875203A1 EP1875203A1 (de) | 2008-01-09 |
| EP1875203B1 true EP1875203B1 (de) | 2011-05-04 |
Family
ID=36072209
Family Applications (3)
| Application Number | Title | Priority Date | Filing Date |
|---|---|---|---|
| EP16163267.4A Withdrawn EP3062086A1 (de) | 2004-12-13 | 2005-12-12 | Transmissionsspektroskopiesystem zur verwendung bei der bestimmung von analyten in körperflüssigkeit |
| EP08020417.5A Not-in-force EP2063252B1 (de) | 2004-12-13 | 2005-12-12 | Transmissionsspektroskopiesystem zur Verwendung bei der Bestimmung von Analyten in Körperflüssigkeit |
| EP05854031A Not-in-force EP1875203B1 (de) | 2004-12-13 | 2005-12-12 | Transmissionspektroskopiesystem zur verwendung bei der bestimmung von analyten in körperflüssigkeit |
Family Applications Before (2)
| Application Number | Title | Priority Date | Filing Date |
|---|---|---|---|
| EP16163267.4A Withdrawn EP3062086A1 (de) | 2004-12-13 | 2005-12-12 | Transmissionsspektroskopiesystem zur verwendung bei der bestimmung von analyten in körperflüssigkeit |
| EP08020417.5A Not-in-force EP2063252B1 (de) | 2004-12-13 | 2005-12-12 | Transmissionsspektroskopiesystem zur Verwendung bei der Bestimmung von Analyten in Körperflüssigkeit |
Country Status (13)
| Country | Link |
|---|---|
| US (3) | US7787109B2 (de) |
| EP (3) | EP3062086A1 (de) |
| JP (1) | JP2008523413A (de) |
| CN (1) | CN101088003A (de) |
| AT (1) | ATE508357T1 (de) |
| BR (1) | BRPI0518556A2 (de) |
| CA (2) | CA2589996C (de) |
| DE (1) | DE602005027907D1 (de) |
| MX (1) | MX2007006957A (de) |
| NO (1) | NO20073565L (de) |
| RU (1) | RU2400733C2 (de) |
| TW (1) | TW200634297A (de) |
| WO (1) | WO2006065898A1 (de) |
Cited By (1)
| Publication number | Priority date | Publication date | Assignee | Title |
|---|---|---|---|---|
| EP3220131A1 (de) * | 2016-03-17 | 2017-09-20 | Commissariat À L'Énergie Atomique Et Aux Énergies Alternatives | Verfahren zur charakterisierung einer flüssigen probe, die partikel enthält |
Families Citing this family (52)
| Publication number | Priority date | Publication date | Assignee | Title |
|---|---|---|---|---|
| US7776608B2 (en) | 2001-07-09 | 2010-08-17 | Bayer Healthcare Llc | Volume meter testing device and method of use |
| US7004928B2 (en) | 2002-02-08 | 2006-02-28 | Rosedale Medical, Inc. | Autonomous, ambulatory analyte monitor or drug delivery device |
| US20060281187A1 (en) | 2005-06-13 | 2006-12-14 | Rosedale Medical, Inc. | Analyte detection devices and methods with hematocrit/volume correction and feedback control |
| EP3461406A1 (de) | 2005-09-30 | 2019-04-03 | Intuity Medical, Inc. | Kassette zur entnahme und analyse von körperflüssigkeiten mit mehreren stellen |
| US8801631B2 (en) | 2005-09-30 | 2014-08-12 | Intuity Medical, Inc. | Devices and methods for facilitating fluid transport |
| JP5427362B2 (ja) * | 2008-03-25 | 2014-02-26 | テルモ株式会社 | ヘマトクリット値または血液成分濃度の測定方法および測定装置 |
| EP2293719B1 (de) | 2008-05-30 | 2015-09-09 | Intuity Medical, Inc. | Schnittstelle zwischen einer Vorrichtung zur entnahme von Körperflüssigkeitsproben und der Entnahmestelle |
| EP2299903B1 (de) | 2008-06-06 | 2021-01-27 | Intuity Medical, Inc. | Nachweismesser und betriebsmodus |
| CA2726071C (en) | 2008-06-06 | 2024-01-02 | Intuity Medical, Inc. | Blood glucose monitoring device |
| EP2199791B1 (de) * | 2008-12-19 | 2019-05-01 | F. Hoffmann-La Roche AG | Verfahren zum Bestimmen der Hämolyse einer Blutprobe sowie Vorrichtung |
| CN102369420B (zh) * | 2009-01-21 | 2015-04-15 | 莱尔照明公司 | 使用多个离散光源的拉曼光谱设备、系统和方法 |
| SG175120A1 (en) | 2009-04-07 | 2011-11-28 | Rare Light Inc | Peri-critical reflection spectroscopy devices, systems, and methods |
| WO2011065981A1 (en) | 2009-11-30 | 2011-06-03 | Intuity Medical, Inc. | Calibration material delivery devices and methods |
| CA2803797A1 (en) | 2010-06-25 | 2011-12-29 | Intuity Medical, Inc. | Analyte monitoring methods and systems |
| EP2596332B1 (de) * | 2010-07-21 | 2019-08-28 | F.Hoffmann-La Roche Ag | Erhöhung des verwendbaren dynamikbereichs in der fotometrie |
| EP2466292B1 (de) * | 2010-10-29 | 2017-12-13 | F. Hoffmann-La Roche AG | System zur Durchführung von Streuungs- und Absorptionsassays |
| US9522396B2 (en) | 2010-12-29 | 2016-12-20 | S.D. Sight Diagnostics Ltd. | Apparatus and method for automatic detection of pathogens |
| AU2012207090B2 (en) * | 2011-01-21 | 2015-04-23 | Labrador Diagnostics Llc | Systems and methods for sample use maximization |
| CA2843945C (en) | 2011-08-03 | 2022-06-21 | Intuity Medical, Inc. | Devices and methods for body fluid sampling and analysis |
| DE102011116367A1 (de) * | 2011-10-19 | 2013-04-25 | Bluepoint Medical Gmbh & Co. Kg | Vorrichtung zur hoch aufgelösten Bestimmung der Konzentration von Substanzen in fluiden Medien |
| US10640807B2 (en) | 2011-12-29 | 2020-05-05 | S.D. Sight Diagnostics Ltd | Methods and systems for detecting a pathogen in a biological sample |
| JP5901012B2 (ja) * | 2012-02-13 | 2016-04-06 | 国立大学法人 東京医科歯科大学 | 血液情報の測定方法及び装置 |
| EP2999988A4 (de) | 2013-05-23 | 2017-01-11 | S.D. Sight Diagnostics Ltd. | Verfahren und system zur bildgebung einer zellprobe |
| CA2912283A1 (en) | 2013-06-21 | 2014-12-21 | Intuity Medical, Inc. | Analyte monitoring system with audible feedback |
| IL227276A0 (en) | 2013-07-01 | 2014-03-06 | Parasight Ltd | A method and system for obtaining a monolayer of cells, for use specifically for diagnosis |
| WO2015009970A1 (en) | 2013-07-18 | 2015-01-22 | Erythron Llc | Spectroscopic measurements with parallel array detector |
| CN105659151B (zh) | 2013-08-26 | 2018-06-29 | 思迪赛特诊断有限公司 | 数码显微系统与方法 |
| BR112016009958B1 (pt) | 2013-11-06 | 2021-08-03 | Becton, Dickinson And Company | Dispositivo microfluídico, método, sistema e kit |
| EP3074754A4 (de) * | 2013-11-13 | 2017-07-26 | Becton, Dickinson and Company | Mikrobildgeberanalysesystem mit optik und verfahren zur verwendung davon |
| EP3111216A4 (de) | 2014-02-28 | 2017-11-22 | Nueon, Inc. | Verfahren und vorrichtung zur bestimmung von gesundheitsmarkern durch die analyse von blut |
| US10482595B2 (en) | 2014-08-27 | 2019-11-19 | S.D. Sight Diagnostics Ltd. | System and method for calculating focus variation for a digital microscope |
| JP2018500539A (ja) | 2014-10-24 | 2018-01-11 | モナシュ ユニバーシティ | 血液中の病原体の検出のための方法およびシステム |
| WO2016168090A1 (en) | 2015-04-14 | 2016-10-20 | Nueon, Inc. | Method and apparatus for determining markers of health by analysis of blood |
| FR3038723B1 (fr) | 2015-07-07 | 2019-06-14 | Commissariat A L'energie Atomique Et Aux Energies Alternatives | Procede d’estimation d’une quantite d’analyte dans un liquide |
| EP3859425B1 (de) | 2015-09-17 | 2024-04-17 | S.D. Sight Diagnostics Ltd. | Verfahren und vorrichtung zur detektion einer entität in einer körperprobe |
| JP6757400B2 (ja) * | 2016-03-08 | 2020-09-16 | テルモ株式会社 | 成分測定装置、成分測定方法及び成分測定プログラム |
| WO2017165403A1 (en) | 2016-03-21 | 2017-09-28 | Nueon Inc. | Porous mesh spectrometry methods and apparatus |
| WO2017168411A1 (en) | 2016-03-30 | 2017-10-05 | S.D. Sight Diagnostics Ltd | Image processing device for identifying blood parasites |
| US11099175B2 (en) | 2016-05-11 | 2021-08-24 | S.D. Sight Diagnostics Ltd. | Performing optical measurements on a sample |
| WO2017195205A1 (en) | 2016-05-11 | 2017-11-16 | S.D. Sight Diagnostics Ltd | Sample carrier for optical measurements |
| WO2018085699A1 (en) | 2016-11-04 | 2018-05-11 | Nueon Inc. | Combination blood lancet and analyzer |
| RU177649U1 (ru) * | 2017-08-07 | 2018-03-05 | федеральное государственное бюджетное образовательное учреждение высшего образования "Омский государственный медицинский университет" Министерства здравоохранения Российской Федерации (ФГБОУ ВО ОмГМУ Минздрава России) | Универсальное устройство для сбора секрета больших слюнных желез |
| CN107714049A (zh) * | 2017-09-08 | 2018-02-23 | 上海乐糖信息科技有限公司 | 基于多信息融合的无创血糖检测方法、系统以及装置 |
| US11921272B2 (en) | 2017-11-14 | 2024-03-05 | S.D. Sight Diagnostics Ltd. | Sample carrier for optical measurements |
| US11656173B2 (en) * | 2018-03-16 | 2023-05-23 | Keio University | Infrared analysis system, infrared analysis chip, and infrared imaging device |
| EP3611494A1 (de) * | 2018-08-17 | 2020-02-19 | Koninklijke Philips N.V. | System und verfahren zur bereitstellung eines hinweises auf die zahnfleischgesundheit eines menschen |
| CN109060788A (zh) * | 2018-09-04 | 2018-12-21 | 华南师范大学 | 一种通过光强检测液体含糖量的方法及装置与应用 |
| CN109540844B (zh) * | 2018-11-06 | 2021-03-16 | 中国计量科学研究院 | 一种液体散射测量装置及其测量方法 |
| US10746652B1 (en) * | 2019-04-03 | 2020-08-18 | Redeye Inc. | Hemoglobin sensor and detecting method thereof |
| TWI717117B (zh) | 2019-11-22 | 2021-01-21 | 財團法人工業技術研究院 | 殘留毒物檢測裝置 |
| CN113866108B (zh) * | 2020-06-30 | 2022-09-23 | 华为技术有限公司 | 成分含量测量装置和终端设备 |
| CN113252580A (zh) * | 2021-05-11 | 2021-08-13 | 山东大学 | 原料血浆光谱采集系统 |
Citations (1)
| Publication number | Priority date | Publication date | Assignee | Title |
|---|---|---|---|---|
| US5602647A (en) * | 1993-07-14 | 1997-02-11 | Kyoto Daiichi Kagaku Co., Ltd. | Apparatus and method for optically measuring concentrations of components |
Family Cites Families (26)
| Publication number | Priority date | Publication date | Assignee | Title |
|---|---|---|---|---|
| DE3318505C2 (de) | 1982-10-23 | 1985-07-11 | Wilhelm Geiger GmbH & Co, 8980 Oberstdorf | Verfahren zum Verfüllen von unterhalb der Erdoberfläche befindlichen Hohlräumen, wie nicht mehr benötigten Lagerbehältern od.dgl. |
| ATE42673T1 (de) | 1984-05-04 | 1989-05-15 | Kurashiki Boseki Kk | Spektrophotometrisches geraet zur unblutigen bestimmung von glukose in lebendem gewebe. |
| US4747687A (en) * | 1984-06-08 | 1988-05-31 | Milton Roy Company | Ball cell windows for spectrophotometers |
| JPS61290342A (ja) * | 1985-06-14 | 1986-12-20 | バリアン・アソシエイツ・インコ−ポレイテツド | 液体クロマトグラフイ溶離剤吸光度検知器 |
| US4935346A (en) * | 1986-08-13 | 1990-06-19 | Lifescan, Inc. | Minimum procedure system for the determination of analytes |
| AU3375789A (en) * | 1988-04-28 | 1989-11-02 | Lifescan, Inc. | Determination of glucose in whole blood |
| US5037199A (en) * | 1989-02-22 | 1991-08-06 | Linear Instruments Corporation | Ball lens micro-cell |
| SE466157B (sv) | 1989-04-25 | 1992-01-07 | Migrata Uk Ltd | Saett att bestaemma glukoshalten hos helblod samt engaangskuvett foer detta |
| DK0429907T3 (da) | 1989-11-21 | 1994-10-03 | Bayer Ag | Optisk biosensor |
| US5054878A (en) | 1990-06-04 | 1991-10-08 | Conoco Inc. | Device for source compensating a fiber optic coupler output |
| US5701181A (en) | 1995-05-12 | 1997-12-23 | Bayer Corporation | Fiber optic diffuse light reflectance sensor utilized in the detection of occult blood |
| US5611999A (en) | 1995-09-05 | 1997-03-18 | Bayer Corporation | Diffused light reflectance readhead |
| US5518689A (en) | 1995-09-05 | 1996-05-21 | Bayer Corporation | Diffused light reflectance readhead |
| US5926271A (en) * | 1995-12-20 | 1999-07-20 | Zeta Technology | Laser-induced fluorescence detector having a capillary detection cell and method for identifying trace compounds implemented by the same device |
| US6015969A (en) | 1996-09-16 | 2000-01-18 | The Regents Of The University Of California | Multiple-wavelength spectroscopic quantitation of light-absorbing species in scattering media |
| US6121050A (en) * | 1997-08-29 | 2000-09-19 | Han; Chi-Neng Arthur | Analyte detection systems |
| US6591125B1 (en) * | 2000-06-27 | 2003-07-08 | Therasense, Inc. | Small volume in vitro analyte sensor with diffusible or non-leachable redox mediator |
| JP2000262298A (ja) * | 1999-03-15 | 2000-09-26 | Fuji Photo Film Co Ltd | 全血中のグルコース濃度もしくはコレステロール濃度の定量方法 |
| EP1060768A3 (de) * | 1999-05-05 | 2003-01-08 | Hans Peter Kneubühler | Tragevorrichtung für Roll- und Schlittschuhe |
| US6184990B1 (en) | 1999-12-22 | 2001-02-06 | Beckman Coulter, Inc. | Miniature multiple wavelength excitation and emission optical system and method for laser-induced fluorescence detectors in capillary electrophoresis |
| US6690467B1 (en) * | 2000-05-05 | 2004-02-10 | Pe Corporation | Optical system and method for optically analyzing light from a sample |
| DE10033457A1 (de) | 2000-07-10 | 2002-01-24 | Bayer Ag | Transmissionsspektroskopische Vorrichtung für Behälter |
| US6744502B2 (en) | 2001-09-28 | 2004-06-01 | Pe Corporation (Ny) | Shaped illumination geometry and intensity using a diffractive optical element |
| US6775001B2 (en) * | 2002-02-28 | 2004-08-10 | Lambda Control, Inc. | Laser-based spectrometer for use with pulsed and unstable wavelength laser sources |
| US7154592B2 (en) * | 2003-02-11 | 2006-12-26 | Bayer Healthcare Llc. | Multiwavelength readhead for use in the determination of analytes in body fluids |
| US7183552B2 (en) * | 2003-03-07 | 2007-02-27 | Ric Investments, Llc | Optical system for a gas measurement system |
-
2005
- 2005-12-12 WO PCT/US2005/045233 patent/WO2006065898A1/en active Application Filing
- 2005-12-12 US US11/791,556 patent/US7787109B2/en not_active Expired - Fee Related
- 2005-12-12 BR BRPI0518556-4A patent/BRPI0518556A2/pt not_active IP Right Cessation
- 2005-12-12 EP EP16163267.4A patent/EP3062086A1/de not_active Withdrawn
- 2005-12-12 DE DE602005027907T patent/DE602005027907D1/de active Active
- 2005-12-12 EP EP08020417.5A patent/EP2063252B1/de not_active Not-in-force
- 2005-12-12 AT AT05854031T patent/ATE508357T1/de not_active IP Right Cessation
- 2005-12-12 CA CA2589996A patent/CA2589996C/en not_active Expired - Fee Related
- 2005-12-12 MX MX2007006957A patent/MX2007006957A/es not_active Application Discontinuation
- 2005-12-12 RU RU2007126679/28A patent/RU2400733C2/ru not_active IP Right Cessation
- 2005-12-12 CA CA2761260A patent/CA2761260C/en not_active Expired - Fee Related
- 2005-12-12 CN CNA2005800427612A patent/CN101088003A/zh active Pending
- 2005-12-12 JP JP2007546855A patent/JP2008523413A/ja active Pending
- 2005-12-12 EP EP05854031A patent/EP1875203B1/de not_active Not-in-force
- 2005-12-13 TW TW094143961A patent/TW200634297A/zh unknown
-
2007
- 2007-07-10 NO NO20073565A patent/NO20073565L/no not_active Application Discontinuation
-
2010
- 2010-07-12 US US12/834,639 patent/US7869009B2/en not_active Expired - Fee Related
-
2011
- 2011-01-10 US US12/987,516 patent/US8184273B2/en active Active
Patent Citations (1)
| Publication number | Priority date | Publication date | Assignee | Title |
|---|---|---|---|---|
| US5602647A (en) * | 1993-07-14 | 1997-02-11 | Kyoto Daiichi Kagaku Co., Ltd. | Apparatus and method for optically measuring concentrations of components |
Cited By (3)
| Publication number | Priority date | Publication date | Assignee | Title |
|---|---|---|---|---|
| EP3220131A1 (de) * | 2016-03-17 | 2017-09-20 | Commissariat À L'Énergie Atomique Et Aux Énergies Alternatives | Verfahren zur charakterisierung einer flüssigen probe, die partikel enthält |
| FR3049062A1 (fr) * | 2016-03-17 | 2017-09-22 | Commissariat Energie Atomique | Procede de caracterisation d’un echantillon liquide comportant des particules |
| US9921147B2 (en) | 2016-03-17 | 2018-03-20 | Commissariat A L'energie Atomique Et Aux Energies Alternatives | Method for characterizing a liquid sample containing particles |
Also Published As
| Publication number | Publication date |
|---|---|
| CN101088003A (zh) | 2007-12-12 |
| CA2761260C (en) | 2014-12-02 |
| JP2008523413A (ja) | 2008-07-03 |
| US20110102768A1 (en) | 2011-05-05 |
| US7787109B2 (en) | 2010-08-31 |
| US7869009B2 (en) | 2011-01-11 |
| EP2063252A1 (de) | 2009-05-27 |
| US8184273B2 (en) | 2012-05-22 |
| US20100279326A1 (en) | 2010-11-04 |
| DE602005027907D1 (de) | 2011-06-16 |
| US20080198360A1 (en) | 2008-08-21 |
| ATE508357T1 (de) | 2011-05-15 |
| MX2007006957A (es) | 2007-08-21 |
| BRPI0518556A2 (pt) | 2008-11-25 |
| TW200634297A (en) | 2006-10-01 |
| NO20073565L (no) | 2007-07-10 |
| EP1875203A1 (de) | 2008-01-09 |
| CA2761260A1 (en) | 2006-06-22 |
| RU2400733C2 (ru) | 2010-09-27 |
| CA2589996A1 (en) | 2006-06-22 |
| CA2589996C (en) | 2012-02-21 |
| WO2006065898A1 (en) | 2006-06-22 |
| EP2063252B1 (de) | 2016-06-22 |
| RU2007126679A (ru) | 2009-01-20 |
| EP3062086A1 (de) | 2016-08-31 |
Similar Documents
| Publication | Publication Date | Title |
|---|---|---|
| EP1875203B1 (de) | Transmissionspektroskopiesystem zur verwendung bei der bestimmung von analyten in körperflüssigkeit | |
| US6582964B1 (en) | Method and apparatus for rapid measurement of HbA1c | |
| US6426045B1 (en) | Reagentless analysis of biological samples | |
| US5478750A (en) | Methods for photometric analysis | |
| TWI375025B (en) | System and method for measuring analyte concentration of a chemical or biological substance | |
| DK1447658T3 (en) | Multi-wavelength reading head for use in the determination of analytes in body fluids | |
| US4882492A (en) | Non-invasive near infrared measurement of blood analyte concentrations | |
| EP0967954B1 (de) | VORRICHTUNG zur Bestimmung VON STÖRENDEN SUBSTANZEN im PLASMA | |
| JP2916637B2 (ja) | 拡散分光反射率の測定装置 | |
| US20070190637A1 (en) | Apparatus for handling fluids | |
| CA2323442C (en) | Method and apparatus for measuring proteins | |
| US20020110487A1 (en) | Apparatus and method for handling fluids | |
| EP4325204A1 (de) | System, analysator und verfahren zur pflegeortprüfung |
Legal Events
| Date | Code | Title | Description |
|---|---|---|---|
| PUAI | Public reference made under article 153(3) epc to a published international application that has entered the european phase |
Free format text: ORIGINAL CODE: 0009012 |
|
| 17P | Request for examination filed |
Effective date: 20071120 |
|
| AK | Designated contracting states |
Kind code of ref document: A1 Designated state(s): AT BE BG CH CY CZ DE DK EE ES FI FR GB GR HU IE IS IT LI LT LU LV MC NL PL PT RO SE SI SK TR |
|
| 17Q | First examination report despatched |
Effective date: 20080206 |
|
| DAX | Request for extension of the european patent (deleted) | ||
| GRAP | Despatch of communication of intention to grant a patent |
Free format text: ORIGINAL CODE: EPIDOSNIGR1 |
|
| GRAS | Grant fee paid |
Free format text: ORIGINAL CODE: EPIDOSNIGR3 |
|
| GRAA | (expected) grant |
Free format text: ORIGINAL CODE: 0009210 |
|
| AK | Designated contracting states |
Kind code of ref document: B1 Designated state(s): AT BE BG CH CY CZ DE DK EE ES FI FR GB GR HU IE IS IT LI LT LU LV MC NL PL PT RO SE SI SK TR |
|
| REG | Reference to a national code |
Ref country code: GB Ref legal event code: FG4D |
|
| REG | Reference to a national code |
Ref country code: CH Ref legal event code: EP |
|
| REG | Reference to a national code |
Ref country code: IE Ref legal event code: FG4D |
|
| REF | Corresponds to: |
Ref document number: 602005027907 Country of ref document: DE Date of ref document: 20110616 Kind code of ref document: P |
|
| REG | Reference to a national code |
Ref country code: DE Ref legal event code: R096 Ref document number: 602005027907 Country of ref document: DE Effective date: 20110616 |
|
| REG | Reference to a national code |
Ref country code: NL Ref legal event code: VDEP Effective date: 20110504 |
|
| PG25 | Lapsed in a contracting state [announced via postgrant information from national office to epo] |
Ref country code: PT Free format text: LAPSE BECAUSE OF FAILURE TO SUBMIT A TRANSLATION OF THE DESCRIPTION OR TO PAY THE FEE WITHIN THE PRESCRIBED TIME-LIMIT Effective date: 20110905 Ref country code: SE Free format text: LAPSE BECAUSE OF FAILURE TO SUBMIT A TRANSLATION OF THE DESCRIPTION OR TO PAY THE FEE WITHIN THE PRESCRIBED TIME-LIMIT Effective date: 20110504 Ref country code: LT Free format text: LAPSE BECAUSE OF FAILURE TO SUBMIT A TRANSLATION OF THE DESCRIPTION OR TO PAY THE FEE WITHIN THE PRESCRIBED TIME-LIMIT Effective date: 20110504 |
|
| PG25 | Lapsed in a contracting state [announced via postgrant information from national office to epo] |
Ref country code: AT Free format text: LAPSE BECAUSE OF FAILURE TO SUBMIT A TRANSLATION OF THE DESCRIPTION OR TO PAY THE FEE WITHIN THE PRESCRIBED TIME-LIMIT Effective date: 20110504 Ref country code: CY Free format text: LAPSE BECAUSE OF FAILURE TO SUBMIT A TRANSLATION OF THE DESCRIPTION OR TO PAY THE FEE WITHIN THE PRESCRIBED TIME-LIMIT Effective date: 20110504 Ref country code: ES Free format text: LAPSE BECAUSE OF FAILURE TO SUBMIT A TRANSLATION OF THE DESCRIPTION OR TO PAY THE FEE WITHIN THE PRESCRIBED TIME-LIMIT Effective date: 20110815 Ref country code: FI Free format text: LAPSE BECAUSE OF FAILURE TO SUBMIT A TRANSLATION OF THE DESCRIPTION OR TO PAY THE FEE WITHIN THE PRESCRIBED TIME-LIMIT Effective date: 20110504 Ref country code: IS Free format text: LAPSE BECAUSE OF FAILURE TO SUBMIT A TRANSLATION OF THE DESCRIPTION OR TO PAY THE FEE WITHIN THE PRESCRIBED TIME-LIMIT Effective date: 20110904 Ref country code: LV Free format text: LAPSE BECAUSE OF FAILURE TO SUBMIT A TRANSLATION OF THE DESCRIPTION OR TO PAY THE FEE WITHIN THE PRESCRIBED TIME-LIMIT Effective date: 20110504 Ref country code: SI Free format text: LAPSE BECAUSE OF FAILURE TO SUBMIT A TRANSLATION OF THE DESCRIPTION OR TO PAY THE FEE WITHIN THE PRESCRIBED TIME-LIMIT Effective date: 20110504 Ref country code: GR Free format text: LAPSE BECAUSE OF FAILURE TO SUBMIT A TRANSLATION OF THE DESCRIPTION OR TO PAY THE FEE WITHIN THE PRESCRIBED TIME-LIMIT Effective date: 20110805 Ref country code: BE Free format text: LAPSE BECAUSE OF FAILURE TO SUBMIT A TRANSLATION OF THE DESCRIPTION OR TO PAY THE FEE WITHIN THE PRESCRIBED TIME-LIMIT Effective date: 20110504 |
|
| PG25 | Lapsed in a contracting state [announced via postgrant information from national office to epo] |
Ref country code: NL Free format text: LAPSE BECAUSE OF FAILURE TO SUBMIT A TRANSLATION OF THE DESCRIPTION OR TO PAY THE FEE WITHIN THE PRESCRIBED TIME-LIMIT Effective date: 20110504 |
|
| PG25 | Lapsed in a contracting state [announced via postgrant information from national office to epo] |
Ref country code: EE Free format text: LAPSE BECAUSE OF FAILURE TO SUBMIT A TRANSLATION OF THE DESCRIPTION OR TO PAY THE FEE WITHIN THE PRESCRIBED TIME-LIMIT Effective date: 20110504 Ref country code: CZ Free format text: LAPSE BECAUSE OF FAILURE TO SUBMIT A TRANSLATION OF THE DESCRIPTION OR TO PAY THE FEE WITHIN THE PRESCRIBED TIME-LIMIT Effective date: 20110504 |
|
| PG25 | Lapsed in a contracting state [announced via postgrant information from national office to epo] |
Ref country code: DK Free format text: LAPSE BECAUSE OF FAILURE TO SUBMIT A TRANSLATION OF THE DESCRIPTION OR TO PAY THE FEE WITHIN THE PRESCRIBED TIME-LIMIT Effective date: 20110504 Ref country code: PL Free format text: LAPSE BECAUSE OF FAILURE TO SUBMIT A TRANSLATION OF THE DESCRIPTION OR TO PAY THE FEE WITHIN THE PRESCRIBED TIME-LIMIT Effective date: 20110504 Ref country code: RO Free format text: LAPSE BECAUSE OF FAILURE TO SUBMIT A TRANSLATION OF THE DESCRIPTION OR TO PAY THE FEE WITHIN THE PRESCRIBED TIME-LIMIT Effective date: 20110504 Ref country code: SK Free format text: LAPSE BECAUSE OF FAILURE TO SUBMIT A TRANSLATION OF THE DESCRIPTION OR TO PAY THE FEE WITHIN THE PRESCRIBED TIME-LIMIT Effective date: 20110504 |
|
| PLBE | No opposition filed within time limit |
Free format text: ORIGINAL CODE: 0009261 |
|
| STAA | Information on the status of an ep patent application or granted ep patent |
Free format text: STATUS: NO OPPOSITION FILED WITHIN TIME LIMIT |
|
| 26N | No opposition filed |
Effective date: 20120207 |
|
| PG25 | Lapsed in a contracting state [announced via postgrant information from national office to epo] |
Ref country code: IT Free format text: LAPSE BECAUSE OF FAILURE TO SUBMIT A TRANSLATION OF THE DESCRIPTION OR TO PAY THE FEE WITHIN THE PRESCRIBED TIME-LIMIT Effective date: 20110504 |
|
| REG | Reference to a national code |
Ref country code: DE Ref legal event code: R097 Ref document number: 602005027907 Country of ref document: DE Effective date: 20120207 |
|
| PG25 | Lapsed in a contracting state [announced via postgrant information from national office to epo] |
Ref country code: MC Free format text: LAPSE BECAUSE OF NON-PAYMENT OF DUE FEES Effective date: 20111231 |
|
| REG | Reference to a national code |
Ref country code: CH Ref legal event code: PL |
|
| GBPC | Gb: european patent ceased through non-payment of renewal fee |
Effective date: 20111212 |
|
| REG | Reference to a national code |
Ref country code: FR Ref legal event code: ST Effective date: 20120831 |
|
| REG | Reference to a national code |
Ref country code: IE Ref legal event code: MM4A |
|
| PG25 | Lapsed in a contracting state [announced via postgrant information from national office to epo] |
Ref country code: GB Free format text: LAPSE BECAUSE OF NON-PAYMENT OF DUE FEES Effective date: 20111212 Ref country code: IE Free format text: LAPSE BECAUSE OF NON-PAYMENT OF DUE FEES Effective date: 20111212 Ref country code: LI Free format text: LAPSE BECAUSE OF NON-PAYMENT OF DUE FEES Effective date: 20111231 Ref country code: CH Free format text: LAPSE BECAUSE OF NON-PAYMENT OF DUE FEES Effective date: 20111231 |
|
| PG25 | Lapsed in a contracting state [announced via postgrant information from national office to epo] |
Ref country code: FR Free format text: LAPSE BECAUSE OF NON-PAYMENT OF DUE FEES Effective date: 20120102 |
|
| PG25 | Lapsed in a contracting state [announced via postgrant information from national office to epo] |
Ref country code: LU Free format text: LAPSE BECAUSE OF NON-PAYMENT OF DUE FEES Effective date: 20111212 |
|
| PG25 | Lapsed in a contracting state [announced via postgrant information from national office to epo] |
Ref country code: BG Free format text: LAPSE BECAUSE OF FAILURE TO SUBMIT A TRANSLATION OF THE DESCRIPTION OR TO PAY THE FEE WITHIN THE PRESCRIBED TIME-LIMIT Effective date: 20110804 |
|
| PG25 | Lapsed in a contracting state [announced via postgrant information from national office to epo] |
Ref country code: TR Free format text: LAPSE BECAUSE OF FAILURE TO SUBMIT A TRANSLATION OF THE DESCRIPTION OR TO PAY THE FEE WITHIN THE PRESCRIBED TIME-LIMIT Effective date: 20110504 |
|
| PG25 | Lapsed in a contracting state [announced via postgrant information from national office to epo] |
Ref country code: HU Free format text: LAPSE BECAUSE OF FAILURE TO SUBMIT A TRANSLATION OF THE DESCRIPTION OR TO PAY THE FEE WITHIN THE PRESCRIBED TIME-LIMIT Effective date: 20110504 |
|
| PGFP | Annual fee paid to national office [announced via postgrant information from national office to epo] |
Ref country code: DE Payment date: 20201229 Year of fee payment: 16 |
|
| REG | Reference to a national code |
Ref country code: DE Ref legal event code: R119 Ref document number: 602005027907 Country of ref document: DE |
|
| PG25 | Lapsed in a contracting state [announced via postgrant information from national office to epo] |
Ref country code: DE Free format text: LAPSE BECAUSE OF NON-PAYMENT OF DUE FEES Effective date: 20220701 |
|
| P01 | Opt-out of the competence of the unified patent court (upc) registered |
Effective date: 20230526 |