EP1560366B1 - Détection d'erreur et diagnostic - Google Patents
Détection d'erreur et diagnostic Download PDFInfo
- Publication number
- EP1560366B1 EP1560366B1 EP05100630A EP05100630A EP1560366B1 EP 1560366 B1 EP1560366 B1 EP 1560366B1 EP 05100630 A EP05100630 A EP 05100630A EP 05100630 A EP05100630 A EP 05100630A EP 1560366 B1 EP1560366 B1 EP 1560366B1
- Authority
- EP
- European Patent Office
- Prior art keywords
- network
- fault
- simulation
- node
- performance
- Prior art date
- Legal status (The legal status is an assumption and is not a legal conclusion. Google has not performed a legal analysis and makes no representation as to the accuracy of the status listed.)
- Expired - Lifetime
Links
- 238000003745 diagnosis Methods 0.000 title claims description 35
- 238000001514 detection method Methods 0.000 title claims description 11
- 238000004088 simulation Methods 0.000 claims abstract description 130
- 238000000034 method Methods 0.000 claims abstract description 69
- 230000009471 action Effects 0.000 claims description 27
- 238000004891 communication Methods 0.000 claims description 19
- 235000008694 Humulus lupulus Nutrition 0.000 claims description 3
- 238000007670 refining Methods 0.000 claims description 3
- 238000013024 troubleshooting Methods 0.000 abstract description 23
- 238000004458 analytical method Methods 0.000 description 53
- 239000003795 chemical substances by application Substances 0.000 description 36
- 238000012986 modification Methods 0.000 description 27
- 230000004048 modification Effects 0.000 description 27
- 230000006399 behavior Effects 0.000 description 24
- 230000003993 interaction Effects 0.000 description 18
- 238000007726 management method Methods 0.000 description 17
- 230000000875 corresponding effect Effects 0.000 description 14
- 230000008859 change Effects 0.000 description 12
- 238000012544 monitoring process Methods 0.000 description 11
- 238000012774 diagnostic algorithm Methods 0.000 description 10
- 238000013459 approach Methods 0.000 description 9
- 238000004140 cleaning Methods 0.000 description 8
- 230000000694 effects Effects 0.000 description 8
- 230000006870 function Effects 0.000 description 7
- 238000003066 decision tree Methods 0.000 description 6
- 238000012545 processing Methods 0.000 description 6
- 230000008901 benefit Effects 0.000 description 5
- 230000005540 biological transmission Effects 0.000 description 5
- 238000010586 diagram Methods 0.000 description 5
- 238000002347 injection Methods 0.000 description 5
- 239000007924 injection Substances 0.000 description 5
- 238000013480 data collection Methods 0.000 description 4
- 238000005516 engineering process Methods 0.000 description 4
- 239000000203 mixture Substances 0.000 description 4
- 239000000654 additive Substances 0.000 description 3
- 230000000996 additive effect Effects 0.000 description 3
- 230000007613 environmental effect Effects 0.000 description 3
- 238000005259 measurement Methods 0.000 description 3
- 230000008569 process Effects 0.000 description 3
- 238000010845 search algorithm Methods 0.000 description 3
- 238000012360 testing method Methods 0.000 description 3
- 238000012935 Averaging Methods 0.000 description 2
- 238000013461 design Methods 0.000 description 2
- 230000036541 health Effects 0.000 description 2
- 208000013409 limited attention Diseases 0.000 description 2
- 230000007246 mechanism Effects 0.000 description 2
- 230000006855 networking Effects 0.000 description 2
- 238000011160 research Methods 0.000 description 2
- 230000003044 adaptive effect Effects 0.000 description 1
- 230000009286 beneficial effect Effects 0.000 description 1
- 230000015556 catabolic process Effects 0.000 description 1
- 230000006835 compression Effects 0.000 description 1
- 238000007906 compression Methods 0.000 description 1
- 239000012141 concentrate Substances 0.000 description 1
- 230000001276 controlling effect Effects 0.000 description 1
- 230000008878 coupling Effects 0.000 description 1
- 238000010168 coupling process Methods 0.000 description 1
- 238000005859 coupling reaction Methods 0.000 description 1
- 238000006731 degradation reaction Methods 0.000 description 1
- 238000012631 diagnostic technique Methods 0.000 description 1
- 238000002474 experimental method Methods 0.000 description 1
- 230000006872 improvement Effects 0.000 description 1
- 239000004615 ingredient Substances 0.000 description 1
- 238000011835 investigation Methods 0.000 description 1
- 230000002045 lasting effect Effects 0.000 description 1
- 230000005923 long-lasting effect Effects 0.000 description 1
- 239000000463 material Substances 0.000 description 1
- 230000003287 optical effect Effects 0.000 description 1
- 230000010355 oscillation Effects 0.000 description 1
- 230000000644 propagated effect Effects 0.000 description 1
- 230000009467 reduction Effects 0.000 description 1
- 230000008439 repair process Effects 0.000 description 1
- 239000004065 semiconductor Substances 0.000 description 1
- 230000001360 synchronised effect Effects 0.000 description 1
- 230000009897 systematic effect Effects 0.000 description 1
Images


Classifications
-
- H—ELECTRICITY
- H04—ELECTRIC COMMUNICATION TECHNIQUE
- H04L—TRANSMISSION OF DIGITAL INFORMATION, e.g. TELEGRAPHIC COMMUNICATION
- H04L41/00—Arrangements for maintenance, administration or management of data switching networks, e.g. of packet switching networks
- H04L41/06—Management of faults, events, alarms or notifications
- H04L41/0695—Management of faults, events, alarms or notifications the faulty arrangement being the maintenance, administration or management system
-
- H—ELECTRICITY
- H04—ELECTRIC COMMUNICATION TECHNIQUE
- H04L—TRANSMISSION OF DIGITAL INFORMATION, e.g. TELEGRAPHIC COMMUNICATION
- H04L41/00—Arrangements for maintenance, administration or management of data switching networks, e.g. of packet switching networks
- H04L41/14—Network analysis or design
- H04L41/145—Network analysis or design involving simulating, designing, planning or modelling of a network
-
- G—PHYSICS
- G05—CONTROLLING; REGULATING
- G05B—CONTROL OR REGULATING SYSTEMS IN GENERAL; FUNCTIONAL ELEMENTS OF SUCH SYSTEMS; MONITORING OR TESTING ARRANGEMENTS FOR SUCH SYSTEMS OR ELEMENTS
- G05B23/00—Testing or monitoring of control systems or parts thereof
- G05B23/02—Electric testing or monitoring
- G05B23/0205—Electric testing or monitoring by means of a monitoring system capable of detecting and responding to faults
- G05B23/0218—Electric testing or monitoring by means of a monitoring system capable of detecting and responding to faults characterised by the fault detection method dealing with either existing or incipient faults
- G05B23/0256—Electric testing or monitoring by means of a monitoring system capable of detecting and responding to faults characterised by the fault detection method dealing with either existing or incipient faults injecting test signals and analyzing monitored process response, e.g. injecting the test signal while interrupting the normal operation of the monitored system; superimposing the test signal onto a control signal during normal operation of the monitored system
-
- H—ELECTRICITY
- H04—ELECTRIC COMMUNICATION TECHNIQUE
- H04L—TRANSMISSION OF DIGITAL INFORMATION, e.g. TELEGRAPHIC COMMUNICATION
- H04L43/00—Arrangements for monitoring or testing data switching networks
- H04L43/08—Monitoring or testing based on specific metrics, e.g. QoS, energy consumption or environmental parameters
-
- H—ELECTRICITY
- H04—ELECTRIC COMMUNICATION TECHNIQUE
- H04L—TRANSMISSION OF DIGITAL INFORMATION, e.g. TELEGRAPHIC COMMUNICATION
- H04L41/00—Arrangements for maintenance, administration or management of data switching networks, e.g. of packet switching networks
- H04L41/12—Discovery or management of network topologies
-
- H—ELECTRICITY
- H04—ELECTRIC COMMUNICATION TECHNIQUE
- H04L—TRANSMISSION OF DIGITAL INFORMATION, e.g. TELEGRAPHIC COMMUNICATION
- H04L41/00—Arrangements for maintenance, administration or management of data switching networks, e.g. of packet switching networks
- H04L41/14—Network analysis or design
- H04L41/142—Network analysis or design using statistical or mathematical methods
-
- H—ELECTRICITY
- H04—ELECTRIC COMMUNICATION TECHNIQUE
- H04L—TRANSMISSION OF DIGITAL INFORMATION, e.g. TELEGRAPHIC COMMUNICATION
- H04L43/00—Arrangements for monitoring or testing data switching networks
- H04L43/08—Monitoring or testing based on specific metrics, e.g. QoS, energy consumption or environmental parameters
- H04L43/0823—Errors, e.g. transmission errors
- H04L43/0829—Packet loss
Definitions
- the present invention generally relates to wired and wireless networks, and more particularly relates to a network troubleshooting framework for detection and diagnosis of faults in a network.
- Troubleshooting a network is an aspect of network management that is responsible for maintaining the "health" of the network and for ensuring its smooth and continued operation. Troubleshooting a network, whether wired or wireless, is complicated by interactions encountered among different network entities, among different faults, and so on.
- Troubleshooting a multi-hop wireless network is further complicated by a variety of additional factors.
- typical multi-hop wireless networks are generally prone to link errors caused by signal propagation fluctuations.
- the signal propagation fluctuations may be caused by a variety of factors, such as fluctuating environmental conditions. These fluctuations result in a network topology that is dynamic and unpredictable.
- Node mobility further aggravates these factors, as nodes may be positioned in a variety of locations while connected to the network, thereby increasing the dynamic and unpredictable nature of the network.
- the capacity of multi-hop wireless networks is generally limited due to scarcity of resources (e.g., bandwidth, battery power, and so on), which constrains the amount of management traffic overhead that the network can tolerate.
- a wireless network may be vulnerable to link attacks from malicious parties. The attackers, for example, can inject false information to disrupt or interfere with the network management effort.
- a network troubleshooting framework may employ a simulation of a real network to detect and diagnose faults in the operation of the real network.
- a network simulation may be driven by data that describes the operation of the real network.
- raw data that is collected for use in driving the network simulation may contain errors for a variety of reasons, such as due to hardware, software, and/or network errors.
- the raw data may be cleaned.
- each node in a network may provide data for use in driving the network simulation.
- the data provided by a particular node may describe not only that particular node's operation, but also the operation of one or more neighboring nodes. Therefore, the data obtained from the nodes in the network may be redundant.
- the redundant data is then compared, one to another, to identify any inconsistencies, which may then be rectified in a variety of ways, such as through data averaging, removal of inconsistent data, and so on.
- the network simulation may then estimate network performance based on this data.
- the estimated network performance is compared with observed network performance of the real network performance to detect if the real network is performing as expected. If not, a fault is detected in the operation of the real network.
- a difference between the estimated network performance as indicated by the network simulation and the observed network performance as indicated by the real network may be utilized to detect the occurrence of faults in the real network.
- the network simulation may then be utilized for fault diagnosis by selectively injecting one or more faults into the network simulation until network performance of the network simulation approximates the network performance of the real network.
- one or more modifications may be identified and implemented to correct the faults.
- the network simulation may then be utilized to perform what-if analysis such that modifications may be made to the simulated network to test whether the modification corrects the fault and/or otherwise improves network performance.
- the network simulation may provide quantitative feedback on the network performance impact of a variety of modifications that may be made to the network, such as modifications made to correct the faults and/or improve network performance.
- US-A-5 922 051 discloses a computer network having a plurality of nodes associated therewith, a data traffic management system for managing data traffic among the plurality of nodes, comprising 1) a polling circuit that retrieves node traffic information from the plurality of nodes; and 2) process logic that compares first selected node traffic information associated with a first selected one of the plurality of nodes with a first threshold level to detect a trend in the first selected node traffic information with respect to the first threshold level.
- a system for supporting network troubleshooting including: storage means for periodically storing setting/configuration data and performance data of devices constituting the network based upon a schema of device IDs, interface IDs, and a respective CONFIG version number; monitoring means for monitoring the performance data of the devices by comparing the performance data with respective threshold values; identifying means for identifying the faulty device based upon the schema, when the performance data of at least one device goes beyond a respective threshold value, wherein the storage means further stores the identified result for network troubleshooting.
- the system can estimate a factor of a change of operating condition of the network system and repair accordingly.
- a method is known to simulate a network carrying a heterogeneous mix of traffic in order to assess the performance of the network.
- Parameters and information are provided to define the configuration of the network and define how resources in the network are shared between types of traffic for a simulation run.
- sets of parameters define characteristics for individual types of traffic.
- the individual types of traffic are generated with the defined characteristics using one or more models.
- the individual types of traffic are then aggregated to generate a joint, heterogeneous mix of traffic. As the mix of traffic is generated, resources in the network are allocated.
- Statistics are then collected for each simulation run to indicate the performance of the simulated network when loaded with the heterogeneous mix of traffic.
- FIG. 1 is an illustration of an environment in an exemplary implementation showing a network having a plurality of nodes.
- FIG. 2 is an illustration of an exemplary implementation showing an analysis module of FIG. 1 in greater detail.
- FIG. 3 is an illustration of a network having a seven-by-three grid topology.
- FIG. 4 is an illustration of an exemplary implementation showing a system that includes a simulator and a network simulation of FIG. 2.
- FIG. 5 is a flow chart depicting a procedure in an exemplary implementation in which faults having the same type, one to another, are initially diagnosed.
- FIG. 6 is an illustration of a decision tree in an exemplary implementation which may be utilized to determine a type of fault based on a difference between estimated and observed performance.
- FIG. 7 is a flow chart depicting a procedure in an exemplary implementation in which faults having different types, one to another, are diagnosed using an iterative diagnostic algorithm.
- FIG. 8 is an illustration of a network in an exemplary implementation in which the plurality of nodes of FIG. 1 includes agent modules that are executable to perform neighbor monitoring.
- FIG. 9 is a flow diagram depicting a procedure in an exemplary implementation in which reports which describe neighboring nodes are compared to locate misbehaving nodes in a network.
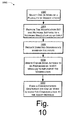
- FIG. 10 is flow chart depicting a procedure in an exemplary implementation in which what-if analysis is performed based on an online trace-driven simulation.
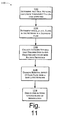
- FIG. 11 is a flow diagram depicting a procedure in an exemplary implementation in which modifications to a network are derived based on a diagnosis of a damaging flow.
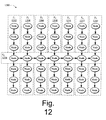
- FIG. 12 is an illustration of a network that includes a plurality of flows, one of which being a damaging flow.
- FIG. 13 is an illustration in an exemplary implementation showing a graphical user interface (GUI) provided by a manager node which allows a network administrator to visualize a network and issue management requests to the network.
- GUI graphical user interface
- a network troubleshooting framework is described for use in wired and/or wireless networks to maintain efficient and reliable network operations.
- the framework described herein may employ an online trace-driven network simulation to detect faults and perform root cause analysis of the faults.
- the network simulation is "online” in that it may obtain network performance data from a "real” network.
- the framework may be applied to diagnose a wide variety of performance problems (i.e., faults), such as faults caused by packet dropping, link congestion, medium access control (MAC) misbehavior, external noise, and so on.
- faults i.e., faults caused by packet dropping, link congestion, medium access control (MAC) misbehavior, external noise, and so on.
- the framework may also be used to evaluate alternative network configurations to improve network performance.
- MAC medium access control
- the framework may also be employed in wired networks.
- network management has received limited attention by both industry and research communities.
- Implementation of network management may involve continual monitoring of the functioning of the network, collection of information about the nodes and links in the network, removal of inconsistencies and noise from the reported data, analysis of the data, and performance of appropriate actions to improve network reliability and performance.
- Troubleshooting a network is an aspect of network management that is responsible for maintaining the "health" of the network and for ensuring its smooth and continued operation. Troubleshooting a network, whether wired or wireless, may be complicated by a variety of interactions, such as interactions encountered between different network entities, interactions between faults, and so on. Troubleshooting a multi-hop wireless network is further complicated by a variety of additional factors. For instance, typical multi-hop wireless networks are generally prone to link errors caused by signal propagation fluctuations, which result in a network topology that is dynamic and unpredictable. Additionally, the capacity of multi-hop wireless networks is generally limited due to scarcity of resources (e.g., bandwidth, battery power, and so on), which also constrains the amount of management traffic overhead that the network can tolerate.
- resources e.g., bandwidth, battery power, and so on
- the framework may utilize an online trace-driven simulation to detect faults and perform root cause analysis.
- the simulation may be utilized to reproduce events that took place in the network which resulted in a fault, and therefore identify and rectify these faults.
- FIG. 1 is an illustration of an environment in an exemplary implementation showing a network 100 having a plurality of nodes 102(1), 102(2), 102(3), ..., 102(n), ..., 102(N).
- the plurality of nodes 102(1)-102(N) of FIG. 1 implements an exemplary framework that utilizes a simulation of the network 100 for fault detection, diagnosis, and what-if analysis.
- This framework has a variety of beneficial properties.
- the framework is flexible. Since a simulation is highly customizable and can be applied to a large class of networks implemented in different environments, fault diagnosis built on top of the simulator may be configured to inherit this flexibility.
- Second, a simulation enables a variety of complicated interactions to be captured.
- the framework through use of the simulation, provides for systematic diagnosis of a wide range of faults, including combinations thereof.
- the framework is extensible in that the ability to detect new faults can be built into the framework by modeling the faults in the simulation independent of the other faults in the system. Interaction between the new faults and preexisting faults that are modeled in the framework is captured implicitly through execution of the simulation.
- reproduction of the network inside a simulator facilitates what-if analysis, which provides quantitative feedback on the performance impact of modifications that may be made to the network. For example, corrective actions may be taken to correct a fault in the operation of a network, a modification may be made to increase performance of a network, and so on.
- the framework may utilize one or more of a variety of existing network simulators to simulate the network 100, such as QUALNET (QUALNET is a trademark of Scalable Network Technologies, Inc. of Los Angeles, CA), OPNET MODELER (OPNET MODELER is a trademark of OPNET Technologies, Inc. of Washington D.C.), and so on.
- QUALNET QUALNET is a trademark of Scalable Network Technologies, Inc. of Los Angeles, CA
- OPNET MODELER OPNET MODELER is a trademark of OPNET Technologies, Inc. of Washington D.C.
- the traces that are provided to the simulators are obtained from the network being diagnosed, i.e., a "real" network. Use of traces from the real network removes the dependency of the framework on generic theoretical models that may not capture the nuances of the hardware, software, and environment of the particular network in question, thereby improving the accuracy of the framework.
- the framework may also employ a fault diagnosis scheme to perform root cause analysis.
- the scheme may utilize estimated network performance data emitted by the online trace-driven simulator as the baseline for expected performance of the real network. Deviation from the expected performance is then utilized to indicate a potential fault.
- the scheme may selectively inject a set of candidate faults into a simulator to perform root-cause analysis by reducing fault diagnosis to a problem of searching a set of faults. A root cause may therefore be identified based on the faults that, when injected, cause the simulation to approximate the observed performance of the real network. Therefore, the framework may employ a search algorithm to detect and diagnose faults such as packet dropping, link congestion, external noise sources, MAC misbehavior, and so on. These faults may have relatively long lasting impact on performance, and are more difficult to detect than fail-stop errors, such as when a node turns itself off due to power or battery outage.
- the framework may utilize a simulation as an analytical tool for troubleshooting and testing of alternative and potentially performance-enhancing configurations in a network.
- network traces are identified which, when provided to a simulator, provide a network simulation that gives an accurate depiction of actual network behavior.
- a technique is also described that reduces or eliminates erroneous data from the trace, further discussion of which may be found in relation to FIGS. 8 and 9. Consequently, the simulator is supplied with high-quality data.
- a search algorithm is described which is effective for diagnosing multiple faults in the network, further discussion of which may be found in relation to FIG. 7.
- the simulator can also be used to carry out what-if analysis and quantify the performance benefit of possible actions on the current network, further discussion of which may be found in relation to FIGS. 10-13.
- the troubleshooting framework may be employed in a wide variety of network configurations.
- One such example is illustrated by the network 100 of FIG. 1, which is depicted as a wireless mesh network.
- a mesh network can employ a variety of arrangements, such as full mesh topology or a partial mesh topology.
- full mesh topology each node is directly connected to each other node in the network.
- partial mesh topology each node is connected to at least one other node, but not necessarily to each other node in the network.
- a mesh network may be utilized as an enabling technology for neighbors to collaboratively form a self-managed community wireless mesh network.
- Each neighbor may provide one or more of the plurality of nodes 102(1)-102(N) of the network 100.
- neighbors can, for example, share an Internet gateway 104 in a cost-effective way.
- nodes of the mesh network may be mobile, such as through use of mobile computing devices having wireless communication capabilities, such as personal digital assistants (PDA), tablet personal computers (PCs), laptop computers, and so on.
- PDA personal digital assistants
- PCs tablet personal computers
- laptop computers and so on.
- each of the nodes has a processor, memory, and a network connection device, an example of which is shown by node 102(n) as including a processor 106(n), memory 108(n), and a network connection device 110(n).
- processors e.g., processors 106(n), 106(N)
- processors are not limited by the materials from which they are formed or the processing mechanisms employed therein.
- processors may be comprised of semiconductor(s) and/or transistors (e.g., electronic integrated circuits (ICs)).
- processor-executable instructions may be electronically-executable instructions.
- the mechanisms of or for processors, and thus of or for a node may include, but are not limited to, quantum computing, optical computing, mechanical computing (e.g., using nanotechnology), and so forth.
- Memory includes computer storage media in the form of volatile and/or nonvolatile memory such as read only memory (ROM), random access memory (RAM), and so on. Memory may also include other removable/non-removable, volatile/nonvolatile computer storage media. Memory provides storage of computer-readable instructions, data structures, software components, and other data for nodes.
- the network connection devices may assume a variety of configurations for communicatively coupling the nodes to the network 100.
- the node 102(n) When used in a local area network (LAN) environment, for instance, the node 102(n) is communicatively connected to the LAN through a network interface or adapter, which may be wired and/or wireless.
- the network connection device When used in a wide area network (WAN) environment, the network connection device may be configured as a modem or other means for establishing communications, such as a wired connection over a digital subscriber line (DSL), a wireless connection provided with a satellite, and so on.
- DSL digital subscriber line
- Logical connections are depicted in FIG. 1 through the use of arrows.
- the network 100 shown in FIG. 1 is a wireless mesh network, a variety of other networks may be employed, such as the Internet, intranets, and so on.
- Nodes 102(n), 102(N) illustrate an exemplary management architecture composed of software modules.
- any of the functions described herein can be implemented using software, firmware (e.g., fixed logic circuitry), manual processing, or a combination of these implementations.
- the terms "module,” “functionality,” and “logic” as used herein generally represents software, firmware, or a combination of software and firmware.
- the module, functionality, or logic represents program code that performs specified tasks when executed on a processor, such as one or more central processing units (CPUs).
- CPUs central processing units
- the program code can be stored in one or more computer readable memory devices.
- An agent module 112(n) is provided for execution on each node 102(n) of the network 100.
- the agent module 112(n) is illustrated as being executed on the processor 106(n) and is storable in memory 108(n).
- the agent module 112(n) includes a data collection module 114(n) (hereinafter “collection module”) that, when executed, may gather data from various protocol layers and/or from the network connection device 110(n). In the illustrated network 100 of FIG. 1, the agent module 112(n) then reports this data to the node 102(N) having management functionality, which hereinafter will be referenced as a manager node.
- the manager node 102(N) performs an analysis of the data (e.g., through implementation of a simulation that accepts the data as an input) and takes appropriate actions for troubleshooting the network.
- Management of the network can be centralized by placing the manager on a single node as illustrated in the network 100 of FIG. 1, or distributed such that a plurality of the nodes of a network each include management functionality.
- the manager node 102(N) includes a manager module 116(N) that is storable in the memory 108(N) and executable on the processor 106(N) to process the data from the agents 112(n), 112(N) for troubleshooting the network 100.
- the manager module 116(N) for instance, includes a network simulator 118(N) (hereinafter, "simulator") that is executable on the processor 106(N) and storable in the memory 108(N) to simulate the network 100.
- the manager node 102(N) includes a data cleaning module 120(N) (hereinafter “cleaning module”) that is executable on the processor 106(N) to resolve such inconsistencies. Cleansed data output from cleaning module 120(N) is then provided for processing by a root cause analysis module 122(N) (hereinafter “analysis module”), further discussion of which may be found in relation to the following figure.
- cleaning module data cleaning module 120(N)
- analysis module root cause analysis module
- manager node 102(N) is illustrated as including the agent module 112(N) and the manager module 116(N), in another implementation the manager node 102(N) is a dedicated manager node in that it does not include the agent module 112(N). Also, as previously described, the functionality of the manager module 116(N) may be provided by more than one node in the network 100.
- FIG. 2 is an illustration of an exemplary implementation 200 showing the analysis module 122(N) of FIG. 1 in greater detail.
- the analysis module 122(N) utilizes an online trace-driven simulation to determine root causes of discrepancies from expected network performance as indicated by the simulated network perform.
- expected network performance and simulated network performance are utilized interchangeably to indicate network performance as provided by a network simulation.
- the analysis module 122(N) may utilize cleansed data 202 obtained from a trace utility, examples of such data are illustrated in FIG. 2 as link received signal strength (RSS) 204, link location 206, and routing update 208, to drive online simulations and establish the expected performance under the given network configuration and traffic patterns.
- RSS link received signal strength
- the analysis module 122(N) is illustrated as including a network simulation 210 that is provided through execution of the simulator 118(N).
- the network simulation 210 may be provided by execution of one or more software modules that provide simulations of characteristics of a network, examples of which are illustrated in FIG. 2 by an interference injection module 212, a traffic simulator module 214, and a topology change module 216.
- the interference injection module 212 is executable to simulate external noise sources by injecting the effect of external noise on the network simulation 210.
- the traffic simulator module 214 is executable to ensure that traffic of the network simulation 210 approximates that of the real network.
- the topology change module 216 is executable to simulate changes to the topology, such as by adding and/or removing nodes in the network simulation 210.
- the analysis module 122(N) detects faults in the network 100 of FIG. 1 by comparing the expected performance as indicated by the network simulation 210 with the observed performance. When discrepancies are observed, the analysis module 122(N) determines the root cause for the discrepancies by searching for one or more faults stored in a faults directory 218 that result in the best match between the simulated and observed network performance.
- the analysis module 122(N) may receive observed data 220 from one or more of the agent modules 112(n) of FIG. 1 which describes a loss rate, throughput, and noise 220, which is illustrated in FIG. 2 as "loss rate, throughput, and noise 220".
- the network simulation 210 computes expected data 222 that describes an expected loss rate, an expected throughput, and expected noise, which is illustrated in FIG. 2 as "expected loss rate, throughput, and noise 222".
- the observed data 220 is communicated through a delay 224 to a comparator 226 such that the comparator 226 receives the observed and expected data 220, 222 simultaneously.
- the comparator 226 determines whether the observed data 220 exceeds the expected data 222. If so, the comparator 226 outputs an error message 228 for communication to the network administrator and communicates the error to the faults directory 218 to determine a root cause of the error.
- the analysis module 122(N) may simulate one or more alternative actions for rectifying the fault.
- the alternative actions may be simulated under the current traffic pattern and network topology as provided by the traffic simulator 214 and topology change module 216, respectively.
- the analysis module 122(N) may suggest one or more appropriate actions to alleviate the faults and enhance overall performance of the network, an example of which is illustrated as link node fault 230 of FIG. 2.
- the network administrator can be notified if the software or hardware are suspected as faulty, the topology can be changed via transmission-power adjustment if poor connectivity is detected, the routers can employ rate limitations to alleviate congestion, and so on.
- the network simulation 210 can provide increased insight into the behavior of the network over traditional heuristic or theoretical techniques.
- An operational wireless network for example, is a complex system having intricate pieces, such as traffic flows, networking protocols, signal processing algorithms, hardware, radio frequency (RF) propagation and so on. Additionally, interactions may occur between all of the pieces of the network. Interactions between faults may be effectively diagnosed and addressed through selection of one or more faults from the faults directory 218 that result in a network simulation 210 that corresponds to the actual behavior of the "real" network.
- network behavior may be governed by node interactions, one to another, as well as by external noise sources positioned in the vicinity of the nodes.
- Traditional heuristic or theoretical techniques do not capture the behavior of such networks and do not adequately address interactions between the different components of the network.
- each of the flows 302-310 has a similar amount of traffic to communicate.
- each of the flows 302-310 may receive substantially similar amounts of data from respective applications.
- adjacent nodes can "hear" one another and the interference range is twice the communication range.
- traffic between nodes G and U 320, 322 interferes with the traffic between nodes E and S 324, 326.
- traffic between G and U 320, 322 and traffic between nodes A and O 312, 314 do not interfere with traffic between nodes D and R 328, 330.
- the following table describes an example of throughput of the flows 302-310 when each flow sends constant bit rate (CBR) traffic at a rate of eleven Mbps.
- flow F 3 306 receives a higher throughput than the flows F 2 304 and F 4 308. In other words, flow F 3 306 consumes a higher portion of the bandwidth than the other flows of the network 300.
- flow F 3 306 receives an unduly larger share of the bandwidth.
- the manager node 102(N) may conclude that this is normal behavior.
- the network simulation may take link quality into account and therefore determine that flows F 1 302 and F 5 310 interfere with flows F 2 304 and F 4 308. Therefore, flow F 3 306 is provided with additional bandwidth because of the lack of interference from flows F 1 302 and F 5 310, as opposed to flows F 2 304 and F 4 308. In this way, the simulation can determine that even though all the flows may have the same application-level sending rate, the observed throughput is expected.
- a simple heuristic may come to an erroneous conclusion that nodes D and R 328, 330 are misbehaving.
- the network simulation is utilized by the analysis module 122(N) to manage the network by knowing "what to expect” from the network given the current traffic flows and link qualities. In other words, the analysis module 122(N) can comment on what constitutes normal behavior based on estimations provided by the network simulation. In the previous example, even though F 3 306 utilizes a greater share of the bandwidth of the network 300 than other flows in the network 300, this will not be flagged as a fault by the manager module because this behavior is expected. When the observed behavior deviates from the expected behavior, the manager module can invoke the fault search algorithms that utilize the faults directory 218 of FIG. 2 to determine the root cause of the deviation.
- a simulator is highly customizable and may be applied, with appropriate parameter settings, to a large class of networks that are configured for use in different environments. Fault diagnosis built on top of such a simulator inherits this generality.
- Yet another advantage of simulation-based approach is the ability to perform what-if analysis. That is, by modifying the settings or performing certain actions in the simulator, a simulator can predict performance for an imaginary scenario. Based on this data, a manager module can instruct the agent modules (e.g., agent module 112(n) of FIG. 1) to take an appropriate action to optimize the performance of the network.
- agent modules e.g., agent module 112(n) of FIG. 1
- transmitter power may be increased to improve link quality, but the increase may also create additional interference that affects other nodes in the network.
- a simulation-based diagnostic approach is described which provides for creation of an environment inside a simulator (e.g., network simulation 210) that approximates the functionality of a real network.
- the created environment i.e., the network simulation
- the manager module is executed to search over a fault space to determine which fault or set of faults can reproduce network performance which approximates the network performance that is observed in the real network.
- the simulated network may reproduce a variety of network aspects, such as network topology, routing behavior, traffic patterns observed in the real network, and so on.
- a diagnostic algorithm which is executable to find root-causes for faults.
- the diagnostic algorithm may first estimate performance of the network under a given set of faults. Then, based on differences between the estimated and observed performance, the diagnostic algorithm searches a fault space to reproduce any observed discrepancies.
- the diagnostic algorithm can diagnose multiple faults of the same type (e.g., network topology), as well as diagnose the presence of multiple types of faults (e.g., noise and topology).
- Faults may be diagnosed even when the trace data used to drive the simulation contains errors.
- data provided by the agent module 112(n) of FIG. 1 may contain errors due to a variety of reasons, such as measurement errors, false information, software/hardware errors in the execution of the node 102(n), network communication errors, and so on.
- the cleaning module 120(N) is executed by the manager node 102(N) to reduce or eliminate erroneous data from the trace such that quality trace data is utilized to drive the simulation-based fault diagnosis. Further discussion of cleaning module 120(N) execution may be found in relation to FIGS. 8-9.
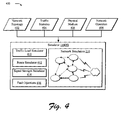
- FIG. 4 is an illustration of an exemplary implementation showing a system 400 that includes the simulator 118(N) and the network simulation 210 of FIG. 2. Trace data obtained through operation of a real network enables the simulator 118(N) to accurately represent network operation of the real network and examine the effects of a given set of faults on the real network. A variety of trace data may be collected for input to a simulator, examples of which are described as follows:
- Network topology 402 data describes the topology of the network, such as which nodes are currently members of the network and corresponding links between the nodes.
- Each node in the network may be configured to report on the status (e.g., connected or disconnected) of neighboring nodes and nodes referenced in one or more routing tables of the node. In this way, node membership in the network may be communicated to the manager node 102(N) of FIG. 1. In an implementation, only changes in neighbors or routes are reported. This data may be used to drive a route simulation, which is described in greater detail in relation to a route simulator of FIG. 4
- Traffic statistics 404 data may be utilized to describe amounts of data that is communicated through the network and particular nodes that communicate that data.
- the traffic statistics 404 may be utilized as an input by the traffic simulator module 214 of FIG. 2 such that the network simulation 210 has a traffic flow which approximates that o the real network.
- Each node of the network may maintain one or more counters which describe the volume of traffic sent to and received from its immediate neighbors. This data is used to drive a route traffic simulation provided by the traffic simulation module 214, which is also described in greater detail in relation to FIG. 4.
- Physical medium 406 data may describe effects on network performance of the physical medium that is utilized to implement the network. For example, in a wireless network each node may report its noise level and the signal strength of the wireless links from its neighboring nodes. In an implementation, variations in signal strength are periodically captured through time averaging, standard deviation, or other statistical aggregate.
- Network operation 408 data describes network operation 408 of the real network. As previously described, observed network operation is compared with the estimated network operation output from the network simulation to detect network operation discrepancies.
- Network operation may include both link operation and end-to-end operation, both of which can be measured through a variety of metrics, such as packet loss rate, delay, and throughput. The following description focuses on link level operation.
- Data collection may involve two steps: (1) collecting raw performance data at a local node and (2) distributing the collected data to collection points for analysis.
- a variety of tools may be utilized for local data collection, such as native routing protocols and packet sniffers.
- network overhead is low and has little impact on the data traffic in the network.
- network overhead may be reduced by using compression, delta encoding, multicast, adaptive changes of a time scale and/or spatial scope of distribution, and so on. For example, a minimum set of data is collected and exchanged during normal operation of a network. Once a need arises for additional data (e.g., when the information being collected indicates a discrepancy), the manager module may request additional information and increase the frequency of data collection for the subset of the nodes that need increased monitoring.
- Network characteristics that are modeled by the simulator may be classified in a variety of categories, such as traffic load, routing, wireless signal, faults, and so on.
- categories such as traffic load, routing, wireless signal, faults, and so on.
- the following sections describe simulation examples of each of these exemplary categories as individual modules that are utilized to cause the simulator to simulate the corresponding network characteristics.
- a network simulation generated by a simulator may be configured such that it provides a traffic pattern that approximates the traffic pattern of the real network.
- An example of a traffic load simulation approach involves the simulation of end-to-end application demands.
- an N-node network can include potentially N 2 demands.
- end-to-end application demands may be difficult to obtain given the heterogeneity of application demands and the use of different transport protocols, such as a transmission control protocol (TCP), a user datagram protocol (UDP), a rapid transport protocol (RTP), and so on.
- TCP transmission control protocol
- UDP user datagram protocol
- RTP rapid transport protocol
- a traffic load simulator 410 module is a portion of the traffic simulator module 214 of FIG. 2 and provides a link-based traffic simulation that is utilized for scalability and to avoid the need for obtaining end-to-end application demands.
- the link-based traffic simulation when implemented, may adjust an application-level sending rate at each link to match the observed link-level traffic counts of the real network. In this way, higher layers (e.g., a transport layer, an application layer, and so on) are abstracted away, which allows the simulation to concentrate on packet size and traffic rate.
- Matching the sending rate on a per-link basis in a simulator may be nontrivial when the sending rate on a link cannot be directly controlled, such as when only the application-level sending rate may be adjusted and the medium access control (MAC) protocol must be addressed.
- MAC medium access control
- An iterative search technique may be utilized to address these issues by determining the sending rate at each link.
- a variety of iterative search techniques may be utilized, such as (i) multiplicative increase and multiplicative decrease, and (ii) additive increase and additive decrease.
- multiplicative increase and multiplicative decrease may be utilized, such as (i) multiplicative increase and multiplicative decrease, and (ii) additive increase and additive decrease.
- additive increase and additive decrease may be utilized to address these issues by determining the sending rate at each link.
- Routing plays an important role in network performance, particularly in multi-hop wireless networks.
- One route simulation approach involves the simulation of a routing protocol used in the real network inside the simulator. In order to reproduce the same routing behavior as in a real network, detailed traces of packets are obtained to set up the routing.
- the actual routes taken by packets may be utilized as an input to the route simulator 412 module.
- routing changes may be tracked instead of collecting routes on a packet-by-packet basis at the manager.
- the route simulator 412 module may be trace-driven.
- the route simulation module may be implemented inside the simulator 118(N), such as a QUALNET simulator (QUALNET is a trademark of Scalable Network Technologies, Inc. of Los Angeles, CA).
- the route simulation 412 module accepts routing updates and corresponding timestamps as inputs, and then ensures that the packets in the network simulation follow the same route as in the real network.
- Signal strength has an impact on both wired and wireless network performance. Due to variations across different network connection devices (e.g., wireless cards) and environments, a general propagation model may be difficult to derive which captures all of these factors. To address this issue, the signal strength simulator 414 may be driven from real measurement of signal strength in the real network, such as obtained from the network connection devices themselves.
- the framework may include a fault injection 416 module that is executable to inject different types of faults into the simulator, such as packet dropping at hosts, external noise sources, MAC misbehavior, and so on.
- the analysis module may examine the impact of faults on the network.
- Packet dropping at hosts for instance, occurs when a misbehaving node drops a portion of the traffic from one or more neighboring nodes, such as due to hardware/software errors, buffer overflow, malicious drops, and so forth.
- the ability to detect such end-host packet dropping is useful, since it allows the manager to differentiate losses caused by end hosts from losses caused by the network.
- the framework through execution of the fault injection 416 module, also supports the ability to inject external noise sources in the network.
- the framework may provide a simulation that replicates the effect of noise sources that lie outside the network (i.e., are not provided by a node) but nevertheless affect the network.
- MAC misbehavior occurs when a faulty node does not follow the MAC etiquette and obtains an unfair share of the channel bandwidth.
- a faulty node can choose a smaller contention window (CW) to aggressively send traffic.
- CW contention window
- Link congestion may also be simulated by the framework by supplying a high data transmit load on the simulated network. Unlike the other types of faults, link congestion is implicitly captured by the traffic statistics gathered from each node. Therefore, the trace-driven simulation can directly assess the impact of link congestion on the real network. Further discussion of fault diagnosis may be found in the following section.
- Root causes for failures and performance problems may be diagnosed through execution of the analysis module 122(N) of FIG. 2.
- diagnosis of network discrepancies may be reduced to searching for a set of faults that, when injected into the simulated network, result in an estimated performance by the simulated network that approximates the observed performance of the real network.
- FaultSet is found such that: SimPerf NS ; FaultSet ⁇ RealPerf , where the network performance is a functional value that can be quantified using a variety of different metrics.
- the search space for a fault may contain a multitude of searching dimensions due to the different combinations of faults which may be encountered.
- the analysis module 122(N) is optimized for efficient searching due to a realization that different types of faults often change a few particular network performance metrics. For example, packet dropping at hosts generally affects link loss rate, but does not affect other network performance metrics. Therefore, network performance metrics may be used to diagnosis network performance by noting differences between observed and estimated network performance indicated by the metrics.
- agent modules may periodically report information about link conditions and traffic patterns to the manager module. This information is processed and then fed into the simulator to create a network simulation that may then be utilized to determine a likely root cause of the fault.
- FIG. 5 is a flow chart depicting a procedure 500 in an exemplary implementation in which faults having the same type, one to another, are initially diagnosed.
- the following discussion involves three exemplary types of faults: (1) packet dropping at hosts; (2) external noise; and (3) MAC misbehavior. It should be apparent, however, that a wide variety of other faults and fault combinations may also be addressed in a similar manner.
- the following discussion includes procedures that may be implemented utilizing the described systems and devices. Aspects of each of the procedures may be implemented in hardware, firmware, or software, or a combination thereof.
- the procedures are shown as a set of blocks that specify operations performed by one or more devices and are not necessarily limited to the orders shown for performing the operations by the respective blocks.
- a trace-driven simulation when fed with current network settings of a real network, may be utilized to establish estimated network performance of the network. Based on the difference between the estimated network performance and observed network performance, the type of faults may be determined using a decision tree, an example of which is depicted in FIG. 6.
- a discrepancy in network performance may be determined using a threshold. For example, a discrepancy may be determined based on whether a difference between estimated and observed (i.e., real) network performance values exceeds a corresponding threshold.
- the threshold may be computed in a variety of ways, such as by observing the historical difference between simulated and actual network performance.
- a fault classification scheme is configured to determine the type of fault which caused the discrepancy by noting that different faults exhibit different respective behaviors. While the behaviors exhibited by each of the faults may still overlap (e.g., both noise sources and packet dropping at hosts increase loss rates, lowering a contention window increases the amount of traffic and hence increases interference noise, and so on), the faults may first be categorized by checking the differentiating respective behavior. For example, an external noise source increases noise levels experienced by neighboring nodes, but does not increase the sending rates of any node. Therefore, the external noise source can be differentiated from MAC misbehavior and packet dropping at hosts.
- the analysis module selects one or more faults from a plurality of faults, such as from the faults directory 218 of FIG. 2.
- a first iteration of the procedure 500 none of the plurality of faults is selected to derive an expected performance of the network under normal operating conditions, i.e., without faults.
- the procedure 500 of FIG. 5 is utilized to perform an initial diagnosis and is not iterative, i.e. it is a "one pass" procedure.
- block 502 may be removed from the procedure 500 and the fault set provided as an empty set ⁇ .
- the fault set (FS) and network settings (NS) are provided to a network simulation as an input.
- a variety of network settings may be supplied, such as signal strength, traffic statistics, routing tables, and so on.
- the expected performance (SimPerf) is predicted by executing the network simulation with the provided inputs.
- a determination is made as to whether the difference (Diff) between the expected performance (SimPerf) and the real performance (RealPerf) is greater than a threshold. If the difference is greater than the threshold (block 506), the fault type (FT) is determined (block 510). Further discussion of determination of a fault type may be found in relation to FIG. 6.
- the faults are located (block 512) by finding a set of nodes and links that have differences between the observed and expected network performance that exceeds a threshold for that particular fault type (block 514).
- the fault type determines what network performance metric is used to quantify the performance difference. For instance, packet dropping may be identified by finding links having a significant difference between expected and observed loss rates.
- the magnitude of the fault is determined.
- a function (denoted as "g()"), for instance, may be utilized to map the impact of a fault into a corresponding magnitude.
- the g() function is an identity function, since the difference in a link's loss rate can be directly mapped to a change in a packet dropping rate on a link (fault's magnitude).
- the g() function is a propagation function of a noise signal. Blocks 510-516 may be repeated for each link or node. The fault with a corresponding magnitude may then be added to the fault set at 516.
- FIG. 6 is a flow diagram depicting a procedure 600 in an exemplary implementation in which a decision tree is utilized to determine a type of fault.
- the procedure 600 depicted in FIG. 6 may or may not correspond to block 510 of FIG. 5.
- decision block 602 a determination is made as to whether the absolute value of a simulated amount of packets sent (SimSent) minus a real amount of packets sent (RealSent) is greater than a threshold, denoted as ThreshSentDiff. If so, a fault is sent indicating that the contention window (CW) is set too low (block 604).
- SimSent a simulated amount of packets sent
- RealSentDiff a threshold
- CW contention window
- a discrepancy i.e., a threshold noise differential ThreshNoiseDiff has been exceed
- simulated packet loss i.e., the expected packet loss
- RealLoss the real pack loss
- TheshLossDiff a threshold loss difference
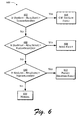
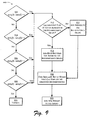
- FIG. 7 is a flow chart depicting a procedure 700 in an exemplary implementation in which faults having different types, one to another, are diagnosed using an iterative diagnostic algorithm.
- multiple types of interacting faults may be encountered in a network. Even when the faults are of the same type, interactions may still be encountered, which may make a one pass diagnostic algorithm insufficient. Therefore, an iterative diagnostic algorithm, as shown in FIG. 7, may be implemented to find root causes.
- the algorithm includes two stages: (i) an initial diagnostic stage similar to the procedure 500 of FIG. 5, and (ii) iterative refinements.
- a one-pass diagnosis algorithm is applied to derive an initial set of faults.
- the fault set is iteratively refined by (i) adjusting the magnitude of the faults that have been already inserted into the fault set, and (ii) adding a new fault to the set if necessary.
- the procedure 700 may be reiterated until the change in fault set is negligible, such as when the fault types and locations do not change, the magnitudes of the faults change by minimal amounts, and so on.
- An iterative approach may also be used to search for the magnitudes of the faults.
- this approach is similar to the link-based simulation, described in relation to FIG. 5, where the difference between the target and current values were utilized as a feedback to progressively move towards the target.
- the expected network performance is estimated under the existing fault set for each iteration.
- the expected network performance may be estimated through simulation of the network using network settings obtained from the real network.
- the network settings are provided through execution of agent modules on each node.
- the network settings provided by each node may describe local network performance of the node as well as network performance of neighboring nodes.
- the difference between estimated network performance (under the existing fault set) and real performance is computed.
- the difference for instance, may be computed by a manager node through execution of a manager module.
- the manager module when executed, compares the estimated (i.e., expected) network performance obtained from a simulated network with real (i.e., observed) network performance as indicated by additional network settings obtained from the plurality of agents.
- the procedure 700 of FIG. 7 first makes an initial fault diagnosis in a manner similar to the procedure 500 described in relation to FIG. 5.
- a determination is made as to whether the computed difference is greater than a corresponding threshold. If not, the fault set is reported (block 708). In this instance, because the computed difference is not greater than the threshold, this indicates to the analysis module that the network is operating normally. If the computed difference is greater than the corresponding threshold (block 706), however, the fault type is determined (block 710).
- the fault type may be determined in a variety of ways, an example of which was described in relation to FIG. 6.
- the difference is translated into a change in the fault's magnitudes and the fault magnitudes are adjusted according to the computed change (block 714).
- the function g() as previously described in relation to FIG. 5 may be utilized to compute a fault magnitude for each of the faults based on the respective differences between expected and real network performance.
- the faults may be compared, one to another, to determine which fault has an effect on network performance that corresponds to the observed discrepancy.
- the largest fault magnitude is first utilized to explain the discrepancy, and thereby identify a particular fault which caused the discrepancy.
- the fault magnitudes are compared to locate a fault which results in a difference which approximates the computed difference.
- each of a plurality of faults may have respective differences between expected and real network performance.
- One or more of the faults may be selected by matching the respective differences with the computed difference in network performance.
- faults are removed which have magnitudes which are below a corresponding threshold, thereby optimizing the fault set.
- the analysis module may store heuristic data which describes one or more previous iterations of fault sets and resultant performance values in the network simulation. The difference between the target values (i.e., real network performance values) and current values (i.e., simulated network performance values) is used as feedback by the analysis module to progressively "move" the network simulation to approximate the real network.
- a new fault candidate is added to the fault set.
- membership in the fault set may be iteratively refined by selecting new fault candidates that can best explain the difference between expected and real network performance (block 720). These new faults are added to the fault set (block 722).
- the fault set including the new fault candidate is then utilized as an input to a network simulation to estimate expected network performance under existing fault set (block 702).
- a fault is added during each iteration of the procedure 700 which can explain the largest discrepancy, thereby controlling false positives.
- the procedure 700 may then be repeated until the expected performance of the simulated network approximates the real performance of the real network. In this way, the simulated network may be moved through inclusion of faults such that it provides an accurate depiction of faults which cause the observed network performance in the real network.
- the following illustrates exemplary pseudo code which may be executed to provide the procedure 700 of FIG. 7.
- the cleaning module 120(N) of FIG. 1 may be executed to clean the "raw" trace data received from the plurality of agents to provide cleansed trace data as an input to the simulator 118(N) for fault diagnosis.
- FIG. 8 is an illustration of a network 800 in an exemplary implementation in which the plurality of nodes 102(1)-102(N) of FIG. 1 include agent modules that are executable to perform neighbor monitoring.
- the agent modules that are executed on each of the nodes in the network perform neighbor monitoring, which is a technique in which each of the plurality of nodes 102(1)-102(N) reports performance and traffic statistics not only for its own incoming/outgoing links, but also for other links within its communication range.
- Neighbor monitoring may be performed in a variety of ways. For instance, an agent module on a first node may be executed to examine a second node in the network to obtain network performance data from the second node.
- the first node receives a communication from the second node, such as a broadcast, that includes the network performance data.
- the first node monitors data sent by the second node for communication through the network to monitor the network performance.
- the first node may operate in a "promiscuous" mode which allows a network connection device of the node to intercept and read each data packet that arrives at that particular node in its entirety.
- Node 102(3) may obtain a report 802(2) from node 102(2) that describes network performance of node 102(2), as well as the network performance of nodes 102(1), 102(n).
- Parentheticals utilized in the reference numbers of the reports in FIG. 8 are selected to show correspondence of the report with its respective node, e.g., node 102(2) and report 802(2).
- Node 102(3) includes network performance data from the report 802(2) (which is illustrated in phantom in FIG. 8) in report 802(3) that is formed for communication to the manager node 102(N).
- the report 802(3) may also include network performance data obtained by node 102(3) by monitoring nodes 102(2), 102(1).
- the report 802(3) is optimized through execution of an agent module to remove redundant information.
- the agent module of node 102(3) may remove information that is consistent and repeated by nodes 102(2), 102(3) in the respective reports 802(2), 802(3), but leave data describing any inconsistencies in the data.
- node 102(n) may execute the collection module 114(n) to obtain network performance data from nodes 102(2), 102(3).
- the network performance data is configured as a report 802(n) for communication to the manager node 102(N).
- the redundant reports can be used by the manager node 102(N) to detect one or more inconsistencies in network performance.
- reports 802(2), 802(3) may be compared to each other through execution of the cleaning module 120(N) by the manager node 102(N) to find inconsistencies in the network performance data described therein.
- the inconsistencies may be found in a variety of ways, an example of which is described in the following figure.
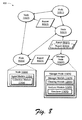
- FIG. 9 is a flow diagram depicting a procedure 900 in an exemplary implementation in which reports which describe neighboring nodes are compared to locate a misbehaving node in a network.
- the procedure 900 identifies the misbehaving nodes as the minimum set of nodes that can explain the discrepancy in the reports.
- a sending node i reports a number of packets sent and a number of MAC-level acknowledgements received for a directed link I as (sent i (l), ack i (l)).
- a receiving node j reports the number of packets received on the link as recv j (l).
- a sending or receiving node's immediate neighbor k also reports the number of packets and MAC-level acknowledgements that are sent or received on the link as (sent k (l), recv k (l), ack k (l)).
- An inconsistency in the reports is defined as one of the following cases.
- the threshold t is utilized, since the communication of the reports by the respective nodes is not typically synchronized. If the number of packets received is significantly greater than the number of packets sent, then an inconsistency in the reports is noted, which will be described in greater detail in relation to block 912.. If the numbers of packets received and sent by the respective nodes correspond, then the procedure 900 progresses to block 904.
- the link l from node i to node j and given a threshold t, the following is determined: ac ⁇ k i 1 - rec ⁇ v j 1 > t
- the procedure 900 progresses to block 906.
- the link l from node i to node j, i's neighbor k, and given a threshold t the following is determined: sen ⁇ t k 1 - sen ⁇ t i 1 > t
- the number of packets sent approximates the number of packets sent (block 908) as indicated, respectively, by the source and neighboring nodes, then an inconsistency in the reports is noted. Otherwise, the reports are consistent (block 910).
- a smallest set (i.e., least number) of nodes is found in the inconsistency graph that can explain the observed inconsistencies. For instance, an assumption may be made that most nodes in the network send reliable reports. Therefore, the smallest set of nodes that can explain the observed inconsistencies is found. This can be achieved, for instance, by finding the smallest set of vertices that covers the inconsistency graph, where the identified vertices represent the misbehaving nodes.
- the smallest set of vertices may be found through utilization of a minimum vertex cover problem, which is known to be NP-hard.
- a greedy algorithm is applied which iteratively picks and removes the node with most edges and the incident edges from a current inconsistency graph until no edges are left.
- a history of reports can be used to further improve the accuracy of inconsistency detection. For example, at block 920 a new report may be added to update the inconsistency graph without deleting previous information. Inconsistent pairs of nodes in the new report may then be processed using blocks 912-918 of the procedure 900. For instance, the same greedy algorithm of block 918 may be reapplied to identify misbehaving nodes.
- faults were selectively injected into a network simulation to identify which faults, if any, may have cause a difference between expected and observed network performance.
- the network simulation may also be utilized to perform "what-if" analysis to improve operation of the network. What-if analysis allows the manager module, when executed, to determine the effect of different possible network and node configurations on network performance.
- the result of the what-if analysis is a set of actions that allows the manager module to operate the network efficiently, such as by causing the agent module on selected nodes in the network to configure the respective node accordingly.
- What-if analysis may be carried out through the use of an online trace-driven simulation as previously described.
- Exemplary traces are identified in the following discussion which may that collected to drive the simulator (e.g., simulator 118(N) of FIG. 2).
- the simulator may be utilized to provide a network simulation of a real network.
- the network simulation may be reconfigured to test different node and network configurations and determine which configuration yields the best overall network performance for the existing traffic conditions.
- the manager module may then determine a set of actions for implementation by particular nodes in the network based on the configuration.
- FIG. 10 is flow chart depicting a procedure 1000 in an exemplary implementation in which what-if analysis is performed based on an online trace-driven simulation.
- the procedure 1000 first reproduces a real network using a network simulation. Consequences of modifications to the network, when applied to the real network, are then determined by applying those changes in the network simulation to quantify network performance implications.
- one or more of a plurality of modifications are selected through execution of the manager module.
- Modifications may be selected in a variety of ways. For instance, modifications may be considered by the manager module as a fault that causes an increase instead of a decrease in network performance. Modifications in such an instance may be stored in the faults directory 218 of FIG. 2 and arranged based on type.
- the analysis module provides network settings of a real network and a modification set that includes the selected modifications to a network simulation as an input.
- expected performance of the network is predicted based on the inputs.
- the simulator may create a network simulation based on the network settings of the real network and the modification set.
- the network simulation may then be utilized to determine the consequences of the modifications to the real network.
- the network simulation may provide an output of simulated network performance values that are compared to real network performance values obtained from the agent modules 122 (n) of FIG. 1. If the difference between expected and real network performance is less than the threshold (block 1008), a new modification may be selected (block 1002) and the effect of the modification determined as previously described.
- the analysis module when executed, derives one or more actions to be performed by agent modules of the network to implement the modification (block 1008).
- the analysis module for instance, may include a directory of actions that are mapped to corresponding modifications. The analysis module may then obtain corresponding actions based on the modifications.
- the analysis module forms a communication describing the one or more action for communication to the corresponding agent modules.
- the corresponding agent modules may then cause the respective nodes of the network to implement the actions described therein.
- the manager and agent modules may be utilized to perform what-if analysis based on an online trace-driven simulation in a manner similar to fault detection. What-if analysis may be utilized for correcting faults and improving network performance.
- simulation is used to determine a modification to be made to a network to improve network performance, such as by using an iterative approach to perform what-if analysis. This approach is similar to the simulation as described in relation to FIGS. 5 and 7. Thus, iteration refining could be used when multiple modification actions are needed.
- FIG. 11 is a flow diagram depicting a procedure 1100 in an exemplary implementation in which modifications to a network are derived based on a diagnosis of a damaging flow.
- a manager module e.g., manager module 116(N) of FIGS. 1 and 2 is executed to determine that one or more flows in a network are experiencing lower throughput values than their corresponding expected target throughput values.
- the manager module determines which, if any of the flows in the network are a "damaging flow".
- a damaging flow is a type of fault whose presence causes serious degradation in network throughput, and is different from the previous faults in that the damaging flow may be healthy by itself but does not interact well with other competing flows.
- network settings are collected that describes target end-to-end demands and the routing protocol that is in use. It should be noted that these network settings may be different from the traces used for troubleshooting, because the procedure 1100 examines how the network (e.g., link loads and routing) will react to the changes in network configuration.
- a damaging flow is identified as the one flow whose removal yield the most significant overall improvement to network performance.
- a network 1200 is shown in FIG. 12 that includes a plurality of flows 1202-1216.
- Flow eight 1216 (illustrated as F 8 in FIG. 12), crosses each of the other flows 1202-1214 in the illustrated network 1200. Therefore, the removal of flow 1208 may result in the largest increase in throughput, as opposed to removal of any of the other flows 1202-1214.
- the presence of flow eight 1216 causes the greatest amount of damage to the performance of the network 1200.
- a modification e.g., removal or reduction of the influence of flow eight 1216 on the other flows of the system
- the network may be determined which results in the greatest increase in network performance.
- one or more actions are derived based on the modification which may be utilized to improve network performance.
- exemplary actions may include rate-limiting, rerouting, and topology control of flow eight 1216.
- the network simulation enables the manager module to further evaluate the benefit of these actions accurately. For example, the following table shows an expected throughput for exemplary corrective actions.
- WINDOWS XP is a trademark of the Microsoft Corp., Redmond WA.
- Components of the exemplary implementation, design principles, and its features are described in this section.
- the exemplary framework in this instance includes two separate components: agent modules and manager modules.
- the agent module is executed on each node of the network to report local data either periodically or on-demand.
- a manager module collects relevant data from the agent modules and is executed to analyze the data, such as through execution of an included analysis module as described in relation to FIG. 2.
- the exemplary framework employs simplicity and extensibility design principles.
- the data gathered and propagated for monitoring and management may be cast into performance counters supported on WINDOWS (WINDOWS is a trademark of Microsoft Corp, Redmond WA).
- Performance counters may be provided as (name, value) pairs grouped by categories.
- the described framework is also extensible. Adding to the data being monitored involves creation of a new category of performance counters and writing a module that updates the performance counter values as the information changes. Performance data related to transmission control protocol (TCP), user datagram protocol (UDP), internet protocol (IP), and workstation remote application programming interface (WRAPI) may be incorporated into the framework with little additional work.
- TCP transmission control protocol
- UDP user datagram protocol
- IP internet protocol
- WRAPI workstation remote application programming interface
- Values in these performance counters may be read-only or writable.
- Writable counters offer a way for an authorized manager node to change the values and influence the behavior of a node in order to fix problems or initiate experiments remotely, such as through communication of a manager module with an agent module being executed on difference respective nodes.
- Each manager node may also be equipped with a graphical user interface (GUI) 1300, an example of which is illustrated in FIG. 13, to interact with network administrators.
- GUI graphical user interface
- the GUI allows an administrator to visualize the network as well as to issue management requests through the manager module.
- the GUI 1300 displays a topology for an exemplary network test-bed.
- the GUI 1300 in this instance depicts a manager window with agents deployed over a test-bed of 23 nodes.
- the manager module can display the topology based on the relative coordinates of the nodes either directly obtained or inferred.
- the GUI 1300 may also allow the administrator to zoom-in on a particular part of the network for more detailed information and to click on a link to cause a display of network performance data about a particular link in a table format.
Landscapes
- Engineering & Computer Science (AREA)
- Computer Networks & Wireless Communication (AREA)
- Signal Processing (AREA)
- Environmental & Geological Engineering (AREA)
- Physics & Mathematics (AREA)
- General Physics & Mathematics (AREA)
- Automation & Control Theory (AREA)
- Data Exchanges In Wide-Area Networks (AREA)
- Details Of Television Scanning (AREA)
- Burglar Alarm Systems (AREA)
- Mobile Radio Communication Systems (AREA)
- Investigating Or Analyzing Materials By The Use Of Ultrasonic Waves (AREA)
- Holo Graphy (AREA)
Claims (25)
- Procédé de détection et de diagnostic de défauts dans un réseau, comprenant:la détection d'un écart de fonctionnement d'un réseau en:fournissant (504) des données décrivant le réseau à une simulation de réseau (210) afin que la simulation de réseau produise une estimation de performances de réseau; etdéterminant (508) si l'estimation des performances de réseau diffère ou non de performances de réseau observées du réseau; etle diagnostic (510, 512, 514, 516) d'une cause à l'origine de l'écart en injectant l'un au moins de plusieurs défauts dans la simulation de réseau jusqu'à ce que l'estimation des performances de réseau se rapproche des performances de réseau observées.
- Procédé tel que décrit dans la revendication 1, dans lequel la détermination comprend l'étape qui consiste à s'assurer si l'estimation des performances de réseau diffère ou non des performances de réseau observées de plus d'un seuil correspondant.
- Procédé tel que décrit dans la revendication 1, dans lequel le diagnostic comprend les étapes qui consistent à:convertir la différence entre les performances de réseau estimées et observées en une grandeur de défaut; etdéterminer si l'amplitude de défaut amène la simulation de réseau à se rapprocher des performances de réseau observées du réseau.
- Procédé tel que décrit dans la revendication 1, dans lequel le diagnostic comprend les étapes qui consistent à:convertir la différence entre les performances de réseau estimées et observées en une grandeur de défaut;déterminer si la grandeur de défaut est inférieure ou non à un seuil correspondant; etlorsque la grandeur de défaut est inférieure au seuil correspondant, supprimer un défaut correspondant d'un ensemble de défauts utilisé comme entrée dans la simulation de réseau.
- Procédé tel que décrit dans la revendication 1, dans lequel le diagnostic comprend:l'établissement d'un diagnostic initial pour générer un ensemble de défauts initial; etl'affinage itératif de l'ensemble de défauts initial pour arriver à un ensemble de défauts actuel qui, lorsqu'il est utilisé comme entrée par la simulation de réseau, amène l'estimation des performances de réseau produite par la simulation de réseau à se rapprocher des performances de réseau observées.
- Procédé tel que décrit dans la revendication 1, dans lequel le réseau est un réseau sans fil à plusieurs tronçons.
- Procédé tel que décrit dans la revendication 1, dans lequel le réseau est un réseau câblé.
- Procédé tel que décrit dans la revendication 1, dans lequel les données décrivent un itinéraire formé par une série de tronçons empruntés par un paquet de données à travers le réseau entre un noeud d'origine et un noeud cible du réseau.
- Procédé tel que décrit dans la revendication 1, dans lequel les données comprennent des données de parcours choisies dans le groupe constitué par:une topologie de réseau comprenant des itinéraires;des statistiques de trafic;un milieu physique; etdes performances de réseau.
- Support(s) lisible(s) par ordinateur comprenant des instructions exécutables par ordinateur qui, lorsqu'elles sont exécutées par un ordinateur, conduisent celui-ci à mettre en oeuvre le procédé de la revendication 1.
- Système pour détecter et diagnostiquer des défauts dans un réseau comprenant de multiples noeuds (102) reliés les uns aux autres de manière à pouvoir communiquer pour former ledit réseau, dans lequel:l'un au moins desdits noeuds comprend un module agent (112(N)) qui peut être exécuté sur lui pour:collecter des paramètres de réseau; etétablir une communication comprenant les paramètres de réseau pour communiquer sur le réseau; etl'un au moins desdits noeuds comprend un module gestionnaire (116(N)) qui peut être exécuté sur lui pour:recevoir la communication;générer une simulation du réseau en fonction des paramètres de réseau obtenus à partir de la communication afin que la simulation de réseau produise une estimation des performances du réseau; etdétecter (510, 512, 514, 516) un défaut dans le fonctionnement du réseau en comparant (508) une estimation des performances du réseau avec une observation des performances du réseau.
- Système tel que décrit dans la revendication 11, dans lequel au moins deux desdits noeuds comprennent un module gestionnaire respectif.
- Système tel que décrit dans la revendication 11, dans lequel chacun desdits noeuds comprend un module agent respectif.
- Système tel que décrit dans la revendication 11, dans lequel le module gestionnaire peut également être exécuté pour:trouver une action de correction en fonction du défaut détecté; etobliger le module agent à exécuter l'action de correction.
- Système tel que décrit dans la revendication 11, dans lequel le défaut de fonctionnement du réseau est détecté en déterminant si une différence entre l'estimation et l'observation est supérieure ou non à un seuil correspondant.
- Système tel que décrit dans la revendication 11, dans lequel le module gestionnaire peut également être exécuté pour diagnostiquer le défaut en injectant l'un au moins de plusieurs desdits défauts dans la simulation de réseau jusqu'à ce que l'estimation se rapproche de l'observation.
- Système tel que décrit dans la revendication 11, dans lequel le module gestionnaire peut également être exécuté pour diagnostiquer le défaut en:convertissant une différence entre l'estimation et l'observation en une grandeur de défaut; etdéterminant si la grandeur de défaut amène l'estimation produite par la simulation de réseau à se rapprocher de l'observation.
- Système tel que décrit dans la revendication 11, dans lequel le module gestionnaire peut également être exécuté pour diagnostiquer le défaut en:convertissant une différence entre l'estimation et l'observation en une grandeur de défaut; etdéterminant si la grandeur de défaut est inférieure ou non à un seuil correspondant; etlorsque la grandeur de défaut est inférieure au seuil correspondant, en supprimant un défaut correspondant d'un ensemble de défauts utilisé en entrée par la simulation générée pour produire l'estimation.
- Système tel que décrit dans la revendication 11, dans lequel le module gestionnaire peut également être exécuté pour diagnostiquer le défaut en:établissant un diagnostic initial pour générer un ensemble de défauts initial; etaffinant de manière itérative l'ensemble de défauts initial pour arriver à un ensemble de défauts actuel qui, lorsqu'il est utilisé en entrée par la simulation de réseau, amène l'estimation à se rapprocher de l'observation.
- Système tel que décrit dans la revendication 11, dans lequel le réseau est un réseau maillé.
- Système tel que décrit dans la revendication 11, dans lequel les paramètres de réseau décrivent un itinéraire formé par une série de tronçons empruntés par un paquet de données à travers le réseau entre un noeud d'origine et un noeud cible du réseau.
- Noeud (102) d'un réseau comportant des moyens pour détecter et diagnostiquer des défauts dans ledit réseau, ledit noeud comprenant:des moyens (102(N)) pour gérer un fonctionnement d'un réseau comportant de multiples moyens pour acheminer des paquets de données,chacun desdits moyens d'acheminement étant relié à un autre desdits moyens d'acheminement pour pouvoir communiquer; etles moyens de gestion comprennent également des moyens pour :fournir des paramètres de réseau obtenus à partir du réseau à un moyen pour simuler le réseau (210);recevoir du moyen de simulation une sortie estimant des performances de réseau du réseau; etdétecter (510, 512, 514, 516) un défaut en comparant (508) la sortie avec une observation des performances de réseau du réseau.
- Noeud tel que décrit dans la revendication 22, dans lequel les moyens de gestion comprennent également des moyens pour diagnostiquer le défaut.
- Noeud tel que décrit dans la revendication 22, dans lequel le réseau est un réseau maillé.
- Noeud tel que décrit dans la revendication 22, dans lequel les moyens de gestion comprennent également des moyens pour trouver une action de correction en fonction du défaut détecté.
Applications Claiming Priority (4)
| Application Number | Priority Date | Filing Date | Title |
|---|---|---|---|
| US54073804P | 2004-01-30 | 2004-01-30 | |
| US540738 | 2004-01-30 | ||
| US881695 | 2004-06-30 | ||
| US10/881,695 US7583587B2 (en) | 2004-01-30 | 2004-06-30 | Fault detection and diagnosis |
Publications (2)
| Publication Number | Publication Date |
|---|---|
| EP1560366A1 EP1560366A1 (fr) | 2005-08-03 |
| EP1560366B1 true EP1560366B1 (fr) | 2007-01-03 |
Family
ID=34811409
Family Applications (1)
| Application Number | Title | Priority Date | Filing Date |
|---|---|---|---|
| EP05100630A Expired - Lifetime EP1560366B1 (fr) | 2004-01-30 | 2005-01-31 | Détection d'erreur et diagnostic |
Country Status (9)
| Country | Link |
|---|---|
| US (1) | US7583587B2 (fr) |
| EP (1) | EP1560366B1 (fr) |
| JP (1) | JP4786908B2 (fr) |
| KR (1) | KR101098744B1 (fr) |
| CN (1) | CN1665205B (fr) |
| AT (1) | ATE350832T1 (fr) |
| DE (1) | DE602005000383T2 (fr) |
| DK (1) | DK1560366T3 (fr) |
| ES (1) | ES2279479T3 (fr) |
Cited By (1)
| Publication number | Priority date | Publication date | Assignee | Title |
|---|---|---|---|---|
| CN109218113A (zh) * | 2018-11-07 | 2019-01-15 | 吉林工程技术师范学院 | 通信网络故障定位方法及故障监测装置 |
Families Citing this family (103)
| Publication number | Priority date | Publication date | Assignee | Title |
|---|---|---|---|---|
| US8010643B2 (en) * | 2003-08-01 | 2011-08-30 | Opnet Technologies Inc | System and methods for simulating traffic generation |
| US20060041415A1 (en) * | 2004-08-20 | 2006-02-23 | Dybas Richard S | Apparatus, system, and method for inter-device communications simulation |
| US20060146875A1 (en) * | 2005-01-04 | 2006-07-06 | Yang Luiyang L | Media access controller and methods for distributed hop-by-hop flow control in wireless mesh networks |
| US20080037532A1 (en) * | 2005-08-20 | 2008-02-14 | Sykes Edward A | Managing service levels on a shared network |
| US7808916B1 (en) * | 2005-12-28 | 2010-10-05 | At&T Intellectual Property Ii, L.P. | Anomaly detection systems for a computer network |
| US7925765B2 (en) * | 2006-04-07 | 2011-04-12 | Microsoft Corporation | Cooperative diagnosis in a wireless LAN |
| CN100420209C (zh) * | 2006-06-15 | 2008-09-17 | 哈尔滨工程大学 | 自动进行方案对比的可信网络仿真系统 |
| WO2007146424A2 (fr) * | 2006-06-15 | 2007-12-21 | The Force Inc. | Système et procédé de maintenance conditionnelle |
| US8135990B2 (en) * | 2006-08-11 | 2012-03-13 | Opnet Technologies, Inc. | Multi-variate network survivability analysis |
| US7516049B2 (en) * | 2007-02-19 | 2009-04-07 | Microsoft Corporation | Wireless performance analysis system |
| US8155662B2 (en) * | 2007-02-19 | 2012-04-10 | Microsoft Corporation | Self-configuring wireless network location system |
| JP4849467B2 (ja) * | 2007-03-05 | 2012-01-11 | Kddi株式会社 | 接続性評価システム |
| CN101282247B (zh) * | 2007-04-27 | 2010-11-10 | 清华大学 | 支持互联网高带宽实时视频应用的网络应用性能测量方法 |
| CN101282248B (zh) * | 2007-05-16 | 2010-11-10 | 清华大学 | 支持互联网高带宽实时视频应用的可扩展测量方法 |
| JP5459608B2 (ja) * | 2007-06-06 | 2014-04-02 | 日本電気株式会社 | 通信網の障害原因分析システムと障害原因分析方法、及び障害原因分析用プログラム |
| US7840841B2 (en) * | 2007-09-27 | 2010-11-23 | Cisco Technology, Inc. | Automatic detection of functional defects and performance bottlenecks in network devices |
| KR100968585B1 (ko) * | 2007-11-09 | 2010-07-08 | (주) 엠엠씨 테크놀로지 | 가상 애드혹 네트워크 시스템 및 이를 이용한 가상 애드혹네트워크 장비 실험 방법 |
| US7907535B2 (en) * | 2007-11-26 | 2011-03-15 | Alcatel-Lucent Usa Inc. | Anomaly detection and diagnosis using passive monitoring |
| US8230269B2 (en) * | 2008-06-17 | 2012-07-24 | Microsoft Corporation | Monitoring data categorization and module-based health correlations |
| US9246768B2 (en) * | 2008-06-18 | 2016-01-26 | Camber Corporation | Systems and methods for a simulated network attack generator |
| CN102187327B (zh) * | 2008-10-13 | 2015-09-09 | 惠普开发有限公司 | 趋势确定和识别 |
| JP5006894B2 (ja) * | 2009-03-11 | 2012-08-22 | 富士通テレコムネットワークス株式会社 | ネットワークシミュレーションシステムおよびネットワークシミュレーション方法 |
| CN101645807B (zh) * | 2009-09-04 | 2011-06-08 | 英华达(上海)科技有限公司 | 网络联机状态的侦测系统及方法 |
| US20110153039A1 (en) * | 2009-12-23 | 2011-06-23 | Viktor Gvelesiani | System and method for providing diagnostic information and graphical user interface therefor |
| JP5051252B2 (ja) * | 2010-02-18 | 2012-10-17 | 沖電気工業株式会社 | ネットワーク障害検出システム |
| US8086899B2 (en) * | 2010-03-25 | 2011-12-27 | Microsoft Corporation | Diagnosis of problem causes using factorization |
| US8880560B2 (en) * | 2010-04-28 | 2014-11-04 | Ca, Inc. | Agile re-engineering of information systems |
| US8347144B2 (en) * | 2010-06-11 | 2013-01-01 | Scientific Monitoring Inc. | False alarm mitigation |
| US20120143616A1 (en) * | 2010-12-07 | 2012-06-07 | Verizon Patent And Licensing, Inc. | System for and method of transaction management |
| US8826243B2 (en) * | 2010-12-14 | 2014-09-02 | International Business Machines Corporation | System, method, and computer program product for error code injection |
| US8699356B2 (en) * | 2010-12-20 | 2014-04-15 | Deere & Company | Method and system for diagnosing a fault or open circuit in a network |
| US8688606B2 (en) * | 2011-01-24 | 2014-04-01 | International Business Machines Corporation | Smarter business intelligence systems |
| JP5807336B2 (ja) * | 2011-02-08 | 2015-11-10 | 富士ゼロックス株式会社 | 情報処理装置および情報処理システム |
| US8661295B1 (en) | 2011-03-31 | 2014-02-25 | Amazon Technologies, Inc. | Monitoring and detecting causes of failures of network paths |
| US9001667B1 (en) * | 2011-03-31 | 2015-04-07 | Amazon Technologies, Inc. | Monitoring and detecting causes of failures of network paths |
| US9385917B1 (en) | 2011-03-31 | 2016-07-05 | Amazon Technologies, Inc. | Monitoring and detecting causes of failures of network paths |
| CN102752770B (zh) * | 2011-04-21 | 2014-10-08 | 中国移动通信集团北京有限公司 | 一种对业务系统进行巡检的方法及装置 |
| US8767586B2 (en) | 2011-06-20 | 2014-07-01 | At&T Intellectual Property I, L.P. | Methods, systems, and products for network topology |
| CN103947156B (zh) * | 2011-09-30 | 2018-01-02 | 瑞典爱立信有限公司 | 用于根原因分析的方法、装置和通信网络 |
| US9362746B2 (en) * | 2011-10-07 | 2016-06-07 | Cisco Technology, Inc. | Communication network topology management based on an associated electric grid topology |
| US9563532B1 (en) * | 2011-12-02 | 2017-02-07 | Google Inc. | Allocation of tasks in large scale computing systems |
| US9141506B2 (en) * | 2012-02-15 | 2015-09-22 | Jds Uniphase Corporation | Method and system for network monitoring using signature packets |
| US9258206B2 (en) * | 2012-03-14 | 2016-02-09 | Panorama9, Inc. | System administration |
| US9279878B2 (en) | 2012-03-27 | 2016-03-08 | Microsoft Technology Licensing, Llc | Locating a mobile device |
| US9104543B1 (en) | 2012-04-06 | 2015-08-11 | Amazon Technologies, Inc. | Determining locations of network failures |
| JP5883926B2 (ja) * | 2012-04-06 | 2016-03-15 | 株式会社日立製作所 | 管理サーバ、および、フロー処理方法 |
| US8937870B1 (en) | 2012-09-11 | 2015-01-20 | Amazon Technologies, Inc. | Network link monitoring and testing |
| US9612121B2 (en) | 2012-12-06 | 2017-04-04 | Microsoft Technology Licensing, Llc | Locating position within enclosure |
| US9794130B2 (en) | 2012-12-13 | 2017-10-17 | Coriant Operations, Inc. | System, apparatus, procedure, and computer program product for planning and simulating an internet protocol network |
| US9210038B1 (en) | 2013-02-11 | 2015-12-08 | Amazon Technologies, Inc. | Determining locations of network failures |
| US9197495B1 (en) | 2013-02-11 | 2015-11-24 | Amazon Technologies, Inc. | Determining locations of network failures |
| CN104125108A (zh) * | 2013-04-26 | 2014-10-29 | 富士通株式会社 | 故障诊断装置和方法、以及退避时间的设置方法 |
| US9742638B1 (en) * | 2013-08-05 | 2017-08-22 | Amazon Technologies, Inc. | Determining impact of network failures |
| CN104424060B (zh) * | 2013-08-23 | 2018-01-23 | 国际商业机器公司 | 一种用于确定故障的方法和装置 |
| CN103517311B (zh) * | 2013-09-11 | 2017-02-22 | 百度在线网络技术(北京)有限公司 | 一种模拟无线网络的方法与装置 |
| US10616073B1 (en) * | 2013-09-19 | 2020-04-07 | Amazon Technologies, Inc. | Graph-based service failure analysis |
| US9210377B2 (en) | 2013-10-30 | 2015-12-08 | At&T Intellectual Property I, L.P. | Methods, systems, and products for telepresence visualizations |
| US10075656B2 (en) | 2013-10-30 | 2018-09-11 | At&T Intellectual Property I, L.P. | Methods, systems, and products for telepresence visualizations |
| US10057123B1 (en) | 2013-12-27 | 2018-08-21 | Alarm.Com Incorporated | Network topology backup |
| US9436490B2 (en) * | 2014-01-13 | 2016-09-06 | Cisco Technology, Inc. | Systems and methods for testing WAAS performance for virtual desktop applications |
| CN106464434B (zh) * | 2014-03-17 | 2020-03-27 | 交互数字专利控股公司 | Ieee 802.11站sta及在其内使用的方法 |
| US20150286416A1 (en) | 2014-04-07 | 2015-10-08 | International Business Machines Corporation | Introducing Latency And Delay For Test Or Debug Purposes In A SAN Environment |
| EP3175579B1 (fr) * | 2014-07-30 | 2019-02-27 | Forward Networks, Inc. | Systèmes et procédés de gestion de réseau |
| US9652350B2 (en) * | 2015-01-22 | 2017-05-16 | International Business Machines Corporation | Evaluation of complex SAN environments |
| US20160308725A1 (en) * | 2015-04-16 | 2016-10-20 | Nec Laboratories America, Inc. | Integrated Community And Role Discovery In Enterprise Networks |
| US9722912B2 (en) * | 2015-07-09 | 2017-08-01 | Google Inc. | Network stochastic cross-layer optimization for meeting traffic flow availability target at minimum cost |
| US10856202B2 (en) | 2015-07-13 | 2020-12-01 | Gainspan Corporation | Creation of a wireless mesh network among proximately located wireless devices |
| US9929924B2 (en) * | 2015-09-25 | 2018-03-27 | Telefonaktiebolaget Lm Ericsson (Publ) | SDN controller logic-inference network troubleshooter (SDN-LINT) tool |
| US10225149B2 (en) * | 2015-12-15 | 2019-03-05 | Nicira, Inc. | Method and tool for diagnosing logical networks |
| CN105446887B (zh) * | 2016-01-11 | 2018-01-19 | 中国科学院光电研究院 | 一种基于数字虚拟技术的星载嵌入式数据通讯故障动态注入系统及方法 |
| CN105703946B (zh) * | 2016-01-18 | 2019-01-22 | 北京理工大学 | 一种面向QualNet的仿真场景节点信息定时修改方法 |
| US10243797B2 (en) | 2016-03-14 | 2019-03-26 | Nicira, Inc. | Identifying the realization status of logical entities based on a global realization number |
| US10241820B2 (en) | 2016-03-14 | 2019-03-26 | Nicira, Inc. | Determining the realization status of logical entities in logical networks |
| CN107205241B (zh) * | 2016-03-17 | 2020-08-25 | 腾讯科技(深圳)有限公司 | 一种无线通信检测方法及其设备 |
| US9768893B1 (en) * | 2016-11-16 | 2017-09-19 | Spirent Communications, Inc. | Over-the-air isolation testing |
| KR101901498B1 (ko) * | 2016-12-30 | 2018-09-21 | 이지환 | 네트워크 대역 이상검지 시스템 |
| US10467126B2 (en) * | 2017-03-31 | 2019-11-05 | Microsoft Technology Licensing, Llc | Scenarios based fault injection |
| JP6863091B2 (ja) * | 2017-05-31 | 2021-04-21 | 富士通株式会社 | 管理装置、管理方法及び管理プログラム |
| US10672206B2 (en) * | 2017-12-11 | 2020-06-02 | GM Global Technology Operations LLC | Systems, methods and apparatuses for diagnostic fault detection by parameter data using a redundant processor architecture |
| US11586981B2 (en) | 2017-12-11 | 2023-02-21 | Nec Corporation | Failure analysis device, failure analysis method, and failure analysis program |
| CN109359002B (zh) * | 2018-10-11 | 2020-11-06 | 北京世冠金洋科技发展有限公司 | 故障仿真方法和系统 |
| US10824528B2 (en) | 2018-11-27 | 2020-11-03 | Capital One Services, Llc | Techniques and system for optimization driven by dynamic resilience |
| US10282248B1 (en) | 2018-11-27 | 2019-05-07 | Capital One Services, Llc | Technology system auto-recovery and optimality engine and techniques |
| JP7090798B2 (ja) | 2018-12-03 | 2022-06-24 | セールスフォース ドット コム インコーポレイティッド | 自動動作管理のためのアプリケーションプログラミングインタフェース |
| US11563644B2 (en) | 2019-01-04 | 2023-01-24 | GoTenna, Inc. | Method and apparatus for modeling mobility and dynamic connectivity on a stationary wireless testbed |
| EP3926427A4 (fr) * | 2019-02-13 | 2022-04-20 | Panasonic Intellectual Property Management Co., Ltd. | Procédé d'évaluation d'efficacité de travail, dispositif d'évaluation d'efficacité de travail et programme |
| USD982021S1 (en) * | 2019-09-03 | 2023-03-28 | Silvus Technologies, Inc. | Display screen or portion thereof with a graphical user interface |
| US11067627B2 (en) | 2019-09-06 | 2021-07-20 | International Business Machines Corporation | Noise injection circuit |
| US10686645B1 (en) | 2019-10-09 | 2020-06-16 | Capital One Services, Llc | Scalable subscriptions for virtual collaborative workspaces |
| KR102157568B1 (ko) * | 2019-12-11 | 2020-09-18 | 한국건설기술연구원 | Tvws 기반 무선 통신 모뎀 및 이의 동작 방법 |
| US11424991B2 (en) * | 2020-11-06 | 2022-08-23 | Google Llc | Change impact simulation analysis |
| CN114629829A (zh) * | 2020-11-26 | 2022-06-14 | 中国南方电网有限责任公司 | 网络抗毁仿真验证方法、装置、计算机设备和存储介质 |
| WO2022144207A1 (fr) * | 2020-12-28 | 2022-07-07 | Telecom Italia S.P.A. | Système de communication cellulaire à fonctionnalité son |
| US20220382614A1 (en) * | 2021-05-26 | 2022-12-01 | Nec Laboratories America, Inc. | Hierarchical neural network-based root cause analysis for distributed computing systems |
| US11903042B2 (en) * | 2021-06-24 | 2024-02-13 | Verizon Patent And Licensing Inc. | Method and system for uplink classifier and branching point service |
| US11716241B1 (en) * | 2022-03-11 | 2023-08-01 | Keysight Technologies, Inc. | Methods, systems, and computer readable media for actively diagnosing and remediating performance degradation in a production network |
| US11743122B1 (en) * | 2022-03-30 | 2023-08-29 | Amazon Technologies, Inc. | Network change verification based on observed network flows |
| MY208101A (en) * | 2022-03-31 | 2025-04-15 | Mitsubishi Electric Corp | Central processing device, communication system, terminal management method, and program |
| US11909621B2 (en) * | 2022-06-03 | 2024-02-20 | Linquest Corporation | Systems and methods for implementing a network resiliency testbed emulator |
| CN115473828B (zh) * | 2022-08-18 | 2024-01-05 | 阿里巴巴(中国)有限公司 | 基于仿真网络的故障检测方法及系统 |
| US20240097971A1 (en) * | 2022-09-19 | 2024-03-21 | Vmware, Inc. | Providing explanation of network incident root causes |
| SI26473A (sl) * | 2023-02-06 | 2024-08-30 | Iskraemeco, Merjenje In Upravljanje Energije, D.D. | Sistem, naprava in postopek za dinamično optimizacijo in stabilizacijo elektroenergetskega omrežja z uporabo večnivojske metode aditivnega povečanja/multiplikativnega zmanjšanja - AIMD metode |
| US12388716B2 (en) | 2023-09-28 | 2025-08-12 | Hewlett Packard Enterprise Development Lp | Comparing network topology, states, and configuration at different time instances |
Family Cites Families (23)
| Publication number | Priority date | Publication date | Assignee | Title |
|---|---|---|---|---|
| US5552881A (en) | 1994-03-17 | 1996-09-03 | Teradyne, Inc. | Method and apparatus for scanning a fiber optic network |
| US5587919A (en) * | 1994-04-22 | 1996-12-24 | Lucent Technologies, Inc. | Apparatus and method for logic optimization by redundancy addition and removal |
| JP3198793B2 (ja) * | 1994-04-28 | 2001-08-13 | 日本鋼管株式会社 | 故障診断方法 |
| JPH08328984A (ja) * | 1995-05-31 | 1996-12-13 | Matsushita Electric Works Ltd | ネットワーク管理システム |
| US5809282A (en) | 1995-06-07 | 1998-09-15 | Grc International, Inc. | Automated network simulation and optimization system |
| US5561762A (en) * | 1995-06-06 | 1996-10-01 | Union Switch & Signal Inc. | Malicious fault list generation method |
| JPH09205429A (ja) * | 1996-01-29 | 1997-08-05 | Toshiba Corp | ネットワーク故障診断装置及び故障予測装置並びにその診断及び予測方法 |
| KR100242422B1 (ko) * | 1996-05-21 | 2000-02-01 | 윤종용 | 온라인 진단 방법 |
| US5896401A (en) * | 1997-04-15 | 1999-04-20 | Lucent Technologies Inc. | Fault simulator for digital circuitry |
| US5922051A (en) | 1997-05-14 | 1999-07-13 | Ncr Corporation | System and method for traffic management in a network management system |
| US6594268B1 (en) | 1999-03-11 | 2003-07-15 | Lucent Technologies Inc. | Adaptive routing system and method for QOS packet networks |
| JP3233282B2 (ja) * | 1999-05-19 | 2001-11-26 | エヌイーシーマイクロシステム株式会社 | テストパタンセット圧縮装置、方法及び記録媒体 |
| JP3621010B2 (ja) * | 1999-12-14 | 2005-02-16 | 日本電信電話株式会社 | ネットワーク管理方法及びシステム装置 |
| GB0007898D0 (en) | 2000-03-31 | 2000-05-17 | British Telecomm | Apparatus for optimising configuration parameters of a network |
| US7500143B2 (en) * | 2000-05-05 | 2009-03-03 | Computer Associates Think, Inc. | Systems and methods for managing and analyzing faults in computer networks |
| US7237138B2 (en) * | 2000-05-05 | 2007-06-26 | Computer Associates Think, Inc. | Systems and methods for diagnosing faults in computer networks |
| US6985845B1 (en) * | 2000-09-26 | 2006-01-10 | Koninklijke Philips Electronics N.V. | Security monitor of system runs software simulator in parallel |
| CA2359168A1 (fr) * | 2000-10-25 | 2002-04-25 | John Doucette | Conception de sous-reseaux mailles en chaine |
| JP3876692B2 (ja) | 2001-11-13 | 2007-02-07 | 株式会社日立製作所 | ネットワークシステム障害分析支援方法およびその方式 |
| EP1488652B1 (fr) | 2002-03-19 | 2006-11-29 | LCC International, Inc. | Procedes, appareil et systemes pour la simulation de trafic mixte dans un reseau sans fil |
| US7620535B2 (en) * | 2002-12-19 | 2009-11-17 | Computer Associates Think, Inc. | Method and apparatus for the simulation of computer networks |
| US20040151129A1 (en) * | 2003-01-31 | 2004-08-05 | Gyula Kun-Szabo | Controller for controlling routers |
| US7100081B1 (en) | 2003-10-09 | 2006-08-29 | Advanced Micro Devices, Inc. | Method and apparatus for fault classification based on residual vectors |
-
2004
- 2004-06-30 US US10/881,695 patent/US7583587B2/en active Active
-
2005
- 2005-01-31 AT AT05100630T patent/ATE350832T1/de not_active IP Right Cessation
- 2005-01-31 DK DK05100630T patent/DK1560366T3/da active
- 2005-01-31 EP EP05100630A patent/EP1560366B1/fr not_active Expired - Lifetime
- 2005-01-31 KR KR1020050008699A patent/KR101098744B1/ko not_active Expired - Fee Related
- 2005-01-31 ES ES05100630T patent/ES2279479T3/es not_active Expired - Lifetime
- 2005-01-31 CN CN2005100565258A patent/CN1665205B/zh not_active Expired - Fee Related
- 2005-01-31 DE DE602005000383T patent/DE602005000383T2/de not_active Expired - Lifetime
- 2005-01-31 JP JP2005024158A patent/JP4786908B2/ja not_active Expired - Fee Related
Cited By (2)
| Publication number | Priority date | Publication date | Assignee | Title |
|---|---|---|---|---|
| CN109218113A (zh) * | 2018-11-07 | 2019-01-15 | 吉林工程技术师范学院 | 通信网络故障定位方法及故障监测装置 |
| CN109218113B (zh) * | 2018-11-07 | 2021-09-24 | 吉林工程技术师范学院 | 通信网络故障定位方法及故障监测装置 |
Also Published As
| Publication number | Publication date |
|---|---|
| US20050169185A1 (en) | 2005-08-04 |
| DK1560366T3 (da) | 2007-05-14 |
| CN1665205B (zh) | 2010-09-29 |
| ATE350832T1 (de) | 2007-01-15 |
| JP4786908B2 (ja) | 2011-10-05 |
| ES2279479T3 (es) | 2007-08-16 |
| KR101098744B1 (ko) | 2011-12-23 |
| KR20060042903A (ko) | 2006-05-15 |
| DE602005000383D1 (de) | 2007-02-15 |
| JP2005223906A (ja) | 2005-08-18 |
| CN1665205A (zh) | 2005-09-07 |
| US7583587B2 (en) | 2009-09-01 |
| DE602005000383T2 (de) | 2007-04-26 |
| EP1560366A1 (fr) | 2005-08-03 |
Similar Documents
| Publication | Publication Date | Title |
|---|---|---|
| EP1560366B1 (fr) | Détection d'erreur et diagnostic | |
| US7613105B2 (en) | Methods and systems for removing data inconsistencies for a network simulation | |
| US7606165B2 (en) | What-if analysis for network diagnostics | |
| Qiu et al. | Troubleshooting wireless mesh networks | |
| Qiu et al. | Fault detection, isolation, and diagnosis in multihop wireless networks | |
| US11070441B2 (en) | Model training for on-premise execution in a network assurance system | |
| US10805185B2 (en) | Detecting bug patterns across evolving network software versions | |
| Ma et al. | Monitor placement for maximal identifiability in network tomography | |
| US20130163407A1 (en) | System and method for determining network element criticality | |
| CN114766089A (zh) | 基线化来自服务的子服务的服务标记数据以改进服务保证 | |
| JP2021010105A (ja) | 故障影響推定装置、故障影響推定方法、及びプログラム | |
| CN113541988B (zh) | 一种网络故障的处理方法及装置 | |
| Qiu et al. | Troubleshooting multihop wireless networks | |
| WO2025124097A1 (fr) | Procédé de localisation de défaillance et appareil | |
| Harsh et al. | Flock: Accurate network fault localization at scale | |
| Fezeu et al. | Anomalous model-driven-telemetry network-stream BGP detection | |
| Qi et al. | A survey of cloud network fault diagnostic systems and tools | |
| US7126964B1 (en) | Method and apparatus for network analysis, such as analyzing and correlating identifiers of frame relay circuits in a network | |
| US7792045B1 (en) | Method and apparatus for configuration and analysis of internal network routing protocols | |
| CN116319353A (zh) | 一种网络拓扑结构的检测方法、装置、设备及介质 | |
| CN116744331A (zh) | 关联对应于客户端设备的数据集 | |
| Akella et al. | A call to arms for management plane analytics | |
| Hao et al. | Fault management for networks with link state routing protocols | |
| Gupta et al. | NEWS: Towards an Early Warning System for Network Faults. | |
| Gabale | Wireless Mesh Network Management-Fault and Performance Diagnosis: A Survey |
Legal Events
| Date | Code | Title | Description |
|---|---|---|---|
| PUAI | Public reference made under article 153(3) epc to a published international application that has entered the european phase |
Free format text: ORIGINAL CODE: 0009012 |
|
| AK | Designated contracting states |
Kind code of ref document: A1 Designated state(s): AT BE BG CH CY CZ DE DK EE ES FI FR GB GR HU IE IS IT LI LT LU MC NL PL PT RO SE SI SK TR |
|
| AX | Request for extension of the european patent |
Extension state: AL BA HR LV MK YU |
|
| 17P | Request for examination filed |
Effective date: 20051229 |
|
| AKX | Designation fees paid |
Designated state(s): AT BE BG CH CY CZ DE DK EE ES FI FR GB GR HU IE IS IT LI LT LU MC NL PL PT RO SE SI SK TR |
|
| GRAP | Despatch of communication of intention to grant a patent |
Free format text: ORIGINAL CODE: EPIDOSNIGR1 |
|
| GRAS | Grant fee paid |
Free format text: ORIGINAL CODE: EPIDOSNIGR3 |
|
| GRAA | (expected) grant |
Free format text: ORIGINAL CODE: 0009210 |
|
| AK | Designated contracting states |
Kind code of ref document: B1 Designated state(s): AT BE BG CH CY CZ DE DK EE ES FI FR GB GR HU IE IS IT LI LT LU MC NL PL PT RO SE SI SK TR |
|
| PG25 | Lapsed in a contracting state [announced via postgrant information from national office to epo] |
Ref country code: SI Free format text: LAPSE BECAUSE OF FAILURE TO SUBMIT A TRANSLATION OF THE DESCRIPTION OR TO PAY THE FEE WITHIN THE PRESCRIBED TIME-LIMIT Effective date: 20070103 Ref country code: NL Free format text: LAPSE BECAUSE OF FAILURE TO SUBMIT A TRANSLATION OF THE DESCRIPTION OR TO PAY THE FEE WITHIN THE PRESCRIBED TIME-LIMIT Effective date: 20070103 Ref country code: AT Free format text: LAPSE BECAUSE OF FAILURE TO SUBMIT A TRANSLATION OF THE DESCRIPTION OR TO PAY THE FEE WITHIN THE PRESCRIBED TIME-LIMIT Effective date: 20070103 Ref country code: PL Free format text: LAPSE BECAUSE OF FAILURE TO SUBMIT A TRANSLATION OF THE DESCRIPTION OR TO PAY THE FEE WITHIN THE PRESCRIBED TIME-LIMIT Effective date: 20070103 Ref country code: LI Free format text: LAPSE BECAUSE OF FAILURE TO SUBMIT A TRANSLATION OF THE DESCRIPTION OR TO PAY THE FEE WITHIN THE PRESCRIBED TIME-LIMIT Effective date: 20070103 Ref country code: CH Free format text: LAPSE BECAUSE OF FAILURE TO SUBMIT A TRANSLATION OF THE DESCRIPTION OR TO PAY THE FEE WITHIN THE PRESCRIBED TIME-LIMIT Effective date: 20070103 |
|
| REG | Reference to a national code |
Ref country code: GB Ref legal event code: FG4D |
|
| PGFP | Annual fee paid to national office [announced via postgrant information from national office to epo] |
Ref country code: MC Payment date: 20070212 Year of fee payment: 3 |
|
| PGFP | Annual fee paid to national office [announced via postgrant information from national office to epo] |
Ref country code: AT Payment date: 20070213 Year of fee payment: 3 Ref country code: IE Payment date: 20070213 Year of fee payment: 3 |
|
| REF | Corresponds to: |
Ref document number: 602005000383 Country of ref document: DE Date of ref document: 20070215 Kind code of ref document: P |
|
| REG | Reference to a national code |
Ref country code: IE Ref legal event code: FG4D |
|
| PGFP | Annual fee paid to national office [announced via postgrant information from national office to epo] |
Ref country code: BE Payment date: 20070314 Year of fee payment: 3 |
|
| PG25 | Lapsed in a contracting state [announced via postgrant information from national office to epo] |
Ref country code: BG Free format text: LAPSE BECAUSE OF FAILURE TO SUBMIT A TRANSLATION OF THE DESCRIPTION OR TO PAY THE FEE WITHIN THE PRESCRIBED TIME-LIMIT Effective date: 20070403 |
|
| REG | Reference to a national code |
Ref country code: SE Ref legal event code: TRGR |
|
| PG25 | Lapsed in a contracting state [announced via postgrant information from national office to epo] |
Ref country code: IS Free format text: LAPSE BECAUSE OF FAILURE TO SUBMIT A TRANSLATION OF THE DESCRIPTION OR TO PAY THE FEE WITHIN THE PRESCRIBED TIME-LIMIT Effective date: 20070503 |
|
| REG | Reference to a national code |
Ref country code: DK Ref legal event code: T3 |
|
| PG25 | Lapsed in a contracting state [announced via postgrant information from national office to epo] |
Ref country code: PT Free format text: LAPSE BECAUSE OF FAILURE TO SUBMIT A TRANSLATION OF THE DESCRIPTION OR TO PAY THE FEE WITHIN THE PRESCRIBED TIME-LIMIT Effective date: 20070604 |
|
| NLV1 | Nl: lapsed or annulled due to failure to fulfill the requirements of art. 29p and 29m of the patents act | ||
| REG | Reference to a national code |
Ref country code: CH Ref legal event code: PL |
|
| ET | Fr: translation filed | ||
| REG | Reference to a national code |
Ref country code: ES Ref legal event code: FG2A Ref document number: 2279479 Country of ref document: ES Kind code of ref document: T3 |
|
| PLBE | No opposition filed within time limit |
Free format text: ORIGINAL CODE: 0009261 |
|
| STAA | Information on the status of an ep patent application or granted ep patent |
Free format text: STATUS: NO OPPOSITION FILED WITHIN TIME LIMIT |
|
| PG25 | Lapsed in a contracting state [announced via postgrant information from national office to epo] |
Ref country code: SK Free format text: LAPSE BECAUSE OF FAILURE TO SUBMIT A TRANSLATION OF THE DESCRIPTION OR TO PAY THE FEE WITHIN THE PRESCRIBED TIME-LIMIT Effective date: 20070103 |
|
| 26N | No opposition filed |
Effective date: 20071005 |
|
| PG25 | Lapsed in a contracting state [announced via postgrant information from national office to epo] |
Ref country code: RO Free format text: LAPSE BECAUSE OF FAILURE TO SUBMIT A TRANSLATION OF THE DESCRIPTION OR TO PAY THE FEE WITHIN THE PRESCRIBED TIME-LIMIT Effective date: 20070103 Ref country code: CZ Free format text: LAPSE BECAUSE OF FAILURE TO SUBMIT A TRANSLATION OF THE DESCRIPTION OR TO PAY THE FEE WITHIN THE PRESCRIBED TIME-LIMIT Effective date: 20070103 Ref country code: BE Free format text: LAPSE BECAUSE OF FAILURE TO SUBMIT A TRANSLATION OF THE DESCRIPTION OR TO PAY THE FEE WITHIN THE PRESCRIBED TIME-LIMIT Effective date: 20070103 |
|
| PG25 | Lapsed in a contracting state [announced via postgrant information from national office to epo] |
Ref country code: LT Free format text: LAPSE BECAUSE OF FAILURE TO SUBMIT A TRANSLATION OF THE DESCRIPTION OR TO PAY THE FEE WITHIN THE PRESCRIBED TIME-LIMIT Effective date: 20070103 |
|
| PG25 | Lapsed in a contracting state [announced via postgrant information from national office to epo] |
Ref country code: GR Free format text: LAPSE BECAUSE OF FAILURE TO SUBMIT A TRANSLATION OF THE DESCRIPTION OR TO PAY THE FEE WITHIN THE PRESCRIBED TIME-LIMIT Effective date: 20070404 |
|
| PG25 | Lapsed in a contracting state [announced via postgrant information from national office to epo] |
Ref country code: MC Free format text: LAPSE BECAUSE OF NON-PAYMENT OF DUE FEES Effective date: 20080131 |
|
| PG25 | Lapsed in a contracting state [announced via postgrant information from national office to epo] |
Ref country code: IE Free format text: LAPSE BECAUSE OF NON-PAYMENT OF DUE FEES Effective date: 20080131 Ref country code: EE Free format text: LAPSE BECAUSE OF FAILURE TO SUBMIT A TRANSLATION OF THE DESCRIPTION OR TO PAY THE FEE WITHIN THE PRESCRIBED TIME-LIMIT Effective date: 20070103 |
|
| PG25 | Lapsed in a contracting state [announced via postgrant information from national office to epo] |
Ref country code: CY Free format text: LAPSE BECAUSE OF FAILURE TO SUBMIT A TRANSLATION OF THE DESCRIPTION OR TO PAY THE FEE WITHIN THE PRESCRIBED TIME-LIMIT Effective date: 20070103 |
|
| PG25 | Lapsed in a contracting state [announced via postgrant information from national office to epo] |
Ref country code: LU Free format text: LAPSE BECAUSE OF NON-PAYMENT OF DUE FEES Effective date: 20070131 |
|
| PG25 | Lapsed in a contracting state [announced via postgrant information from national office to epo] |
Ref country code: TR Free format text: LAPSE BECAUSE OF FAILURE TO SUBMIT A TRANSLATION OF THE DESCRIPTION OR TO PAY THE FEE WITHIN THE PRESCRIBED TIME-LIMIT Effective date: 20070103 Ref country code: HU Free format text: LAPSE BECAUSE OF FAILURE TO SUBMIT A TRANSLATION OF THE DESCRIPTION OR TO PAY THE FEE WITHIN THE PRESCRIBED TIME-LIMIT Effective date: 20070704 |
|
| REG | Reference to a national code |
Ref country code: DE Ref legal event code: R082 Ref document number: 602005000383 Country of ref document: DE Representative=s name: GRUENECKER, KINKELDEY, STOCKMAIR & SCHWANHAEUS, DE |
|
| REG | Reference to a national code |
Ref country code: GB Ref legal event code: 732E Free format text: REGISTERED BETWEEN 20150115 AND 20150121 |
|
| REG | Reference to a national code |
Ref country code: DE Ref legal event code: R081 Ref document number: 602005000383 Country of ref document: DE Owner name: MICROSOFT TECHNOLOGY LICENSING, LLC, REDMOND, US Free format text: FORMER OWNER: MICROSOFT CORP., REDMOND, WASH., US Effective date: 20150126 Ref country code: DE Ref legal event code: R082 Ref document number: 602005000383 Country of ref document: DE Representative=s name: GRUENECKER, KINKELDEY, STOCKMAIR & SCHWANHAEUS, DE Effective date: 20150126 Ref country code: DE Ref legal event code: R082 Ref document number: 602005000383 Country of ref document: DE Representative=s name: GRUENECKER PATENT- UND RECHTSANWAELTE PARTG MB, DE Effective date: 20150126 |
|
| REG | Reference to a national code |
Ref country code: ES Ref legal event code: PC2A Owner name: MICROSOFT TECHNOLOGY LICENSING, LLC. Effective date: 20150709 |
|
| REG | Reference to a national code |
Ref country code: FR Ref legal event code: TP Owner name: MICROSOFT TECHNOLOGY LICENSING, LLC, US Effective date: 20150724 |
|
| REG | Reference to a national code |
Ref country code: FR Ref legal event code: PLFP Year of fee payment: 12 |
|
| REG | Reference to a national code |
Ref country code: FR Ref legal event code: PLFP Year of fee payment: 13 |
|
| PGFP | Annual fee paid to national office [announced via postgrant information from national office to epo] |
Ref country code: FI Payment date: 20170109 Year of fee payment: 13 |
|
| PGFP | Annual fee paid to national office [announced via postgrant information from national office to epo] |
Ref country code: DK Payment date: 20170110 Year of fee payment: 13 |
|
| REG | Reference to a national code |
Ref country code: FR Ref legal event code: PLFP Year of fee payment: 14 |
|
| REG | Reference to a national code |
Ref country code: DK Ref legal event code: EBP Effective date: 20180131 |
|
| PG25 | Lapsed in a contracting state [announced via postgrant information from national office to epo] |
Ref country code: FI Free format text: LAPSE BECAUSE OF NON-PAYMENT OF DUE FEES Effective date: 20180131 |
|
| PG25 | Lapsed in a contracting state [announced via postgrant information from national office to epo] |
Ref country code: DK Free format text: LAPSE BECAUSE OF NON-PAYMENT OF DUE FEES Effective date: 20180131 |
|
| PGFP | Annual fee paid to national office [announced via postgrant information from national office to epo] |
Ref country code: IT Payment date: 20190121 Year of fee payment: 15 Ref country code: ES Payment date: 20190201 Year of fee payment: 15 |
|
| PGFP | Annual fee paid to national office [announced via postgrant information from national office to epo] |
Ref country code: SE Payment date: 20190110 Year of fee payment: 15 |
|
| REG | Reference to a national code |
Ref country code: SE Ref legal event code: EUG |
|
| PG25 | Lapsed in a contracting state [announced via postgrant information from national office to epo] |
Ref country code: SE Free format text: LAPSE BECAUSE OF NON-PAYMENT OF DUE FEES Effective date: 20200201 |
|
| PG25 | Lapsed in a contracting state [announced via postgrant information from national office to epo] |
Ref country code: IT Free format text: LAPSE BECAUSE OF NON-PAYMENT OF DUE FEES Effective date: 20200131 |
|
| REG | Reference to a national code |
Ref country code: ES Ref legal event code: FD2A Effective date: 20210607 |
|
| PG25 | Lapsed in a contracting state [announced via postgrant information from national office to epo] |
Ref country code: ES Free format text: LAPSE BECAUSE OF NON-PAYMENT OF DUE FEES Effective date: 20200201 |
|
| REG | Reference to a national code |
Ref country code: DE Ref legal event code: R079 Ref document number: 602005000383 Country of ref document: DE Free format text: PREVIOUS MAIN CLASS: H04L0012240000 Ipc: H04L0041000000 |
|
| PGFP | Annual fee paid to national office [announced via postgrant information from national office to epo] |
Ref country code: FR Payment date: 20211214 Year of fee payment: 18 |
|
| P01 | Opt-out of the competence of the unified patent court (upc) registered |
Effective date: 20230505 |
|
| PG25 | Lapsed in a contracting state [announced via postgrant information from national office to epo] |
Ref country code: FR Free format text: LAPSE BECAUSE OF NON-PAYMENT OF DUE FEES Effective date: 20230131 |
|
| PGFP | Annual fee paid to national office [announced via postgrant information from national office to epo] |
Ref country code: GB Payment date: 20231219 Year of fee payment: 20 |
|
| PGFP | Annual fee paid to national office [announced via postgrant information from national office to epo] |
Ref country code: DE Payment date: 20231219 Year of fee payment: 20 |
|
| REG | Reference to a national code |
Ref country code: DE Ref legal event code: R071 Ref document number: 602005000383 Country of ref document: DE |
|
| REG | Reference to a national code |
Ref country code: GB Ref legal event code: PE20 Expiry date: 20250130 |
|
| PG25 | Lapsed in a contracting state [announced via postgrant information from national office to epo] |
Ref country code: GB Free format text: LAPSE BECAUSE OF EXPIRATION OF PROTECTION Effective date: 20250130 |