EP1052499A1 - Verfahren und Vorrichtung für Ramanspektroskopische Analyse von schwarzen Kunststoffen - Google Patents
Verfahren und Vorrichtung für Ramanspektroskopische Analyse von schwarzen Kunststoffen Download PDFInfo
- Publication number
- EP1052499A1 EP1052499A1 EP99109634A EP99109634A EP1052499A1 EP 1052499 A1 EP1052499 A1 EP 1052499A1 EP 99109634 A EP99109634 A EP 99109634A EP 99109634 A EP99109634 A EP 99109634A EP 1052499 A1 EP1052499 A1 EP 1052499A1
- Authority
- EP
- European Patent Office
- Prior art keywords
- range
- fiber head
- fiber
- laser
- plastics
- Prior art date
- Legal status (The legal status is an assumption and is not a legal conclusion. Google has not performed a legal analysis and makes no representation as to the accuracy of the status listed.)
- Withdrawn
Links
Images


Classifications
-
- G—PHYSICS
- G01—MEASURING; TESTING
- G01N—INVESTIGATING OR ANALYSING MATERIALS BY DETERMINING THEIR CHEMICAL OR PHYSICAL PROPERTIES
- G01N21/00—Investigating or analysing materials by the use of optical means, i.e. using sub-millimetre waves, infrared, visible or ultraviolet light
- G01N21/62—Systems in which the material investigated is excited whereby it emits light or causes a change in wavelength of the incident light
- G01N21/63—Systems in which the material investigated is excited whereby it emits light or causes a change in wavelength of the incident light optically excited
- G01N21/65—Raman scattering
Definitions
- the invention relates to a method and a device for the Raman spectroscopic analysis of black plastics. Especially, the invention provides a method and a device that can be used for the identification of the polymer type and of the presence of additives, such as halogenated flame retardants, in black plastics.
- black plastics denotes, in the context of this invention, plastics comprising carbon fillers.
- Carbon fillers such as e.g. carbon black
- carbon fillers are commonly used as an additive in the field of plastics production and give a dark or black color to the respective products.
- the amount of carbon fillers added to the polymeric products depends on the actual use thereof.
- black plastics can have a content of carbon fillers of up to 20 wt.% and higher. In most cases, however, the content will be in the range of 0.1 to 2 wt.%.
- Plastics are commercially used since 1869. In the year 1994, the world plastics production amounted to about 113 million tons (Kunststoffe 85, 1761 (1995)). The outstanding commercial success of this material may be attributed to e.g. the low costs of the raw material, the high durability and the versatility of use.
- Plastics are almost fully resistant to biological degradation so that the disposal of increasing amounts of plastic waste on garbage dumps finally may result in a collapse of waste disposal systems in many industrialized countries.
- plastic recycling will strongly depend on economic factors and, especially, on the price of recovered plastics which, in turn, depends on the costs of the sorting process necessary to obtain pure plastics (pure in terms of the homogeneity of the polymer type) from a mixture of post-consumer plastic waste.
- sorting techniques known in the art such as density-sorting, electrical-sorting, magnetical-sorting or size-sorting are not based on chemical but on physical characteristics of the plastic material so that a sorting according to the polymer type cannot be achieved.
- halogenated flame retardants are commonly used in housings of electronic sets such as television sets, video recorders, computer monitors and in insulating materials used for the insulation of electric cables, cable pits and so on.
- halogenated flame retardants are polybrominated diphenyl ethers (PBDE) and tetrabromobisphenol A (TBBA).
- PBDE polybrominated diphenyl ethers
- TBBA tetrabromobisphenol A
- NIR near infrared
- MIR (mid infrared) reflection spectroscopy relies on the effect of direct reflection of infrared light from the sample.
- polymer resins can be identified with acceptable reliability.
- the quality of the results is strongly affected by the presence of contaminants such as dirt, oil, grease or even water on the surface of the sample to be analyzed: Such contaminants increase the absorption, thereby lowering the reflection intensity.
- this method is highly sensitive to size, geometry and surface roughness parameters of the sample, thus hampering the analysis especially of small, shredded material and of material having a rough surface.
- this method requires an exact positioning of the sample with respect to the optical measuring device. Currently the identification of flame retardents is facing difficulties using this technique.
- Mass spectroscopy has the disadvantage of long acquisition times (up to one minute) and a low separation effect and will be difficult to automize on an industrial level.
- Pyrolysis MIR cannot identify flame retardants. Furthermore, pyrolysis of plastics may result in the release of dioxines.
- Raman spectroscopy is, in view of the underlying physical principles, a complementary technique to infrared spectroscopy.
- a method for rapid sorting of materials by polymer type comprising the steps of conveying said materials to the measuring device, irradiating the material with light from a laser diode to induce Raman emission, collecting the reflected light, performing a spectroscopic analysis of the collected light to determine its Raman spectrum, comparing said Raman spectrum with a database of spectra of known polymer types in order to identify the polymer type of the sample and sorting the material according to the polymer type identified.
- the Raman identification system described in WO 98/19800 has four main components: A laser diode, a probe head, a spectrograph including a spectroscope and a charge-coupled device detector, and a microprocessor based controller.
- the center wavelength of the laser is 785 nm and the preferred focal length of the collection lens is 35 mm.
- the system was substantially insensitive to sample positioning over a 12 mm range.
- the method described above has the disadvantage that the polymer matrix of black plastics cannot be identified with sufficient reliability. Furthermore, it is not possible to identify flame retardants in black plastics.
- this method should be based on an analytical technique that is non-destructive and does not require a physical contact between the sample and the measuring device.
- the method should be insensitive to size, geometry and surface roughness of the sample and should not require long acquisition times, thus being usable in high-throughput sorting processes for the recovery of post-consumer plastics on an industrial scale.
- a method for the analysis of black plastics by Raman spectroscopy comprising the steps of (a) irradiating black plastics with monochromatic laser light via a fiber head, the fiber head being coupled to the laser, which generates said monochromatic laser light, by an optical fiber coupling, (b) collecting light reflected from said plastics by said fiber head via a fiber head objective, (c) leading the collected light to a spectroscope via an optical fiber coupling and (d) performing spectroscopic analysis of the collected light to determine its Raman spectrum, wherein the wavelength of said monochromatic laser light is selected in the range of 640 nm to 950 nm and the numerical aperture NA of said fiber head objective is selected in the range of 0.6 ⁇ NA ⁇ 1.
- the working distance i.e. the distance between the sample to be analyzed and the fiber head objective, is selected within the range of 5 mm to 100 mm.
- a device for the analysis of black plastics by Raman spectroscopy comprising a laser (1) providing monochromatic light of a wavelength selected in the range of 640 nm to 950 nm, a fiber head (4) coupled to said laser via an optical fiber coupling (3), the fiber head (4) comprising a fiber head objective (5) having a numerical aperture NA within the range of 0.6 ⁇ NA ⁇ 1.0, and a spectrograph (2) coupled to said fiber head (4) via a fiber coupling (7).
- the laser is a laser diode.
- said method and device are especially useful in high-throughput sorting processes for the recovery of post-consumer plastics even on an industrial scale.
- the acquisition time necessary for obtaining the spectral data is short (within a few seconds) and the method is non-destructive, insensitive to size, geometry and roughness of the plastic products to be analyzed and allows an analysis without physical contact between sample and measuring device.
- cost-effective recovery even of black plastics can be achieved.
- the identification of halogenated flame retardants allows a sorting according to the presence or even the type of such additives.
- the Raman effect is based on an inelastic scattering process of light taking place upon interaction of light with a sample.
- a single photon interacting with a molecule of the sample is scattered and loses energy during the scattering event. Due to the principle of energy conservation, the difference in energy between the original and the scattered photons corresponds to the excited vibrational quantum energy of the molecule in the sample. The loss of energy results in a higher wavelength/lower energy of the scattered light/photon. Since the energy states of a molecule are quantized and depend on molecular properties, discrete wavelength shifts from the excitation light wavelength will be observed, the respective wavelength shifts and the resulting pattern of wavelength shifts being dependent on molecular properties of the sample. Thus, the resulting vibrational Raman spectrum provides characteristic "finger prints" of the different molecular species making up the sample. By comparing the resulting spectrum with reference spectra of known molecules, said molecular species can be identified.
- the fiber head is coupled to the measuring device and, optionally, to the light emitting device, by a fiber coupling comprising one or more optical fibers.
- this method comprises the selection of an excitation wavelength within the range of 640 nm to 950 nm, preferably in the range of 650 nm to 900 nm, more preferably in the range of 700 nm to 800 nm and, in an especially preferred embodiment, an excitation wavelength of 752 nm or 785 nm.
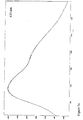
- Fig. 1 the results of an experiment illustrating the excitation wavelength dependency are shown.
- Raman spectra of a black colored sample made of HIPS (high impact polystyrene), comprising carbon fillers in an amount of ⁇ 2 wt.% have been recorded at three different excitation wavelengths.
- the parameters numerical aperture of the fiber head objective and working distance were set into the ranges as disclosed above.
- a prefered value of the numerical aperture was 0.90 for an excitation wavelength of 785 nm and 633 nm, respectively.
- the Fourier Transformation spectrameter is not using by principle an objective, but directly reflection-transmission lenses and beamsplitters instead.
- Fig. 1a the Raman spectrum obtained at the excitation wavelength 633 nm is shown. Clearly, no discrete wavelength shifts and no band pattern can be obtained under these conditions. It is assumed that this effect is caused by fluorescence emissions due to electronic transitions. This fluorescence phenomenon results in a strong background overlaying the Raman scattering signal so that no useful information can be extracted from such data.
- Fig. 1c Raman spectra obtained with five test samples at the excitation wavelength 1010 nm is shown. In this case, a strong and broad signal at about 3200 cm -1 is observed. Although a band pattern allowing the identification of polymer types and/or halogenated flame retardants would be expected to be located far apart in the wavenumber range of 300 to 1700 cm- 1 , spectral information cannot be obtained under these conditions, either, because FT (Fourier transformation) analysis of the obtained spectral data is impeded. Thus, FT spectrographs working at an excitation wavelength of about 1000 nm are not suitable for the analysis of black plastics.
- the appearance of the signal at about 3200 cm -1 can be explained as follows: At an excitation wavelength of about 1000 nm, the sample is heated by the irradiated light, resulting in thermal emissions which give rise to a broad and unspecific band in the resulting spectrum.
- Fig. 1b shows the spectrum obtained by using an excitation wavelength of 752 nm.
- a pattern of well defined bands allowing an identification of the polymer type is obtained.
- the strong band at about 1000 cm -1 is known to result from symmetric vibrations of a benzene ring, thus indicating a phenyl group.
- the band at about 1600 cm -1 results from symmetric stretching vibrations of C-C bonds and the bands at about 3000 cm -1 and in the range of about 1350 cm -1 to 1470 cm -1 from C-H bonds.
- the type of polymer(s) present in the sample can be determined. Conventionally, this is done by means of a microprocessor comparing the spectral data obtained from the sample to be analyzed with spectral data of various polymer types stored in a database. Programs, algorithms, memory allocations, database organizations, subroutines for baseline correction and normalization and so on are known in the art and described e.g. in WO 98/19800, EP-A-0 764 844, and Spectroscopy 51 , 11(6).
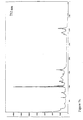
- Fig. 2a and 2b differ only in the wavenumber range of below 500 cm -1 .
- the additional low frequency vibration band seen in Fig. 2b in this range can be assigned to C-Br stretching vibrations, the C-Br group being part of the polybrominated biphenyl ether.
- a numerical aperture of greater than 0.6 preferably in the range of 0.7 to 1.0, more preferably in the range of 0.8 to 1.0 and most preferably in the range of 0.9 to 1.0 has to be used in the method according to the invention.
- a state of the art device employing a fiber head objective having a numerical aperture of 0.55 and equipped with fiber optics for non-contact measurements (fiber head objective X 50, lense f40, average laser power ⁇ 30 mW, measurement time > 60 s, gratings 1800 and 600 lines/mm, detector: CCD 1150 x 300, spectrograph aperture ratio F/2, focal length 150 mm/Czerny type, resolution 5-8 cm -1 , fiber optics 100 ⁇ m) has been used. Even at the optimal wavelength of 785 nm only 20 % of the test samples could be identified (total number of samples used 20, consisting of 5 different polymer types with and without flame retardents). This rate could be improved to more than 80% by selecting a numerical aperture of greater than 0.6. For example, a numerical aperture of 0.8 yields to a rate of 80%.
- the fiber coupling which optically couples the fiber head objective to the spectrograph can be a mono fiber (a single fiber) or a multi fiber (bundle of several fibers). Moreover, the fiber or fibers can be of the mono-mode or multi-mode-type. Additional parameters are the fiber diameter, the optical aperture of the fiber and the background of the fiber medium.
- Optical fibers having diameters between 5 nm and 800 nm and an aperture of about 0.2 to 0.3, depending on the wavelength, are known in the art. Bundles of many single fibers or single fibers with large diameter (multimode fibers), e.g. 250 ⁇ m, have the advantage that they can capture a lot of scattered light. In contrast thereto, single fibers with small diameter (monomode fibers), e.g. 8 ⁇ m, have less internal losses.
- the selection of an appropriate fiber coupling configuration primarily depends on the configuration of the devices to which they are connected, i.e. the fiber head and the spectrograph. In general, it should be taken into consideration that the amount of light collected after reflection from the sample and to be coupled into the optical fiber increases with core diameter and numerical aperture. Fiber head alignment tolerances also increase with fiber core diameter, so it is advantageous to use the largest collection fiber that the spectrograph can efficiently handle.
- the scattered Raman intensity is in the order of 1.000.000 times less than the excitation laser intensity. Arrangements serving these functions are known in the art. An example can be seen in WO 98/19800.
- the spectrograph may be any spectrograph suitable for Raman spectroscopic analysis and, especially, a Czerny-Turner- or axial transmission spectrograph.
- a focal length of the spectrograph of 100 mm to 300 mm and, in particular, of about 150 mm is preferred.
- a low photographic aperture provides for higher optical throughput and more efficient light delivery from the aperture of the optical fiber to the detector.
- a spectrograph having a large focal length cannot effectively deliver the light from the optical fiber to a target as small as the CCD pixels. Besides, this allows a reduction of the weight and dimensions of the spectrograph.
- the sort of fiber coupling should be taken into account.
- a fiber of a diameter of e.g. 400 ⁇ m and the entrance of the spectrograph is in the range of 50 to 100 ⁇ m it will be difficult to get the whole amount of light into the spectrograph.
- intensity collected from the sample will obviously get lost.
- mechanical adjustment at the coupling interface will be very critical. This is one reason why mono mode fibers are mostly used in connection with arrangements using a microscope instead of a fiber head.
- One solution to optimize the coupling of the spectrograph to the light collection optics is to use an optical fiber comprising a cylindrical arrangement of many fibers at the collection point at the sample and to align the fibers at the entry to the spectrograph into a one dimension line arrangement to fit the entrance slit having dimensions of few millimeters times a varying width of typically 300 ⁇ m to 30 ⁇ m in order to achieve a better resolution.
- the definition of the operating wavelength region, the dispersion and the resolution of the entire system is determined to a decisive extent by the spectrograph grating.
- the selection of the grating depends on the wavelength range of interest and the desired dispersion to be achieved.
- the dispersion has to be matched to the focal length of the spectrograph and the size of the CCD detector.
- the lack on angular dispersion due to the small dimensions of the spectrograph, in case of a 150 mm focal length for example, can be compensated by the choice of the appropriate grating.
- the dispersion has to be as large as possible.
- the wavelength range of interest can be defined to be limited between wavenumbers of from about 100 cm -1 to 3200 cm -1 , which is sufficient for almost all organic compounds and polymers.
- the above disadvantages can be overcome by the use of only one reflection holographic grating which has high efficiency and high dispersion over the whole range and a low grating density of 150 to 600 lines/mm.
- holographic gratings also normal diffraction gratings can be used.
- spectroscopic identification of plastics does not generally request high spectral resolution.
- a spectral resolution range of about 6 to 12, more specifically 7 to 10 wavenumbers (cm -1 ) has been found to be sufficient for the identification of most polymers and additives.
- a grating density of 150 to 600, preferably of 150 to 300 lines/mm may be sufficient to perform the method according to the invention with only one grating within the spectrograph.
- examples of CCD detectors are 2048 element linear silicon CCD or deep depletion of front illuminated CCD, operating at 20°C or 70°C.
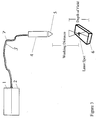
- this device comprises a laser (1) for the generation of monochromatic light, preferably a laser diode. Furthermore, the device comprises a spectrograph (2) for the analysis of the Raman emission after irradiation with said monochromatic light.
- the spectrograph (2) can be located in the same housing as the laser (1), as indicated in Fig. 3, or can be arranged separately.
- the monochromatic light emitted by the laser has a wavelength in the range of 640 nm to 950 nm.
- excitation light generated by a laser diode e.g. a SDL laser diode, 30 mW maximal output power
- having a wavelength of 752 nm gives particularly good results.
- the spectrograph (2) may be a conventional spectrograph commonly used for the analysis of Raman emissions.
- a spectrograph comprises a spectroscope which separates light into its spectral components, preferably a spectroscope having a focal length in the range of 100 to 300 mm, more preferably of about 150 mm.
- the aperture of the spectroscope is preferably selected in the range of F/1 to F/2, more preferably F/1.4.
- the spectroscope comprises one grating.
- the grating density is preferably selected in the range of 150 lines/mm to 600 lines/mm, more preferably in the range of 150 lines/mm to 300 lines/mm.
- the resolution may be in the range of 6 cm -1 to 12 cm -1 , more preferably in the range of 7 cm-1 to 10 cm-1. Under these conditions, the analysis of a wavenumber range of about 100 cm -1 to 3200 cm -1 with one single grating is feasible.
- a low density grating (below 600 lines/mm), with low resolution for example preferably around 10 cm -1 to identify polymers which usually show distinct and broad bands by covering a broad frequency range as mentioned 100 cm -1 to 3200 cm -1 or one can use a higher density grating (above 600 lines/mm) to achieve higher resolution typically down to 4 cm -1 for example in order to measure flame retardents which are usually showing weaker and smaller bands.
- a higher density grating above 600 lines/mm
- the spectrograph comprises a means converting the spectral information into data signals, e.g. a CCD, and a microprocessor based controller processing and analyzing the data signals.
- this controller is suitably equipped for performing an identification of polymer types and/or additives by comparing the data obtained from the spectral information - optionally after application of base line correction and normalization routines - with respective data comprised in a data base.
- Respective hardware and software suitable for this purpose is commonly known in the field of analytical spectroscopy.
- the device shown in Fig. 3 comprises a fiber head (4) which has two functions: Firstly, the fiber head (4) receives, via an optical fiber (3), the light generated by the laser (1) and irradiates the light, via a fiber head objective (5), onto the sample (6). Secondly, the light emitted from the sample (6) after irradiation is collected by the fiber head objective (5) in the fiber head (4) and passed into an optical fiber coupling (7) connecting the fiber head (4) to the spectrograph (2).
- the fibers 3,7 are guited into a single fiber supporting shell (8).
- the fiber head objective (5) serves to focus the monochromatic light onto the sample (6) and to recollect the light emitted from the sample (the Raman emission).
- the fiber head objective (5) has a high numerical aperture NA, i.e. 0.6 ⁇ NA ⁇ 1.0, more preferably 0.7 ⁇ NA ⁇ 1.0, more preferably 0.8 ⁇ NA ⁇ 1.0 and most preferably 0.9 ⁇ NA ⁇ 1.0.
- the fiber head (4) is connected to the source of monochromatic light (e.g. the laser diode) and to the spectrograph (2) by optical fiber couplings (3) and (7).
- Said optical fiber couplings (3) and (7) optionally provided as a single bundle, as shown in Fig. 3, have the function of guiding the monochromatic light to the fiber head (4) and of directing the collected scattered light emitted by the sample (6) back to the spectrograph (2).
- the optical fibers making up the fiber couplings (3) and (7) can be of the mono-mode or multi-mode type and can be mono fibers or multi fibers.
- the fiber diameter of the optical fiber or fibers coupling the fiber head to the spectroscope is preferably in the range of 50 ⁇ m to 200 ⁇ m.
- the fiber head comprises optical arrangements to direct the laser light onto the sample and to couple the collected scattered light from the objective back to the fiber optic.
- the laser light is efficiently blocked out at the excitation wavelength.
- Fiber head arrangements are known in the art and are shown e.g. in WO 98/19800.
- the size of the fiber head can be relatively small, e.g. not greater than 20 cm in length and about 3 cm in diameter.
- Such a small size optical fiber head can be installed in recognition and sorting devices as required by the actual arrangement of measuring device and conveyor means supplying the samples to be analysed.
- the fiber head may be attached to a fixed or flexible support or may even be maneuvered manually, as a "hand holded" device.
- the small size of the fiber head and the spatial separation of the fiber head on the one side and the light generation device and spectrograph on the other side, as shown in Fig. 3, makes it possible to control the working distance between sample and measuring device in the above preferred range of 5 mm to 100 mm.
- the method according to the invention can successfully be employed not only on a laboratory scale but even in industrial high-throughput sorting procedures for the recovery of post-consumer plastics.
- the device according to the invention can be employed in conventional sorting systems comprising, in addition to the above device, e.g. a feed conveyor for conveying the material to be sorted and a sorter performing sorting according to the data provided by the measuring device.
- the working distance is preferably selected in the range of 5 mm to 200 mm, more preferably in the range of 20 mm to 50 mm.
- larger working distances might become feasible as detection devices having higher sensitivities for Raman emissions than the spectroscopes commonly used in the present state of the art become available.
- the parameters excitation wavelength and numerical aperture of the fiber head objective are selected within the ranges disclosed above, an appropriate depth of the field will be achieved.
- the depth of the field depends on the characteristics of the objective and of the sample. It has been found by the inventors that the depth of the field, schematically shown in Fig. 3, should be in the range of about ⁇ 2 mm to ⁇ 5 mm with respect to the focal spot.
- a relatively large focal spot size in the range of 10 ⁇ m to 200 ⁇ m and a relatively low laser power on the sample surface i.e. lower than 200 mW and, especially, in the range of 10 mW to 200 mW. That means, that even if a I Watt laser in used at a working distance of 40 mm, for example, the power on the sample surface does not have to exceed 200 mW. Also a high power laser diode up to 5 Watt can be used at a suitable working distance, for example.
- a depth of the optical field, a focal laser spot size and a laser power on the sample surface can be realized which render it possible to obtain Raman spectroscopic information even from black plastics, independent of size, geometry and surface roughness of the sample, and which do not cause a burning of the sample during the irradiation.
- the spectroscopic data allows the identification of the polymer type as well as the detection of additives such as halogenated flame retardants in black plastics.
Landscapes
- Health & Medical Sciences (AREA)
- Nuclear Medicine, Radiotherapy & Molecular Imaging (AREA)
- Physics & Mathematics (AREA)
- Life Sciences & Earth Sciences (AREA)
- Chemical & Material Sciences (AREA)
- Analytical Chemistry (AREA)
- Biochemistry (AREA)
- General Health & Medical Sciences (AREA)
- General Physics & Mathematics (AREA)
- Immunology (AREA)
- Pathology (AREA)
- Investigating, Analyzing Materials By Fluorescence Or Luminescence (AREA)
- Sorting Of Articles (AREA)
Priority Applications (2)
| Application Number | Priority Date | Filing Date | Title |
|---|---|---|---|
| EP99109634A EP1052499A1 (de) | 1999-05-14 | 1999-05-14 | Verfahren und Vorrichtung für Ramanspektroskopische Analyse von schwarzen Kunststoffen |
| JP2000142341A JP2000356595A (ja) | 1999-05-14 | 2000-05-15 | ラマン分光分析方法及び装置並びに選別装置 |
Applications Claiming Priority (1)
| Application Number | Priority Date | Filing Date | Title |
|---|---|---|---|
| EP99109634A EP1052499A1 (de) | 1999-05-14 | 1999-05-14 | Verfahren und Vorrichtung für Ramanspektroskopische Analyse von schwarzen Kunststoffen |
Publications (1)
| Publication Number | Publication Date |
|---|---|
| EP1052499A1 true EP1052499A1 (de) | 2000-11-15 |
Family
ID=8238181
Family Applications (1)
| Application Number | Title | Priority Date | Filing Date |
|---|---|---|---|
| EP99109634A Withdrawn EP1052499A1 (de) | 1999-05-14 | 1999-05-14 | Verfahren und Vorrichtung für Ramanspektroskopische Analyse von schwarzen Kunststoffen |
Country Status (2)
| Country | Link |
|---|---|
| EP (1) | EP1052499A1 (de) |
| JP (1) | JP2000356595A (de) |
Cited By (6)
| Publication number | Priority date | Publication date | Assignee | Title |
|---|---|---|---|---|
| WO2006003551A1 (en) * | 2004-07-02 | 2006-01-12 | Koninklijke Philips Electronics N.V. | Spectroscopic system with multiple probes |
| FR2963830A1 (fr) * | 2010-08-16 | 2012-02-17 | Saimu Corp | Dispositif destine a recevoir des signaux de diffusion de raman et procede pour ce faire |
| CN104165944A (zh) * | 2014-08-15 | 2014-11-26 | 广州衡创测试技术服务有限公司 | 一种电子电器产品中六溴苯的检测方法 |
| CN109647733A (zh) * | 2018-11-30 | 2019-04-19 | 安徽东鸣智能存储设备有限公司 | 一种基于工业ccd的视觉识别分拣系统 |
| US10533943B2 (en) | 2015-02-06 | 2020-01-14 | Unisensor Sensorsysteme Gmbh | Method and apparatus for identifying plastics and/or the additives therein |
| CN114850078A (zh) * | 2022-05-23 | 2022-08-05 | 安徽大学 | 一种基于拉曼光谱的暗色塑料材质分选装置系统 |
Families Citing this family (6)
| Publication number | Priority date | Publication date | Assignee | Title |
|---|---|---|---|---|
| EP1761766A1 (de) * | 2004-06-17 | 2007-03-14 | Koninklijke Philips Electronics N.V. | Kombinierte ultraschallabbildungs- und spektroskopische molekulare analyse |
| JP4637643B2 (ja) * | 2005-05-18 | 2011-02-23 | 日本分光株式会社 | 分光分析装置 |
| JP5229201B2 (ja) * | 2009-12-07 | 2013-07-03 | 三菱電機株式会社 | プラスチックの識別装置およびその方法 |
| JP5229204B2 (ja) * | 2009-12-11 | 2013-07-03 | 三菱電機株式会社 | プラスチックの識別装置およびその識別方法 |
| JP5425131B2 (ja) * | 2011-03-29 | 2014-02-26 | 三菱電機株式会社 | ラマン分光装置およびそれを用いた識別装置 |
| JP5542789B2 (ja) * | 2011-12-19 | 2014-07-09 | 三菱電機株式会社 | リサイクルプラスチックの識別装置、分別装置、識別方法および製造方法 |
Citations (4)
| Publication number | Priority date | Publication date | Assignee | Title |
|---|---|---|---|---|
| WO1996000621A1 (de) * | 1994-06-29 | 1996-01-11 | Institut für Chemo- und Biosensorik Münster E.V. | Verfahren und vorrichtung zum erkennen, sortieren und/oder trennen verschiedener stoffe bzw. gegenstände |
| WO1996029925A2 (en) * | 1995-03-27 | 1996-10-03 | Massachusetts Institute Of Technology | Apparatus and methods of raman spectroscopy for analysis of blood gases and analytes |
| WO1998019800A1 (en) * | 1996-11-04 | 1998-05-14 | National Recovery Technologies, Inc. | Application of raman spectroscopy to identification and sorting of post-consumer plastics for recycling |
| WO1999001750A1 (en) * | 1997-07-02 | 1999-01-14 | Spectra Code, Inc. | Raman system for rapid sample identification |
-
1999
- 1999-05-14 EP EP99109634A patent/EP1052499A1/de not_active Withdrawn
-
2000
- 2000-05-15 JP JP2000142341A patent/JP2000356595A/ja not_active Withdrawn
Patent Citations (4)
| Publication number | Priority date | Publication date | Assignee | Title |
|---|---|---|---|---|
| WO1996000621A1 (de) * | 1994-06-29 | 1996-01-11 | Institut für Chemo- und Biosensorik Münster E.V. | Verfahren und vorrichtung zum erkennen, sortieren und/oder trennen verschiedener stoffe bzw. gegenstände |
| WO1996029925A2 (en) * | 1995-03-27 | 1996-10-03 | Massachusetts Institute Of Technology | Apparatus and methods of raman spectroscopy for analysis of blood gases and analytes |
| WO1998019800A1 (en) * | 1996-11-04 | 1998-05-14 | National Recovery Technologies, Inc. | Application of raman spectroscopy to identification and sorting of post-consumer plastics for recycling |
| WO1999001750A1 (en) * | 1997-07-02 | 1999-01-14 | Spectra Code, Inc. | Raman system for rapid sample identification |
Cited By (8)
| Publication number | Priority date | Publication date | Assignee | Title |
|---|---|---|---|---|
| WO2006003551A1 (en) * | 2004-07-02 | 2006-01-12 | Koninklijke Philips Electronics N.V. | Spectroscopic system with multiple probes |
| US7557916B2 (en) | 2004-07-02 | 2009-07-07 | Koninklijke Philips Electronics N.V. | Spectroscopic system with multiple probes |
| FR2963830A1 (fr) * | 2010-08-16 | 2012-02-17 | Saimu Corp | Dispositif destine a recevoir des signaux de diffusion de raman et procede pour ce faire |
| ES2398822R1 (es) * | 2010-08-16 | 2013-12-26 | Saimu Corp | Aparato para recibir senales de dispersion raman y metodo correspondiente. |
| CN104165944A (zh) * | 2014-08-15 | 2014-11-26 | 广州衡创测试技术服务有限公司 | 一种电子电器产品中六溴苯的检测方法 |
| US10533943B2 (en) | 2015-02-06 | 2020-01-14 | Unisensor Sensorsysteme Gmbh | Method and apparatus for identifying plastics and/or the additives therein |
| CN109647733A (zh) * | 2018-11-30 | 2019-04-19 | 安徽东鸣智能存储设备有限公司 | 一种基于工业ccd的视觉识别分拣系统 |
| CN114850078A (zh) * | 2022-05-23 | 2022-08-05 | 安徽大学 | 一种基于拉曼光谱的暗色塑料材质分选装置系统 |
Also Published As
| Publication number | Publication date |
|---|---|
| JP2000356595A (ja) | 2000-12-26 |
Similar Documents
| Publication | Publication Date | Title |
|---|---|---|
| US6310686B1 (en) | Raman probe with spatial filter and semi-confocal lens | |
| US5739536A (en) | Fiber optic infrared cone penetrometer system | |
| US5952660A (en) | Method of identifying post consumer or post industrial waste carpet utilizing a hand-held infrared spectrometer | |
| US7692775B2 (en) | Time and space resolved standoff hyperspectral IED explosives LIDAR detection | |
| EP1052499A1 (de) | Verfahren und Vorrichtung für Ramanspektroskopische Analyse von schwarzen Kunststoffen | |
| US6707548B2 (en) | Systems and methods for filter based spectrographic analysis | |
| EP2618127B1 (de) | Verfahren zur bestimmung eines feuerfesten mittels auf brombasis, vorrichtung zur bestimmung eines feuerfesten mittels auf brombasis, recyclingverfahren und recyclingvorrichtung | |
| JP4203916B2 (ja) | プラスチックの識別方法および識別装置 | |
| JP5265632B2 (ja) | プラスチック等識別装置およびプラスチック等識別方法 | |
| CN101072993A (zh) | 用于生物试样化学成像的装置和方法 | |
| CN1221799C (zh) | 采用手持式红外光谱仪鉴定消费者或工业用过的废弃毡层的方法和装置 | |
| US7221450B2 (en) | Dual wavelength optical analyser | |
| MXPA98000206A (en) | Identification of recirculable carpet materials using an infrared man spectrometer | |
| EP2243016B1 (de) | Fernnachweis gefährlicher stoffe wie sprengstoffe und sprengstoffbestandteile | |
| US7465911B2 (en) | Apparatus and method for chemical imaging of a biological sample with at least two spectral images of the sample obtained simultaneously | |
| JP2011117901A (ja) | プラスチックの識別装置およびその方法 | |
| WO2012147717A1 (ja) | 樹脂識別装置 | |
| Griffiths et al. | Remote characterization of materials by vibrational spectrometry through optical fibers | |
| Stokes et al. | Rapid screening and identification of improvised explosive and hazardous precursor materials by Raman spectroscopy | |
| KR101849606B1 (ko) | 단일샷에 의한 심도 분해 분광 분석 이미징 장치 | |
| Lo et al. | Submicron Noncontact Simultaneous Infrared and Raman Spectroscopy for Challenging Failure Analysis | |
| CN115112626A (zh) | 一种拉曼检测装置及拉曼检测方法 | |
| Wang | Effect of powder sample properties on chemical analysis by Raman spectroscopy |
Legal Events
| Date | Code | Title | Description |
|---|---|---|---|
| PUAI | Public reference made under article 153(3) epc to a published international application that has entered the european phase |
Free format text: ORIGINAL CODE: 0009012 |
|
| AK | Designated contracting states |
Kind code of ref document: A1 Designated state(s): DE FR GB |
|
| AX | Request for extension of the european patent |
Free format text: AL;LT;LV;MK;RO;SI |
|
| 17P | Request for examination filed |
Effective date: 20010417 |
|
| AKX | Designation fees paid |
Free format text: DE FR GB |
|
| RBV | Designated contracting states (corrected) |
Designated state(s): DE FR GB |
|
| RAP1 | Party data changed (applicant data changed or rights of an application transferred) |
Owner name: SONY DEUTSCHLAND GMBH |
|
| STAA | Information on the status of an ep patent application or granted ep patent |
Free format text: STATUS: THE APPLICATION IS DEEMED TO BE WITHDRAWN |
|
| 18D | Application deemed to be withdrawn |
Effective date: 20051213 |