EP1007901B1 - Imagerie doppler d'ecoulement par representation tomographique de coherence optique - Google Patents
Imagerie doppler d'ecoulement par representation tomographique de coherence optique Download PDFInfo
- Publication number
- EP1007901B1 EP1007901B1 EP98925087A EP98925087A EP1007901B1 EP 1007901 B1 EP1007901 B1 EP 1007901B1 EP 98925087 A EP98925087 A EP 98925087A EP 98925087 A EP98925087 A EP 98925087A EP 1007901 B1 EP1007901 B1 EP 1007901B1
- Authority
- EP
- European Patent Office
- Prior art keywords
- velocity
- band
- pass filters
- reference arm
- color
- Prior art date
- Legal status (The legal status is an assumption and is not a legal conclusion. Google has not performed a legal analysis and makes no representation as to the accuracy of the status listed.)
- Expired - Lifetime
Links
Images


Classifications
-
- A—HUMAN NECESSITIES
- A61—MEDICAL OR VETERINARY SCIENCE; HYGIENE
- A61B—DIAGNOSIS; SURGERY; IDENTIFICATION
- A61B5/00—Measuring for diagnostic purposes; Identification of persons
- A61B5/0059—Measuring for diagnostic purposes; Identification of persons using light, e.g. diagnosis by transillumination, diascopy, fluorescence
- A61B5/0073—Measuring for diagnostic purposes; Identification of persons using light, e.g. diagnosis by transillumination, diascopy, fluorescence by tomography, i.e. reconstruction of 3D images from 2D projections
-
- A—HUMAN NECESSITIES
- A61—MEDICAL OR VETERINARY SCIENCE; HYGIENE
- A61B—DIAGNOSIS; SURGERY; IDENTIFICATION
- A61B5/00—Measuring for diagnostic purposes; Identification of persons
- A61B5/0059—Measuring for diagnostic purposes; Identification of persons using light, e.g. diagnosis by transillumination, diascopy, fluorescence
- A61B5/0062—Arrangements for scanning
- A61B5/0066—Optical coherence imaging
-
- G—PHYSICS
- G01—MEASURING; TESTING
- G01B—MEASURING LENGTH, THICKNESS OR SIMILAR LINEAR DIMENSIONS; MEASURING ANGLES; MEASURING AREAS; MEASURING IRREGULARITIES OF SURFACES OR CONTOURS
- G01B9/00—Measuring instruments characterised by the use of optical techniques
- G01B9/02—Interferometers
- G01B9/02041—Interferometers characterised by particular imaging or detection techniques
- G01B9/02045—Interferometers characterised by particular imaging or detection techniques using the Doppler effect
-
- G—PHYSICS
- G01—MEASURING; TESTING
- G01B—MEASURING LENGTH, THICKNESS OR SIMILAR LINEAR DIMENSIONS; MEASURING ANGLES; MEASURING AREAS; MEASURING IRREGULARITIES OF SURFACES OR CONTOURS
- G01B9/00—Measuring instruments characterised by the use of optical techniques
- G01B9/02—Interferometers
- G01B9/02055—Reduction or prevention of errors; Testing; Calibration
- G01B9/02062—Active error reduction, i.e. varying with time
- G01B9/02067—Active error reduction, i.e. varying with time by electronic control systems, i.e. using feedback acting on optics or light
- G01B9/02069—Synchronization of light source or manipulator and detector
-
- G—PHYSICS
- G01—MEASURING; TESTING
- G01B—MEASURING LENGTH, THICKNESS OR SIMILAR LINEAR DIMENSIONS; MEASURING ANGLES; MEASURING AREAS; MEASURING IRREGULARITIES OF SURFACES OR CONTOURS
- G01B9/00—Measuring instruments characterised by the use of optical techniques
- G01B9/02—Interferometers
- G01B9/02055—Reduction or prevention of errors; Testing; Calibration
- G01B9/0207—Error reduction by correction of the measurement signal based on independently determined error sources, e.g. using a reference interferometer
- G01B9/02071—Error reduction by correction of the measurement signal based on independently determined error sources, e.g. using a reference interferometer by measuring path difference independently from interferometer
-
- G—PHYSICS
- G01—MEASURING; TESTING
- G01B—MEASURING LENGTH, THICKNESS OR SIMILAR LINEAR DIMENSIONS; MEASURING ANGLES; MEASURING AREAS; MEASURING IRREGULARITIES OF SURFACES OR CONTOURS
- G01B9/00—Measuring instruments characterised by the use of optical techniques
- G01B9/02—Interferometers
- G01B9/02055—Reduction or prevention of errors; Testing; Calibration
- G01B9/0207—Error reduction by correction of the measurement signal based on independently determined error sources, e.g. using a reference interferometer
- G01B9/02072—Error reduction by correction of the measurement signal based on independently determined error sources, e.g. using a reference interferometer by calibration or testing of interferometer
-
- G—PHYSICS
- G01—MEASURING; TESTING
- G01B—MEASURING LENGTH, THICKNESS OR SIMILAR LINEAR DIMENSIONS; MEASURING ANGLES; MEASURING AREAS; MEASURING IRREGULARITIES OF SURFACES OR CONTOURS
- G01B9/00—Measuring instruments characterised by the use of optical techniques
- G01B9/02—Interferometers
- G01B9/02083—Interferometers characterised by particular signal processing and presentation
-
- G—PHYSICS
- G01—MEASURING; TESTING
- G01B—MEASURING LENGTH, THICKNESS OR SIMILAR LINEAR DIMENSIONS; MEASURING ANGLES; MEASURING AREAS; MEASURING IRREGULARITIES OF SURFACES OR CONTOURS
- G01B9/00—Measuring instruments characterised by the use of optical techniques
- G01B9/02—Interferometers
- G01B9/0209—Low-coherence interferometers
- G01B9/02091—Tomographic interferometers, e.g. based on optical coherence
-
- A—HUMAN NECESSITIES
- A61—MEDICAL OR VETERINARY SCIENCE; HYGIENE
- A61B—DIAGNOSIS; SURGERY; IDENTIFICATION
- A61B5/00—Measuring for diagnostic purposes; Identification of persons
- A61B5/72—Signal processing specially adapted for physiological signals or for diagnostic purposes
- A61B5/7235—Details of waveform analysis
- A61B5/7253—Details of waveform analysis characterised by using transforms
- A61B5/7257—Details of waveform analysis characterised by using transforms using Fourier transforms
-
- G—PHYSICS
- G01—MEASURING; TESTING
- G01B—MEASURING LENGTH, THICKNESS OR SIMILAR LINEAR DIMENSIONS; MEASURING ANGLES; MEASURING AREAS; MEASURING IRREGULARITIES OF SURFACES OR CONTOURS
- G01B2290/00—Aspects of interferometers not specifically covered by any group under G01B9/02
- G01B2290/35—Mechanical variable delay line
-
- G—PHYSICS
- G01—MEASURING; TESTING
- G01B—MEASURING LENGTH, THICKNESS OR SIMILAR LINEAR DIMENSIONS; MEASURING ANGLES; MEASURING AREAS; MEASURING IRREGULARITIES OF SURFACES OR CONTOURS
- G01B2290/00—Aspects of interferometers not specifically covered by any group under G01B9/02
- G01B2290/60—Reference interferometer, i.e. additional interferometer not interacting with object
Definitions
- OCT optical coherence tomography
- OCT is a technology that allows for non-invasive, cross-sectional optical imaging of biological media with high spatial resolution and high sensitivity.
- OCT is an extension of low-coherence or white-light interferometry, in which a low temporal coherence light source is utilized to obtain precise localization of reflections internal to a probed structure along an optic axis.
- this technique is extended to enable scanning of the probe beam in the direction perpendicular to the optic axis, building up a two-dimensional reflectivity data set, used to create a cross-sectional gray-scale or false-color image of internal tissue backscatter.
- a disadvantage of the Wang system is that it does not provide a method to determine direction of flow within the sample and also does not provide a method for generating a two-dimensional color image of the sample indicating the flow velocity and directions within the image.
- U.S. Patent 5,549,114 to Petersen, et al . also provides an optical coherence tomography system capable of measuring the Doppler shift of backscattered light from flowing fluid within a sample.
- Petersen, et al. does not disclose a system or method for displaying the direction of flow within the sample, nor does Petersen, et al. disclose a system or method for providing a two-dimensional color image of the sample which indicates the velocity and directions of flow of fluids within the sample.
- Document EP 0 659 383 A discloses a method and an apparatus for optical coherence tomographic fundus imaging.
- the apparatus illuminates the fundus of an eye with a scanned sample beam of radiation whereby the scanned sample beam emerges from a beam scanner which is exposed to a sample beam.
- An embodiment of the apparatus includes a scanner lens and a beam splitter for transferring radiation from the scanned sample beam, including chief rays of the sample beam which emerge from a point of final deflection of the beam scanner, and lens focusing the transferred radiation so that the scanned sample beam is focused onto the fundus by the eye.
- the scanner lens is fixed with respect to the beam scanner so that the point of final deflection is located substantially in the back focal plane of the scanner lens and the scanner lens is movable.
- U.S. Patent 5,493,109 to Wei et al discloses an ophthalmologic surgical microscope.
- the ophthalmologic surgical microscope which is combined internally with an optical coherence tomography apparatus wherein auto-focusing is provided by driving a motorized internal focusing lens of the ophthalmologic surgical microscope with a signal output from the OCT apparatus.
- An embodiment of the ophthalmologic surgical microscope includes: an optical coherence tomography apparatus, a beam combiner for internally coupling output from the OCT apparatus into the ophthalmologic surgical microscope and a motor for moving an internal focusing lens of the ophthalmologic surgical microscope in response to a signal from the OCT apparatus, whereby the ophthalmologic surgical microscope is auto-focused.
- the present invention involves an advancement in OCT technology that provides for quantitative measurements of flow in scattering media by implementing systems for increased interferogram acquisition accuracy, coherent signal processing and display.
- the present invention provides a combination of micron-scale resolution tomographic optical imaging of a tissue sample simultaneously with Doppler flow monitoring of blood and other body fluids within the sample volume.
- the present invention utilizes an OCT data acquisition system to obtain precise localization of reflections internal to the sample along the optic axis. Scanning the OCT probe beam in a direction perpendicular to the optic axis builds up a two-dimensional data set comprising a gray-scale cross-sectional image of internal tissue backscatter.
- the data acquisition system may also utilize a calibration interferometer for providing sub-100 nm accuracy calibration of the reference arm position during interferogram acquisition.
- the present invention also provides a two-dimensional color data image representing the Doppler flow velocity and directions of moving scatterers within the sample.
- the method for generating the two-dimensional, color, Doppler image is generally as follows:
- interferometric data For each axial reference arm scan (“A-scan”), interferometric data is acquired. This interferometric data corresponds to a cross-correlation measurement of the light returning from the reference arm and the light backscattered from the volume of potentially moving scatterers illuminated by the sample arm probe beam.
- the acquired interferometric data is first band-pass filtered for noise reduction.
- the filtered data is coherently demodulated at a frequency corresponding to the Doppler shift induced by the reference mirror of the interferometer to produce an array of in-phase data values vs. time and an array of quadrature data values vs. time.
- the time element in these arrays is directly proportional to the reference arm length, and in turn, is directly proportional to the scanning depth into the sample.
- a starting time and a time window is selected.
- the selected starting time corresponds to a starting depth and the selected time window corresponds to a depth-range that is preferably longer than or equal to the coherence length of the light source of the low-coherence interferometer.
- the values of the in-phase array and the quadrature array corresponding to the selected time window are extracted from the in-phase and quadrature arrays and passed into a Fourier transform (FT) circuit or algorithm to obtain a power spectrum (localized Doppler spectrum) for that particular time window (depth range).
- FT Fourier transform
- a central velocity estimate is calculated to obtain an estimate of the mean scatter velocity for that particular time window.
- the central velocity estimate is obtained by calculating a centroid for the power spectrum. This velocity estimate will have a sign and a magnitude.
- one of two colors is assigned for to the velocity estimate, the particular one of two colors assigned being determined according to the sign of the velocity estimate (i.e., blue for positive values and red for negative values).
- the brightness, intensity or density of the color to assign to the window is determined by the magnitude of the velocity estimate.
- the resultant color and brightness is applied to an image pixel, or to a plurality of image pixels in a velocity profile (which is an array of image pixels corresponding to the particular A-scan).
- the particular pixel(s) to which the color and brightness is applied is the pixel(s) corresponding to the particular depth range of the selected window.
- this complete velocity profile is a one-dimensional array of colorized image pixels corresponding to the lateral position of the sample probe.
- multiple A-scans are performed for a sample, each A-scan corresponding to a particular lateral position of the sample arm with respect to the sample.
- subsequent A-scans are arranged into a radial array. It is to be understood that while the present invention describes multiple A-scans as being displaced laterally, it is within the scope of the invention to utilize the same signal processing algorithms described herein with respect to these acquisition and display methods.
- the above process of generating a velocity profile is performed for each A-scan taken. The processing can be performed either in real-time or after all of the A-scans have been taken and stored in memory.
- the velocity profiles are aligned side-by-side to create a two-dimensional colorized Doppler image indicating the direction and velocity of moving scatterers within the sample.
- This two-dimensional colorized Doppler image may then be merged with, or superimposed onto the gray-scale tissue backscatter image to create a complete image of the sample showing internal tissue scatterers as well as the velocity and direction of moving scatterers within the sample.
- the time windows extracted from the real array and imaginary arrays, described above, can be either non-overlapping (adjacent) or overlapping time windows. If non-overlapping windows are used, the color determined by the above process would be applied to the entire time window (i.e., if the time windows correspond to a sample depth that will be approximately 10 pixels deep in the final image, the color determined by the above process would be applied to all 10 pixels in the colorized Doppler image). But if overlapping time windows are used, the velocity value determined by the above process can be applied to a time (depth) range equal to the amount that the time windows do not overlap.
- the color determined by the above process would be applied to only a single pixel in the colorized Doppler image.
- the overlapping time windows would provide a much more precise Doppler image than the non-overlapped time windows.
- An alternate scheme for color coding the velocity information assigns a specific color or shade to each velocity and encodes into brightness, the magnitude of the signal or equivalently, the reflectivity of the tissue at the site.
- This alternate color coding scheme may offer some advantages in image rendering speed and ease of interpretation.
- a blood vessel would appear as a series of concentric rings, whose radius is smallest at the vessel's center.
- the user may be prompted to select both positive and negative, minimum threshold and maximum saturation velocities. These threshold and saturation velocities are then applied to the velocity array or to the velocity profile to provide an upper and lower bound to the velocity display color scale which allows all desired velocities to be displayed. Velocities which are larger than the maximum positive and negative saturation velocities, respectively, may be rendered the same color (brightness, shade, etc.) as the positive or negative maximum saturation velocities themselves, or else may be rendered in some other distinctive color (brightness, shade, ect.) in order to indicate that the velocity color scale was saturated at that location. Velocities which are smaller than the positive and negative threshold velocities are rendered as transparent to indicate that flow was not detected in that image region, and to allow for visualization of the underlying gray-scale magnitude reflectivity image.
- a better velocity estimate can be obtained for a particular position within the sample (i.e., within a particular time window and lateral position) by taking multiple A-scans for that lateral position and then averaging the velocity estimates together.
- multiple A-scans are taken for each lateral position of the sample arm, and the velocity estimates calculated for each A-scan taken are averaged together to produce a more accurate velocity estimate for that particular lateral position of the sample arm.
- better velocity estimates may also be obtained by averaging estimated windowed spectra obtained from multiple A-scans for each time window and lateral position, followed by calculating the centroids of the averaged spectra.
- a first alternate embodiment for each position of the reference arm, instead of one set of in-phase and quadrature data taken, multiple sets of in-phase and quadrature data are taken.
- the velocity estimate is calculated for a block of data pertaining substantially to a single position (depth) of the reference arm.
- a second alternate embodiment instead of one A-scan being taken for each lateral position of the sample arm, multiple A-scans are taken at each lateral position of the sample arm.
- the in-phase and quadrature data are then arranged into a two-dimensional matrix by aligning the one-dimensional (vertical) matrices for each A-scan taken side-by-side.
- the velocity estimate is calculated for a single position (a horizontal "row” window) of the reference arm.
- the step of taking multiple A-scans for each lateral position of the sample arm may be accomplished by: (a) incrementally advancing the sample arm laterally and taking the multiple A-scans for each incremental advance of the sample arm; (b) laterally sweeping the sample arm over the sample a multitude of times, taking one A-scan for each lateral position of the sample arm; or (c) some combination of (a) and (b).
- the above steps for converting the interferogram data into power spectrum data may be performed by a bank of narrow-band band-pass filters (NBPF), where each NBPF passes a particular frequency along the power spectrum frequency scale.
- NBPF narrow-band band-pass filters
- the outputs of each NBPF may be input directly into the centroid calculation.
- the above steps for converting the interferogram data into power spectrum data may also be performed by a bank of coherent demodulators and a corresponding bank of low-pass filters, where each demodulator demodulates the data at a particular frequency along the power spectrum frequency scale.
- This approach offers several advantages for the acquisition of local spectral information. First, the output of each of the detection channels is nearly instantaneous, allowing for substantially real-time implementation of CDOCT. Further, the electronic components are readily available.
- This latter approach may also be accomplished using a synthesized multi-frequency demodulating waveform, a mixer, and a low-pass filter.
- a reference waveform is synthesized as a sum of a desired number of sinusoids at a range of frequencies. These frequencies are mixed in a single mixer with the interferogram data, and the resulting mixed signal is then low-pass filtered. While this alternate embodiment represents a substantial savings in the number of components required, it does not provide estimation of the complete frequency spectrum within the analysis region.
- the present invention provides two implementations of scatterer velocity estimation and one implementation of turbulence estimation using an auto-correlation method, which is based on a mathematical derivation that estimates the central velocity and turbulence of the fluid flow in the sample as being related to the first and second moments of the Doppler-shifted frequency power spectrum.
- the first utilizes a complex demodulated detector output to obtain both the centroid velocity and an estimate of the power spectrum variance.
- the second is a much simpler version and provides an estimate of the central velocity only.
- It is a further object of the present invention to provide a method for generating a velocity-indicating, tomographic image of a sample in an optical coherence tomography system including the steps of (a) acquiring cross-correlation data from the interferometer; (b) generating a grayscale image from the cross-correlation data indicative of a depth-dependent positions of scatterers in the sample; (c) processing the cross-correlation data to produce a velocity value and location of a moving scatterer in the sample; (d) assigning a color to the velocity value; and (f) merging the color into the grayscale image, at a point in the grayscale image indicative of the moving scatterer's location, to produce a velocity-indicating, tomographic image.
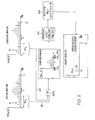
- an OCT data acquisition system 10 for use with the present invention includes a low-coherence interferometer 12 and, optionally, a high-coherence calibration interferometer 14.
- the low-coherence interferometer 12 includes a light source, such as a super-luminescent diode (“SLD”) source 16, a fiber-optic source line 18 coupled between the SLD 16 and a fiber-optic beam splitter (such as a 50/50 fiber coupler) 20.
- SLD super-luminescent diode
- fiber-optic source line 18 coupled between the SLD 16 and a fiber-optic beam splitter (such as a 50/50 fiber coupler) 20.
- Other known suitable light sources include a semiconductor optical amplifier (“SOA”), which is a higher-powered light source for high-speed OCT, or a rare-earth doped fiber amplifier commonly used in optical communication.
- SOA semiconductor optical amplifier
- the beam splitter 20 separates the light received from the source line 18 into two beams; one transmitted to a sample arm 22 via an optical fiber 24, and the other to a reference arm 26 via an optical fiber 28.
- the sample arm optical fiber 24 is coupled to a sample probe 30 adapted to focus light to a sample 32 and to receive the light reflected back from the sample 32.
- the reflected light received back from the sample is transmitted back to the beam splitter 20 via the sample arm optical fiber 24.
- the sample probe 30 has an adjustable focal length, thus allowing adjustment of the focal spot size, working distance and depth of focus.
- the fiber 28 is coupled to a reference probe 34 adapted to focus light received from the reference arm optical fiber 28 to a translating reference mirror 36 (usually mounted on a galvanometer), and to receive the light reflected back from the reference mirror 36.
- the reflected light received back from the reference mirror 36 is transmitted back to the beam splitter 20 via the reference arm optical fiber 28.
- the reflected light received by the beam splitter 20, back from both the sample arm optical fiber 24 and the reference arm optical fiber 28 is combined and transmitted on the fiber-optic line 38 to a photodetector 40.
- the photodetector produces an analog signal 42, responsive to the intensity of the incident electric field.
- An example of a photodetector for use with the present invention is Model 1811, commercially available from New Focus, Inc., Mountain View, California.
- the optical path length 44 of the sample arm 22 is a function of the distribution of scattering sites within the sample 32, while the optical path length 46 of the reference arm 26 changes with the translation of the reference mirror 36. Because a low coherence light source is used, a fringe pattern (interferometric signal) is produced at the photodetector 40 when the optical path length 44 to a reflecting or scattering site within the sample 32 matches the optical path length 46 of the reference arm 26, within a coherence length. The fringe pattern observed is a function of the optical path length distance between the sample and reference arms.
- Translating the reference mirror 36 provides interferogram data, which is the optical path length dependent cross-correlation function of the light retro-reflected from the reference mirror 36 and the sample 32.
- A-scan Collecting interferogram data for a point on the sample for one reference mirror cycle is referred to as collecting an "A-scan.”
- the A-scan data provides a one-dimensional profile of reflecting and scattering sites of the sample 32 vs. depth within the sample.
- Reference arm optical delay strategies include those which modulate the length of the reference arm optical fiber by using a piezo-electric fiber stretcher, methods based on varying the path length of the reference arm light by passing the light through rapidly rotating cubes or other rotating optical elements, and methods based on Fourier-domain pulse-shaping technology which modulate the group delay of the reference arm light by using an angularly scanning mirror to impose a frequency-dependent phase on the reference arm light after having been spectrally dispersed.
- This latter technique which is the first to have been shown capable of modulating the reference arm light fast enough to acquire OCT images at video rate, depends upon the fact that the inverse Fourier transform of a phase ramp in the frequency domain is equal to a group delay in the time domain.
- This latter delay line is also highly dispersive, in that it can impose different phase and group delays upon the reference arm light.
- the OCT interferogram fringe spacing depends upon the reference arm phase delay, while the position of the interferogram envelope at any time depends upon the reference arm group delay.
- Doppler shift frequency in this context is defined as the time derivative of the phase of the central frequency component present in the interferometric signal.
- this definition of Doppler shift frequency encompasses all possible reference arm delay technologies.
- An analog band-pass filter 48 filters the analog interferogram data signal 42 to reduce excess noise.
- the filtered analog interferogram data 49 is sent to an analog demodulator 50, which coherently demodulates the interferogram data at the frequency corresponding to the Doppler shift induced by the reference mirror to produce a series 52 of analog in-phase "I" component data vs. time and a series 51 of analog quadrature "Q" component data vs. time.
- analog in-phase "I” data series 52 and analog quadrature "Q” data series 51 are fed into analog-to-digital (“A/D") converters 53, which convert the analog in-phase "I” data series 52 and analog quadrature "Q” data series 51 into a digital in-phase data array 55 and a digital quadrature data array 54, respectively.
- A/D analog-to-digital
- These digital data arrays 54, 55 are then sent to the digital signal processing circuitry/system ("DSP") denoted by block 56.
- DSP digital signal processing circuitry/system
- the above analog-to-digital conversion can be performed prior to, or in-between the band-pass filtering and demodulating steps, and it is also within the scope of the invention that the band-pass filtering and coherent demodulation steps can be performed by the digital signal processing circuitry 56. But utilizing the analog band-pass filter 48 and the analog coherent demodulator 50 substantially increases processing speed and reduces system cost.
- the series 51 of analog quadrature data and the series 52 of analog in-phase data comprise the complex demodulated interferogram data.
- the in-phase series 52 represents the values of the real component of the interferogram data and the quadrature series 51 represents the values of the imaginary component of the interferogram data.
- the in-phase and quadrature arrays of interferogram data are processed by the DSP 56 to generate a one-dimensional reflectivity profile 58 of internal backscatter locations vs. depth.
- Suitable systems and methods for generating a gray-scale or false-color image of internal backscatter locations vs. depth are described in United States patent application Serial No. 09/040,128, filed March 17, 1998 .
- the gray-scale image may be generated according to other conventional incoherent envelope detection methods, as will be apparent to those of ordinary skill in the art.
- the acquired interferometric signal corresponds to a cross-correlation function of the light backscattered from the volume of (potentially moving) scatterers illuminated by the sample arm 22 probe beam, and the light returning from the reference arm 28.
- A(t) and ⁇ (t) are the amplitude and the phase of the detected signal.
- Performing a Fourier transform on the auto-correlation function provides the source power function S ii (f) .
- ⁇ (t) -2 ⁇ f s t + ⁇ (t) ;
- f s 2 Vn s cos ⁇ / ⁇ and ⁇ is the angle between the sample probe beam and the direction of the motion of the scatterer and n s is the index of refraction for the sample.
- A(t) and ⁇ (t) have the information regarding the locations of the scatterers.
- i d (t) becomes a cross-correlation function and its Fourier transform is the cross-power spectrum S is (f) .
- i d (t) A(t) exp[ j (2 ⁇ f s (t)t - ⁇ (t)) ].
- i d (t) is a signal whose spectral contents change with time. Therefore, in order to obtain localized Doppler spectral (i.e., velocity) information, time frequency analysis algorithms may be used to extract the spectral content of the system as a function of time.
- Short-time Fourier transforms (STFT) is one time frequency analysis technique for use in the present invention.
- w(mt s ) is the analysis window through which the sampled time-domain demodulated detector current is shifted
- t s is the sampling interval
- N is the number of samples contributing to the local spectral estimate centered at time nt s .
- analysis windows may be used in the STFT circuit/algorithm, including rectangular, Bartlett (triangular), Tukey (which encompasses the types hamming and hanning), Blackman, Parzen, Daniall (traditional or modified), and cosine taper windows. It is well known to those skilled in the art that the choice of window may affect the amount of noise in the STFT power spectra and thus the velocity estimation accuracy.
- An alternative implementation of the window is to pad the N-point analysis window with zeros on either side, increasing its length to match the number of samples in the A-scan.
- the total number of zeros added to the array is always L-N, where i-1 zeros are added before the N-point analysis window (for the i th power spectrum in the STFT), and L-N-i+1 zeros are added after the analysis window.
- the frequency precision can be increased by the ratio of L/N.
- localized Doppler shifted spectra i.e., STFT spectrograms
- V n ⁇ t S f d n ⁇ t S ⁇ ⁇ / 2 ⁇ n S cos ⁇
- a method of the present invention for generating a Doppler OCT image is illustrated in Figs. 1-3 .
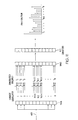
- a first window 61, centered at nt s , of the in-phase data and a first window 62, centered at nt s , of the quadrature data are respectively extracted from the in-phase array 55 and from the quadrature array 54, and are then input into a FT circuit/algorithm 60a to obtain a power spectrum 64 (a localized Doppler spectrum) for that window.
- the FT circuit/step 60 ( Fig.
- the power spectrum array 64 is obtained by taking the square-root of the sum of the squares of the imaginary and real arrays of transformed demodulated interferogram data.
- the size (time frame) of the window is indicated as Nt s , which must be shorter than the entire A-scan time Lt s and is preferably longer than or equal to the coherence length of the SLD 16.
- Nt s the size (time frame) of the window is indicated as Nt s , which must be shorter than the entire A-scan time Lt s and is preferably longer than or equal to the coherence length of the SLD 16.
- a central velocity estimate 67 is calculated to obtain an estimate of the mean scatterer velocity for that window. In one embodiment of the invention this central velocity estimate is found by calculating a centroid ( f d (nt s ) see Equation 4) for the power spectrum 64.
- a velocity estimate value 70 V ( nt s ) is obtained from the central velocity estimate (see Equation 5) and plugged into a velocity array 72 at time nt s .
- centroid is a measure of the central velocity because since all frequencies in the power spectrum are positive, the centroid of the power spectrum will always under-estimate the actual central velocity because it will necessarily include broadband noise in the centroid calculation. This inaccuracy is due to the asymmetrical distribution of noise around the Doppler shifted spectrum.
- Vr is the reference arm mirror velocity
- ⁇ v is the FWHM light source spectral bandwidth
- c is the speed of light.
- the detection bandwidth is chosen to be much wider than ⁇ f in order to be able to measure a wide range of velocities. Since the noise power in the STFT's of segmented A-scans is always positive and the centroid calculation integrates over signals as well as noise, the centroids of the STFTs always underestimate the true Doppler shifts. The performance of the centroid calculation degrades with increasing velocities as well as with depth, where the signal attenuates in biological tissues.
- An alternative central velocity estimation algorithm for use with the present invention is an adaptive algorithm which locates the Doppler spectral peak, and calculates the centroid of the power only at frequencies distributed symmetrically around the peak within the Doppler width ⁇ f Speckle due to the presence of multiple scatterers within each coherence length in biological tissues can cause fluctuations of the Doppler shift estimate within the bandwidth ⁇ f . Since centroids use complete information regarding the spectra, they can serve as more accurate estimates than peak locators. Although this algorithm provides accurate velocity estimates in the presence of a strong reflection in the sample arm, it fails when noise dominates signal.
- a noise-recognition algorithm which calculates the average STFT power spectral density and compares it with the density near the spectral peak.
- the signal is considered noisy if the ratio of the average spectral density over the complete STFT and the density within a bandwidth ⁇ f around the peak is less than a pre-set threshold T (for example, 0.67), in which case the traditional centroid algorithm is used for central velocity estimation.
- T for example, 0.67
- a next window 61', shifted by a decimation factor d, centered at (n+d)t s , of the in-phase data and a next window 62', centered at (n+d)t s , of the quadrature data are respectively extracted from the in-phase array 55 and the quadrature array 54, and are then input into the FT circuit/algorithm 60a to obtain a power spectrum 64' for that next window. From the power spectrum 64' a central velocity estimate 67' is calculated in block 66; and from the central velocity estimate 67' a velocity estimate value 70' is calculated in block 68.
- the velocity estimate value 70' is plugged into d elements of the velocity array centered at time (n+d)t s .
- the method as shown in Fig. 3 is repeated until the entire A-scan has been processed and the velocity array 72 is complete.
- the decimation value d the more precise the final velocity array 72 will be, in that the velocity assigned to each image pixel will more accurately reflect the STFT data centered on that pixel.
- the decimation factor d is large, then velocity pixels near the edges of the STFT segment will have their velocity estimates weighted toward the direction of the rest of the segment. Shorter decimation values, however, increase computation time since more Doppler power spectra are necessary to compute.
- the number of N-sample spectra computed per A-scan with L samples is (L-N)/d.
- the decimated velocity data may be stored in a separate array smaller than the one just described, and later magnified before being overlayed onto the grayscale image.
- the velocity estimate values 70,70' will have both a sign and a magnitude, where the particular sign corresponds to particular (opposing) travel directions of the scatterers within the sample.
- a color velocity image will be processed and combined with, or overlayed onto the gray-scale image 58.
- the velocity image processing will include a step of assigning one of two colors to image pixels in a velocity profile corresponding to the depth into the sample represented by the windows 61, 61'.
- the velocity profile is an array of image pixels corresponding to the particular A-scan.
- Which of the two colors is assigned depends upon the sign (i.e., blue for positive and red for negative) of the velocity estimate values 70, 70'. Additionally, the shade or the level of brightness, density or intensity for that selected color is adjusted according to the magnitude of the velocity estimate values 70, 70'.
- the in-phase array 55 and quadrature array 54 from each A-scan are used to calculate a velocity array 72 and a magnitude array 76 as discussed above.
- different colors can be designated for the positive and negative data from the velocity array, which will correspond to the different directions of scatterer movement within the sample.
- the user may be prompted to select both positive and negative, minimum threshold and maximum saturation velocities 78. These threshold and saturation velocities 78 are then applied to the velocity array 72 or to the velocity profile to provide an upper and lower bound to the velocity display color scale which allows all desired velocities to be displayed.
- Velocities which are larger than the maximum positive and negative saturation velocities, respectively, may be rendered the same color (brightness, shade, etc.) as the positive or negative maximum saturation velocities themselves, or else may be rendered in some other distinctive color (brightness, shade, ect.) in order to indicate that the velocity color scale was saturated at that location.
- Velocities which are smaller than the positive and negative threshold velocities are rendered as transparent to indicate that flow was not detected in that image region, and to allow for visualization of the underlying gray-scale magnitude reflectivity image.
- the threshold and saturation velocities 78 may be predetermined in the DSP 56 or may be automatically determined by the DSP 56 according to predetermined guidelines or algorithms.
- multiple A-scans are taken for different lateral positions of the sensor probe 30 along the sample 32 and the multiple velocity arrays 72 and the multiple magnitude arrays 76 are used to respectively create a two-dimensional, colorized velocity image 82 and a two-dimensional, gray-scale image 58 pertaining to backscatter positions within the sample.
- the two dimensional velocity image may be created by aligning velocity profiles side-by-side to create a two-dimensional colorized Doppler image 82 indicating the direction and velocity of moving scatterers within the sample.
- fluid flow in a first direction is indicated by a first color 83 and fluid flow in an opposite direction is indicated by a second color 83'.
- These images are then merged to create a colorized Doppler OCT image of the sample 84.
- One way to merge the velocity image 82 with the gray-scale image 58 is to overlay the velocity image onto the gray-scale image.
- the present invention provides at least two separate embodiments of color coding of velocity information.
- the two colors or hues are selected to reflect the sign of the velocity.
- the intensity, shade, brightness, or density of the color then reflects the magnitude of the velocity estimate.
- this color scheme which is commonly used in color Doppler ultrasound displays, a blood vessel appears as a red or blue (for example) disk or oval which is brightest in the center (reflecting that the highest velocities are in the center), and fades in brightness toward the edges of the vessel. As shown in Fig.
- an alternate scheme for color coding of velocity information to produce a colorized velocity image 82' which may offer some advantages in image rendering speed and ease of interpretation, assigns a specific color or shade 85, 85', 85" to each velocity, and encodes into the magnitude of the signal into the brightness of the specific color or shade 85, 85', 85” (or equivalently, the reflectivity of the tissue at that site).
- a blood vessel would appear as a series of concentric rings, whose radius is smallest at the vessel's center.
- the central velocity for that analysis region is estimated either by choosing the velocity with the highest magnitude, or else by using a centroid or adaptive centroid (as described above) algorithm. If this velocity is above the threshold and below the saturation velocity specified by the user, it is encoded into a color and overlayed on the gray-scale magnitude image 58 for that analysis region.
- the OCT image created by the present invention will not only be able to display tissue layers of the biological samples to cellular resolution, it will also have the capability of providing a correlation between the locations of blood vessels and other fluid flows using color Doppler OCT. Therefore, the present invention provides micron-scale resolution color Doppler OCT mapping of bidirectional blood flow and sub-surface vessels in vivo and has the potential applications in retinal perfusion mapping, management of bleeding in ulcerative conditions, and in tissue necrosis evaluation.
- multiple A-scans are taken for each position of the sample arm, and the power spectrum estimates calculated for each A-scan taken are averaged together to produce a more accurate power spectrum estimate for that particular lateral position of the sample arm.
- multiple A-scans are taken for each lateral position of the sample arm, and the velocity estimates calculated for each A-scan taken are averaged together to produce a more accurate velocity estimate for that particular lateral position of the sample arm.
- N acquisitions of in-phase and quadrature data are taken as indicated by step 132 (where N corresponding to the window size).
- step 134 each set of N acquisitions of in-phase and quadrature data at depth n is plugged into a short-time Fourier transform circuit/algorithm.
- step 136 from the output of the short-time Fourier transform circuit/algorithm, a velocity estimate at depth n is determined.
- the number of data acquisitions at depth n corresponds to the window size N .
- the velocity estimate is calculated for a window pertaining to a single position (depth) of the reference arm.
- the reference arm movement does not need to be stopped so that multiple readings can be taken while the reference arm is at a given position.
- the reference arm velocity must be set to a certain speed, or must be repeatedly scanned (dithered) over a small distance, such that the multiple readings are taken before the reference arm has moved as far as the coherence length of the SLD source 16.
- N A-scans are taken for each lateral position of the sample arm.
- the in-phase and quadrature data are then arranged into a two-dimensional matrix 138 by aligning the one-dimensional (vertical) matrices for each A-scan 140 taken side-by-side.
- the velocity estimate is calculated for a single position (a horizontal "row” window) of the reference arm.
- the output of the short-time Fourier transform step 60 will be a power spectrum centered at the Doppler shift frequency of the reference arm f r .
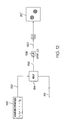
- the data acquisition system may optionally include a high-coherence calibration interferometer 14 to accurately monitor and compensate for the inevitable velocity fluctuations in the reference mirror 36.
- the calibration interferometer 14 includes a long-coherence length, narrow-band laser illumination source 86, such as a helium neon (He-Ne) laser or a distributed feed-back diode laser (DFB diode laser), a reference probe 88 and a sample probe 90.
- the narrow-band illumination source must have a coherence length that is longer than the region (depth) in the sample 32 that is being scanned (for example, the He-Ne laser has a coherence length of several meters).
- the illumination source 86 transmits to a beam splitter 92, which separates the source signal into two illumination source signals, one being transmitted to the reference probe 88 and the other to the sample probe 90.
- the reference probe 88 focuses its illumination source signal to a mirror 36' mounted facing backwards on the same mount as the reference mirror 36.
- the sample probe 90 focuses its illumination source signal to a fixed mirror 94.
- the interferometer 14 also includes a photodetector 96 for receiving the combination of light reflected back from the translating mirror 36' and the fixed mirror 94, and for producing an analog signal 98 corresponding to the intensity of light received.
- the analog interferometric signal 98 produced by the photodetector 96 will be a relatively constant amplitude sinusoidal signal, having a frequency equal to the Doppler shift corresponding to velocity fluctuations in the translating mirror 36' (the reference mirror) experienced by the electric field in the reference arm.
- the analog signal 98 produced by the photodetector 96 is sent to an interval-detect circuit/device 100 for detecting features in the analog signal 98 that are regular in time (i.e., zero crossings) and for outputting a signal 102 indicative of such features.
- the feature indicative signal 102 is fed into a clock generator circuit/device 104 for generating a digital clock source signal 106 for clocking (triggering) the analog to digital converters 53 discussed above.
- the sampling rate of the analog-to-digital converters 53 will be synchronized according to the fluctuations in the reference mirror 36 translation velocity detected by the calibration interferometer 14.
- United States patent application Serial No. 09/040,128, filed March 17, 1998 discussed above, it will be apparent to those of ordinary skill in the art that there are a number of alternate systems and methods available for synchronizing the processing of the interferogram data according to the inevitable fluctuations in reference arm velocity.
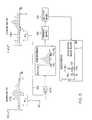
- NPBFs narrow-band band-pass filters
- a bank of NBPFs 108 may be positioned to filter the raw, (non-demodulated) photodetector signal 42.
- the bank 108 comprises N NBPFs, each having a bandwidth of approximately 1/ Nt s , where the center frequency of each NBPF corresponds to a particular frequency along the frequency scale of a power spectrum 110, optionally centered at the Doppler shift frequency of the reference arm.
- t s corresponds to the sampling interval of an array of N A/D converters placed either before the bank of NBPFs (if the NBPFs are implemented digitally), or after the bank of NBPFs (if the NBPFs are implemented in analog electronics).
- the middle NBPF will be centered at the reference arm Doppler shift frequency, f r ; the next NBPF above the center NBPF will be centered at the frequency f r +1/ Nt s ; and the next NBPF below the center NBPF will be centered at the frequency f r -1/ Nt s . From this power spectrum 110, the centroid 112 and velocity estimate 114 will be determined as discussed above in Equations 4 and 6.
- the coherent demodulation circuit/device 50 and the short-time Fourier transform circuit/step 60 are not needed.
- the analysis window is the impulse response of a low-pass filter. Therefore, multiplying it by the exponential in Equation 8 results in a band-pass filter. Its convolution with the interferometric signal can then provide the same information as the STFT.
- a bank of complex NBPFs 116 may be positioned after the coherent demodulation circuit/device 50, where each receives both the analog in-phase "I" data 51 and the analog quadrature "Q" data 52.
- the bank 116 comprises N NBPFs, each having a bandwidth of approximately 1/ Nt s , where the center frequency of each NBPF corresponds to a particular frequency along the frequency scale of the power spectrum 64 centered at zero frequency.
- t s corresponds to the sampling interval of an array of N A/D converters placed either before the bank of NBPFs (if the NBPFs are implemented digitally), or after the bank of NBPFs (if the NBPFs are implemented in analog electronics).
- the middle NBPF will be centered at zero frequency; the next NBPF above the center NBPF will be centered at the frequency 1/ Nt s ; and the next NBPF below the center NBPF will be centered at the frequency -1/ Nt s .
- the central velocity estimate (centroid) 66 and velocity estimate 68 will be determined as discussed above in Equations 4 and 5.
- the short-time Fourier transform circuit/step 60 is not needed.
- Equation 8 is applied to the demodulated data rather than the complex interferometric signal.
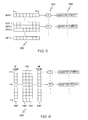
- the interferometer data 49 can be coherently demodulated at frequency f I , as shown in block 118, to produce in-phase data 120 and quadrature data 122.
- the in-phase and quadrature data 120, 122 is fed into a bank of complex NBPFs 124.
- the bank 124 comprises N NBPFs, each having a bandwidth of approximately 1/ Nt s , where the center frequency of each NBPF corresponds to a particular frequency along the frequency scale of a power spectrum 126 optionally centered at frequency fr - f I .
- t s corresponds to the sampling interval of an array of N A/D converters placed either before the bank of NBPFs (if the NBPFs are implemented digitally), or after the bank of NBPFs (if the NBPFs are implemented in analog electronics).
- half (or some other fraction) of the NBPFs will pass frequencies below fr -f I
- the other half (or the remaining fraction) will pass frequencies above f r - f I .
- the middle NBPF will be centered at f r -f I ; the next NBPF above the center NBPF will be centered at the frequency fr - f I +1/ Nt s ; and the next NBPF below the center NBPF will be centered at the frequency f r - f I -1/ Nt s .
- the short-time Fourier transform circuit/step 60 is not needed.
- the array 124 of complex NBPFs may be replaced by two arrays of NBPFs, one array for the in-phase data 120, and one array for the quadrature data 122; and the square-root of the sum of the squares of the output of each array will yield the resultant power spectrum 126.
- the frequency f I is selected such that the NBPFs are centered in the kHz frequency range. Such NBPFs are cheaper, and more readily available than NBPFs centered in the frequencies near the reference arm Doppler shift frequency f r .
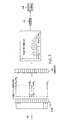
- An alternative embodiment of the invention employs multiple coherent demodulators operating in parallel in order to obtain an estimate of the power spectrum for a given analysis region in the sample.
- the STFT is a convolution between the demodulated detector current and the analysis window, or the operation performed by a quadrature detector at a single frequency.
- the output is then modulated by exp( j 2 ⁇ fnt s ).
- this final step may be disregarded, since synthesis (reconstruction of the signal from the STFT) is not necessary.
- time-frequency analysis can be implemented with parallel demodulation electronics.
- This alternative approach offers several advantages for the acquisition of local spectral information. First, the output of each of the detection channels is nearly instantaneous, allowing for real-time implementation of CDOCT. It avoids time-consuming calculations of Fourier transforms used in Doppler processing with the STFT. Second, the electronic components necessary to implement this approach (e.g., low-pass filters and demodulators) are readily available. Finally, low-pass filters are preferable to band-pass filters due to more reliable phase responses of the latter.
- the raw 42, or preferably band-pass-filtered 49 detector signal is split and sent to N parallel coherent demodulators 144, with user-specified frequencies ranging from f 1 to f N .
- Each of these demodulators 144 transfers the content of the interferometric signal at its own demodulation frequency down to baseband.
- Each demodulator is followed by a low-pass filter 146 with cutoff frequency determined by the optimal bandwidth ⁇ f , given by Equation 7. From the output of the low-pass filters 146, a power spectrum 148 is generated; and from the power spectrum 148, the central velocity estimate will be calculated as discussed above.
- f N / 2 could be the Doppler shift frequency f r .
- spacing of demodulator frequency may be arbitrary.
- a reference waveform 150 is synthesized by a waveform synthesizer 152 as a sum of a desired number of sinusoids at frequencies ranging from f 1 to f N .
- the resulting low-pass filtered signal 160 is then digitized and displayed in a velocity image 82L, and will approximate a "rings" display.
- the spacing of the discrete components of the reference waveform should be equal to or greater than ⁇ f to prevent overlapping information from two demodulation frequencies.
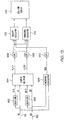
- the first method utilizes the complex demodulated detector output to obtain both the centroid velocity and an estimate of the power spectrum variance, and is illustrated in Fig. 13 .
- the second method uses a much simpler version of the hardware to obtain an estimate of the central velocity only, and is illustrated in Fig. 14 .
- the first implementation begins with the complex demodulated output of the CDOCT detector output of Fig. 1 .
- Each of the in-phase I(t) 51 and quadrature Q(t) 52 components of the demodulated output are split into two signal paths, one of which is input into a temporal delay line 162 which delays that signal component by a lag time T.
- the four signals I(t), I(t-T), Q(t), and Q(t-T) are then input into a complex multiplier circuit 164 which calculates the real R X (T,t) and imaginary Ry(T,t) components of the complex auto-correlation of I(t) and Q(t):
- R x T t Re ⁇ I t + jQ t ⁇ I ⁇ t - T + jQ ⁇ t - T
- R y T t Im ⁇ I t + jQ t ⁇ I ⁇ t - T + jQ ⁇ t - T .
- the real and imaginary components are separately low-pass-filtered, as desired, as shown in block 168, in order to average the resulting estimate of the zero-lag element of the auto-correlation function.
- the magnitude R(0,t) is also low-pass filtered as shown in block 170.
- the resulting estimates of the central velocity and turbulence are then digitized in A/D converters and prepared for combination with the magnitude-only OCT image and display 176.
- Several display types may be implemented.
- the velocity estimate is thresholded and saturated according to the user preferences or a pre-established algorithm as before, color coded according to one of the color schemes previously discussed, and overlayed onto the magnitude image.
- the turbulence estimate may be treated in the same manner in that it would be thresholded and saturated according to user-specified limits, overlayed onto the corresponding magnitude-only OCT image, and displayed on a separate monitor from the velocity image.
- a second implementation which combines velocity and turbulence estimates along with the magnitude-only OCT, image all into one display proceeds as follows.
- the velocity data is first thresholded and saturated according to user-specified limits as before.
- the velocity data is color-coded into two colors representing positive and negative flow, for example blue and red, respectively.
- the turbulence data is used to change the hue of the velocity color by adding some additional coloring in an amount which is proportional to the amount of turbulence estimated.
- the turbulence may be represented by adding the hue of green, so that positive flow plus maximum turbulence approaches the color cyan, and negative flow plus maximum turbulence approaches the color yellow.
- Fig. 13 may be performed using circuits or integrated circuits designed specifically for this purpose, or alternatively the demodulated detector output may be directly digitized using A/D converters and the bulk of the calculations may be performed digitally in a computer.
- the velocity estimate can be extracted directly from the detector signal with a simple hardware implementation of the auto-correlation method.
- the centroid velocity estimate corresponds to the zero-lag element of the signal auto-correlation.
- interferometric component of the OCT signal can be isolated by band pass filtering the photodetector output.
- a high dynamic range limiter 178 such as the AD606 Demodulating Logarithmic Amplifier with Limiter output from Analog Devices, Inc) eliminates the amplitude variation in the signal, preserving only frequency information.
- a low pass filter 180 passes only the fundamental sinusoidal frequency component of the signal, which can now be written as: A ⁇ cos 2 ⁇ ⁇ ⁇ f r - f s ⁇ t + ⁇ t , where A is now a constant amplitude.
- a 90° power splitter 182 (such as the model PSCQ-2 series from Mini-Circuits, Inc.) divides the signal into two paths, with one path phase shifted by 90°, and becomes A ⁇ cos 2 ⁇ ⁇ ⁇ f r - f s ⁇ t + ⁇ t - 90 ⁇ ° .
- the signal in the 0° path is delayed by a fixed time T by a delay line 184 (such as the 2214 series Delay Lines from Data Delay Devices, Inc.) and becomes A ⁇ cos 2 ⁇ ⁇ ⁇ f r - f s ⁇ t - T + ⁇ ⁇ t - T .
- the signals in the two paths are then input to a phase detector 186.
- a phase detector is a device which takes as its input two signals with the same frequency, and which gives an output proportional to the product of the amplitudes of the input signals, and to the phase difference between the input signals.
- phase detector is the ZRPD-1 from Mini-Circuits, Inc., which gives an output proportional to the cosine of the phase difference between the input signals.
- the output of the phase detector and low pass filter 188 is: A 2 2 ⁇ sin 2 ⁇ ⁇ ⁇ f r - f s ⁇ T + ⁇ t - ⁇ ⁇ t - T .
- equation 32 becomes A 2 2 ⁇ sin 2 ⁇ ⁇ ⁇ f r - f s ⁇ T .
- the Doppler shift frequency due to flow in the sample f s
Abstract
Claims (20)
- Procédé destiné à générer une image tomographique indiquant la vitesse d'un échantillon (32) dans un système de tomographie à cohérence optique, le système de tomographie à cohérence optique comprenant un interféromètre (12) ayant un bras de référence (26) et un bras d'échantillon (22), le procédé comprenant les étapes consistant à :acquérir des données de corrélation croisée à partir de l'interféromètre (12),générer une image à échelle de gris (58) à partir des données de corrélation croisée, qui indique les positions en fonction de la profondeur des éléments de diffusion dans l'échantillon (32),traiter les données de corrélation croisée pour produire une valeur de vitesse et l'emplacement d'un élément de diffusion mobile dans l'échantillon (32),attribuer une couleur (83, 83') à la valeur de vitesse,fusionner la couleur (83, 83') dans l'image à échelle de gris (58) en un point dans l'image de gris (58), qui indique l'emplacement de l'élément de diffusion mobile, pour produire une image tomographique indiquant la vitesse.
- Procédé selon la revendication 1, dans lequel :l'étape de traitement comprend l'étape consistant à démoduler de manière cohérente les données de corrélation croisée à une fréquence de décalage Doppler du bras de référence (26), etl'étape d'attribution comprend les étapes consistant à attribuer une première couleur (83) pour une valeur de vitesse positive et à attribuer une autre couleur (83') pour une valeur de vitesse négative.
- Procédé selon la revendication 1, dans lequel :l'étape d'attribution comprend l'étape consistant à fixer la luminosité, la nuance, la densité ou l'intensité de la couleur (83, 83') en fonction de l'amplitude de la valeur de vitesse.
- Procédé selon la revendication 1, dans lequel l'étape de traitement comprend l'étape consistant à exécuter une étape d'analyse temps-fréquence sur les données de corrélation croisée pour extraire des informations spectrales des données de corrélation croisée en fonction de la profondeur.
- Procédé selon la revendication 4, dans lequel l'étape d'analyse temps-fréquence comprend l'étape consistant à exécuter une transformation de Fourier locale sur les données de corrélation croisée.
- Procédé selon la revendication 5, dans lequel :l'étape d'analyse temps-fréquence est exécutée sur une pluralité de fenêtres de temps des données de corrélation croisée pour produire une pluralité correspondante de valeurs du spectre de puissance dépendant de la profondeur,l'étape de traitement comprend en outre l'étape consistant à calculer les valeurs de vitesse dépendant de la profondeur pour chacune des valeurs du spectre de puissance, etl'étape d'attribution est exécutée pour chaque valeur de la pluralité de valeurs de vitesse dépendant de la profondeur.
- Procédé selon la revendication 6, dans lequel l'étape de calcul comprend l'étape consistant à calculer un centroïde (67, 67'), qui indique une estimation de la vitesse moyenne des éléments de diffusion pour chacune des valeurs du spectre de puissance.
- Procédé selon la revendication 6, dans lequel la pluralité de fenêtres de temps se chevauchent les unes les autres
- Procédé selon la revendication 4, dans lequel :l'étape d'analyse temps-fréquence comprend l'étape consistant à introduire les données de corrélation croisée à travers une pluralité de filtres passe-bande (108), une première partie de la pluralité de filtres passe-bande laissant passer les fréquences au-dessous d'une fréquence de décalage Doppler du bras de référence (26) et une autre partie de la pluralité de filtres passe-bande laissant passer les fréquences au-dessus de la fréquence de décalage Doppler du bras de référence (26), la sortie de la pluralité de filtres passe-bande représentant un spectre de puissance dépendant de la profondeur (110), etl'étape de traitement comprend l'étape consistant à calculer un centroïde (112) à partir du spectre de puissance (110), qui indique une estimation de la vitesse moyenne des éléments de diffusion, l'estimation étant la valeur de la vitesse (114).
- Procédé selon revendication 4, dans lequel :le procédé comprend en outre l'étape consistant à démoduler de manière cohérente les données de corrélation croisée à la fréquence de décalage Doppler du bras de référence (26),l'étape d'analyse temps-fréquence comprend l'étape consistant à introduire les données de corrélation croisée démodulées à travers une pluralité de filtres passe-bande complexes (108), une première partie de la pluralité de filtres passe-bande complexes laissant passer les fréquences au-dessous d'une fréquence de décalage Doppler du bras de référence (26) et une autre partie de la pluralité de filtres passe-bande complexes laissant passer les fréquences au-dessus de la fréquence de décalage Doppler du bras de référence (26), la sortie de la pluralité de filtres passe-bande complexes (108) représentant un spectre de puissance dépendant de la profondeur (110),l'étape de traitement comprend l'étape consistant à calculer un centroïde (112) à partir du spectre de puissance (110), qui indique une estimation de la vitesse moyenne des éléments de diffusion, l'estimation étant la valeur de la vitesse (114), etl'étape d'attribution comprend les étapes consistant à attribuer une première couleur (83) pour une valeur de vitesse positive et à attribuer une autre couleur (83') pour une valeur de vitesse négative.
- Procédé selon la revendication 4, où :le procédé comprend en outre l'étape consistant à démoduler de manière cohérente les données de corrélation croisée à la fréquence de décalage Doppler du bras de référence (26), pour générer des données de corrélation croisée en phase (120) et des données de corrélation croisée en quadrature (122),l'étape d'analyse temps-fréquence comprend les étapes consistant à introduire les données de corrélation croisée en phase (120) à travers une première pluralité de filtres passe-bande (124), une première partie de la première pluralité de filtres passe-bande laissant passer les fréquences au-dessous d'une fréquence de décalage Doppler du bras de référence (26) et une autre partie de la première pluralité de filtres passe-bande (124) laissant passer les fréquences au-dessus de la fréquence de décalage Doppler du bras de référence (26), à introduire les données de corrélation croisée en quadrature (122) à travers une deuxième pluralité de filtres passe-bande (124), une première partie de la deuxième pluralité de filtres passe-bande (124) laissant passer les fréquences au-dessous d'une fréquence de décalage Doppler du bras de référence (26) et une autre partie de la deuxième pluralité de filtres passe-bande (124) laissant passer les fréquences au-dessus de la fréquence de décalage Doppler du bras de référence (26), à élever au carré la sortie de chacune des première et deuxième pluralités de filtres passe-bande, à sommer les carrés, et à extraire la racine carrée de la somme pour produire un spectre de puissance dépendant de la profondeur (126),l'étape de traitement inclut l'étape consistant à calculer un centroïde (128) à partir du spectre de puissance (126), qui indique une estimation de la vitesse moyenne des éléments de diffusion, l'estimation étant la valeur de la vitesse (130), etl'étape d'attribution comprend les étapes consistant à attribuer une première couleur (83) pour une valeur de vitesse positive et à attribuer une autre couleur (83') pour une valeur de vitesse négative.
- Procédé selon la revendication 1, dans lequel :les étapes d'acquisition et de traitement sont répétées une pluralité de fois pour une position latérale du bras d'échantillon (22),le procédé comprend l'étape consistant à calculer la moyenne des valeurs de vitesse produites dans les étapes de traitement pour générer une valeur de vitesse moyenne, etl'étape d'attribution comprend l'étape consistant à attribuer une couleur à la valeur de vitesse moyenne.
- Procédé selon la revendication 1, dans lequel :l'étape d'acquisition comprend l'étape consistant à acquérir de manière répétée des données de corrélation croisée à une profondeur prédéterminée, à produire une pluralité de lectures de données de corrélation croisée à la profondeur prédéterminée, etl'étape de traitement comprend l'étape consistant à exécuter une analyse temps-fréquence sur la pluralité de lectures de données de corrélation croisée pour obtenir une estimation de la vitesse à la profondeur prédéterminée.
- Système de tomographie à cohérence optique comprenant :un interféromètre (12) comprenant une source de rayonnement optique (16), un bras d'échantillon (22) et un bras de référence (26), l'interféromètre (12) générant une sortie de données de corrélation croisée d'un échantillon (32) dans le bras d'échantillon (22), etun système de traitement de données (56), relié fonctionnellement à l'interféromètre (12), traitant les données de corrélation croisée pour générer une image à échelle de gris (58) à partir des données de corrélation croisée, qui indique les positions en fonction de la profondeur des éléments de diffusion dans l'échantillon (32), à traiter les données de corrélation croisée pour produire une valeur de vitesse et l'emplacement d'un élément de diffusion mobile dans l'échantillon (32), à attribuer une couleur (83, 83') à la valeur de vitesse, et à fusionner la couleur dans l'image à échelle de gris (58) en un point dans l'image à échelle de gris (58), qui indique l'emplacement de l'élément de diffusion mobile.
- Système de tomographie à cohérence optique selon la revendication 14, dans lequel le système de traitement de données (56) comprend :un dispositif de démodulation (50), relié fonctionnellement à la sortie de l'interféromètre (12),un dispositif de transformation de Fourier (60), relié fonctionnellement à la sortie du dispositif de démodulation (50), etun dispositif d'estimation de vitesse (66) relié fonctionnellement à la sortie du dispositif de transformation de Fourier (60).
- Système de tomographie à cohérence optique selon la revendication 14, dans lequel le système de traitement de données (56) comprend :une pluralité de filtres passe-bande (108), reliés fonctionnellement à la sortie de l'interféromètre (12), une première partie de la pluralité de filtres passe-bande (108) laissant passer les fréquences au-dessous d'une fréquence de décalage Doppler du bras de référence (26) et une autre partie de la pluralité de filtres passe-bande (108) laissant passer les fréquences au-dessus de la fréquence de décalage Doppler du bras de référence (26), etun dispositif d'estimation de vitesse (114) relié fonctionnellement à la sortie de la pluralité de filtres passe-bande (108).
- Système de tomographie à cohérence optique selon la revendication 14, dans lequel le système de traitement de données (56) comprend :un dispositif de démodulation (50), relié fonctionnellement à la sortie de l'interféromètre (12),une pluralité de filtres passe-bande complexes (108), reliés fonctionnellement à la sortie du dispositif de démodulation (50), une première partie de la pluralité de filtres passe-bande complexes (108) laissant passer les fréquences au-dessous d'une fréquence de décalage Doppler du bras de référence (26) et une autre partie de la pluralité de filtres passe-bande complexes (108) laissant passer les fréquences au-dessus de la fréquence de décalage Doppler du bras de référence (26), etun dispositif d'estimation de vitesse (114) relié fonctionnellement à la sortie de la pluralité de filtres passe-bande (108).
- Système de tomographie à cohérence optique selon la revendication 14, dans lequel le système de traitement de données comprend :un dispositif de démodulation (118), relié fonctionnellement à la sortie de l'interféromètre (12), comportant une sortie de données en phase (120) et une sortie de données en quadrature (122),une première pluralité de filtres passe-bande, reliés fonctionnellement à la sortie de données en phase (120) du dispositif de démodulation (118), une première partie de la première pluralité de filtres passe-bande laissant passer les fréquences au-dessous d'une fréquence de décalage Doppler du bras de référence (26) et une autre partie de la première pluralité de filtres passe-bande laissant passer les fréquences au-dessus de la fréquence de décalage Doppler du bras de référence (26),une deuxième pluralité de filtres passe-bande, reliés fonctionnellement à la sortie de données en quadrature (122) du dispositif de démodulation, une première partie de la deuxième pluralité de filtres passe-bande laissant passer les fréquences au-dessous d'une fréquence de décalage Doppler du bras de référence (26) et une autre partie de la deuxième pluralité de filtres passe-bande laissant passer les fréquences au-dessus de la fréquence de décalage Doppler du bras de référence (26), etun dispositif d'estimation de vitesse (130) relié fonctionnellement à la sortie des première et deuxième pluralités de filtres passe-bande (118).
- Système de tomographie à cohérence optique selon la revendication 14, dans lequel l'attribution d'une couleur (83, 83') comprend l'attribution d'une première couleur (83) pour une valeur de vitesse positive et l'attribution d'une deuxième couleur (83') pour une valeur de vitesse négative.
- Système de tomographie à cohérence optique selon la revendication 14, dans lequel l'attribution d'une couleur (83, 83') comprend l'attribution d'une luminosité, d'une nuance, d'une densité ou d'une intensité de la couleur en fonction de l'amplitude de la valeur de vitesse.
Applications Claiming Priority (3)
| Application Number | Priority Date | Filing Date | Title |
|---|---|---|---|
| US4735897P | 1997-06-02 | 1997-06-02 | |
| US47358 | 1997-06-02 | ||
| PCT/US1998/011116 WO1998055830A1 (fr) | 1997-06-02 | 1998-06-02 | Imagerie doppler d'ecoulement par representation tomographique de coherence optique |
Publications (3)
| Publication Number | Publication Date |
|---|---|
| EP1007901A1 EP1007901A1 (fr) | 2000-06-14 |
| EP1007901A4 EP1007901A4 (fr) | 2001-08-29 |
| EP1007901B1 true EP1007901B1 (fr) | 2009-04-29 |
Family
ID=21948518
Family Applications (1)
| Application Number | Title | Priority Date | Filing Date |
|---|---|---|---|
| EP98925087A Expired - Lifetime EP1007901B1 (fr) | 1997-06-02 | 1998-06-02 | Imagerie doppler d'ecoulement par representation tomographique de coherence optique |
Country Status (6)
| Country | Link |
|---|---|
| US (2) | US6006128A (fr) |
| EP (1) | EP1007901B1 (fr) |
| JP (1) | JP4138027B2 (fr) |
| AU (1) | AU7711498A (fr) |
| DE (1) | DE69840791D1 (fr) |
| WO (1) | WO1998055830A1 (fr) |
Families Citing this family (257)
| Publication number | Priority date | Publication date | Assignee | Title |
|---|---|---|---|---|
| GB9610700D0 (en) * | 1996-05-22 | 1996-07-31 | Moor Instr Ltd | Apparatus for imaging microvascular blood flow |
| US6842639B1 (en) * | 1997-10-03 | 2005-01-11 | Intraluminal Therapeutics, Inc. | Method and apparatus for determining neovascular flow through tissue in a vessel |
| US6129667A (en) * | 1998-02-02 | 2000-10-10 | General Electric Company | Luminal diagnostics employing spectral analysis |
| US6191862B1 (en) * | 1999-01-20 | 2001-02-20 | Lightlab Imaging, Llc | Methods and apparatus for high speed longitudinal scanning in imaging systems |
| US6937884B1 (en) * | 1999-09-14 | 2005-08-30 | The Research Foundation Of State University Of New York | Method and system for imaging the dynamics of scattering medium |
| AT409451B (de) * | 1999-12-14 | 2002-08-26 | Hoffmann La Roche | Vorrichtung zur bestimmung der örtlichen verteilung einer messgrösse |
| JP3999437B2 (ja) * | 2000-03-10 | 2007-10-31 | 富士フイルム株式会社 | 光断層画像化装置 |
| US7555333B2 (en) * | 2000-06-19 | 2009-06-30 | University Of Washington | Integrated optical scanning image acquisition and display |
| US6482161B1 (en) * | 2000-06-29 | 2002-11-19 | Acuson Corporation | Medical diagnostic ultrasound system and method for vessel structure analysis |
| US6924898B2 (en) * | 2000-08-08 | 2005-08-02 | Zygo Corporation | Phase-shifting interferometry method and system |
| US6882432B2 (en) * | 2000-08-08 | 2005-04-19 | Zygo Corporation | Frequency transform phase shifting interferometry |
| SE517701C2 (sv) * | 2000-08-31 | 2002-07-02 | October Biometrics Ab | Anordning, metod och system för att mäta distrubution av valda egenskaper i ett material |
| DE60141090D1 (de) | 2000-10-30 | 2010-03-04 | Gen Hospital Corp | Optische systeme zur gewebeanalyse |
| US9295391B1 (en) | 2000-11-10 | 2016-03-29 | The General Hospital Corporation | Spectrally encoded miniature endoscopic imaging probe |
| US9897538B2 (en) * | 2001-04-30 | 2018-02-20 | The General Hospital Corporation | Method and apparatus for improving image clarity and sensitivity in optical coherence tomography using dynamic feedback to control focal properties and coherence gating |
| CA2473587C (fr) | 2001-05-01 | 2014-07-15 | The General Hospital Corporation | Procede et appareil pour determiner un type de plaque d'atherosclerose par mesure de proprietes optiques de tissu |
| US6728571B1 (en) * | 2001-07-16 | 2004-04-27 | Scimed Life Systems, Inc. | Electronically scanned optical coherence tomography with frequency modulated signals |
| US7113817B1 (en) * | 2001-10-04 | 2006-09-26 | Wintec, Llc | Optical imaging of blood circulation velocities |
| US6980299B1 (en) | 2001-10-16 | 2005-12-27 | General Hospital Corporation | Systems and methods for imaging a sample |
| DE10157842A1 (de) * | 2001-11-24 | 2003-06-05 | Zeiss Carl | Interferometer und interferometrisches Messverfahren |
| AU2002364544A1 (en) * | 2001-12-10 | 2003-07-09 | Zygo Corporation | Method and apparatus for calibrating a wavelength-tuning interferometer |
| US7030995B2 (en) * | 2001-12-10 | 2006-04-18 | Zygo Corporation | Apparatus and method for mechanical phase shifting interferometry |
| DE60336534D1 (de) | 2002-01-11 | 2011-05-12 | Gen Hospital Corp | Vorrichtung zur OCT Bildaufnahme mit axialem Linienfokus für verbesserte Auflösung und Tiefenschärfe |
| CA2474134C (fr) * | 2002-01-15 | 2015-11-17 | Board Of Regents, The University Of Texas System | Procedes et compositions reduisant la diffusion de la lumiere durant les procedures d'imagerie therapeutique et diagnostique |
| US7355716B2 (en) * | 2002-01-24 | 2008-04-08 | The General Hospital Corporation | Apparatus and method for ranging and noise reduction of low coherence interferometry LCI and optical coherence tomography OCT signals by parallel detection of spectral bands |
| AU2003219932A1 (en) | 2002-02-28 | 2003-09-16 | Gmp Vision Solutions, Inc. | Device and method for monitoring aqueous flow within the eye |
| US6944551B2 (en) * | 2002-03-12 | 2005-09-13 | The Regents Of The University Of California | Imaging transverse flow velocity using spectral bandwidth of the doppler frequency shift in phase-resolved optical doppler tomography |
| US7006232B2 (en) * | 2002-04-05 | 2006-02-28 | Case Western Reserve University | Phase-referenced doppler optical coherence tomography |
| US20110201924A1 (en) * | 2002-04-30 | 2011-08-18 | The General Hospital Corporation | Method and Apparatus for Improving Image Clarity and Sensitivity in Optical Tomography Using Dynamic Feedback to Control Focal Properties and Coherence Gating |
| US7130059B2 (en) * | 2002-06-24 | 2006-10-31 | Light Gage, Inc | Common-path frequency-scanning interferometer |
| DE60333389D1 (de) * | 2002-12-18 | 2010-08-26 | Koninkl Philips Electronics Nv | Verfahren und Anordnung für die optische Kohärenztomographie |
| US7643153B2 (en) * | 2003-01-24 | 2010-01-05 | The General Hospital Corporation | Apparatus and method for ranging and noise reduction of low coherence interferometry LCI and optical coherence tomography OCT signals by parallel detection of spectral bands |
| WO2004066824A2 (fr) | 2003-01-24 | 2004-08-12 | The General Hospital Corporation | Systeme et procede pour l'identification tissulaire utilisant l'interferometrie a faible coherence |
| US7474407B2 (en) * | 2003-02-20 | 2009-01-06 | Applied Science Innovations | Optical coherence tomography with 3d coherence scanning |
| JP4805142B2 (ja) | 2003-03-31 | 2011-11-02 | ザ ジェネラル ホスピタル コーポレイション | 光路長が変更された異なる角度の光の合成により光学的に干渉する断層撮影におけるスペックルの減少 |
| US7519096B2 (en) | 2003-06-06 | 2009-04-14 | The General Hospital Corporation | Process and apparatus for a wavelength tuning source |
| WO2005006987A1 (fr) * | 2003-07-22 | 2005-01-27 | Hitachi Medical Corporation | Dispositif et procede d'ultrasonographie |
| JP5567246B2 (ja) * | 2003-10-27 | 2014-08-06 | ザ ジェネラル ホスピタル コーポレイション | 周波数ドメイン干渉測定を利用して光学撮像を実行する方法および装置 |
| EP1687587B1 (fr) * | 2003-11-28 | 2020-01-08 | The General Hospital Corporation | Procede et appareil d'imagerie codee de maniere spectrale tridimensionnelle |
| WO2005058137A2 (fr) | 2003-12-12 | 2005-06-30 | University Of Washington | Systeme de guidage et d'interface en 3d pour catheterscope |
| WO2005062826A2 (fr) * | 2003-12-18 | 2005-07-14 | Zygo Corporation | Procede et appareil de metrologie en chiffres absolus |
| US7319229B2 (en) * | 2003-12-29 | 2008-01-15 | Kla-Tencor Technologies Corporation | Illumination apparatus and methods |
| FR2865370B1 (fr) * | 2004-01-22 | 2006-04-28 | Centre Nat Rech Scient | Systeme et procede de tomographie in vivo a haute resolution laterale et axiale de la retine humaine |
| US7184148B2 (en) | 2004-05-14 | 2007-02-27 | Medeikon Corporation | Low coherence interferometry utilizing phase |
| US7474408B2 (en) | 2004-05-14 | 2009-01-06 | Medeikon Corporation | Low coherence interferometry utilizing phase |
| US7242480B2 (en) | 2004-05-14 | 2007-07-10 | Medeikon Corporation | Low coherence interferometry for detecting and characterizing plaques |
| US7327463B2 (en) | 2004-05-14 | 2008-02-05 | Medrikon Corporation | Low coherence interferometry utilizing magnitude |
| US7190464B2 (en) | 2004-05-14 | 2007-03-13 | Medeikon Corporation | Low coherence interferometry for detecting and characterizing plaques |
| EP1754016B1 (fr) | 2004-05-29 | 2016-05-18 | The General Hospital Corporation | Procede, systeme et logiciel destines a la compensation de dispersion chromatique au moyen de couches reflechissantes dans l'imagerie par tomographie par coherence optique (oct) |
| US7388668B2 (en) * | 2004-06-09 | 2008-06-17 | President & Fellows Of Harvard College | Phase sensitive heterodyne coherent anti-Stokes Raman scattering micro-spectroscopy and microscopy |
| JP4995720B2 (ja) | 2004-07-02 | 2012-08-08 | ザ ジェネラル ホスピタル コーポレイション | ダブルクラッドファイバを有する内視鏡撮像プローブ |
| EP1782020B1 (fr) | 2004-08-06 | 2012-10-03 | The General Hospital Corporation | Logiciel de determination d'au moins un emplacement dans un echantillon par tomographie a coherence optique, systeme et procede associes |
| US8965487B2 (en) * | 2004-08-24 | 2015-02-24 | The General Hospital Corporation | Process, system and software arrangement for measuring a mechanical strain and elastic properties of a sample |
| WO2006024015A1 (fr) | 2004-08-24 | 2006-03-02 | The General Hospital Corporation | Procédé et dispositif d'imagerie de segments de vaisseaux |
| KR101269455B1 (ko) | 2004-09-10 | 2013-05-30 | 더 제너럴 하스피탈 코포레이션 | 광 간섭 영상화를 위한 시스템 및 방법 |
| US7268889B2 (en) * | 2004-09-22 | 2007-09-11 | Corning Incorporated | Phase-resolved measurement for frequency-shifting interferometry |
| US7259860B2 (en) * | 2004-09-22 | 2007-08-21 | Corning Incorporated | Optical feedback from mode-selective tuner |
| EP2329759B1 (fr) * | 2004-09-29 | 2014-03-12 | The General Hospital Corporation | Système et procédé d'imagerie à cohérence optique |
| JP4566685B2 (ja) * | 2004-10-13 | 2010-10-20 | 株式会社トプコン | 光画像計測装置及び光画像計測方法 |
| JP5175101B2 (ja) * | 2004-10-29 | 2013-04-03 | ザ ジェネラル ホスピタル コーポレイション | 偏光感応性光コヒーレンストモグラフィを用いて偏光非解消の偏光パラメータを測定するジョーンズ行列に基づく解析を行うシステム及び方法 |
| JP5623692B2 (ja) * | 2004-11-02 | 2014-11-12 | ザ ジェネラル ホスピタル コーポレイション | 試料の画像形成のための光ファイバ回転装置、光学システム及び方法 |
| EP1825214A1 (fr) | 2004-11-24 | 2007-08-29 | The General Hospital Corporation | Interferometre a trajet commun pour oct endoscopique |
| US8922781B2 (en) | 2004-11-29 | 2014-12-30 | The General Hospital Corporation | Arrangements, devices, endoscopes, catheters and methods for performing optical imaging by simultaneously illuminating and detecting multiple points on a sample |
| US8346346B1 (en) | 2005-01-24 | 2013-01-01 | The Board Of Trustees Of The Leland Stanford Junior University | Optical analysis system and approach therefor |
| US7530948B2 (en) | 2005-02-28 | 2009-05-12 | University Of Washington | Tethered capsule endoscope for Barrett's Esophagus screening |
| WO2006116317A1 (fr) * | 2005-04-22 | 2006-11-02 | The General Hospital Corporation | Agencements, systèmes et procédés permettant de réaliser une tomographie par cohérence optique sensible à la polarisation du domaine spectral |
| ES2337497T3 (es) | 2005-04-28 | 2010-04-26 | The General Hospital Corporation | Evaluacion de caracteristicas de la imagen de una estructura anatomica en imagenes de tomografia de coherencia optica. |
| DE102005021061B4 (de) * | 2005-05-06 | 2011-12-15 | Siemens Ag | Verfahren zur tomographischen Darstellung eines Hohlraumes durch Optische-Kohärenz-Tomographie (OCT) und eine OCT-Vorrichtung zur Durchführung des Verfahrens |
| WO2006124860A1 (fr) * | 2005-05-13 | 2006-11-23 | The General Hospital Corporation | Arrangements, systemes et procedes permettant d'obtenir une reflectrometrie de coherence optique du domaine spectral pour une detection sensible d'un echantillon chimique et biologique |
| US8162834B2 (en) * | 2006-10-18 | 2012-04-24 | Board Of Regents, The University Of Texas System | Hemoglobin contrast in ultrasound and optical coherence tomography for diagnosing diseased tissue, cancers, and the like |
| US8036732B2 (en) | 2006-10-18 | 2011-10-11 | Board Of Regents, The University Of Texas System | Hemoglobin contrast in magneto-motive optical doppler tomography, optical coherence tomography, and ultrasound imaging methods and apparatus |
| US8355776B2 (en) | 2005-05-27 | 2013-01-15 | Board Of Regents, The University Of Texas System | Hemoglobin contrast in magneto-motive optical doppler tomography, optical coherence tomography, and ultrasound imaging methods and apparatus |
| US8454511B2 (en) * | 2005-05-27 | 2013-06-04 | Board Of Regents, The University Of Texas System | Magneto-motive ultrasound detection of magnetic nanoparticles |
| EP1887926B1 (fr) | 2005-05-31 | 2014-07-30 | The General Hospital Corporation | Systeme et procede qui utilisent des techniques d'interferometrie d'heterodyne a codage spectral pour l'imagerie |
| US9060689B2 (en) | 2005-06-01 | 2015-06-23 | The General Hospital Corporation | Apparatus, method and system for performing phase-resolved optical frequency domain imaging |
| EP1744181B8 (fr) * | 2005-07-15 | 2014-04-09 | Kabushiki Kaisha Toshiba | Dispositif de diagnostic à ultrasons et procédé de traitement d'images à ultrasons |
| KR101387454B1 (ko) | 2005-08-09 | 2014-04-22 | 더 제너럴 하스피탈 코포레이션 | 광간섭 단층촬영법에서 편광 기반 직교 복조를 수행하기위한 장치, 방법 및 저장 매체 |
| WO2007022220A2 (fr) * | 2005-08-16 | 2007-02-22 | The General Hospital Corporation | Ensembles et procedes pour la mise en image dans des vaisseaux sanguins |
| WO2007041376A1 (fr) | 2005-09-29 | 2007-04-12 | General Hospital Corporation | Procede et appareil d'imagerie optique par codage spectral |
| JP2007101263A (ja) * | 2005-09-30 | 2007-04-19 | Fujifilm Corp | 光断層画像化装置 |
| EP1945094B1 (fr) | 2005-10-14 | 2018-09-05 | The General Hospital Corporation | Imagerie fluorescente codee par frequence et par spectre |
| WO2007067163A1 (fr) * | 2005-11-23 | 2007-06-14 | University Of Washington | Faisceau de balayage a cadre sequentiel variable utilisant la resonance de balayage interrompu |
| JP5680826B2 (ja) | 2006-01-10 | 2015-03-04 | ザ ジェネラル ホスピタル コーポレイション | 1以上のスペクトルを符号化する内視鏡技術によるデータ生成システム |
| CN104257348A (zh) | 2006-01-19 | 2015-01-07 | 通用医疗公司 | 通过上皮内腔器官束扫描对上皮内腔器官进行光学成像的方法和系统 |
| US8145018B2 (en) | 2006-01-19 | 2012-03-27 | The General Hospital Corporation | Apparatus for obtaining information for a structure using spectrally-encoded endoscopy techniques and methods for producing one or more optical arrangements |
| US20070223006A1 (en) * | 2006-01-19 | 2007-09-27 | The General Hospital Corporation | Systems and methods for performing rapid fluorescence lifetime, excitation and emission spectral measurements |
| US20070171430A1 (en) * | 2006-01-20 | 2007-07-26 | The General Hospital Corporation | Systems and methods for providing mirror tunnel micropscopy |
| US20070171433A1 (en) * | 2006-01-20 | 2007-07-26 | The General Hospital Corporation | Systems and processes for providing endogenous molecular imaging with mid-infrared light |
| CN101370426A (zh) * | 2006-01-20 | 2009-02-18 | 通用医疗公司 | 利用对光学相干断层扫描的波阵面调制来提供散斑减少的系统、装置和过程 |
| WO2007087301A2 (fr) * | 2006-01-23 | 2007-08-02 | Zygo Corporation | Systeme d’interferometres pour le controle d’un objet |
| US10426548B2 (en) | 2006-02-01 | 2019-10-01 | The General Hosppital Corporation | Methods and systems for providing electromagnetic radiation to at least one portion of a sample using conformal laser therapy procedures |
| EP1986545A2 (fr) | 2006-02-01 | 2008-11-05 | The General Hospital Corporation | Appareil destiné à appliquer une pluralité de rayonnements électromagnétiques à un échantillon |
| EP1986562B1 (fr) * | 2006-02-01 | 2015-04-08 | The General Hospital Corporation | Appareil destiné à commander au moins l'une d'au moins deux sections d'au moins une fibre |
| JP5519152B2 (ja) | 2006-02-08 | 2014-06-11 | ザ ジェネラル ホスピタル コーポレイション | 光学顕微鏡法を用いて解剖学的サンプルに関わる情報を取得するための装置 |
| JP4890878B2 (ja) | 2006-02-16 | 2012-03-07 | 株式会社トプコン | 眼底観察装置 |
| EP2309221A1 (fr) | 2006-02-24 | 2011-04-13 | The General Hospital Corporation | Procédés et systèmes destinés à réaliser une tomographie par cohérence optique dans le domaine de fourier avec résolution angulaire |
| JP2009533076A (ja) * | 2006-03-01 | 2009-09-17 | ザ ジェネラル ホスピタル コーポレイション | 光吸収体をマクロファージに標的化することによるアテローム班の細胞特異的レーザー治療を提供するシステム及び方法 |
| JP2009528128A (ja) * | 2006-03-03 | 2009-08-06 | ユニヴァーシティ オブ ワシントン | 多クラッド光ファイバ走査器 |
| US20070232872A1 (en) * | 2006-03-16 | 2007-10-04 | The Board Of Regents Of The University Of Texas System | Continuous noninvasive glucose monitoring in diabetic, non-diabetic, and critically ill patients with oct |
| WO2007109622A2 (fr) * | 2006-03-17 | 2007-09-27 | University Of Washington | Filtres d'élimination de fouillis pour tomographie doppler optique |
| US20080004527A1 (en) * | 2006-04-05 | 2008-01-03 | Coleman D Jackson | High-resolution ultrasound spectral and wavelet analysis of vascular tissue |
| EP2004041B1 (fr) | 2006-04-05 | 2013-11-06 | The General Hospital Corporation | Procedes, dispositifs et systemes pour effectuer une imagerie de domaine de frequence optique d'un echantillon sensible a la polarisation |
| EP3150110B1 (fr) | 2006-05-10 | 2020-09-02 | The General Hospital Corporation | Processus, agencements et systèmes pour fournir une imagerie de domaine de fréquence d'un échantillon |
| US7520667B2 (en) * | 2006-05-11 | 2009-04-21 | John Bean Technologies Ab | Method and system for determining process parameters |
| WO2007133964A2 (fr) * | 2006-05-12 | 2007-11-22 | The General Hospital Corporation | Processus, agencements et systèmes pour produire une carte d'épaisseur de couche de fibres sur la base d'images de tomographie à cohérence optique |
| US7488930B2 (en) | 2006-06-02 | 2009-02-10 | Medeikon Corporation | Multi-channel low coherence interferometer |
| US7995814B2 (en) * | 2006-06-26 | 2011-08-09 | California Institute Of Technology | Dynamic motion contrast and transverse flow estimation using optical coherence tomography |
| US20100165335A1 (en) * | 2006-08-01 | 2010-07-01 | The General Hospital Corporation | Systems and methods for receiving and/or analyzing information associated with electro-magnetic radiation |
| EP2051623A2 (fr) * | 2006-08-09 | 2009-04-29 | Koninklijke Philips Electronics N.V. | Appareil d'émission de lumière, en particulier pour les mesures d'écoulement |
| US9867530B2 (en) | 2006-08-14 | 2018-01-16 | Volcano Corporation | Telescopic side port catheter device with imaging system and method for accessing side branch occlusions |
| US20080058629A1 (en) * | 2006-08-21 | 2008-03-06 | University Of Washington | Optical fiber scope with both non-resonant illumination and resonant collection/imaging for multiple modes of operation |
| EP3006920A3 (fr) | 2006-08-25 | 2016-08-03 | The General Hospital Corporation | Appareil et procédés permettant d'améliorer l'imagerie par tomographie à cohérence optique à l'aide de techniques de filtrage volumétrique |
| WO2008049118A2 (fr) | 2006-10-19 | 2008-04-24 | The General Hospital Corporation | Dispositif et procédé d'obtention et de fourniture d'informations d'image associées à au moins une portion d' échantillon et permettant de réaliser une telle portion |
| US20080094608A1 (en) * | 2006-10-23 | 2008-04-24 | The Regents Of The University Of California | Laser velocimetry system |
| US20080132834A1 (en) * | 2006-12-04 | 2008-06-05 | University Of Washington | Flexible endoscope tip bending mechanism using optical fibers as tension members |
| US8079656B2 (en) * | 2006-12-22 | 2011-12-20 | Palo Alto Research Center Incorporated | Method for decimation of images |
| EP2106240B1 (fr) | 2007-01-10 | 2015-04-01 | Lightlab Imaging, Inc. | Procédés et appareil de tomographie à cohérence optique à source de balayage |
| EP2102583A2 (fr) | 2007-01-19 | 2009-09-23 | The General Hospital Corporation | Appareil et procédé pour contrôler la profondeur de télémétrie dans une imagerie de domaine de fréquence optique |
| US20080206804A1 (en) * | 2007-01-19 | 2008-08-28 | The General Hospital Corporation | Arrangements and methods for multidimensional multiplexed luminescence imaging and diagnosis |
| EP2104968A1 (fr) * | 2007-01-19 | 2009-09-30 | The General Hospital Corporation | Réflexion de disque rotatif pour balayage de longueurs d'onde rapide de lumière à large bande dispersée |
| DE102007005699A1 (de) * | 2007-02-05 | 2008-08-07 | Carl Zeiss Meditec Ag | Koagulationssystem |
| US20080221388A1 (en) * | 2007-03-09 | 2008-09-11 | University Of Washington | Side viewing optical fiber endoscope |
| US20080234586A1 (en) * | 2007-03-19 | 2008-09-25 | The General Hospital Corporation | System and method for providing noninvasive diagnosis of compartment syndrome using exemplary laser speckle imaging procedure |
| WO2008115965A1 (fr) * | 2007-03-19 | 2008-09-25 | The General Hospital Corporation | Appareil et methode de diagnostic non invasif d'une hemorragie interne |
| WO2008118781A2 (fr) | 2007-03-23 | 2008-10-02 | The General Hospital Corporation | Procédés, agencements et dispositif destinés à utiliser un laser à balayage de longueur d'onde utilisant un balayage angulaire et des procédures de dispersion |
| WO2008121844A1 (fr) | 2007-03-30 | 2008-10-09 | The General Hospital Corporation | Système et procédé pour fournir une imagerie à granularité laser en vue de détecter une plaque à risque |
| US20080243030A1 (en) * | 2007-04-02 | 2008-10-02 | University Of Washington | Multifunction cannula tools |
| US8840566B2 (en) | 2007-04-02 | 2014-09-23 | University Of Washington | Catheter with imaging capability acts as guidewire for cannula tools |
| WO2008124845A2 (fr) * | 2007-04-10 | 2008-10-16 | University Of Southern California | Procédés et systèmes pour la mesure du flux sanguin utilisant la tomographie à cohérence optique doppler |
| US8045177B2 (en) | 2007-04-17 | 2011-10-25 | The General Hospital Corporation | Apparatus and methods for measuring vibrations using spectrally-encoded endoscopy |
| WO2008137710A1 (fr) * | 2007-05-03 | 2008-11-13 | University Of Washington | Imagerie sur la base d'une tomographie par cohérence optique haute résolution pour un usage intracavitaire et interstitiel, mise en œuvre avec un facteur de forme réduit |
| WO2008137637A2 (fr) | 2007-05-04 | 2008-11-13 | The General Hospital Corporation | Procédés, agencements et systèmes pour obtenir des informations associées à un échantillon à l'aide d'une microscopie optique |
| US8134554B1 (en) | 2007-05-04 | 2012-03-13 | Topcon Medical Systems, Inc. | Method and apparatus for spatially mapping three-dimensional optical coherence tomography data with two-dimensional images |
| JP5481376B2 (ja) * | 2007-07-12 | 2014-04-23 | ヴォルカノ コーポレイション | 光コヒーレンストモグラフィー用のクロック制御方法 |
| US9596993B2 (en) | 2007-07-12 | 2017-03-21 | Volcano Corporation | Automatic calibration systems and methods of use |
| WO2009009799A1 (fr) | 2007-07-12 | 2009-01-15 | Volcano Corporation | Cathéter pour imagerie in-vivo |
| US10219780B2 (en) | 2007-07-12 | 2019-03-05 | Volcano Corporation | OCT-IVUS catheter for concurrent luminal imaging |
| JP5173305B2 (ja) * | 2007-07-30 | 2013-04-03 | 国立大学法人 筑波大学 | 測定信号のノイズ処理方法 |
| EP2173254A2 (fr) * | 2007-07-31 | 2010-04-14 | The General Hospital Corporation | Systèmes et procédés pour fournir des motifs de balayage de faisceau pour une imagerie dans le domaine de la fréquence optique doppler de vitesse élevée |
| JP5536650B2 (ja) | 2007-08-31 | 2014-07-02 | ザ ジェネラル ホスピタル コーポレイション | 自己干渉蛍光顕微鏡検査のためのシステムと方法、及び、それに関連するコンピュータがアクセス可能な媒体 |
| WO2009036453A1 (fr) * | 2007-09-15 | 2009-03-19 | The General Hospital Corporation | Appareil, support accessible par ordinateur et procédé de mesure de compositions chimiques et/ou moléculaires de plaques athéroscléreuses coronariennes dans des structures anatomiques |
| US8076624B1 (en) | 2007-09-19 | 2011-12-13 | Barchers Jeffrey D | Non-cooperative laser target enhancement system and method |
| WO2009042867A1 (fr) * | 2007-09-27 | 2009-04-02 | University Of Southern California | Transducteurs ultrasonores haute fréquence à réseau convexe et imagerie tissulaire |
| EP2207469A4 (fr) * | 2007-10-12 | 2012-07-11 | Gen Hospital Corp | Systèmes et procédés d'imagerie optique de structures anatomiques luminales |
| WO2009059034A1 (fr) | 2007-10-30 | 2009-05-07 | The General Hospital Corporation | Système et procédé permettant une détection de mode de gaine |
| US20090137893A1 (en) * | 2007-11-27 | 2009-05-28 | University Of Washington | Adding imaging capability to distal tips of medical tools, catheters, and conduits |
| JP5234470B2 (ja) * | 2007-12-21 | 2013-07-10 | 独立行政法人国立高等専門学校機構 | レーザドップラー血流測定方法及び装置 |
| US7878651B2 (en) * | 2007-12-26 | 2011-02-01 | Carl Zeiss Meditec, Inc. | Refractive prescription using optical coherence tomography |
| US20090225324A1 (en) * | 2008-01-17 | 2009-09-10 | The General Hospital Corporation | Apparatus for providing endoscopic high-speed optical coherence tomography |
| US11123047B2 (en) | 2008-01-28 | 2021-09-21 | The General Hospital Corporation | Hybrid systems and methods for multi-modal acquisition of intravascular imaging data and counteracting the effects of signal absorption in blood |
| US9332942B2 (en) | 2008-01-28 | 2016-05-10 | The General Hospital Corporation | Systems, processes and computer-accessible medium for providing hybrid flourescence and optical coherence tomography imaging |
| US20090208143A1 (en) * | 2008-02-19 | 2009-08-20 | University Of Washington | Efficient automated urothelial imaging using an endoscope with tip bending |
| US20110190586A1 (en) * | 2008-03-28 | 2011-08-04 | Volcano Corporation | Methods and systems for intravascular imaging and flushing |
| US7884946B2 (en) * | 2008-04-28 | 2011-02-08 | Lumetrics, Inc. | Apparatus for measurement of the axial length of an eye |
| JP5607610B2 (ja) | 2008-05-07 | 2014-10-15 | ザ ジェネラル ホスピタル コーポレイション | 構造の特徴を決定する装置、装置の作動方法およびコンピュータアクセス可能な媒体 |
| DE102008028342A1 (de) * | 2008-06-13 | 2009-12-17 | Carl Zeiss Surgical Gmbh | Laser-Doppler-Bildgebungsverfahren und Vorrichtung zum Untersuchen eines Objekts |
| EP2288948A4 (fr) | 2008-06-20 | 2011-12-28 | Gen Hospital Corp | Coupleur fondu de fibres optiques et procédé associé |
| EP2309919B1 (fr) | 2008-07-10 | 2019-03-06 | Ecole Polytechnique Federale De Lausanne (EPFL) EPFL-TTO | Imagerie optique cohérente fonctionnelle |
| US9254089B2 (en) | 2008-07-14 | 2016-02-09 | The General Hospital Corporation | Apparatus and methods for facilitating at least partial overlap of dispersed ration on at least one sample |
| WO2010068764A2 (fr) | 2008-12-10 | 2010-06-17 | The General Hospital Corporation | Systèmes, appareil et procédés d'extension de la plage de profondeur d'imagerie de tomographie par cohérence optique, par le biais du sous-échantillonnage optique |
| US7864327B1 (en) * | 2009-01-09 | 2011-01-04 | Veeco Instruments, Inc. | In-phase/in-quadrature demodulator for spectral information of interference signal |
| JP2012515576A (ja) | 2009-01-20 | 2012-07-12 | ザ ジェネラル ホスピタル コーポレイション | 内視鏡生検装置、システム、及び方法 |
| US8097864B2 (en) | 2009-01-26 | 2012-01-17 | The General Hospital Corporation | System, method and computer-accessible medium for providing wide-field superresolution microscopy |
| CN102308444B (zh) | 2009-02-04 | 2014-06-18 | 通用医疗公司 | 利用高速光学波长调谐源的设备和方法 |
| EP2399523A4 (fr) * | 2009-02-23 | 2015-04-01 | Olympus Medical Systems Corp | Dispositif d'observation d'un organisme et procédé de création d'un tomogramme de l'organisme |
| US9351642B2 (en) | 2009-03-12 | 2016-05-31 | The General Hospital Corporation | Non-contact optical system, computer-accessible medium and method for measurement at least one mechanical property of tissue using coherent speckle technique(s) |
| EP2237266A1 (fr) * | 2009-04-03 | 2010-10-06 | Fraunhofer-Gesellschaft zur Förderung der angewandten Forschung e.V. | Appareil et procédé pour déterminer plusieurs centres locaux de fréquences de gravité du spectre d'un signal audio |
| JP5258052B2 (ja) * | 2009-04-25 | 2013-08-07 | 国立大学法人宇都宮大学 | 位相シフト法による形状測定方法及び形状測定装置、並びに複素振幅計測方法及び複素振幅計測装置 |
| JP5626687B2 (ja) | 2009-06-11 | 2014-11-19 | 国立大学法人 筑波大学 | 2ビーム型光コヒーレンストモグラフィー装置 |
| US11490826B2 (en) | 2009-07-14 | 2022-11-08 | The General Hospital Corporation | Apparatus, systems and methods for measuring flow and pressure within a vessel |
| US20110137178A1 (en) * | 2009-10-06 | 2011-06-09 | The General Hospital Corporation | Devices and methods for imaging particular cells including eosinophils |
| JP5711260B2 (ja) * | 2009-12-08 | 2015-04-30 | ザ ジェネラル ホスピタル コーポレイション | 光コヒーレンストモグラフィにより声帯襞を分析、診断及び治療モニタリングする方法及び装置 |
| EP2542153A4 (fr) | 2010-03-05 | 2014-06-04 | Gen Hospital Corp | Système, procédés et support accessible par ordinateur qui procurent des images microscopiques d'au moins une structure anatomique à une résolution particulière |
| US9069130B2 (en) | 2010-05-03 | 2015-06-30 | The General Hospital Corporation | Apparatus, method and system for generating optical radiation from biological gain media |
| JP5778762B2 (ja) | 2010-05-25 | 2015-09-16 | ザ ジェネラル ホスピタル コーポレイション | 光コヒーレンストモグラフィー画像のスペクトル解析のための装置及び方法 |
| EP2575597B1 (fr) | 2010-05-25 | 2022-05-04 | The General Hospital Corporation | Appareil pour fournir une imagerie optique de structures et de compositions |
| JP6066901B2 (ja) | 2010-06-03 | 2017-01-25 | ザ ジェネラル ホスピタル コーポレイション | 1つまたは複数の管腔器官内または管腔器官にある構造を撮像するための装置およびデバイスのための方法 |
| US8279446B2 (en) | 2010-07-19 | 2012-10-02 | Lumetrics, Inc. | Fiber-based interferometric device for measuring axial dimensions of a human eye |
| US8896842B2 (en) | 2010-08-05 | 2014-11-25 | Bioptigen, Inc. | Compact multimodality optical coherence tomography imaging systems |
| WO2012058381A2 (fr) | 2010-10-27 | 2012-05-03 | The General Hospital Corporation | Appareil, systèmes et méthodes de mesure de la pression sanguine dans au moins un vaisseau |
| US11141063B2 (en) | 2010-12-23 | 2021-10-12 | Philips Image Guided Therapy Corporation | Integrated system architectures and methods of use |
| US11040140B2 (en) | 2010-12-31 | 2021-06-22 | Philips Image Guided Therapy Corporation | Deep vein thrombosis therapeutic methods |
| US9279659B2 (en) * | 2011-01-21 | 2016-03-08 | Duke University | Systems and methods for complex conjugate artifact resolved optical coherence tomography |
| WO2012149175A1 (fr) | 2011-04-29 | 2012-11-01 | The General Hospital Corporation | Moyens pour déterminer des propriétés physiques et/ou optiques résolues en profondeur de milieux de diffusion |
| JP2014523536A (ja) | 2011-07-19 | 2014-09-11 | ザ ジェネラル ホスピタル コーポレイション | 光コヒーレンストモグラフィーにおいて偏波モード分散補償を提供するためのシステム、方法、装置およびコンピュータアクセス可能な媒体 |
| WO2013029047A1 (fr) | 2011-08-25 | 2013-02-28 | The General Hospital Corporation | Procédés, systèmes, configurations et support accessible par ordinateur permettant de mettre en œuvre des procédures de tomographie par cohérence micro-optique |
| WO2013033592A1 (fr) | 2011-08-31 | 2013-03-07 | Volcano Corporation | Joint rotatif électro-optique et procédés d'utilisation |
| JP2015502562A (ja) | 2011-10-18 | 2015-01-22 | ザ ジェネラル ホスピタル コーポレイション | 再循環光学遅延を生成および/または提供するための装置および方法 |
| US9629528B2 (en) | 2012-03-30 | 2017-04-25 | The General Hospital Corporation | Imaging system, method and distal attachment for multidirectional field of view endoscopy |
| WO2013151560A1 (fr) * | 2012-04-06 | 2013-10-10 | Authentix, Inc. | Détermination de l'angle d'inclinaison |
| US10575737B2 (en) | 2012-04-27 | 2020-03-03 | Novadaq Technologies ULC | Optical coherent imaging medical device |
| JP2015517387A (ja) | 2012-05-21 | 2015-06-22 | ザ ジェネラル ホスピタル コーポレイション | カプセル顕微鏡検査のための装置、デバイスおよび方法 |
| WO2014009859A2 (fr) | 2012-07-10 | 2014-01-16 | Aïmago S.A. | Dispositif médical optique à modalités multiples pour l'évaluation de la perfusion |
| US9415550B2 (en) | 2012-08-22 | 2016-08-16 | The General Hospital Corporation | System, method, and computer-accessible medium for fabrication miniature endoscope using soft lithography |
| US10568586B2 (en) | 2012-10-05 | 2020-02-25 | Volcano Corporation | Systems for indicating parameters in an imaging data set and methods of use |
| US9292918B2 (en) | 2012-10-05 | 2016-03-22 | Volcano Corporation | Methods and systems for transforming luminal images |
| US9324141B2 (en) | 2012-10-05 | 2016-04-26 | Volcano Corporation | Removal of A-scan streaking artifact |
| US10070827B2 (en) | 2012-10-05 | 2018-09-11 | Volcano Corporation | Automatic image playback |
| US9307926B2 (en) | 2012-10-05 | 2016-04-12 | Volcano Corporation | Automatic stent detection |
| US9858668B2 (en) | 2012-10-05 | 2018-01-02 | Volcano Corporation | Guidewire artifact removal in images |
| US9286673B2 (en) | 2012-10-05 | 2016-03-15 | Volcano Corporation | Systems for correcting distortions in a medical image and methods of use thereof |
| US9367965B2 (en) | 2012-10-05 | 2016-06-14 | Volcano Corporation | Systems and methods for generating images of tissue |
| US11272845B2 (en) | 2012-10-05 | 2022-03-15 | Philips Image Guided Therapy Corporation | System and method for instant and automatic border detection |
| WO2014055880A2 (fr) | 2012-10-05 | 2014-04-10 | David Welford | Systèmes et procédés pour amplifier la lumière |
| US9840734B2 (en) | 2012-10-22 | 2017-12-12 | Raindance Technologies, Inc. | Methods for analyzing DNA |
| US9025159B2 (en) | 2012-12-10 | 2015-05-05 | The Johns Hopkins University | Real-time 3D and 4D fourier domain doppler optical coherence tomography system |
| WO2014093374A1 (fr) | 2012-12-13 | 2014-06-19 | Volcano Corporation | Dispositifs, systèmes et procédés de canulation ciblée |
| US11406498B2 (en) | 2012-12-20 | 2022-08-09 | Philips Image Guided Therapy Corporation | Implant delivery system and implants |
| US10939826B2 (en) | 2012-12-20 | 2021-03-09 | Philips Image Guided Therapy Corporation | Aspirating and removing biological material |
| US10942022B2 (en) | 2012-12-20 | 2021-03-09 | Philips Image Guided Therapy Corporation | Manual calibration of imaging system |
| JP2016506276A (ja) | 2012-12-20 | 2016-03-03 | ジェレミー スティガール, | 血管内画像の位置の特定 |
| WO2014099899A1 (fr) | 2012-12-20 | 2014-06-26 | Jeremy Stigall | Cathéters de transition sans heurt |
| WO2014107287A1 (fr) | 2012-12-20 | 2014-07-10 | Kemp Nathaniel J | Système de tomographie en cohérence optique reconfigurable entre différents modes d'imagerie |
| EP2936241B1 (fr) | 2012-12-21 | 2020-10-21 | Nathaniel J. Kemp | Mise en tampon optique efficace en énergie utilisant un commutateur optique actif à maintien de polarisation |
| US9486143B2 (en) | 2012-12-21 | 2016-11-08 | Volcano Corporation | Intravascular forward imaging device |
| US9612105B2 (en) | 2012-12-21 | 2017-04-04 | Volcano Corporation | Polarization sensitive optical coherence tomography system |
| US10166003B2 (en) | 2012-12-21 | 2019-01-01 | Volcano Corporation | Ultrasound imaging with variable line density |
| EP2934323A4 (fr) | 2012-12-21 | 2016-08-17 | Andrew Hancock | Système et procédé pour le traitement multivoie de signaux d'image |
| CA2896006A1 (fr) | 2012-12-21 | 2014-06-26 | David Welford | Systemes et procedes permettant de reduire une emission de longueur d'onde de lumiere |
| WO2014099763A1 (fr) | 2012-12-21 | 2014-06-26 | Jason Spencer | Système et procédé de traitement graphique de données médicales |
| US10058284B2 (en) | 2012-12-21 | 2018-08-28 | Volcano Corporation | Simultaneous imaging, monitoring, and therapy |
| WO2014100606A1 (fr) | 2012-12-21 | 2014-06-26 | Meyer, Douglas | Cathéter d'imagerie ultrasonore rotatif muni d'un télescope de corps de cathéter étendu |
| WO2014100530A1 (fr) | 2012-12-21 | 2014-06-26 | Whiseant Chester | Système et procédé pour l'orientation et le fonctionnement de cathéter |
| JP6053138B2 (ja) * | 2013-01-24 | 2016-12-27 | 株式会社日立エルジーデータストレージ | 光断層観察装置及び光断層観察方法 |
| EP2948758B1 (fr) | 2013-01-28 | 2024-03-13 | The General Hospital Corporation | Appareil pour fournir une spectroscopie diffuse co-enregistrée avec imagerie de domaine de fréquence optique |
| US10893806B2 (en) | 2013-01-29 | 2021-01-19 | The General Hospital Corporation | Apparatus, systems and methods for providing information regarding the aortic valve |
| WO2014121082A1 (fr) | 2013-02-01 | 2014-08-07 | The General Hospital Corporation | Agencement d'objectif pour endomicroscopie confocale |
| US10226597B2 (en) | 2013-03-07 | 2019-03-12 | Volcano Corporation | Guidewire with centering mechanism |
| CN113705586A (zh) | 2013-03-07 | 2021-11-26 | 飞利浦影像引导治疗公司 | 血管内图像中的多模态分割 |
| US11154313B2 (en) | 2013-03-12 | 2021-10-26 | The Volcano Corporation | Vibrating guidewire torquer and methods of use |
| US10638939B2 (en) | 2013-03-12 | 2020-05-05 | Philips Image Guided Therapy Corporation | Systems and methods for diagnosing coronary microvascular disease |
| US9301687B2 (en) | 2013-03-13 | 2016-04-05 | Volcano Corporation | System and method for OCT depth calibration |
| US10758207B2 (en) | 2013-03-13 | 2020-09-01 | Philips Image Guided Therapy Corporation | Systems and methods for producing an image from a rotational intravascular ultrasound device |
| US11026591B2 (en) | 2013-03-13 | 2021-06-08 | Philips Image Guided Therapy Corporation | Intravascular pressure sensor calibration |
| US10292677B2 (en) | 2013-03-14 | 2019-05-21 | Volcano Corporation | Endoluminal filter having enhanced echogenic properties |
| WO2014152365A2 (fr) | 2013-03-14 | 2014-09-25 | Volcano Corporation | Filtres ayant des caractéristiques échogènes |
| US10219887B2 (en) | 2013-03-14 | 2019-03-05 | Volcano Corporation | Filters with echogenic characteristics |
| EP2967491B1 (fr) | 2013-03-15 | 2022-05-11 | The General Hospital Corporation | Un système endoscopique transoesophageal pour déterminer une saturation veineuse mixte en oxygène d'une artère pulmonaire |
| EP2997354A4 (fr) | 2013-05-13 | 2017-01-18 | The General Hospital Corporation | Détection de la phase et de l'amplitude d'une fluorescence auto-interférente |
| US10117576B2 (en) | 2013-07-19 | 2018-11-06 | The General Hospital Corporation | System, method and computer accessible medium for determining eye motion by imaging retina and providing feedback for acquisition of signals from the retina |
| EP3021734B1 (fr) | 2013-07-19 | 2020-04-08 | The General Hospital Corporation | Appareil d'imagerie utilisant une endoscopie à champ de vision multidirectionnel |
| EP3025173B1 (fr) | 2013-07-26 | 2021-07-07 | The General Hospital Corporation | Appareil avec dispositif laser utilisant de la dispersion optique pour applications en tomographie en cohérence optique dans le domaine de fourier |
| US10307056B2 (en) | 2013-12-05 | 2019-06-04 | Bioptigen, Inc. | Systems and methods for quantitative doppler optical coherence tomography |
| US9733460B2 (en) | 2014-01-08 | 2017-08-15 | The General Hospital Corporation | Method and apparatus for microscopic imaging |
| US10736494B2 (en) | 2014-01-31 | 2020-08-11 | The General Hospital Corporation | System and method for facilitating manual and/or automatic volumetric imaging with real-time tension or force feedback using a tethered imaging device |
| WO2015153982A1 (fr) | 2014-04-04 | 2015-10-08 | The General Hospital Corporation | Appareil et procédé de commande de la propagation et/ou de la transmission d'un rayonnement électromagnétique dans un ou des guides d'ondes flexibles |
| WO2016003274A1 (fr) | 2014-07-01 | 2016-01-07 | Nederlandse Organisatie Voor Toegepast-Natuurwetenschappelijk Onderzoek Tno | Appareil de microscopie de tomographie par cohérence optique et procédé associé |
| US10912462B2 (en) | 2014-07-25 | 2021-02-09 | The General Hospital Corporation | Apparatus, devices and methods for in vivo imaging and diagnosis |
| EP2989986B1 (fr) * | 2014-09-01 | 2019-12-18 | Samsung Medison Co., Ltd. | Appareil de diagnostic par ultrasons et son procédé de fonctionnement |
| US9677941B2 (en) * | 2014-09-19 | 2017-06-13 | Shimadzu Corporation | Object movement control device and fourier transform infrared spectrophotometer |
| EP3291725A4 (fr) | 2015-05-07 | 2018-11-07 | Novadaq Technologies Inc. | Procédés et systèmes pour une imagerie laser à granularité de tissu à l'aide d'un capteur d'image couleur |
| US10627212B2 (en) * | 2016-04-25 | 2020-04-21 | Kabushiki Kaisha Topcon | Swept-source optical coherence tomography (SS-OCT) phase stabilization with reference signal calibration |
| EP3463056A4 (fr) * | 2016-05-23 | 2020-07-29 | ContinUse Biometrics Ltd. | Système et procédé destinés à être utilisés lors de la caractérisation en profondeur d'objets |
| JP6245590B1 (ja) * | 2016-06-20 | 2017-12-13 | 公立大学法人大阪市立大学 | 皮膚診断装置、皮膚状態出力方法、プログラムおよび記録媒体 |
| US10718915B2 (en) * | 2017-06-14 | 2020-07-21 | California Institute Of Technology | Compact and low cost beam launcher using planar lightwave circuit |
| US11771321B2 (en) * | 2017-10-13 | 2023-10-03 | The Research Foundation For Suny | System, method, and computer-accessible medium for subsurface capillary flow imaging by wavelength-division-multiplexing swept-source optical doppler tomography |
| WO2020230329A1 (fr) * | 2019-05-16 | 2020-11-19 | 日本電気株式会社 | Dispositif de tomographie par cohérence optique, procédé d'imagerie et programme d'imagerie stocké sur un support non transitoire lisible par ordinateur |
Family Cites Families (12)
| Publication number | Priority date | Publication date | Assignee | Title |
|---|---|---|---|---|
| US4063549A (en) * | 1975-12-22 | 1977-12-20 | Technicon Instruments Corporation | Ultrasonic method and apparatus for imaging and characterization of bodies |
| US5200819A (en) * | 1988-05-27 | 1993-04-06 | The University Of Connecticut | Multi-dimensional imaging system for endoscope |
| DD298677A5 (de) * | 1989-11-16 | 1992-03-05 | ��������`������������@�������@�������@M�������]k�� | Verfahren zur bestimmung des volumenflusses |
| SE466987B (sv) * | 1990-10-18 | 1992-05-11 | Stiftelsen Ct Foer Dentaltekni | Anordning foer djupselektiv icke-invasiv, lokal maetning av elektrisk impedans i organiska och biologiska material samt prob foer maetning av elektrisk impedans |
| EP0581871B2 (fr) * | 1991-04-29 | 2009-08-12 | Massachusetts Institute Of Technology | Appareil d'imagerie optique et de mesure |
| US5537162A (en) * | 1993-12-17 | 1996-07-16 | Carl Zeiss, Inc. | Method and apparatus for optical coherence tomographic fundus imaging without vignetting |
| DE4411017C2 (de) * | 1994-03-30 | 1995-06-08 | Alexander Dr Knuettel | Optische stationäre spektroskopische Bildgebung in stark streuenden Objekten durch spezielle Lichtfokussierung und Signal-Detektion von Licht unterschiedlicher Wellenlängen |
| US5493109A (en) * | 1994-08-18 | 1996-02-20 | Carl Zeiss, Inc. | Optical coherence tomography assisted ophthalmologic surgical microscope |
| US5491524A (en) * | 1994-10-05 | 1996-02-13 | Carl Zeiss, Inc. | Optical coherence tomography corneal mapping apparatus |
| US5501226A (en) * | 1994-10-19 | 1996-03-26 | Carl Zeiss, Inc. | Short coherence length, doppler velocimetry system |
| US5644642A (en) * | 1995-04-03 | 1997-07-01 | Carl Zeiss, Inc. | Gaze tracking using optical coherence tomography |
| AU5147600A (en) | 1999-05-19 | 2000-12-05 | Regents Of The University Of California, The | Optical detection of dental disease using polarized light |
-
1998
- 1998-06-02 WO PCT/US1998/011116 patent/WO1998055830A1/fr active Application Filing
- 1998-06-02 JP JP50265499A patent/JP4138027B2/ja not_active Expired - Lifetime
- 1998-06-02 EP EP98925087A patent/EP1007901B1/fr not_active Expired - Lifetime
- 1998-06-02 AU AU77114/98A patent/AU7711498A/en not_active Abandoned
- 1998-06-02 DE DE69840791T patent/DE69840791D1/de not_active Expired - Lifetime
- 1998-06-02 US US09/088,562 patent/US6006128A/en not_active Expired - Lifetime
-
1999
- 1999-12-21 US US09/468,674 patent/US6735463B2/en not_active Expired - Lifetime
Non-Patent Citations (1)
| Title |
|---|
| CHEN ET AL: "Optical Doppler tomographic imaging of fluid flow velocity in highly scattering media", OPTIC LETTERS, vol. 22, no. 1, 1 January 1997 (1997-01-01), pages 64 - 66, XP000679183 * |
Also Published As
| Publication number | Publication date |
|---|---|
| EP1007901A1 (fr) | 2000-06-14 |
| EP1007901A4 (fr) | 2001-08-29 |
| AU7711498A (en) | 1998-12-21 |
| DE69840791D1 (de) | 2009-06-10 |
| JP2002503134A (ja) | 2002-01-29 |
| US20030023153A1 (en) | 2003-01-30 |
| WO1998055830A1 (fr) | 1998-12-10 |
| US6735463B2 (en) | 2004-05-11 |
| US6006128A (en) | 1999-12-21 |
| JP4138027B2 (ja) | 2008-08-20 |
Similar Documents
| Publication | Publication Date | Title |
|---|---|---|
| EP1007901B1 (fr) | Imagerie doppler d'ecoulement par representation tomographique de coherence optique | |
| US6002480A (en) | Depth-resolved spectroscopic optical coherence tomography | |
| US5994690A (en) | Image enhancement in optical coherence tomography using deconvolution | |
| US6549801B1 (en) | Phase-resolved optical coherence tomography and optical doppler tomography for imaging fluid flow in tissue with fast scanning speed and high velocity sensitivity | |
| US5570182A (en) | Method for detection of dental caries and periodontal disease using optical imaging | |
| US7061622B2 (en) | Aspects of basic OCT engine technologies for high speed optical coherence tomography and light source and other improvements in optical coherence tomography | |
| JP4344829B2 (ja) | 偏光感受光画像計測装置 | |
| US20030227631A1 (en) | Phase-referenced doppler optical coherence tomography | |
| CN105559756A (zh) | 基于全空间调制谱分割角度复合的微血管造影方法与系统 | |
| US10485422B2 (en) | System and method for imaging subsurface of specimen | |
| CN103439295A (zh) | 全深度频域多普勒光学相干层析成像方法 | |
| US20100245836A1 (en) | Low-cost, compact, & automated diabetic retinopathy diagnostics & management device | |
| WO2016023502A1 (fr) | Tomographie par coherence optique a suppression des lobes secondaires a inversion de phase | |
| JP3076016B2 (ja) | 光計測装置 | |
| US10307056B2 (en) | Systems and methods for quantitative doppler optical coherence tomography | |
| US9964397B2 (en) | Multiple reference OCT system | |
| JP2010151684A (ja) | 局所的な複屈折情報を抽出可能な偏光感受光画像計測装置 | |
| JPH07146305A (ja) | 特に血液の流速を測定する方法と装置 | |
| CN209474591U (zh) | 一种基于近红外光吸收的手持式紧凑型水肿检测装置 | |
| Rollins et al. | Real-time color Doppler optical coherence tomography using an autocorrelation technique | |
| Leitgeb et al. | Complex and coherence noise free Fourier domain optical coherence tomography | |
| WO2002004925A1 (fr) | Procede et appareil permettant de determiner au moins une propriete d'un echantillon en tomographie a coherence optique | |
| CA2617001A1 (fr) | Technique d'estimation bidimensionnelle pour tomographie doppler a coherence optique | |
| Yang et al. | Principles of doppler oct | |
| Verrier et al. | Influence of interfaces reflectivity for central thickness measurement of a contact lens by low coherence interferometry |
Legal Events
| Date | Code | Title | Description |
|---|---|---|---|
| PUAI | Public reference made under article 153(3) epc to a published international application that has entered the european phase |
Free format text: ORIGINAL CODE: 0009012 |
|
| 17P | Request for examination filed |
Effective date: 19991230 |
|
| AK | Designated contracting states |
Kind code of ref document: A1 Designated state(s): DE FR GB |
|
| A4 | Supplementary search report drawn up and despatched |
Effective date: 20010712 |
|
| AK | Designated contracting states |
Kind code of ref document: A4 Designated state(s): DE FR GB |
|
| RIC1 | Information provided on ipc code assigned before grant |
Free format text: 7G 01B 9/02 A, 7G 01F 1/66 B, 7G 01F 1/712 B |
|
| 17Q | First examination report despatched |
Effective date: 20071011 |
|
| GRAP | Despatch of communication of intention to grant a patent |
Free format text: ORIGINAL CODE: EPIDOSNIGR1 |
|
| RIC1 | Information provided on ipc code assigned before grant |
Ipc: G01B 9/02 20060101AFI20081023BHEP |
|
| GRAS | Grant fee paid |
Free format text: ORIGINAL CODE: EPIDOSNIGR3 |
|
| GRAA | (expected) grant |
Free format text: ORIGINAL CODE: 0009210 |
|
| AK | Designated contracting states |
Kind code of ref document: B1 Designated state(s): DE FR GB |
|
| REG | Reference to a national code |
Ref country code: GB Ref legal event code: FG4D |
|
| REF | Corresponds to: |
Ref document number: 69840791 Country of ref document: DE Date of ref document: 20090610 Kind code of ref document: P |
|
| PLBE | No opposition filed within time limit |
Free format text: ORIGINAL CODE: 0009261 |
|
| STAA | Information on the status of an ep patent application or granted ep patent |
Free format text: STATUS: NO OPPOSITION FILED WITHIN TIME LIMIT |
|
| 26N | No opposition filed |
Effective date: 20100201 |
|
| REG | Reference to a national code |
Ref country code: FR Ref legal event code: PLFP Year of fee payment: 19 |
|
| REG | Reference to a national code |
Ref country code: FR Ref legal event code: PLFP Year of fee payment: 20 |
|
| PGFP | Annual fee paid to national office [announced via postgrant information from national office to epo] |
Ref country code: FR Payment date: 20170607 Year of fee payment: 20 Ref country code: GB Payment date: 20170601 Year of fee payment: 20 |
|
| PGFP | Annual fee paid to national office [announced via postgrant information from national office to epo] |
Ref country code: DE Payment date: 20170628 Year of fee payment: 20 |
|
| REG | Reference to a national code |
Ref country code: DE Ref legal event code: R071 Ref document number: 69840791 Country of ref document: DE |
|
| REG | Reference to a national code |
Ref country code: GB Ref legal event code: PE20 Expiry date: 20180601 |
|
| PG25 | Lapsed in a contracting state [announced via postgrant information from national office to epo] |
Ref country code: GB Free format text: LAPSE BECAUSE OF EXPIRATION OF PROTECTION Effective date: 20180601 |