EP0989397B1 - Procédé pour déterminer les caractéristiques des particules suspendues - Google Patents
Procédé pour déterminer les caractéristiques des particules suspendues Download PDFInfo
- Publication number
- EP0989397B1 EP0989397B1 EP99306646A EP99306646A EP0989397B1 EP 0989397 B1 EP0989397 B1 EP 0989397B1 EP 99306646 A EP99306646 A EP 99306646A EP 99306646 A EP99306646 A EP 99306646A EP 0989397 B1 EP0989397 B1 EP 0989397B1
- Authority
- EP
- European Patent Office
- Prior art keywords
- attenuation
- particle size
- waves
- size distribution
- spectrum
- Prior art date
- Legal status (The legal status is an assumption and is not a legal conclusion. Google has not performed a legal analysis and makes no representation as to the accuracy of the status listed.)
- Expired - Lifetime
Links
- 239000002245 particle Substances 0.000 title claims description 106
- 238000000034 method Methods 0.000 title claims description 67
- 230000008569 process Effects 0.000 title claims description 36
- 238000001228 spectrum Methods 0.000 claims description 69
- 238000009826 distribution Methods 0.000 claims description 53
- 239000006185 dispersion Substances 0.000 claims description 25
- 238000004422 calculation algorithm Methods 0.000 claims description 7
- 230000000704 physical effect Effects 0.000 claims description 5
- 238000005259 measurement Methods 0.000 description 22
- VYPSYNLAJGMNEJ-UHFFFAOYSA-N Silicium dioxide Chemical compound O=[Si]=O VYPSYNLAJGMNEJ-UHFFFAOYSA-N 0.000 description 14
- 239000007788 liquid Substances 0.000 description 12
- 239000002609 medium Substances 0.000 description 7
- 239000000203 mixture Substances 0.000 description 7
- 239000002002 slurry Substances 0.000 description 7
- 230000008859 change Effects 0.000 description 6
- 239000007787 solid Substances 0.000 description 6
- 238000009472 formulation Methods 0.000 description 5
- 230000005670 electromagnetic radiation Effects 0.000 description 4
- 239000007789 gas Substances 0.000 description 4
- 238000012986 modification Methods 0.000 description 4
- 230000004048 modification Effects 0.000 description 4
- 239000000377 silicon dioxide Substances 0.000 description 4
- 239000000725 suspension Substances 0.000 description 4
- XLYOFNOQVPJJNP-UHFFFAOYSA-N water Substances O XLYOFNOQVPJJNP-UHFFFAOYSA-N 0.000 description 4
- 229940008201 allegra Drugs 0.000 description 3
- 238000000205 computational method Methods 0.000 description 3
- 238000004519 manufacturing process Methods 0.000 description 3
- 230000003287 optical effect Effects 0.000 description 3
- 238000000053 physical method Methods 0.000 description 3
- 239000000243 solution Substances 0.000 description 3
- 239000000126 substance Substances 0.000 description 3
- GWEVSGVZZGPLCZ-UHFFFAOYSA-N Titan oxide Chemical compound O=[Ti]=O GWEVSGVZZGPLCZ-UHFFFAOYSA-N 0.000 description 2
- 230000010339 dilation Effects 0.000 description 2
- 230000000694 effects Effects 0.000 description 2
- 238000005516 engineering process Methods 0.000 description 2
- 238000011156 evaluation Methods 0.000 description 2
- RWTNPBWLLIMQHL-UHFFFAOYSA-N fexofenadine Chemical compound C1=CC(C(C)(C(O)=O)C)=CC=C1C(O)CCCN1CCC(C(O)(C=2C=CC=CC=2)C=2C=CC=CC=2)CC1 RWTNPBWLLIMQHL-UHFFFAOYSA-N 0.000 description 2
- 230000003993 interaction Effects 0.000 description 2
- 239000011159 matrix material Substances 0.000 description 2
- 230000007246 mechanism Effects 0.000 description 2
- 238000005498 polishing Methods 0.000 description 2
- 230000004044 response Effects 0.000 description 2
- 230000035945 sensitivity Effects 0.000 description 2
- 239000012798 spherical particle Substances 0.000 description 2
- 229910001220 stainless steel Inorganic materials 0.000 description 2
- 239000010935 stainless steel Substances 0.000 description 2
- 238000012360 testing method Methods 0.000 description 2
- NLXLAEXVIDQMFP-UHFFFAOYSA-N Ammonium chloride Substances [NH4+].[Cl-] NLXLAEXVIDQMFP-UHFFFAOYSA-N 0.000 description 1
- VHUUQVKOLVNVRT-UHFFFAOYSA-N Ammonium hydroxide Chemical compound [NH4+].[OH-] VHUUQVKOLVNVRT-UHFFFAOYSA-N 0.000 description 1
- 241000220010 Rhode Species 0.000 description 1
- 238000010521 absorption reaction Methods 0.000 description 1
- 238000000862 absorption spectrum Methods 0.000 description 1
- 238000009825 accumulation Methods 0.000 description 1
- PNEYBMLMFCGWSK-UHFFFAOYSA-N aluminium oxide Inorganic materials [O-2].[O-2].[O-2].[Al+3].[Al+3] PNEYBMLMFCGWSK-UHFFFAOYSA-N 0.000 description 1
- 235000011114 ammonium hydroxide Nutrition 0.000 description 1
- 239000012736 aqueous medium Substances 0.000 description 1
- 230000002238 attenuated effect Effects 0.000 description 1
- 230000015572 biosynthetic process Effects 0.000 description 1
- 238000004364 calculation method Methods 0.000 description 1
- 238000012512 characterization method Methods 0.000 description 1
- 230000000295 complement effect Effects 0.000 description 1
- 230000003750 conditioning effect Effects 0.000 description 1
- 230000001419 dependent effect Effects 0.000 description 1
- 238000009795 derivation Methods 0.000 description 1
- 239000000839 emulsion Substances 0.000 description 1
- 238000002474 experimental method Methods 0.000 description 1
- 239000010419 fine particle Substances 0.000 description 1
- 229910052736 halogen Inorganic materials 0.000 description 1
- 239000000543 intermediate Substances 0.000 description 1
- 239000000463 material Substances 0.000 description 1
- 239000012457 nonaqueous media Substances 0.000 description 1
- 238000012545 processing Methods 0.000 description 1
- 239000012925 reference material Substances 0.000 description 1
- 238000004513 sizing Methods 0.000 description 1
- 238000003980 solgel method Methods 0.000 description 1
- 230000003595 spectral effect Effects 0.000 description 1
Images

Classifications
-
- G—PHYSICS
- G01—MEASURING; TESTING
- G01N—INVESTIGATING OR ANALYSING MATERIALS BY DETERMINING THEIR CHEMICAL OR PHYSICAL PROPERTIES
- G01N29/00—Investigating or analysing materials by the use of ultrasonic, sonic or infrasonic waves; Visualisation of the interior of objects by transmitting ultrasonic or sonic waves through the object
- G01N29/36—Detecting the response signal, e.g. electronic circuits specially adapted therefor
- G01N29/42—Detecting the response signal, e.g. electronic circuits specially adapted therefor by frequency filtering or by tuning to resonant frequency
-
- G—PHYSICS
- G01—MEASURING; TESTING
- G01N—INVESTIGATING OR ANALYSING MATERIALS BY DETERMINING THEIR CHEMICAL OR PHYSICAL PROPERTIES
- G01N15/00—Investigating characteristics of particles; Investigating permeability, pore-volume or surface-area of porous materials
- G01N15/02—Investigating particle size or size distribution
- G01N15/0205—Investigating particle size or size distribution by optical means
-
- G—PHYSICS
- G01—MEASURING; TESTING
- G01N—INVESTIGATING OR ANALYSING MATERIALS BY DETERMINING THEIR CHEMICAL OR PHYSICAL PROPERTIES
- G01N29/00—Investigating or analysing materials by the use of ultrasonic, sonic or infrasonic waves; Visualisation of the interior of objects by transmitting ultrasonic or sonic waves through the object
- G01N29/04—Analysing solids
- G01N29/11—Analysing solids by measuring attenuation of acoustic waves
-
- G—PHYSICS
- G01—MEASURING; TESTING
- G01N—INVESTIGATING OR ANALYSING MATERIALS BY DETERMINING THEIR CHEMICAL OR PHYSICAL PROPERTIES
- G01N29/00—Investigating or analysing materials by the use of ultrasonic, sonic or infrasonic waves; Visualisation of the interior of objects by transmitting ultrasonic or sonic waves through the object
- G01N29/44—Processing the detected response signal, e.g. electronic circuits specially adapted therefor
- G01N29/46—Processing the detected response signal, e.g. electronic circuits specially adapted therefor by spectral analysis, e.g. Fourier analysis or wavelet analysis
-
- G—PHYSICS
- G01—MEASURING; TESTING
- G01N—INVESTIGATING OR ANALYSING MATERIALS BY DETERMINING THEIR CHEMICAL OR PHYSICAL PROPERTIES
- G01N15/00—Investigating characteristics of particles; Investigating permeability, pore-volume or surface-area of porous materials
- G01N15/06—Investigating concentration of particle suspensions
- G01N15/075—Investigating concentration of particle suspensions by optical means
-
- G—PHYSICS
- G01—MEASURING; TESTING
- G01N—INVESTIGATING OR ANALYSING MATERIALS BY DETERMINING THEIR CHEMICAL OR PHYSICAL PROPERTIES
- G01N2291/00—Indexing codes associated with group G01N29/00
- G01N2291/02—Indexing codes associated with the analysed material
- G01N2291/024—Mixtures
- G01N2291/02416—Solids in liquids
-
- G—PHYSICS
- G01—MEASURING; TESTING
- G01N—INVESTIGATING OR ANALYSING MATERIALS BY DETERMINING THEIR CHEMICAL OR PHYSICAL PROPERTIES
- G01N2291/00—Indexing codes associated with group G01N29/00
- G01N2291/02—Indexing codes associated with the analysed material
- G01N2291/028—Material parameters
- G01N2291/02809—Concentration of a compound, e.g. measured by a surface mass change
-
- G—PHYSICS
- G01—MEASURING; TESTING
- G01N—INVESTIGATING OR ANALYSING MATERIALS BY DETERMINING THEIR CHEMICAL OR PHYSICAL PROPERTIES
- G01N2291/00—Indexing codes associated with group G01N29/00
- G01N2291/04—Wave modes and trajectories
- G01N2291/042—Wave modes
- G01N2291/0421—Longitudinal waves
-
- G—PHYSICS
- G01—MEASURING; TESTING
- G01N—INVESTIGATING OR ANALYSING MATERIALS BY DETERMINING THEIR CHEMICAL OR PHYSICAL PROPERTIES
- G01N2291/00—Indexing codes associated with group G01N29/00
- G01N2291/26—Scanned objects
- G01N2291/269—Various geometry objects
- G01N2291/2693—Rotor or turbine parts
Definitions
- the invention relates to characterization of dispersed particles, e.g., determination of particle size distribution.
- CMP chemical-mechanical planarization
- sol-gel fabrication of silica bodies utilize dispersions of particles in a liquid medium.
- CMP and sol-gel processes see, respectively, P. Van Zant, Microchip Fabrication, 3rd Ed., McGraw-Hill, 300 (1997), and U.S. Patent No. 5,240,488.
- larger particles in CMP often lead to scratches and variations in the median particle size and the size distribution sometimes lead to inconsistent polishing.
- the properties of sol-gel derived bodies depend in large part on the characteristics of the particles in the dispersion. For these reasons, among others, various methods have been developed to determine the characteristics of particles in such dispersions.
- PSD particle size distribution
- U.S. Patents Nos. 4,706,509, 5,121,629, and 5,569,844 the '509, '629, and '844 patents, respectively.
- the '509 patent relates to a method for ultrasonically measuring solids concentration and particle size distribution in a dispersion. Ultrasonic waves at a variety of frequencies are directed into the dispersion, and the attenuation at the frequencies is measured. A dimensional spectrum (across the range of particle dimensions) is divided into dimensional intervals, and a system of linear equations is developed to represent the concentration of particles in each dimension interval. The system of equations is then solved to determine the PSD.
- the process of the '509 patent is limited to waves having a wavelength smaller than the largest particles.
- the process is therefore not useful for relatively fine particles, e.g., tens to hundreds of nanometers, since acoustic waves cannot presently be driven at the necessary frequencies.
- the process of the '844 patent involves measuring the attenuation of both ultrasonic waves and electromagnetic radiation to determine particle size distribution. Specifically, ultrasonic velocity and ultrasonic attenuation are combined with the density, as determined from the electromagnetic radiation attenuation, to calculate the PSD. In addition to the problems inherent in generating x-rays or gamma rays, however, particle sizes of about 10 to 15 ⁇ m appear to be the lower limit for the process.
- ultrasonic waves at a variety of selected wavelengths are passed through a dispersion, and the attenuation at each frequency is measured to derive a measured attenuation spectrum over those frequencies.
- a set of attenuation spectra are calculated for a variety of PSDs, and the calculated spectra are then compared to the measured spectrum to formulate a preliminary approximation of the PSD of the dispersion. Further calculations must be performed, starting from this approximation, to more accurately determine the PSD.
- the invention provides a process for determining the characteristics of particles dispersed in a medium as defined in claim 1.
- the term particles includes solids, liquids, or gases dispersed in a continuous medium.
- the invention involves directing waves (acoustic or light) into a dispersion, and measuring the attenuation of the waves for particular frequencies to provide an attenuation spectrum.
- waves includes, but is not limited to, continuous waves and pulsed measurements.
- the measured attenuation spectrum is then compared to a set of theory-based calculated attenuation spectra to determine the particle size distribution corresponding to the measured attenuation spectrum.
- the particle size distribution is capable of being accurately determined by a single inversion algorithm, thus eliminating burdensome steps such as those of the '629 patent, e.g. deriving a preliminary approximation of PSD, and going forward from the approximation through several inversion techniques.
- Inversion techniques in the present context, involve taking a set of known particle size distributions, determining the attenuation spectrum that each PSD would theoretically produce, and comparing a set of such theory-based spectra to the actual, measured spectrum to find the actual PSD.
- steps such as an initial approximation and a multi-step inversion technique, the invention produces more accurate, consistent, and reliable results.
- the '629 patent starts with a well-known model for acoustic attenuation, which was set forth in Epstein and Carhart, J. Acoust. Soc. Amer ., Vol. 25, 1953, 553, and revised by Allegra and Hawley, J. Acoust. Soc. Amer. , Vol. 51, 1972, 1545. From this model (referred to herein as the Allegra-Hawley model), a set of attenuation spectra are calculated for a set of known particle size distributions.
- the '629 patent takes an initial guess of the PSD based on an initial comparison of the calculated spectra and measured spectrum (see Col. 15, lines 30-39).
- the quadratic discriminator (the first of three inversion techniques) then attempts to refine this initial guess by computing a limited number of attenuation spectra similar to the initial guess.
- the '629 patent uses the Powell discriminator, which selects a specific functional form with a limited number of parameters, in an effort to speed the process of finding a match to the measured attenuation spectrum.
- this inversion technique may generate an inaccurate response when the selected functional form is not flexible enough to describe the shape of the true PSD.
- the impulse discriminator inversion technique is used, this third technique using linear equations to determine a PSD with effectively no spread in particle size.
- the applicability of this third technique is limited. Specifically, because the impulse discriminator appears to be tailored toward specific systems, it has the potential to generate inaccurate responses when a variety of systems are tested. Moreover, the process of the '629 patent is tailored to acoustics, and would not be useful for light attenuation.
- the invention overcomes these drawbacks of the '629 patent by application of a faster, more straightforward inversion technique.
- the invention uses a single inversion algorithm that requires no prior knowledge (or guess) of the particle size distribution.
- the single inversion algorithm is independent of the physical measurements being made relating to particle characteristics, i.e., the inversion technique is applicable to any model for predicting attenuation based on PSD, such as an acoustic attenuation model or a turbidity, i.e,, light attenuation, model.
- an improved Allegra-Hawley model is used to calculate the set of theory-based acoustic attenuation spectra.
- the single inversion algorithm involves parameterizing a particle size distribution, i.e., mathematically describing an abstract form such as a PSD based on a selected number of parameters.
- the parameters are then varied to obtain a "best" agreement between a measured spectrum and theoretical spectra, this best agreement providing the PSD.
- the best agreement is defined by minimization of an error function that is selected to not only incorporate the differences between measurement and theory, but to also weight each measured data point according to the confidence in that data. Unlike the '629 patent, no initial guess of the PSD is needed.
- the invention therefore provides an improved process for determining the characteristics, particularly particle size distribution, of a particle dispersion, including a dispersion containing nanometer-size particles.
- Fig. 1 schematically illustrates an apparatus useful in the invention.
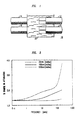
- Fig. 2 illustrates the improvements made in the Allegra-Hawley model, according to the invention.
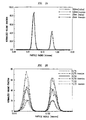
- Figs. 3A and 3B show particle size distributions generated according to the invention from simulated acoustic attenuation spectra.
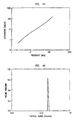
- Figs. 4A and 4B show, respectively, measured acoustic attenuation data and a particle size distribution generated from the data by the process of the invention.
- Figs. 5A-5C show, respectively, measured acoustic attenuation data, a particle size distribution generated from the data by a previous method, and a particle size distribution generated from the data by the process of the invention.
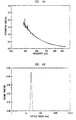
- Figs. 6A and 6B show, respectively, raw turbidity data and a particle size distribution generated from the data by the process of the invention.
- the above-referenced models by Epstein and Carhart, and by Allegra and Hawley make it possible to predict the attenuation spectrum for particles of a given size distribution and concentration.
- the models require knowledge of several physical properties of the particles and the liquid medium, including density, thermal expansion coefficient, thermal conductivity, heat capacity, viscosity, and shear rigidity. It is then possible to construct a 3-D matrix that relates attenuation, frequency, and particle size.
- FIG. 1 A schematic of the chamber 10 of such an apparatus is shown in Fig. 1.
- Two pairs of broadband transducers 12, 14, 16, 18, are in contact with a sample located in a tank 20, typically formed of stainless steel.
- the transducers are designed to transmit a wave as close to a plane wave as possible.
- the chamber 10 typically contains a temperature sensor, heater, and a propeller (none of which are shown). It is possible to remove the sample by use of a drain valve at the base of the tank 20.
- one pair of transducers 12, 14 covers a lower frequency range, e.g., 1 to 20 MHz, and the other pair 16, 18 a higher range, e.g., 15 to 200 MHz.
- the transmitting transducers 12, 16 are capable of being moved to different positions in the chamber, but the receiving transducers 14, 18 are fixed.
- the spacing between the transmitting transducers 12, 16 and the receiving transducers 14, 18 is controlled by a stepper motor.
- the transmitting transducers 12, 16 direct a series of planar sound waves, generally at preselected frequencies, across the sample and the receiving transducers detect the attenuated waves.
- Computer and signal processing equipment is used to control the process of attaining the attenuation spectrum, monitor the detected sound waves, and manipulate the signals generated therefrom.
- the UltrasizerTM provides both raw attenuation data as well as predicted particle size distributions.
- Other apparatus that measure attenuation, such as discussed in references cited in the Background section, are equally useful in the invention.
- Other commercially-available apparatus capable of being used in the invention include the CMP Slurry Monitor, made by Colloidal Dynamics, Inc. of Warwick, Rhode Island, and the AcoustoPhor device, made by PenKem. It is also possible to use devices that utilize Fourier transform techniques to measure attenuation spectra.
- the apparatus is capable of being placed in-line in a production process, such that real-time measurements are provided.
- Optical attenuation measures the loss of intensity of light as it travels a fixed distance through a suspension.
- a turbidity spectrum is obtained by measuring attenuation at several wavelengths (frequencies) of light.
- the Mie theory describes the basic interaction between light and a dispersion of spherical particles. (See G. Mie, Ann. Physik , Vol. 25, 377 (1908). See also M. Kerker, The Scattering of Light and other Electromagnetic Radiation, Academic Press (1969).)
- the loss of intensity is directly related to the difference in refractive indices of the particle and the liquid medium, as well as to the particle size distribution.
- the attenuation mechanisms for light and sound differ greatly, making independent measurements by these techniques complementary.
- a basic device includes a broadband light source, a sample cell, a UV-Vis monochromator and a photodetector.
- Light from the broadband source is collimated and directed through the sample cell.
- the light passing directly through the sample cell arrives at the monochromator, which directs a finite width of frequencies to the photodetector.
- the monochromator By adjusting the monochromator, the light transmitted by the sample can be measured as a function of frequency.
- the log of the ratio of this spectrum to a standard reference is the UV-Vis attenuation or absorption spectra.
- a variety of dispersions are capable of being measured according to the invention.
- solid-in-liquid dispersions such as silica, alumina, titania, or other oxides
- emulsions i.e., liquid particles in a continuous liquid medium
- the particle concentrations and particle diameters for which the invention will be functional are capable of varying widely, as long as a useful attenuation spectrum is obtained. Typical concentrations of particles that provide useful results range from 0.1 to 60 vol.%, more typically about 1 to 60 vol.%, and typical particle diameters range from about 1 nm to about 1000 ⁇ m, more typically about 10 nm to about 10 ⁇ m.
- the invention involves directing waves (acoustic or light) into a dispersion, and measuring the attenuation of the waves for each particular frequency to provide an attenuation spectrum.
- the measured attenuation spectrum is then compared to a set of theory-based calculated attenuation spectra to determine the particle size distribution corresponding to the measured attenuation spectrum.
- the comparison is performed by a single inversion algorithm which requires no prior knowledge (or guess) of the particle size distribution, and which is independent of the nature of the physical measurements being made, e.g., acoustic or turbidity.
- the algorithm involves parameterizing a particle size distribution, and then varying the parameters to obtain a "best" agreement between measurement and theory, as defined by minimization of an error function that is selected to incorporate the differences between measurement and theory, and also weight each measured data point according to the confidence in that data.
- minimization of this error function with respect to variations in PSD is capable of being performed through a conjugate gradient minimization procedure. The details of the process are as follows.
- parameterizing involves mathematically describing an abstract form, such as a PSD, based on a selected number of parameters.
- the particle size distribution is initially viewed as a completely general form, ⁇ ( x ), which represents particles of varying size x . No assumptions or guesses as to the form of the PSD are made.
- E The error function, E, numerically describes the agreement between the theoretical and experimental spectra.
- E ⁇ df W ( f )[ P ( f ) -O ( f )] 2
- f represents frequency
- W ( f ) is a weighting function
- P ( f ) is the predicted spectrum
- O ( f ) is the observed experimental spectrum.
- This form is similar to a standard least-squares formulation where the square ensures non-negativity. Defining E as an integral over continuous functions rather than referring directly to the discrete frequencies of the experimental spectrum ensures that E's value remains independent of the details of the experiment (i.e. the number and location of the discrete frequency measurements).
- W ( f ) The inclusion of the weighting function, W ( f ), accounts for frequency dependent experimental uncertainty. For example, higher frequency data tends to include more experimental uncertainty (e.g., noise) than low frequency data. In such a case, giving the low frequency data more weight would emphasize the importance of differences in the low frequency data. Given a suitable standard, it is also possible to include instrumental variations within this weighting factor. Although the optimal W ( f ) depends upon experimental conditions and the exact nature of the measurements, a nearly optimal form is obtained by weighting the data based upon the variation of the experimental data over several repeated measurements, where ⁇ j represents such statistical variations, with j indicating particles in the dispersion.
- the predicted spectrum, P ( f ), is given by a linear combination of the attenuation from each particle within the distribution.
- P ( f ) ⁇ dR A ( f ,R ) ⁇ ( R )
- this predicted spectrum is an approximation (owing to nonlinearities induced by multiple scattering phenomena), it provides desirable results in the invention. (The fact that this spectrum is an approximation, however, does not constitute an initial guess of PSD.)
- the function A ( f,R ) describes, in its entirety, the physical attenuation model. The function represents the attenuation at frequency f for a single particle of size R . By changing the form of this function, we can use this inversion method for both optical and acoustic attenuation.
- Equation 4 representing higher powers of ⁇ ( R ), without further changes to the invention.
- the particle size distribution is viewed as a completely general form, ⁇ ( R ) , unlike previous methods.
- the invention avoids such an approximation in favor of a direct discretization of the above equations (discretization is the representation of a continuous function through the values of that function at discrete points). Therefore, ⁇ ( R ) is represented as its magnitude at discrete values ⁇ j , and thus the representation of ⁇ ( R ) becomes increasingly complete as the number of discrete particle sizes treated increases.
- the computational treatment of this problem requires the discretization of the error function.
- the discretization is also desirably logarithmic.
- the integrals (Eqns. 2 & 4) become summations, where i represents frequency and j represents particle sizes. Owing to the exponential ranges of frequencies and particle sizes, the terms of these summations may vary over several orders of magnitude. This means the accurate computation of E (and P i ) requires careful attention to round-off accumulation in the summations.
- the representation of the theoretical model is contained within the matrix A ij , which is optionally pre-computed for particular physical models, e.g. the acoustic attenuation of silica in water.
- This pre-computation allows the time-consuming portion of the process (i.e. model evaluation) to be performed independent of the measurement and inversion process. Since the experimental measurement defines the discrete frequencies of interest, the A ij used for a given inversion is often obtained through interpolation of a dense, pre-computed A ij .
- the minimization begins with an unbiased starting distribution where all c j are zero. To speed convergence from this starting point, several sub-minimizations are performed.
- the sub-minimizations correspond to coarse discretizations of the ⁇ ( R ). For example, it is possible for the first sub-minimization to divide the range of possible particle sizes into 50 discrete values. Upon reaching a suitable minimal error for this sub-minimization (defined when the gradient of the error is below a chosen tolerance), the number of discrete values is increased (e.g. to 100 particle sizes).
- the information from a previous sub-minimization is used as an initial starting point for subsequent minimizations. This process continues until the final discretization level is achieved.
- the invention employs a conjugate gradient minimization using exact line searches.
- the search directions are accurately computed using the gradient of Equation 5.
- the line search is quickly processed using the gradient of Equation 7. It is possible that scaling of the gradient, or other pre-conditioning, will increase the speed of the minimization.
- the inversion technique of the invention is independent of the physical measurements being made to characterize the particles.
- the first model is that initially developed by Epstein and Carhart, referenced above, relating to acoustic attenuation of water droplets in fog, and then further developed by Allegra and Hawley in the context of solid spherical particles in continuous liquid media.
- Allegra-Hawley referred to as improved Allegra-Hawley.
- thermodynamics provides exact relationships between the physical properties of a material system.
- Thermodynamic consistency refers to methods which maintain these exact relationships.
- thermodynamic consistency is manifested as stability with respect to minor changes in input physical properties.
- Allegra-Hawley formulation researchers have found the computed attenuation spectrum to be very sensitive to small changes in the input quantities. By re-deriving the equations using quantities that remain thermodynamically consistent, our computational method does not show these sensitivities to such input properties.
- One important example of obtaining thermodynamic consistency concerns the relationship between the specific heat ratio, the isothermal compressibility, and the speed of sound.
- the specific heat ratio, ⁇ is determined by the speed of sound q , the coefficient of thermal expansion ⁇ , the temperature T, and the specific heat at constant pressure C p .
- ⁇ 1 + q 2 ⁇ 2 T C p
- the isothermal compressibility, ⁇ is determined by the speed of sound, the specific heat ratio, and the density ⁇ .
- ⁇ ⁇ q 2 ⁇
- the improved Allegra-Hawley is also based on the following:
- Figure 2 displays the effect (in percentage change in attenuation) of removing this approximation from the computed attenuation spectra for three particle sizes (radii of 25 nm, 165 nm, and 500 nm). The effect is larger for larger particles at higher frequencies. Because the change in attenuation varies with frequency, this error would lead to improper inversions.
- the second model useful in the invention relates to turbidity, which is the attenuation of light, and was initially presented by G. Mie, Ann. Physik , Vol. 25, 377 (1908). See also M. Kerker, The Scattering of Light and other Electromagnetic Radiation, Academic Press (1969). This model is capable of being successfully used in the invention without any modifications.
- the inversion technique and the model were first tested in the absence of experimental error using a set of simulated attenuation spectra.
- the inversion process when applied to the simulated spectra, generates a particle size distribution which may be directly compared with the assumed distributions.
- Fig. 3A shows the assumed and computed distributions for both the 25 nm radius and the 500 nm radius tests. The invention was able to reproduce both the median radius and width of the assumed distributions accurately over a broad particle size range.
- Fig. 3B shows a set of particle size distributions obtained by inverting simulated spectra for three different mixtures of 25 nm radius and 165 nm radius particles (again superimposed on the assumed distributions).
- the ratios in the Figure refer to the volume percentages of 25 nm radius and 165 nm radius particles, respectively, in each mixture.
- the two populations of particle sizes were distinguished clearly by the invention, and the relative proportions and widths of the distributions were reproduced with reasonable accuracy.
- acoustic attenuation spectrum was measured for a 1 vol% suspension of silica particles (MP4030, Nissan Chemical Corp., Tokyo) using an UltrasizerTM (Malvern Instruments Ltd., Worcestershire, U.K.).
- the tested Nissan particles are often used as a reference material for sizing instruments, having a nominal diameter of 300 nm and a relatively narrow size distribution.
- the sample was stirred at 150 rpm with a stainless steel propeller, and the temperature was 25°C.
- the automatic optimal strategy feature of the UltrasizerTM was used to determine the most effective frequency range and transducer spacings for the attenuation measurements.
- Fig. 4A shows the measured attenuation spectrum.
- the resulting particle size distribution determined by the inversion technique of the invention is shown in Fig. 4B.
- the particle radius ( ⁇ 0.165 ⁇ m) was accurate, and the spread of the distribution was narrow, as expected.
- Klebosol 30N50 and Klebosol 30N25 are 30 wt% silica slurries in ammonia solution, with nominal particle diameters of 50 nm and 25 nm respectively.
- the 30N50 and 30N25 slurries were each diluted to 5 vol% in water and measured separately in an UltrasizerTM, under the experimental conditions described in Example 2.
- Fig. 5A The acoustic attenuation spectra from the UltrasizerTM for the two samples are plotted in Fig. 5A. The reproducibility of these spectra was high, with a variance of less than 5% over 60 measurements on each sample.
- the 50 nm sample showed a first mode with mean diameter 41 nm containing 95% of the particle population, with a second mode of mean diameter 540 nm.
- Fig. 5C shows the particle size distributions determined by the invention for the measured attenuation spectra (Fig. 4A).
- the main size mode occurred in the vicinity of the nominal particle radius. Narrow peaks with small populations were also apparent for both slurries at larger particle sizes.
- Turbidity measurements were made using an Ocean Optics S2000 spectrometer (Ocean Optics Inc., Dunedin, FL) and a tungsten-halogen light source. The dark current of the photodetector was measured and subtracted from all experimental measurements. The attenuation spectrum of water was used as a reference spectrum for the attenuation measurements of the suspensions.
- Fig. 6A is an example of a measured turbidity spectrum for 50 nm diameter silica particles at 1 vol% (Klebosol 30N50, Solution Technology Inc., Monroe, NC). The smooth curve is the theoretical fit to the experimental data. Strong absorption (e.g., in the UV region for silica particles) limits the usable wavelength range in dense suspensions.
Landscapes
- Physics & Mathematics (AREA)
- Chemical & Material Sciences (AREA)
- Immunology (AREA)
- Pathology (AREA)
- Analytical Chemistry (AREA)
- Biochemistry (AREA)
- General Health & Medical Sciences (AREA)
- General Physics & Mathematics (AREA)
- Health & Medical Sciences (AREA)
- Life Sciences & Earth Sciences (AREA)
- Engineering & Computer Science (AREA)
- Signal Processing (AREA)
- Mathematical Physics (AREA)
- Spectroscopy & Molecular Physics (AREA)
- Acoustics & Sound (AREA)
- Dispersion Chemistry (AREA)
- Investigating Or Analyzing Materials By The Use Of Ultrasonic Waves (AREA)
- Devices And Processes Conducted In The Presence Of Fluids And Solid Particles (AREA)
Claims (11)
- Procédé pour déterminer les caractéristiques de particules dispersées dans un fluide, comprenant les étapes consistant à :caractérisé en ce que la répartition de grosseurs de particule est déterminée par une technique d'inversion à l'aide d'une seule étape de comparaison du spectre d'atténuation mesuré avec un jeu de spectres d'atténuation calculés sur base de la théorie, et dans lequel la technique d'inversion est réalisée en l'absence d'utilisation d'une approximation préliminaire de la répartition de grosseurs de particule.diriger des ondes acoustiques ou lumineuses dans une dispersion ;mesurer l'atténuation des ondes pour des fréquences particulières, afin d'établir un spectre d'atténuation ;réaliser une technique d'inversion, pour déterminer la répartition de grosseurs de particule correspondant au spectre d'atténuation mesuré, la technique d'inversion comprenant l'étape consistant à comparer le spectre d'atténuation mesuré avec un jeu de spectres d'atténuation calculés sur base de la théorie,
- Procédé selon la revendication 1, dans lequel l'étape de comparaison et la détermination de la répartition de grosseurs de particule sont effectuées par un seul algorithme d'inversion.
- Procédé selon la revendication 1, dans lequel les ondes sont des ondes lumineuses.
- Procédé selon la revendication 3, dans lequel les ondes sont des ondes acoustiques et les spectres d'atténuation sur base de la théorie sont calculés à partir d'un modèle de Allegra-Hawley amélioré.
- Procédé selon la revendication 3, dans lequel les ondes sont des ondes lumineuses et les spectres d'atténuation sur base de la théorie sont calculés à partir du modèle mie.
- Procédé selon la revendication 1, dans lequel les particules varient, en diamètre, d'environ 1 nm à environ 1000 µm.
- Procédé selon la revendication 6, dans lequel les particules varient, en diamètre, d'environ 10 nm à environ 10 µm.
- Procédé selon la revendication 1, dans lequel les particules sont présentes en une quantité allant de 0,1 à 60 % en volume.
- Procédé selon la revendication 1, dans lequel l'étape de comparaison comprend :calculer une fonction d'erreur sur base de la comparaison entre le spectre d'atténuation mesuré et les spectres d'atténuation calculés ; etminimiser la fonction d'erreur.
- Procédé selon la revendication 9, dans lequel la minimisation est effectuée par minimisation des directions conjuguées.
- Procédé selon la revendication 9, dans lequel au moins une partie de la fonction d'erreur calculée est précalculée avant de diriger les ondes dans la dispersion, sur base des propriétés physiques de la dispersion.
Applications Claiming Priority (2)
| Application Number | Priority Date | Filing Date | Title |
|---|---|---|---|
| US143435 | 1998-08-31 | ||
| US09/143,435 US6119510A (en) | 1998-08-31 | 1998-08-31 | Process for determining characteristics of suspended particles |
Publications (2)
| Publication Number | Publication Date |
|---|---|
| EP0989397A1 EP0989397A1 (fr) | 2000-03-29 |
| EP0989397B1 true EP0989397B1 (fr) | 2003-01-02 |
Family
ID=22504067
Family Applications (1)
| Application Number | Title | Priority Date | Filing Date |
|---|---|---|---|
| EP99306646A Expired - Lifetime EP0989397B1 (fr) | 1998-08-31 | 1999-08-23 | Procédé pour déterminer les caractéristiques des particules suspendues |
Country Status (4)
| Country | Link |
|---|---|
| US (1) | US6119510A (fr) |
| EP (1) | EP0989397B1 (fr) |
| JP (1) | JP2000074815A (fr) |
| DE (1) | DE69904680T2 (fr) |
Cited By (1)
| Publication number | Priority date | Publication date | Assignee | Title |
|---|---|---|---|---|
| CN1914499B (zh) * | 2003-12-10 | 2011-01-19 | 荷兰应用科学研究会(Tno) | 用于获得关于液体中肉眼可见的颗粒大小分布的信息的方法和装置 |
Families Citing this family (43)
| Publication number | Priority date | Publication date | Assignee | Title |
|---|---|---|---|---|
| US6246474B1 (en) * | 1998-04-29 | 2001-06-12 | Particle Measuring Systems, Inc. | Method and apparatus for measurement of particle size distribution in substantially opaque slurries |
| US6481268B1 (en) * | 1999-10-12 | 2002-11-19 | Baker Hughes, Inc. | Particle measurement by acoustic speckle |
| US6487894B1 (en) * | 2000-08-17 | 2002-12-03 | Dispersion Technology, Inc. | Method for determining particle size distribution and mechanical properties of soft particles in liquids |
| US20040119793A1 (en) * | 2000-09-25 | 2004-06-24 | Mutz Mitchell W. | Acoustic assessment of fluids in a plurality of reservoirs |
| US7900505B2 (en) * | 2000-09-25 | 2011-03-08 | Labcyte Inc. | Acoustic assessment of fluids in a plurality of reservoirs |
| US6910367B1 (en) * | 2000-10-23 | 2005-06-28 | Dispersion Technology, Inc. | Method for determining particle size distribution and structural properties of concentrated dispersions |
| EP1352228A2 (fr) * | 2000-12-18 | 2003-10-15 | E.I. du Pont de Nemours and Company | Procede et appareil destines a la determination granulometrique de particules en suspension par voie ultrasonore |
| US7257518B2 (en) * | 2001-02-28 | 2007-08-14 | Felix Alba Consultants, Inc. | Fundamental method and its hardware implementation for the generic prediction and analysis of multiple scattering of waves in particulate composites |
| US6604408B2 (en) | 2001-03-02 | 2003-08-12 | Matec Instrument Companies, Inc. | Device for use in determining characteristics of particles dispersed in a medium, and method therefor |
| US6744245B2 (en) * | 2001-07-27 | 2004-06-01 | Coulter International Corp. | Particle count correction method and apparatus |
| US7400400B2 (en) * | 2001-08-29 | 2008-07-15 | Merck & Co. Inc. | Method for monitoring particle size |
| US20030101819A1 (en) * | 2001-12-04 | 2003-06-05 | Mutz Mitchell W. | Acoustic assessment of fluids in a plurality of reservoirs |
| US7454958B2 (en) * | 2001-12-04 | 2008-11-25 | Labcyte Inc. | Acoustic determination of properties of reservoirs and of fluids contained therein |
| US7717544B2 (en) * | 2004-10-01 | 2010-05-18 | Labcyte Inc. | Method for acoustically ejecting a droplet of fluid from a reservoir by an acoustic fluid ejection apparatus |
| US7354141B2 (en) | 2001-12-04 | 2008-04-08 | Labcyte Inc. | Acoustic assessment of characteristics of a fluid relevant to acoustic ejection |
| NL1020714C2 (nl) * | 2002-05-30 | 2003-12-02 | Tno | Ultrasone karakterisatie van hoge concentratie deeltjes. |
| US7140239B2 (en) * | 2003-03-18 | 2006-11-28 | Battelle Memorial Institute | System and technique for ultrasonic characterization of settling suspensions |
| JP4184844B2 (ja) * | 2003-03-20 | 2008-11-19 | シスメックス株式会社 | 懸濁液の評価方法および装置 |
| US7066008B2 (en) * | 2004-05-19 | 2006-06-27 | Zaklad Aparatury Pomiarowet Kwant Sp Z.O.O. | Method for measuring concentration of solid or liquid particulate matter in a gaseous carrier medium |
| US7353709B2 (en) * | 2005-07-06 | 2008-04-08 | National Research Council Of Canada | Method and system for determining material properties using ultrasonic attenuation |
| WO2007003058A1 (fr) * | 2005-07-06 | 2007-01-11 | National Research Council Of Canada | Procede et systeme de determination de proprietes de materiaux a l'aide de l'attenuation ultrasonore |
| JP2009210584A (ja) * | 2008-03-03 | 2009-09-17 | Agilent Technol Inc | 工程内で小粒子の粒径分布を計算する方法及びシステム |
| US7719682B2 (en) * | 2008-03-03 | 2010-05-18 | Agilent Technologies, Inc. | Methods and systems for computing a particle size distribution of small particles in a process |
| DE102008014300A1 (de) | 2008-03-06 | 2009-09-10 | Technische Universität Dresden | Verfahren und Vorrichtung zur Bestimmung der Eigenschaften von Stoffgemischen |
| US7753636B2 (en) * | 2008-03-25 | 2010-07-13 | Hennig Emmett D | Adjustable bale mover spikes |
| JP5212224B2 (ja) * | 2009-03-31 | 2013-06-19 | トヨタ自動車株式会社 | 粒径分布モデル作成方法、当該粒径分布モデル作成方法を用いた燃料電池触媒の劣化予測方法、及び当該燃料電池触媒の劣化予測方法を用いた燃料電池の制御方法 |
| US8154723B2 (en) * | 2009-04-03 | 2012-04-10 | Sharp Laboratories Of America, Inc. | Method and systems for particle characterization using optical sensor output signal fluctuation |
| US8942928B2 (en) | 2009-05-11 | 2015-01-27 | The University Of Western Ontario | Ultrasonic method of monitoring particle size distribution of a medium |
| EP2499478A4 (fr) | 2009-11-13 | 2017-12-06 | Stable Solutions Llc | Profils de distribution de dimensions de particules et leur utilisation pour ajuster une caractéristique de dispersion |
| EP2877831A4 (fr) | 2012-06-29 | 2016-03-16 | Hydrovision Asia Pte Ltd | Dispositif amélioré de mesure de sédiment en suspension |
| CN103529643B (zh) * | 2012-07-05 | 2017-01-18 | 中国科学院物理研究所 | 一种纳米图形化系统及其光响应特性检测装置 |
| CN102879309B (zh) * | 2012-09-22 | 2014-09-10 | 华南理工大学 | 基于宽频带线性调频超声的气体颗粒浓度测量方法与装置 |
| US10073023B2 (en) * | 2014-06-25 | 2018-09-11 | Plexar Associates, Inc. | Light extinction tomography for measurement of ice crystals and other small particles |
| CN104263718B (zh) | 2014-09-26 | 2017-11-24 | 广东体必康生物科技有限公司 | 一种超声波微生物分散方法及装置 |
| KR20160061492A (ko) * | 2014-11-21 | 2016-06-01 | 삼성디스플레이 주식회사 | 휴대용 먼지 센서 및 이를 이용한 휴대전화 |
| CN105738257B (zh) * | 2014-12-12 | 2019-06-18 | 通用电气公司 | 测量方法及系统 |
| US10379024B2 (en) * | 2015-03-18 | 2019-08-13 | University Corporation For Atmospheric Research | Poisson ensemble inversion |
| DE102016005371A1 (de) * | 2016-05-04 | 2017-11-09 | Eisenmann Se | Vorrichtung und Verfahren zur Messung von mindestens einem Parameter einer Behandlungsflüssigkeit in einer Oberflächenbehandlungsanlage |
| RU2691662C2 (ru) * | 2017-06-19 | 2019-06-17 | Федеральное государственное казенное военное образовательное учреждение высшего образования "Военный учебно-научный центр Военно-воздушных сил "Военно-воздушная академия имени профессора Н.Е. Жуковского и Ю.А. Гагарина" (г. Воронеж) Министерства обороны Российской Федерации | Устройство для измерения концентрации механических примесей в средах |
| CN109856021B (zh) * | 2018-12-24 | 2021-10-12 | 天津珞雍空间信息研究院有限公司 | 一种pm2.5反演方法及监测区域分割方法 |
| WO2023225638A1 (fr) * | 2022-05-20 | 2023-11-23 | Texas Tech University System | Caractérisation intérieure de domaines liés à une interface opaques à l'aide d'une spectroscopie d'ondes de surface |
| DE102023113321A1 (de) | 2023-05-22 | 2024-11-28 | Kurz Elektronik Gmbh | Vorrichtung zur Erfassung und Auswertung von Partikel |
| CN119354898B (zh) * | 2024-12-24 | 2025-03-18 | 成都理工大学 | 一种基于多源数据融合的水体质量监测方法及系统 |
Family Cites Families (4)
| Publication number | Priority date | Publication date | Assignee | Title |
|---|---|---|---|---|
| US3779070A (en) * | 1971-11-23 | 1973-12-18 | Autometrics Co | Particle size and percent solids monitor |
| DE3438798C2 (de) * | 1984-10-23 | 1987-01-02 | Löffler, Friedrich, Prof. Dr.-Ing., 7500 Karlsruhe | Verfahren und Vorrichtung zum Messen der Feststoffkonzentration und der Korngrößenverteilung in einer Suspension mittels Ultraschall |
| US5121629A (en) * | 1989-11-13 | 1992-06-16 | E. I. Du Pont De Nemours And Company | Method and apparatus for determining particle size distribution and concentration in a suspension using ultrasonics |
| WO1994004907A1 (fr) * | 1992-08-17 | 1994-03-03 | Commonwealth Scientific And Industrial Research Organisation | Procede et appareil pour determiner la repartition granulometrique, la teneur en matieres solides et la concentration en solute d'une suspension de matieres solides dans une solution contenant un solute |
-
1998
- 1998-08-31 US US09/143,435 patent/US6119510A/en not_active Expired - Fee Related
-
1999
- 1999-08-23 EP EP99306646A patent/EP0989397B1/fr not_active Expired - Lifetime
- 1999-08-23 DE DE69904680T patent/DE69904680T2/de not_active Expired - Fee Related
- 1999-08-30 JP JP11242751A patent/JP2000074815A/ja active Pending
Cited By (1)
| Publication number | Priority date | Publication date | Assignee | Title |
|---|---|---|---|---|
| CN1914499B (zh) * | 2003-12-10 | 2011-01-19 | 荷兰应用科学研究会(Tno) | 用于获得关于液体中肉眼可见的颗粒大小分布的信息的方法和装置 |
Also Published As
| Publication number | Publication date |
|---|---|
| DE69904680D1 (de) | 2003-02-06 |
| US6119510A (en) | 2000-09-19 |
| JP2000074815A (ja) | 2000-03-14 |
| DE69904680T2 (de) | 2003-11-13 |
| EP0989397A1 (fr) | 2000-03-29 |
Similar Documents
| Publication | Publication Date | Title |
|---|---|---|
| EP0989397B1 (fr) | Procédé pour déterminer les caractéristiques des particules suspendues | |
| EP0605409B1 (fr) | Procede et appareil pour determiner la repartition granulometrique et la concentration dans une suspension en utilisant des ultrasons | |
| Babick | Dynamic light scattering (DLS) | |
| US7268873B2 (en) | Method for characterising particles in suspension from frequency domain photon migration measurements | |
| Povey | Ultrasound particle sizing: A review | |
| Kaplan et al. | Diffuse-transmission spectroscopy: a structural probe of opaque colloidal mixtures | |
| US7331233B2 (en) | Method and apparatus for ultrasonic sizing of particles in suspensions | |
| US7301630B2 (en) | Light scattering analysis and measurement | |
| JPS62500612A (ja) | 固体濃度・粒度分布の超音波測定方法 | |
| US6100976A (en) | Method and apparatus for fiber optic multiple scattering suppression | |
| Lehner et al. | Static light scattering on dense colloidal systems: new instrumentation and experimental results | |
| CA2352839A1 (fr) | Appareil et methode d'evaluation des proprietes physiques d'un echantillon utilisant les ultrasons | |
| US6930777B1 (en) | Method for characterizing particles in suspension from frequency domain photon migration measurements | |
| Bremer et al. | Fiber optic dynamic light scattering, neither homodyne nor heterodyne | |
| US6525823B1 (en) | Optical system for characterizing particles in a colloidal suspension using interferometry | |
| Babick et al. | Information content of acoustic attenuation spectra | |
| JP3905737B2 (ja) | 干渉システム | |
| US6587206B1 (en) | Method for characterizing particles in a liquid medium using interferometry | |
| JP2000002644A (ja) | レーザ回折・散乱式粒度分布測定装置 | |
| Coghill et al. | On‐Line Particle Size Analysis Using Ultrasonic Velocity Spectrometry | |
| US6559950B1 (en) | Method for monitoring a characteristic of a mixture comprising particles suspended in a liquid | |
| Parker et al. | Ultrasonic Sensor for the characterization of colloidal slurries | |
| Niederdränk | Correlations of backscattered ultrasound from scattering suspensions in turbulent flow | |
| Dierks et al. | Miniaturized optical microprobe for sizing in multiple-scattering systems | |
| Semleit et al. | Detection of deposited particles from the backside of a glass plate |
Legal Events
| Date | Code | Title | Description |
|---|---|---|---|
| PUAI | Public reference made under article 153(3) epc to a published international application that has entered the european phase |
Free format text: ORIGINAL CODE: 0009012 |
|
| 17P | Request for examination filed |
Effective date: 19990902 |
|
| AK | Designated contracting states |
Kind code of ref document: A1 Designated state(s): DE FR GB |
|
| AX | Request for extension of the european patent |
Free format text: AL;LT;LV;MK;RO;SI |
|
| 17Q | First examination report despatched |
Effective date: 20000915 |
|
| AKX | Designation fees paid |
Free format text: DE FR GB |
|
| TPAD | Observations filed by third parties |
Free format text: ORIGINAL CODE: EPIDOS TIPA |
|
| TPAD | Observations filed by third parties |
Free format text: ORIGINAL CODE: EPIDOS TIPA |
|
| GRAG | Despatch of communication of intention to grant |
Free format text: ORIGINAL CODE: EPIDOS AGRA |
|
| GRAG | Despatch of communication of intention to grant |
Free format text: ORIGINAL CODE: EPIDOS AGRA |
|
| GRAH | Despatch of communication of intention to grant a patent |
Free format text: ORIGINAL CODE: EPIDOS IGRA |
|
| GRAH | Despatch of communication of intention to grant a patent |
Free format text: ORIGINAL CODE: EPIDOS IGRA |
|
| GRAA | (expected) grant |
Free format text: ORIGINAL CODE: 0009210 |
|
| AK | Designated contracting states |
Kind code of ref document: B1 Designated state(s): DE FR GB |
|
| REG | Reference to a national code |
Ref country code: GB Ref legal event code: FG4D Free format text: 20030102 |
|
| REF | Corresponds to: |
Ref document number: 69904680 Country of ref document: DE Date of ref document: 20030206 Kind code of ref document: P |
|
| ET | Fr: translation filed | ||
| PG25 | Lapsed in a contracting state [announced via postgrant information from national office to epo] |
Ref country code: GB Free format text: LAPSE BECAUSE OF NON-PAYMENT OF DUE FEES Effective date: 20030823 |
|
| PLBE | No opposition filed within time limit |
Free format text: ORIGINAL CODE: 0009261 |
|
| STAA | Information on the status of an ep patent application or granted ep patent |
Free format text: STATUS: NO OPPOSITION FILED WITHIN TIME LIMIT |
|
| 26N | No opposition filed |
Effective date: 20031003 |
|
| PG25 | Lapsed in a contracting state [announced via postgrant information from national office to epo] |
Ref country code: DE Free format text: LAPSE BECAUSE OF NON-PAYMENT OF DUE FEES Effective date: 20040302 |
|
| GBPC | Gb: european patent ceased through non-payment of renewal fee | ||
| PG25 | Lapsed in a contracting state [announced via postgrant information from national office to epo] |
Ref country code: FR Free format text: LAPSE BECAUSE OF NON-PAYMENT OF DUE FEES Effective date: 20040430 |
|
| REG | Reference to a national code |
Ref country code: FR Ref legal event code: ST |